Attached files
| file | filename |
|---|---|
| 8-K - 8-K - VEREIT, Inc. | v380489_8k.htm |
American Realty Capital Properties REITWeek 2014 June 2014
2 Information set forth herein (including information included or incorporated by reference herein) contains “forward - looking statements” (as defined in Section 21 E of the Securities Exchange Act of 1934 , as amended), which reflect American Realty Capital Properties, Inc . ’s (“ARCP”) expectations regarding future events . The forward - looking statements involve a number of risks, uncertainties and other factors that could cause actual results to differ materially from those contained in the forward - looking statements . Generally, the words “expects,” “anticipates,” “targets,” “goals,” “projects,” “intends,” “plans,” “believes,” “seeks,” “estimates,” variations of such words and similar expressions identify forward - looking statements and any statements regarding the benefits of our recently closed merger with Cole Real Estate Investments, Inc . (“Cole”), our announced sale of our multi - tenant business, our future financial condition, our announced acquisition of the Red Lobster portfolio, results of operations and business are also forward - looking statements . These forward - looking statements are subject to a number of risks, uncertainties and assumptions, most of which are difficult to predict and many of which are beyond our control . The following additional factors, among others, could cause actual results to differ from those set forth in the forward - looking statements : market volatility ; unexpected costs or unexpected liabilities that may arise from the recently closed Cole acquisition ; ARCP’s inability to integrate recently acquired businesses and realize the benefits thereof ; the inability to retain key personnel ; continuation or deterioration of current market conditions ; whether or not ARCP common stock will be included in certain REIT and public exchange indices ; the inability to realize the benefits and savings of self - management ; uncertainty regarding the level of demand for ARCP common stock that inclusion in such indices would generate ; unexpected liabilities incurred in connection with recently closed acquisitions, including that of Cole ; the inability to consummate the announced disposition of our multi - tenant business and the announced acquisition of the Red Lobster portfolio and the inability to consummate such transactions at the same time as to realize the benefits thereof ; the business plans of the tenants of ARCP ; and the inability to meet our expected capital raise and acquisition targets at Cole Capital . Additional factors that may affect future results are contained in ARCP's filings with the U . S . Securities and Exchange Commission (“SEC”), which are available at the SEC's website at www . sec . gov . The forward - looking statements contained herein reflect our beliefs, assumptions and expectations of our future performance, taking into account all information currently available to us . These beliefs, assumptions and expectations are subject to risks and uncertainties and can change as a result of many possible events or factors, not all of which are known to us . If a change occurs, our business, financial condition, liquidity and results of operations may vary materially from those expressed in our forward - looking statements . We disclaim any obligation to publicly update or revise any forward - looking statements to reflect changes in underlying assumptions or factors, new information, future events or other changes, except as required by law . Forward - Looking Statements
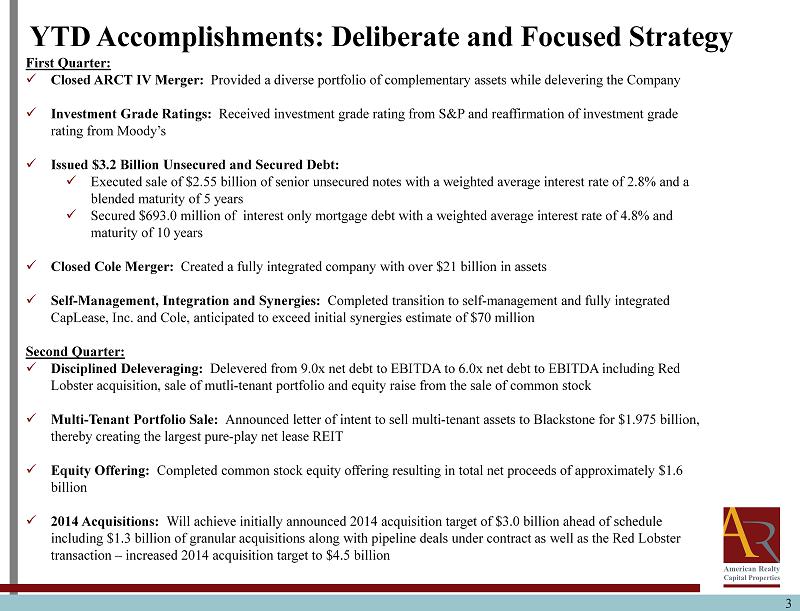
3 YTD Accomplishments: Deliberate and Focused Strategy First Quarter: x Closed ARCT IV Merger: Provided a diverse portfolio of complementary assets while delevering the Company x Investment Grade Ratings: Received investment grade rating from S&P and reaffirmation of investment grade rating from Moody’s x Issued $3.2 Billion Unsecured and Secured Debt: x Executed sale of $2.55 billion of senior unsecured notes with a weighted average interest rate of 2.8% and a blended maturity of 5 years x Secured $693.0 million of interest only mortgage debt with a weighted average interest rate of 4.8% and maturity of 10 years x Closed Cole Merger: Created a fully integrated company with over $21 billion in assets x Self - Management, Integration and Synergies: Completed transition to self - management and fully integrated CapLease , Inc. and Cole, anticipated to exceed initial synergies estimate of $70 million Second Quarter: x Disciplined Deleveraging: Delevered from 9.0x net debt to EBITDA to 6.0x net debt to EBITDA including Red Lobster acquisition, sale of mutli - tenant portfolio and equity raise from the sale of common stock x Multi - Tenant Portfolio Sale : Announced letter of intent to sell multi - tenant assets to Blackstone for $1.975 billion, thereby creating the largest pure - play net lease REIT x Equity Offering: Completed common stock equity offering resulting in total net proceeds of approximately $1.6 billion x 2014 Acquisitions: Will achieve initially announced 2014 acquisition target of $3.0 billion ahead of schedule including $1.3 billion of granular acquisitions along with pipeline deals under contract as well as the Red Lobster transaction – increased 2014 acquisition target to $4.5 billion
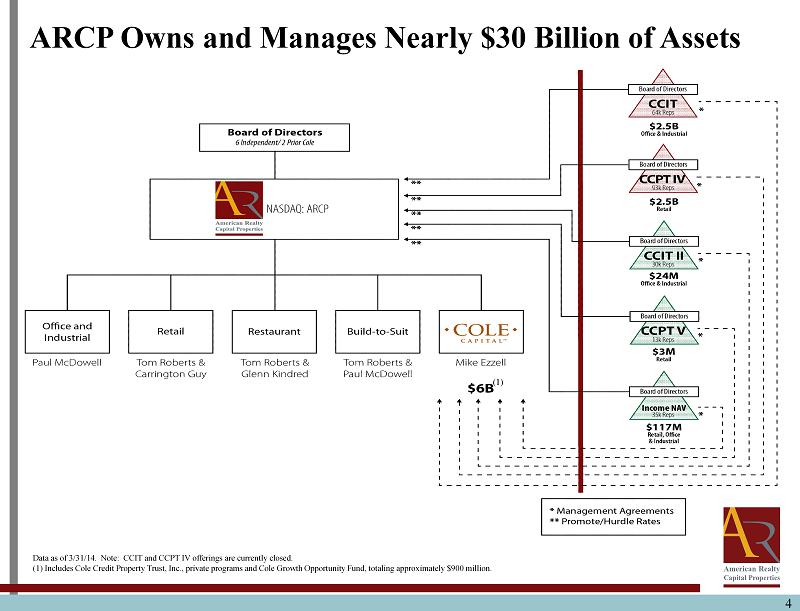
4 ARCP: O for Success ARCP O wns and Manages Nearly $30 Billion of Assets Data as of 3/31/14. Note: CCIT and CCPT IV offerings are currently closed. (1) Includes Cole Credit Property Trust, Inc., private programs and Cole Growth Opportunity Fund, totaling approximately $900 mi llion. (1)
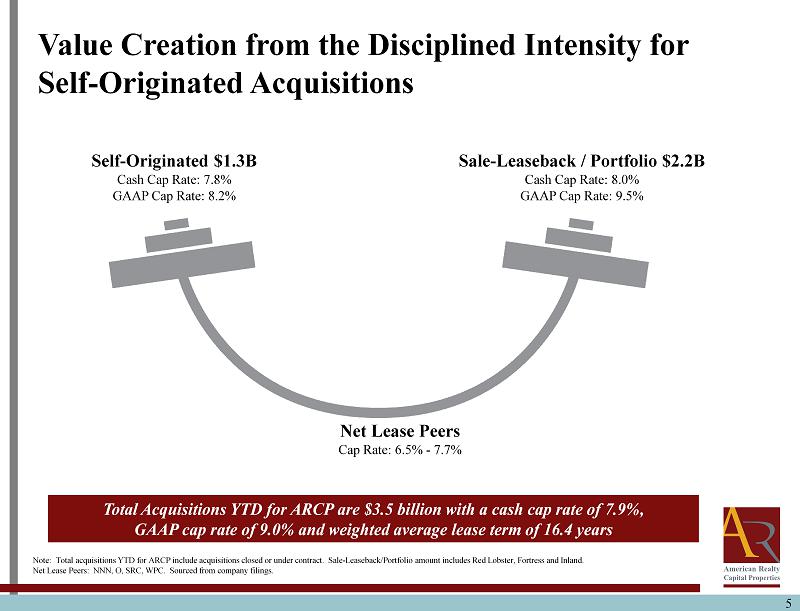
5 Value Creation from the Disciplined Intensity for Self - Originated Acquisitions CCIT II CCPT V Cole DNAV # of Selling Agreements 80 60 46 # of Reps 30,245 12,620 34,626 Total Acquisitions YTD for ARCP are $3.5 billion with a cash cap rate of 7.9%, GAAP cap rate of 9.0% and weighted average lease term of 16.4 years Note: Total acquisitions YTD for ARCP include acquisitions closed or under contract. Sale - Leaseback/Portfolio amount includes Red Lobster, Fortress and Inland. Net Lease Peers: NNN, O, SRC, WPC. Sourced from company filings. Self - Originated $1.3B Cash Cap Rate: 7.8% GAAP Cap Rate: 8.2% Sale - Leaseback / Portfolio $2.2B Cash Cap Rate: 8.0% GAAP Cap Rate: 9.5% Net Lease Peers Cap Rate: 6.5% - 7.7%
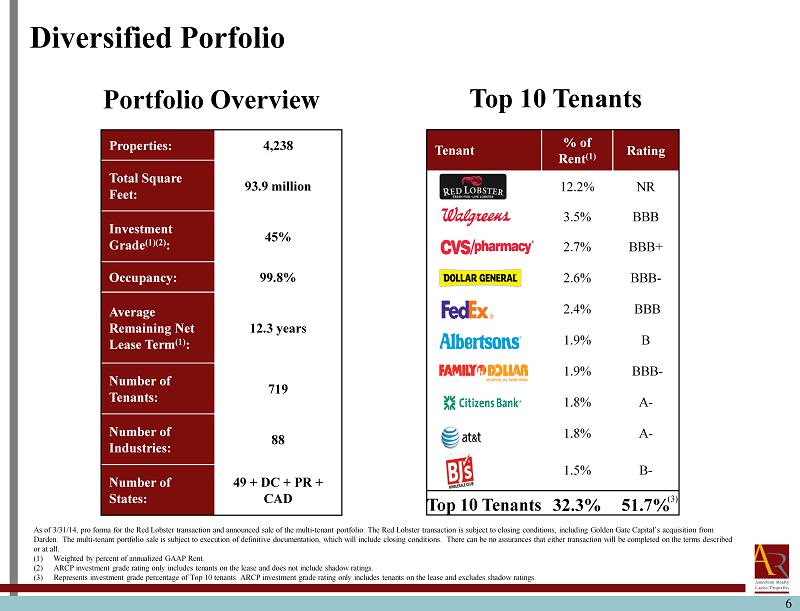
6 Diversified Porfolio Tenant % of Rent (1) Rating 12.2% NR 3.5% BBB 2.7% BBB+ 2.6% BBB - 2.4% BBB 1.9% B 1.9% BBB - 1.8% A - 1.8% A - 1.5% B - Top 10 Tenants 32.3% 51.7% As of 3/31/14, p ro forma for the Red Lobster transaction and announced sale of the multi - tenant p ortfolio. The Red Lobster transaction is subject to closing conditions, including Golden Gate Capital’s acquisition from Darden. The multi - tenant p ortfolio sale is subject to execution of definitive documentation, which will include closing conditions. There can be no as sur ances that either transaction will be completed on the terms described or at all. (1) Weighted by percent of annualized GAAP Rent . (2) ARCP investment grade rating only includes tenants on the lease and does not include shadow ratings. (3) Represents investment grade percentage of Top 10 tenants . ARCP investment grade rating only includes tenants on the lease and excludes shadow ratings. (3) Top 10 Tenants Properties: 4,238 Total Square Feet: 93.9 million Investment Grade (1)(2) : 45% Occupancy : 99.8% Average Remaining Net Lease Term (1) : 12.3 years Number of Tenants: 719 Number of Industries: 88 Number of States: 49 + DC + PR + CAD Portfolio Overview
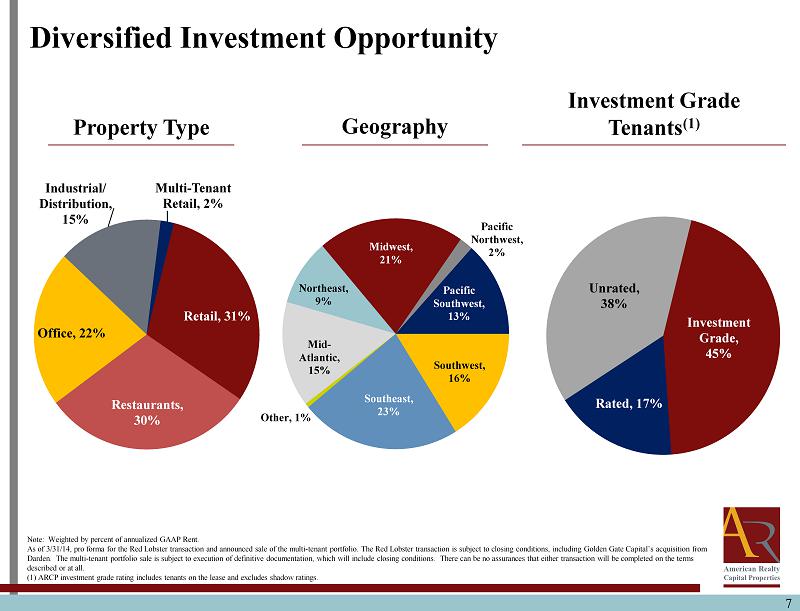
7 Diversified Investment Opportunity Note: Weighted by percent of annualized GAAP Rent. As of 3/31/14, pro forma for the Red Lobster transaction and announced sale of the multi - tenant portfolio. The Red Lobster trans action is subject to closing conditions, including Golden Gate Capital’s acquisition from Darden. The multi - tenant portfolio sale is subject to execution of definitive documentation, which will include closing conditi ons. There can be no assurances that either transaction will be completed on the terms described or at all. (1) ARCP investment grade rating includes tenants on the lease and excludes shadow ratings. Retail, 31% Restaurants, 30% Office, 22% Industrial/ Distribution, 15% Multi - Tenant Retail, 2% Pacific Northwest, 2% Pacific Southwest, 13% Southwest, 16% Southeast, 23% Other, 1% Mid - Atlantic, 15% Northeast, 9% Midwest, 21% Investment Grade, 45% Rated, 17% Unrated, 38% Investment Grade Tenants (1) Geography Property Type
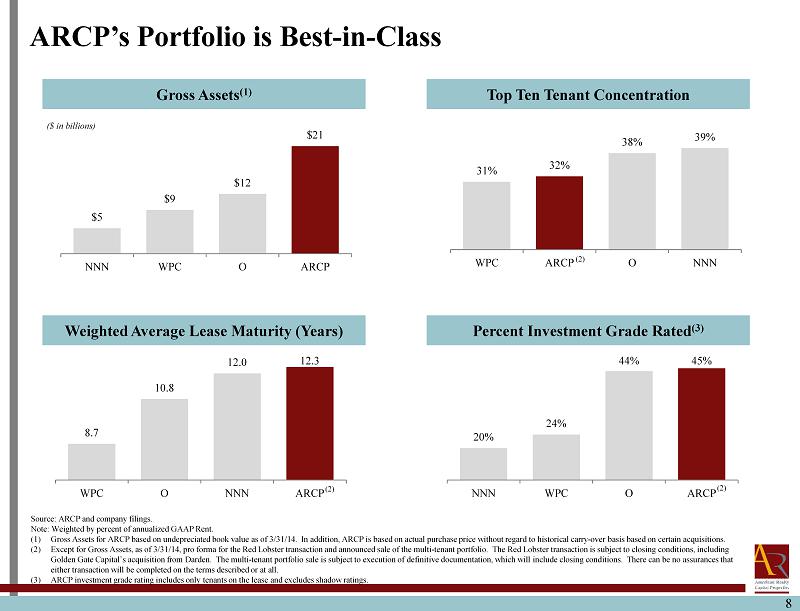
8 8.7 10.8 12.0 12.3 WPC O NNN ARCP 31% 32% 38% 39% WPC ARCP O NNN 20% 24% 44% 45% NNN WPC O ARCP ARCP’s Portfolio is Best - in - Class Gross Assets (1) Weighted Average Lease Maturity (Years) Top Ten Tenant Concentration Percent Investment Grade Rated (3) ($ in billions) Source: ARCP and company filings. Note : Weighted by percent of annualized GAAP Rent. (1) Gross Assets for ARCP based on undepreciated book value as of 3/31/14. In addition, ARCP is based on actual purchase price without regard to historical carry - over basis based on certain acquisitions. (2) Except for Gross Assets, as of 3/31/14, pro forma for the Red Lobster transaction and announced sale of the multi - tenant portfol io. The Red Lobster transaction is subject to closing conditions, including Golden Gate Capital’s acquisition from Darden. The multi - tenant portfolio sale is subject to execution of definitive documentat ion, which will include closing conditions. There can be no assurances that either transaction will be completed on the terms described or at all. (3) ARCP investment grade rating includes only tenants on the lease and excludes shadow ratings. $5 $9 $12 $21 NNN WPC O ARCP (2) (2) (2)
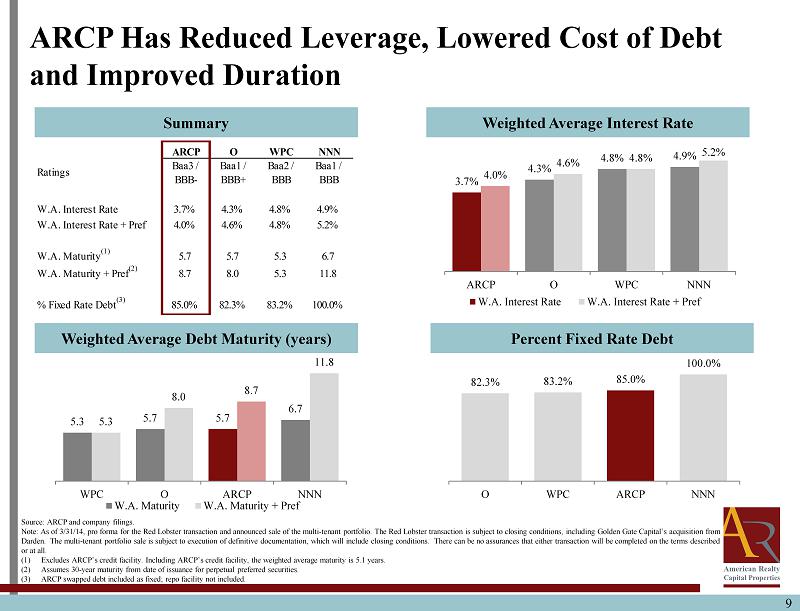
9 ARCP Has Reduced Leverage, Lowered Cost of Debt and Improved Duration Summary Weighted Average Debt Maturity (years) Weighted Average Interest Rate Percent Fixed Rate Debt 3.7% 4.3% 4.8% 4.9% 4.0% 4.6% 4.8% 5.2% ARCP O WPC NNN W.A. Interest Rate W.A. Interest Rate + Pref 82.3% 83.2% 85.0% 100.0% O WPC ARCP NNN 5.3 5.7 5.7 6.7 5.3 8.0 8.7 11.8 WPC O ARCP NNN W.A. Maturity W.A. Maturity + Pref Source: ARCP and company filings. Note: As of 3/31/14, pro forma for the Red Lobster transaction and announced sale of the multi - tenant portfolio. The Red Lobster trans action is subject to closing conditions, including Golden Gate Capital’s acquisition from Darden. The multi - tenant portfolio sale is subject to execution of definitive documentation, which will include closing conditi ons. There can be no assurances that either transaction will be completed on the terms described or at all. (1) Excludes ARCP’s credit facility. Including ARCP’s credit facility, the weighted average maturity is 5.1 years. (2) Assumes 30 - year maturity from date of issuance for perpetual preferred securities. (3) ARCP swapped debt included as fixed; repo facility not included. ARCP O WPC NNN Ratings Baa3 / BBB- Baa1 / BBB+ Baa2 / BBB Baa1 / BBB W.A. Interest Rate 3.7% 4.3% 4.8% 4.9% W.A. Interest Rate + Pref 4.0% 4.6% 4.8% 5.2% W.A. Maturity (1) 5.7 5.7 5.3 6.7 W.A. Maturity + Pref (2) 8.7 8.0 5.3 11.8 % Fixed Rate Debt (3) 85.0% 82.3% 83.2% 100.0%
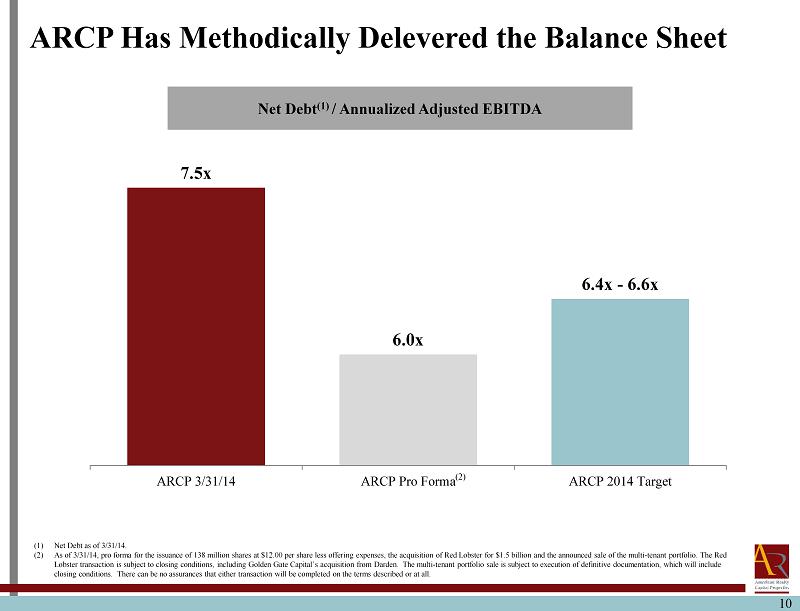
10 ARCP Has Methodically Delevered the Balance Sheet Net Debt (1) / Annualized Adjusted EBITDA Unencumbered Assets / Unsecured Debt 7.5x 6.0x 6.4x - 6.6x ARCP 3/31/14 ARCP Pro Forma ARCP 2014 Target 1.67x 1.80x 1.80x ARCP Current ARCP Pro Forma ARCP Pro Forma, Post Spin (1) Net Debt as of 3/31/14. (2) As of 3/31/14, pro forma for the issuance of 138 million shares at $12.00 per share less offering expenses, the acquisition o f R ed Lobster for $1.5 billion and the announced sale of the multi - tenant portfolio. The Red Lobster transaction is subject to closing conditions, including Golden Gate Capital’s acquisition from Darden. The multi - tenant portfolio sale is subject to execution of definitive documentation, which will include closing conditions. There can be no assurances that either transaction will be completed on the terms described or at all . (2)
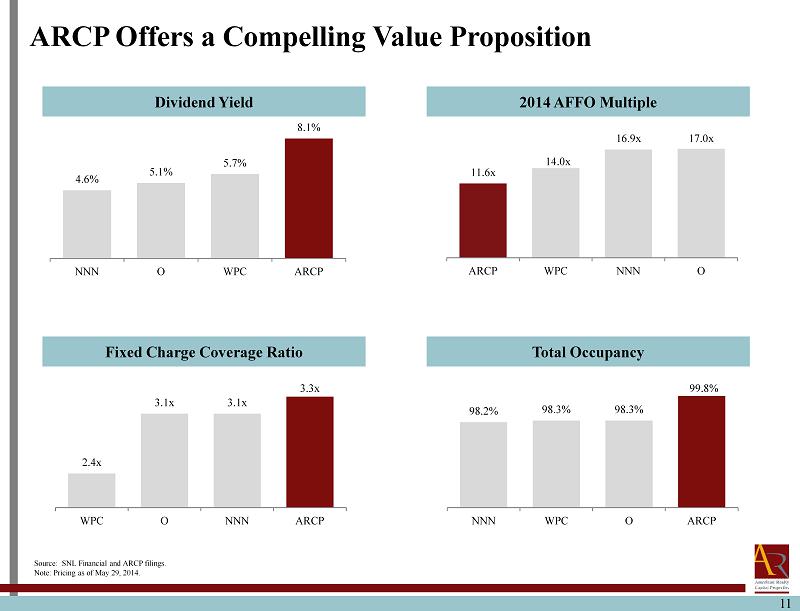
11 2.4x 3.1x 3.1x 3.3x WPC O NNN ARCP 11.6x 14.0x 16.9x 17.0x ARCP WPC NNN O 98.2% 98.3% 98.3% 99.8% NNN WPC O ARCP ARCP Offers a Compelling Value Proposition Dividend Yield Fixed Charge Coverage Ratio 2014 AFFO Multiple Total Occupancy Source: SNL Financial and ARCP filings. Note: Pricing as of May 29, 2014 . 4.6% 5.1% 5.7% 8.1% NNN O WPC ARCP (2) (2) (2)

12 Cole Capital Fundraising CCIT II CCPT V Cole DNAV # of Selling Agreements 80 60 46 # of Reps 30,245 12,620 34,626 Note: For purposes of this analysis, 2014 amounts do not include funds raised pursuant to each non - traded REIT’s Distribution R einvestment Plan (“DRIP”). NTR capital raising is cyclical, significantly affected by a program start and close date CCIT Office and Industrial REIT closed to new subscriptions received after 9/30/13 CCPT IV Retail and Distribution REIT closed to new subscriptions received after 2/25/14 2014 Projected 2014 Projected $96 $115 $125 $185 $205 $189 $519 $523 $659 $482 $316 $288 $316 $554 $29 $38 $35 $75 $140 $225 $325 $400 $475 $500 $0 $100 $200 $300 $400 $500 $600 $700 January February March April May June July August September October November December Capital Raise ($ in millions) 2013 2014
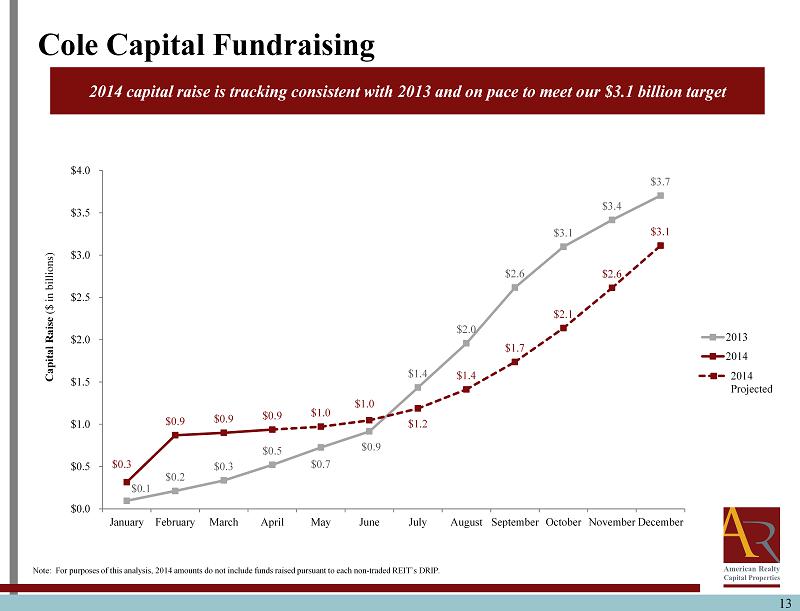
13 $ $ $ $ $ $ $ $ $ $ $ $ $ $ $ $ $ $ $ $ $ $ $ $ $0.0 $5.0 J… C $96 $212 $337 $521 $726 $916 $1,434 $1,957 $2,617 $3,099 $3,415 $3,703 $304 $844 $860 $882 $967 $1,153 $1,391 $1,663 $1,971 $2,316 $2,696 $3,111 $0 $500 $1,000 $1,500 $2,000 $2,500 $3,000 $3,500 $4,000 January April July October Equity Raise ($ in millions) 2013 2014 Projected Cole Capital Fundraising CCIT II CCPT V Cole DNAV # of Selling Agreements 80 60 46 # of Reps 30,245 12,620 34,626 Note: For purposes of this analysis, 2014 amounts do not include funds raised pursuant to each non - traded REIT’s DRIP. 2014 capital raise is tracking consistent with 2013 and on pace to meet our $3.1 billion target $0.1 $0.2 $0.3 $0.5 $0.7 $0.9 $1.4 $2.0 $2.6 $3.1 $3.4 $3.7 $0.3 $0.9 $0.9 $0.9 $1.0 $1.0 $1.2 $1.4 $1.7 $2.1 $2.6 $3.1 $0.0 $0.5 $1.0 $1.5 $2.0 $2.5 $3.0 $3.5 $4.0 January February March April May June July August September October November December Capital Raise ($ in billions) 2013 2014

14 Cole Capital Acquisitions (Non - Traded REITs) CCIT II CCPT V Cole DNAV # of Selling Agreements 80 60 46 # of Reps 30,245 12,620 34,626 $29 $56 $277 $797 $1,075 $1,373 $1,723 $1,886 $2,248 $2,462 $2,870 $3,830 $0 $161 $242 $340 $470 $881 $1,331 $1,789 $2,332 $2,873 $3,427 $4,003 $0 $500 $1,000 $1,500 $2,000 $2,500 $3,000 $3,500 $4,000 $4,500 Purchase Price ($ in millions) 2013 2014 Projected 2014 acquisitions are projected to reach $4.9 billion $0.03 $0.1 $0.3 $0.8 $1.1 $1.4 $1.7 $1.9 $2.2 $2.5 $2.9 $3.8 $0.00 $0.2 $0.2 $0.3 $0.5 $1.0 $1.5 $2.1 $2.9 $3.5 $4.2 $4.9 $0 $1 $2 $3 $4 $5 $6 January February March April May June July August September October November December Purchase Price ($ in billions) 2013 2014 Note: Expected Cole Capital acquisitions based on available capital, expected raised capital and current pipeline.
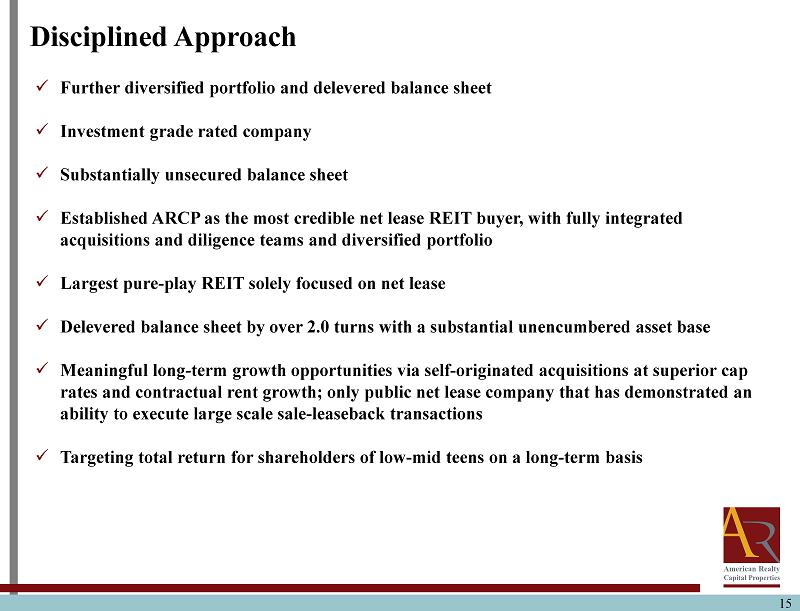
15 Disciplined Approach x Further diversified portfolio and delevered balance sheet x Investment grade rated company x Substantially unsecured balance sheet x Established ARCP as the most credible net lease REIT buyer, with fully integrated acquisitions and diligence teams and diversified portfolio x Largest pure - play REIT solely focused on net lease x Delevered balance sheet by over 2.0 turns with a substantial unencumbered asset base x Meaningful long - term growth opportunities via self - originated acquisitions at superior cap rates and contractual rent growth; only public net lease company that has demonstrated an ability to execute large scale sale - leaseback transactions x Targeting total return for shareholders of low - mid teens on a long - term basis
16 EBITDA and Adjusted Annualized EBITDA are not calculated in accordance with GAAP . ARCP believes these measures are important supplemental measures of operating performance as they allow comparisons of ARCP’s operating results without regard to financing methods and capital structure . Accordingly, ARCP believes it is useful for investors to review net income (a GAAP measure) and EBITDA and Adjusted Annualized EBITDA (together, non - GAAP measures) together in order to (a) understand and evaluate current operating performance and future prospects in the same manner as management does through this non - GAAP measure and (b) understand the adjustments made to net income, which is a GAAP measure, to arrive at these non - GAAP measures . Neither EBITDA nor Adjusted Annualized EBITDA should be considered in isolation of, or as a substitute for, net income or operating income as indicators of operating performance . EBITDA and Adjusted Annualized EBITDA, as calculated by ARCP, may not be comparable to similarly titled measures of other companies . In addition, these measures do not necessarily represent funds available for discretionary use and are not necessarily measures of ARCP’s ability to fund its cash needs . These measures exclude financial information that is included in net income, the most directly comparable GAAP financial measure . Users of this information should consider the types of events and transactions that are excluded . Non - GAAP Measures
17 ARCP considers funds from operations (“FFO”) and AFFO, which is FFO as adjusted to exclude acquisition - related fees and expenses, amortization of above - market lease assets and liabilities, amortization of deferred financing costs, straight - line rent, non - cash mark - to - market adjustments, amortization of restricted stock, non - cash compensation and gains and losses useful indicators of the performance of a REIT . Because FFO calculations exclude such factors as depreciation and amortization of real estate assets and gains or losses from sales of operating real estate assets (which can vary among owners of identical assets in similar conditions based on historical cost accounting and useful - life estimates), they facilitate comparisons of operating performance between periods and between other REITs in our peer group . Accounting for real estate assets in accordance with generally accepted accounting principles (“GAAP”) implicitly assumes that the value of real estate assets diminishes predictably over time . Since real estate values have historically risen or fallen with market conditions, many industry investors and analysts have considered the presentation of operating results for real estate companies that use historical cost accounting to be insufficient by themselves . FFO and AFFO are not in accordance with, or a substitute for, measures prepared in accordance with GAAP, and may be different from non - GAAP measures used by other companies . In addition, FFO and AFFO are not based on any comprehensive set of accounting rules or principles . Non - GAAP measures, such as FFO and AFFO, have limitations in that they do not reflect all of the amounts associated with ARCP's results of operations that would be reflected in measures determined in accordance with GAAP . These measures should only be used to evaluate ARCP's performance in conjunction with corresponding GAAP measures . Additionally, ARCP believes that AFFO, by excluding acquisition - related fees and expenses, amortization of above - market lease assets and liabilities, amortization of deferred financing costs, straight - line rent, non - cash mark - to - market adjustments, amortization of restricted stock, non - cash compensation and gains and losses, provides information consistent with management's analysis of the operating performance of the properties . By providing AFFO, ARCP believes it is presenting useful information that assists investors and analysts to better assess the sustainability of our operating performance . Further, ARCP believes AFFO is useful in comparing the sustainability of our operating performance with the sustainability of the operating performance of other real estate companies, including exchange - traded and non - traded REITs . As a result, ARCP believes that the use of FFO and AFFO, together with the required GAAP presentations, provide a more complete understanding of our performance relative to our peers and a more informed and appropriate basis on which to make decisions involving operating, financing, and investing activities . Funds from Operations and Adjusted Funds from Operations