Attached files
| file | filename |
|---|---|
| EX-31.2 - EX-31.2 - DESTINATION XL GROUP, INC. | d738163dex312.htm |
| EX-31.1 - EX-31.1 - DESTINATION XL GROUP, INC. | d738163dex311.htm |
UNITED STATES
SECURITIES AND EXCHANGE COMMISSION
WASHINGTON, D.C. 20549
FORM 10-K/A
(Amendment No. 1)
ANNUAL REPORT PURSUANT TO SECTION 13 OR 15(d)
OF THE SECURITIES EXCHANGE ACT OF 1934
| For the fiscal year ended February 1, 2014 (Fiscal 2013) |
Commission File Number 01-34219 |
DESTINATION XL GROUP, INC.
(Exact name of registrant as specified in its charter)
| Delaware | 04-2623104 | |
| (State or other jurisdiction of incorporation or organization) |
(IRS Employer Identification No.) | |
| 555 Turnpike Street, Canton, MA | 02021 | |
| (Address of principal executive offices) | (Zip Code) | |
(781) 828-9300
(Registrant’s telephone number, including area code)
Securities registered pursuant to Section 12(b) of the Act:
| Title of each class |
Name of each exchange on which registered | |
| Common Stock, $0.01 par value | The NASDAQ Stock Market, LLC |
Securities registered pursuant to Section 12(g) of the Act:
None
(Title of Class)
Indicate by check mark if the registrant is a well-known seasoned issuer, as defined in Rule 405 of the Securities Act. Yes ¨ No x
Indicate by check mark if the registrant is not required to file reports pursuant to Section 13 or Section 15(d) of the Act. Yes ¨ No x
Indicate by check mark whether the registrant (1) has filed all reports required to be filed by Section 13 or 15(d) of the Securities Exchange Act of 1934 during the preceding 12 months (or for such shorter period that the registrant was required to file such reports), and (2) has been subject to such filing requirements for the past 90 days. Yes x No ¨
Indicate by check mark whether the registrant has submitted electronically and posted on its corporate Web site, if any, every Interactive Data File required to be submitted and posted pursuant to Rule 405 of Regulation S-T (§232.405 of this chapter) during the preceding 12 months (or for such shorter period that the registrant was required to submit and post such files). Yes x No ¨
Indicate by check mark if disclosure of delinquent filers pursuant to Item 405 of Regulation S-K is not contained herein, and will not be contained, to the best of the registrant’s knowledge, in definitive proxy or information statements incorporated by reference in Part III of this Form 10-K or any amendment to this Form 10-K. ¨
Indicate by check mark whether the registrant is a large accelerated filer, an accelerated filer, a non-accelerated filer, or a smaller reporting company. See the definitions of “large accelerated filer,” “accelerated filer” and “smaller reporting company” in Rule 12b-2 of the Exchange Act. (Check one):
| Large accelerated filer | ¨ | Accelerated filer | x | |||
| Non-accelerated filer | ¨ (Do not check if a smaller reporting company) | Smaller reporting company | ¨ | |||
Indicate by check mark whether the registrant is a shell company (as defined in Rule 12b-2 of the Act). Yes ¨ No x
As of August 3, 2013, the aggregate market value of the Common Stock held by non-affiliates of the registrant was approximately $235.5 million, based on the last reported sale price on that date. Shares of Common Stock held by each executive officer and director and by each person who owns 10% or more of the outstanding Common Stock have been excluded on the basis that such persons may be deemed to be affiliates. This determination of affiliate status is not necessarily determinative for other purposes.
The registrant had 50,542,399 shares of Common Stock, $0.01 par value, outstanding as of May 2, 2014.
DOCUMENTS INCORPORATED BY REFERENCE
None.
EXPLANATORY NOTE
We are filing this Amendment No. 1 to our Annual Report on Form 10–K for the fiscal year ended February 1, 2014 pursuant to General Instruction G(3) to Form 10–K for the purposes of filing the information required to be disclosed pursuant to Part III of Form 10–K.
This Form 10–K/A does not reflect events occurring after the filing of the original Form 10–K. Except for the amendments described above, this Form 10–K/A does not modify or update the disclosure in our Annual Report on Form 10–K for the fiscal year ended February 1, 2014 originally filed with the Securities and Exchange Commission on March 17, 2014.
PART III.
Item 10. Directors, Executive Officers and Corporate Governance
Set forth below is certain information regarding our directors, including information furnished by them as to their principal occupations and business experience for the past five years, certain directorships held by each director within the past five years, their respective ages as of June 1, 2014 and the year in which each became a director of our Company:
| NAME |
AGE | POSITION |
DIRECTOR SINCE |
|||||||
| Seymour Holtzman |
78 | Chairman of the Board and Director (1) |
2000 | |||||||
| David A. Levin |
63 | President, Chief Executive Officer and Director |
2000 | |||||||
| Alan S. Bernikow |
73 | Director (4),(5) |
2003 | |||||||
| Jesse Choper |
78 | Director (4),(5),(6) |
1999 | |||||||
| John Edward Kyees |
67 | Director, Interim Chief Financial Officer (2) |
2010 | |||||||
| Willem Mesdag |
60 | Director (3),(4),(6) |
2014 | |||||||
| Ward K. Mooney |
65 | Director (6) |
2006 | |||||||
| George T. Porter, Jr. |
67 | Director (6) |
1999 | |||||||
| Mitchell S. Presser |
49 | Director (5) |
2007 | |||||||
| Ivy Ross |
58 | Director |
2013 | |||||||
| (1) | Mr. Holtzman has served as Chairman of the Board of Directors since April 2000. |
| (2) | Mr. Kyees was a member of the Audit Committee until February 2, 2014 when he was appointed Interim Chief Financial Officer. Mr. Kyees served as Interim Chief Financial Officer until May 31, 2014. |
| (3) | Mr. Mesdag was elected a director of the Company on January 29, 2014. |
| (4) | Current member of the Audit Committee. |
| (5) | Current member of the Nominating and Corporate Governance Committee. |
| (6) | Current member of the Compensation Committee. |
Seymour Holtzman, has been a director since April 7, 2000 and Chairman of the Board since April 11, 2000. On May 25, 2001, the Board of Directors hired Mr. Holtzman as an employee. Mr. Holtzman has been involved in the retail business for over 40 years. For many years, he has been the President and Chief Executive Officer of Jewelcor, Incorporated, a former New York Stock Exchange listed company that operated a chain of retail stores. From 1986 to 1988, Mr. Holtzman was Chairman of the Board and also Chief Executive Officer of Gruen Marketing Corporation, an American Stock Exchange listed company involved in the nationwide distribution of watches. For at least the last five years Mr. Holtzman has served as Chairman and Chief Executive Officer of Jewelcor Management, Inc., a company primarily involved in investment and management services. Mr. Holtzman is the Chief Executive Officer and indirectly the owner of C.D. Peacock, Inc., a Chicago, Illinois retail jewelry establishment, the managing member of Luxury Swiss, LLC, a retail Rolex Watch establishment, and the Chief Executive Officer and owner of Homeclick, LLC, a privately held internet retailer specializing in luxury brands for the home. Mr. Holtzman was the Chief Executive Officer and Co-Chairman of the Board of George Foreman Enterprises, Inc., formerly MM Companies, Inc. until his resignation in November 2010. Mr. Holtzman is a successful entrepreneur with extensive experience working with public companies and provides valuable insight to the Board with respect to strategic planning.
David A. Levin has been our President and Chief Executive Officer since April 10, 2000 and a director since April 11, 2000. From 1999 to 2000, he served as the Executive Vice President of eOutlet.com. Mr. Levin was President of Camp Coleman, a division of The Coleman Company, from 1998 to 1999. Prior to that, Mr. Levin was President of Parade of Shoes, a division of J. Baker, Inc., from 1995 to 1997. Mr. Levin was also President of Prestige Fragrance & Cosmetics, a division of Revlon, Inc., from 1991 to 1995. Mr. Levin has worked in the retail industry for over 30 years. Since joining the Company, Mr. Levin has been instrumental in transforming the Company from a company which exclusively operated Levi Strauss & Co. branded apparel to the largest specialty retailer of big & tall men’s apparel. In May 2012, Mr. Levin joined the board of directors of Christopher & Banks Corporation, a New York Stock Exchange listed company that specializes in women’s apparel. Mr. Levin brings to the Board valuable experience in merchandising and marketing initiatives.
Alan S. Bernikow has been a director since June 29, 2003. From 1998 until his retirement in May 2003, Mr. Bernikow was the Deputy Chief Executive Officer at Deloitte & Touche LLP where he was responsible for assisting the firm on special projects such as firm mergers and acquisitions, litigation matters and partner affairs. He was a member of Deloitte & Touche’s Executive & Management Committees; Chairman for the Professional Asset Indemnity Limited (“PAIL”) Bermuda Big 4 Insurance Representatives; and President for the PAIL Vermont Insurance Company Big 4 Insurance Representatives. Mr. Bernikow joined Touche Ross, the
predecessor firm of Deloitte & Touche LLP, in 1977, prior to which Mr. Bernikow was the National Administrative Partner in Charge for the accounting firm of J.K. Lasser & Company. Mr. Bernikow is a member of the Board of Directors of Revlon, Inc., a NYSE-listed company, and Revlon Consumer Products Corporation and serves as Chairman of the Audit Committee of Revlon, Inc.; as well as Chairman of the Revlon, Inc. Compensation and Stock Plan Committee; a member of the Board of Directors of Mack-Cali, as well as the Chairman of the Audit Committee and a member of the Executive Committee of Mack-Cali; and serves as a Director of the Board of the UBS Global Asset Management (US) Inc., a wholly owned subsidiary of UBS AG, including serving as Chairman of its Audit Committee. Mr. Bernikow has had extensive international experience in his role in Deloitte & Touche’s management/risk management group, as well as worldwide insurance responsibilities. Mr. Bernikow provides the Board with substantial financial expertise and strategic planning as a result of his years of experience at Deloitte & Touche LLP. His strong financial background qualifies him as an “audit committee financial expert”. Mr. Bernikow provides the Board with valuable insight with respect to financial reporting based on his experiences serving on the audit committees of several boards.
Jesse Choper has been a director since October 8, 1999. Mr. Choper is the Earl Warren Professor of Public Law at the University of California at Berkeley School of Law, where he has taught since 1965. From 1960 to 1961, Professor Choper was a law clerk for Supreme Court Chief Justice Earl Warren. Mr. Choper is a member of the California Horseracing Board. Mr. Choper was a member of the Board of Directors of George Foreman Enterprises, Inc. until his resignation in November 2010. Mr. Choper provides valuable legal expertise to the Board. His specific legal background makes him an authority on ethical behavior and he provides valuable insight with respect to corporate governance. Mr. Choper’s tenure and service as a director for over ten years is also considered a valuable asset to the Board.
John E. Kyees has been a director since May 3, 2010. From February 2, 2014 until May 31, 2014, Mr. Kyees assumed the position of Interim Chief Financial Officer of the Company. From 2003 until his retirement in 2010, Mr. Kyees was the Chief Financial Officer of Urban Outfitters, Inc. and also served as the Chief of Investor Relations for Urban Outfitters in 2010. Prior to that, from 2002 to 2003, Mr. Kyees was the Chief Financial Officer and Chief Administrative Officer of bebe Stores, Inc. Mr. Kyees is a member of the Board of Directors of Vera Bradley, Inc., a publicly-traded company, and serves as Chairman of the Audit Committee. Mr. Kyees was a member of the Board of Directors of Hot Topic, Inc., a formerly publicly-traded company, and was a member of the Audit Committee. Mr. Kyees is a member of the Board of Directors of Rackwise, Inc., a publicly-traded company, and is a member of the Audit Committee. In addition, Mr. Kyees is also a director of Arhaus Furniture, a privately-held retailer. Mr. Kyees brings to the Board extensive executive-level retail experience having served as Chief Financial Officer for several prominent retailers. His insight with respect to merchandising, operational activities and finance is an asset to our Board. Institutional Investor magazine selected Mr. Kyees as a top specialty retail chief financial officer on five separate occasions, evidencing his strong skills in corporate finance, strategic and accounting matters.
Willem Mesdag has been a director since January 29, 2014. Mr. Mesdag is the Managing Partner of Red Mountain Capital Partners LLC, an investment firm based in Los Angeles, California. Prior to founding Red Mountain in 2005, Mr. Mesdag was a Partner and Managing Director of Goldman, Sachs & Co., which he joined in 1981. Prior to Goldman, Sachs he was a securities lawyer at Ballard, Spahr, Andrews & Ingersoll, which he joined in 1978. He currently serves on the boards of Encore Capital Group Inc., a NASDAQ-listed company, and Nature’s Sunshine Products Inc., a NASDAQ-listed company. He previously served on the boards of 3i Group plc, Cost Plus, Inc. and Skandia Group AB. Having had an extensive career in international investment banking and finance, Mr. Mesdag brings to the Board significant expertise related to business and financial issues and corporate governance.
Ward K. Mooney has been a director since July 31, 2006. Mr. Mooney is a founding partner of Crystal Financial LLC and since March 2010 has been the Chief Executive Officer. Prior to that, Mr. Mooney was the President of Bank of America Retail Finance Group and Chief Operating Officer of Back Bay Capital, both of which were formerly Bank of Boston businesses which Mr. Mooney founded. Mr. Mooney provides the Board with valuable insight with respect to his extensive experience as a lender in the retail industry.
George T. Porter, Jr. has been a director since October 28, 1999. Mr. Porter was President of Levi’s USA for Levi Strauss & Co. from 1994 to 1997. Beginning in 1974, Mr. Porter held various positions at Levi Strauss & Co., including President of Levi’s Men’s Jeans Division. Mr. Porter was also Corporate Vice President and General Manager of Nike USA from 1997 to 1998. Mr. Porter provides the Board with extensive merchandising experience having worked at two highly prominent companies. Mr. Porter’s tenure and service as a director for over ten years is also considered a valuable asset to the Board.
Mitchell S. Presser has been a director since May 1, 2007. Since January 2014, Mr. Presser has been a Senior Advisor to Paine & Partners, LLC, a private equity firm. From November 2006 to January 2014, Mr. Presser was a founding partner of Paine & Partners, LLC. Prior to that, Mr. Presser was a partner with the law firm of Wachtell, Lipton, Rosen & Katz, specializing in mergers & acquisitions. Mr. Presser serves as a director on the boards of several privately-held companies. Mr. Presser’s extensive experience in private equity and strategic planning provides valuable insight to the Board.
Ivy Ross has been a director since January 31, 2013. In May 2014, Ms. Ross joined Google X as Head of Glass. From July 2011 until April 2014, Ms. Ross was the Chief Marketing Officer of Art.com from where she oversaw the company’s marketing, branding, merchandising and user-experience functions. Prior to Art.com, from June 2008 to June 2011, Ms. Ross was EVP of Marketing for the Gap brand, and acted as the Creative Catalyst for all brands within Gap, Inc. Ms. Ross also has held senior creative and product design positions at Disney Stores North America, Mattel, Calvin Klein, Coach, Liz Claiborne, Swatch Watch and Avon. Chosen by Fast Company and BusinessWeek as the new face of leadership, Ross was a contributing author of The Change Champions Field Guide and Best Practices in Leadership Development and Organizational Change. She has also served on Proctor and Gamble’s design board since its inception. With her industry insight and marketing expertise, Ms. Ross provides a valuable perspective to the Board as the Company builds its Destination XL brand.
All directors hold office until the next Annual Meeting of Stockholders and until their respective successors have been duly elected and qualified or until their earlier death, resignation or removal.
Current Non-Director Executive Officers
Peter H. Stratton, Jr., 42, became our Senior Vice President, Chief Financial Officer and Treasurer on June 1, 2014. From August 2009 to May 31, 2014, Mr. Stratton was our Senior Vice President of Finance, Corporate Controller and Chief Accounting Officer. Mr. Stratton joined us in June 2009 as Vice President of Finance. Prior to joining the Company, Mr. Stratton served as Senior Director of Corporate Accounting at BearingPoint, Inc from May 2007 to June 2009. Prior to May 2007, Mr. Stratton held various finance and accounting leadership positions at Legal Sea Foods, Inc., Shaw’s Supermarkets, Inc. and Cintas Corporation.
Francis Chane, 51, has been our Senior Vice President of Distribution and Logistics since June 2011. Prior to that, Mr. Chane was our Vice President of Distribution & Logistics since joining the Company in June 2008. Prior to joining our Company, Mr. Chane was Vice President Operations & Facilities for Redcats USA, a division of the French multi-national company PPR, from 1999 to April 2008.
Angela Chew, 47, has been our Senior Vice President of Global Sourcing and Product Development since March 2013. Prior to that, from May 2010 to March 2013, Ms. Chew was our Vice President of Global Sourcing. Ms. Chew joined the Company in February 2009 as our Director of Global Sourcing. Prior to joining our Company, from October 2007 to December 2008 Ms. Chew was the Senior Product Manager for Redcats USA. From 2007 to 2009, Ms. Chew was an Independent Retail Consultant and Analyst with the Gerson Lehrman Group and in 2006, she held the positions of Director and Executive Vice President of Global Sourcing for Rocawear. Prior to that, Ms. Chew was the founder & partner of several apparel manufacturing companies & franchise restaurants. She also held various merchandising management positions with Macy’s corporate in New York and Hong Kong.
Kenneth M. Ederle, 49, has been our Senior Vice President and Chief Merchandising Officer since April 2013. Prior to that, from May 2011 until April 2013, Mr. Ederle was our Senior Vice President – General Merchandising Manager DXL. Mr. Ederle served as our Vice President, General Merchandise Manager of Rochester Clothing from August 2008 until May 2011. From January 2008 to August 2008, Mr. Ederle was our Merchandise Manager of Sportswear for Rochester Clothing and prior to that was one of our Merchandise Managers for Casual Male from November 2006 to December 2007. Prior to joining the Company in 2006, Mr. Ederle was a Senior Buyer and Senior Planner for Limited Brands.
Jack R. McKinney, 58, has been our Senior Vice President and Chief Information Officer since June 2002. Mr. McKinney began his career with Casual Male Corp. in 1997 and joined our Company in May 2002 as part of our acquisition of Casual Male Corp.
Robert S. Molloy, 54, has been our Senior Vice President and General Counsel since April 2010 and became Secretary of the Company on May 15, 2014. Prior to that, Mr. Molloy was the Vice President and General Counsel since joining the Company in February 2008. Prior to joining the Company, Mr. Molloy served as Vice President, Assistant General Counsel at Staples, Inc. from May 1999 to February 2008. Prior to May 1999, Mr. Molloy was a trial attorney.
Brian S. Reaves, 53, joined our Company in May 2010 as our Senior Vice President of Store Sales and Operations. Prior to joining our Company, Mr. Reaves was the Vice President – Outreach and Group Sales for David’s Bridal from 2007 to 2009. Before that, Mr. Reaves was the Senior Vice President of Sales for The Bridal Group from 2004 to 2007.
Peter E. Schmitz, 55, has been our Senior Vice President and Chief Real Estate Officer since June, 2013. Prior to that, Mr. Schmitz was our Senior Vice President, Real Estate and Store Development. Prior to joining the Company, Mr. Schmitz was the Vice President of Real Estate for Brooks/Eckerd Pharmacy Chain since 1995.
Vickie S. Smith, 57, joined the Company in February 2008 as our Senior Vice President, Merchandise Planning and Allocation. Prior to that, Ms. Smith worked at Urban Brands as Senior Vice President, Planning, Allocation and Marketing from May 2006 to November 2007. From May 2001 to December 2005, Ms. Smith was the Vice President, Corporate Planning and Allocation at JCPenney.
Walter E. Sprague, 65, has been our Senior Vice President of Human Resources since May 2006. From August 2003 through April 2006, Mr. Sprague was our Vice President of Human Resources. Prior to joining our Company, Mr. Sprague was the Managing Director Northeast, for Marc-Allen Associates, a nationwide executive recruiting firm. From 1996 to 2002, Mr. Sprague was the Assistant Vice President – Senior Director of Human Resources for Foot Locker Inc. and prior to that, the Assistant Vice President – Senior Director of Human Resources for Woolworth Corporation, the predecessor company to Foot Locker Inc.
Derrick Walker, 45, has been our Senior Vice President and Chief Marketing Officer since May 2012. Prior to joining our Company, Mr. Walker was the Vice President of Marketing for Lenscrafters from December 2009 to November 2011. Before that, Mr. Walker was the Vice President of Marketing for Finish Line from December 2006 to September 2009.
Former Non-Director Executive Officers
Dennis R. Hernreich, 56, was our Executive Vice President, Chief Operating Officer, Chief Financial Officer, Treasurer and Secretary from September 2002 until January 30, 2014. Prior to that, Mr. Hernreich served as our Senior Vice President, Chief Financial Officer and Treasurer upon joining us in September 2000. Prior to joining our Company, from 1996 through 1999, Mr. Hernreich held the position of Senior Vice President and Chief Financial Officer of Loehmann’s, a national retailer of women’s apparel. From 1999 to August 2000, Mr. Hernreich was Senior Vice President and Chief Financial Officer of Pennsylvania Fashions, Inc., a 275-store retail outlet chain operating under the name Rue 21.
John R. Wagner, 59, was our Vice President, Merchandise Manager for Tailored Clothing and Dress Furnishings from November 2010 until April 2014. Prior to joining our Company, Mr. Wagner was President of Innovative Sourcing Group, a New York based product development and sourcing firm specializing in men’s apparel. From 2001 to 2007, Mr. Wagner held the positions of Vice President of Manufacturing and Product Development and Vice President of Tailored Clothing for S&K Famous Brands, a men’s specialty retail chain based in Richmond, Virginia.
There are no family relationships between any of our directors and executive officers.
Section 16(a) Beneficial Ownership Reporting Compliance
Section 16(a) of the Securities Exchange Act of 1934, as amended (the “Exchange Act”), requires our executive officers and directors, and persons who own more than 10% of a registered class of our equity securities (collectively, the “Reporting Persons”), to file reports of ownership and changes in ownership with the Securities and Exchange Commission (the “SEC”). The Reporting Persons are required to furnish us with copies of all Section 16(a) reports they file. Based solely upon a review of Forms 3, 4 and 5 and amendments thereto furnished to us during fiscal 2013, we believe that the current Reporting Persons complied with all applicable Section 16(a) reporting requirements and that all required reports were filed in a timely manner, with the following exceptions: Ms. Chew and Mr. Wagner both filed a late Form 4 on June 7, 2013 for the sale of shares; Ms. Ross filed a late Form 3 and Form 4 on February 13, 2013 related to her election as a director and for an initial stock option grant of 15,000 shares on January 31, 2013; and Mr. Mesdag filed a late Form 4 on February 7, 2014 for an initial stock option grant of 15,000 shares on January 29, 2014.
Code of Ethics
We have adopted a Code of Ethics which applies to our directors, Chief Executive Officer, Chief Financial Officer and Chief Accounting Officer, as well as our other senior officers. The full text of the Code of Ethics can be found under “Corporate Governance –Charters & Policies” on the Investor Relations page of the our corporate web site, which is at http://investor.destinationxl.com.
Audit Committee
We have a separately-designated standing Audit Committee established in accordance with section 3(a)(58)(A) of the Exchange Act. The Audit Committee is currently comprised of Messrs. Choper, Bernikow and Mesdag. Mr. Kyees served as a member of the Audit Committee until February 2, 2014, when he was appointed Interim Chief Financial Officer. Each of the current members of the Audit Committee is independent, as independence for Audit Committee members is defined under the rules of NASDAQ. In addition, the Board of Directors has determined that Mr. Bernikow is an “audit committee financial expert” under the rules of the SEC. No other directors attend audit committee meetings.
The Audit Committee operates under a written charter, which can be found under “Corporate Governance- Charters & Policies” on the Investor Relations page of our website at http://investor.destinationxl.com.
Item 11. Executive Compensation
Compensation Discussion and Analysis
This Compensation Discussion and Analysis discusses the compensation paid to our key executives which includes our Chief Executive Officer and our former Chief Financial Officer (“Key Executives”) as well as our other executive officers (the “Senior Executives”). For the purposes of this Form 10-K/A, the Key Executives and our next three most highly-compensated Senior Executives for fiscal 2013 are collectively referred to herein as our “Named Executive Officers.”
The Named Executive Officers for fiscal 2013 are: David A. Levin, President and Chief Executive Officer, Dennis R. Hernreich, former Executive Vice President, Chief Financial Officer, Chief Operating Officer, Treasurer and Secretary, Kenneth M. Ederle, Senior Vice President and Chief Merchandising Officer, Robert S. Molloy, Senior Vice President and General Counsel and Brian S. Reaves, Senior Vice President, Store Sales and Operations.
Mr. Levin is a Key Executive officer and Mr. Hernreich was a Key Executive until his departure on January 30, 2014. Our Senior Executives are listed above under “Item 10. Directors, Executive Officers and Corporate Governance-Current Non-Director Executive Officers.”
With Mr. Hernreich’s departure, John E. Kyees, a director of the Company, was appointed and served as Interim Chief Financial Officer from February 2, 2014 until May 31, 2014. Effective June 1, 2014, Peter H. Stratton, Jr., Senior Vice President Finance, Corporate Controller and Chief Accounting Officer was promoted to Senior Vice President, Chief Financial Officer and Treasurer of the Company.
The Compensation Committee of our Board of Directors determines the compensation for our Named Executive Officers. The responsibility of our Compensation Committee is to establish, implement and continually monitor adherence to our compensation philosophy, as well as ensure that the total compensation is fair, reasonable, competitive and consistent with the interests of the Company’s stockholders.
Say on Pay
At our 2011 Annual Meeting, stockholders voted on a non-binding advisory proposal as to the frequency with which we should conduct an advisory vote on executive compensation (a “say-on-pay proposal”). At that meeting, and in accordance with the recommendation of our Board of Directors, 93.5% of votes cast voted for the “one-year” frequency for advisory votes on executive compensation and we intend to hold such vote every year, until our next “say-on-pay” frequency vote, which we anticipate to be held at our 2017 annual meeting.
At our 2013 Annual Meeting, stockholders had an opportunity to cast a non-binding advisory vote on executive compensation as disclosed in the 2013 Proxy Statement. Of the votes cast on the say-on-pay proposal, 94.2% voted in favor of the proposal. The Compensation Committee considered the results of the 2013 advisory vote and believes that it affirms stockholders’ support of our approach to executive compensation, which approach is to align short- and long-term incentives with performance. We will continue to consider the outcome of subsequent say-on-pay votes when making future compensation decisions for our executive officers.
Executive Summary
We believe that our executive compensation policies and practices appropriately balance the interests of our executives with those of our stockholders. Performance is a key component of our philosophy for executive compensation. Accordingly, our executives’ compensation, specifically our compensation for our Chief Executive Officer, is heavily weighted toward “at risk” performance-based compensation. Our executives’ compensation consists of base salary (“fixed compensation”) and performance-based compensation (“at-risk compensation”).
For fiscal 2013, performance-based compensation consisted of an annual cash incentive based on achievement of specified performance goals under our annual incentive plan (or “AIP”) and a new long-term incentive plan with performance targets reflecting the longer-term goals and objectives of the Company. These two plans work together by setting targets aimed to reach our ultimate long-term strategic goals.
In April 2013, the Compensation Committee approved a new long-term incentive plan (the “2013-2016 LTIP”). Whereas our previous long-term incentive plan was based on achievement of current year targets with long-term vesting, our 2013-2016 LTIP is based on achievement of our long-term goals and the effective implementation of our business strategies, specifically, the successful
roll-out and growth of our DXL store concept. The 2013-2016 LTIP was originally designed as a four-year plan, consistent with our initial DXL store roll-out strategy, consisting of a combination of cash, stock options and restricted stock awards, of which half are subject to time-vesting conditions (to minimize attrition during these key years) and half are subject to the achievement of revenue and operating margin targets beginning in fiscal 2015. The philosophy behind the structure of the 2013-2016 LTIP was to encourage retention during this transition phase while also providing our management team an opportunity to earn compensation, commensurate with shareholder returns, if performance targets were achieved.
Under the terms of awards for the 2013-2016 LTIP, the time-based compensation portion of awards will not begin to vest until the end of fiscal 2014, and there was no opportunity for achievement of any of the performance-based targets in fiscal 2013. Because there was no opportunity in fiscal 2013 to earn any pay-out under the 2013-2016 LTIP, the base for target compensation that could be earned by our executives was significantly lower than when compared to fiscal 2012.
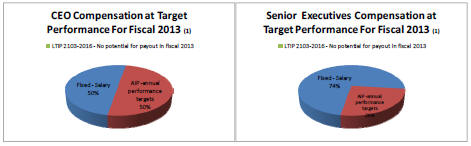
The following charts show the breakdown of compensation opportunity for our Chief Executive Officer (“CEO”) and Senior Executives in fiscal 2013, assuming performance under our AIP was achieved at “target” levels. As noted above, the following charts do not include any amounts attributable to the 2013-2016 LTIP because there was no opportunity for our executives to earn any pay-out under the LTIP in fiscal 2013. Accordingly, as reflected in the chart below, the percentage of fixed compensation to total compensation was higher for fiscal 2013 as compared to fiscal 2012 (when fixed compensation represented 33% and 49% for our Chief Executive Officer and Senior Executives, respectively), because there was an opportunity to earn a payout under the long-term incentive plan in fiscal 2012.
For fiscal 2013, with the exception of Mr. Ederle who was promoted to Chief Merchandising Officer, the base salary for our Named Executive Officers remained unchanged from fiscal 2012 levels. Accordingly, the only opportunity for our Named Executive Officers to achieve compensation above fiscal 2012 levels was to achieve the performance thresholds established under our AIP.
As a result of our actual earnings for fiscal 2013, the only additional compensation beyond salary that our executives earned in fiscal 2013 was a partial payout under our AIP, which approximated 14.3% of Mr. Levin’s salary and 5% of our Senior Executives’ salaries.
Summary of Fiscal 2013 Performance Compared to Fiscal 2012
For fiscal 2013, we reported a net loss of $59.8 million, or $(1.23) per diluted share, as compared to net income of $6.1 million, or $0.13 per diluted share, in fiscal 2012. The comparability of our operating results for fiscal 2013 was affected by an incremental non-cash charge of $51.3 million to establish a valuation allowance against our deferred tax assets, an asset impairment charge of $1.5 million and approximately $2.3 million in executive severance costs, which were accrued at the end of fiscal 2013. On a non-GAAP basis, our adjusted net loss was $6.2 million, or $(0.13) per diluted share. See footnote 4 to the table below for a reconciliation of these non-GAAP measures to GAAP.
This decrease in earnings, before consideration of the valuation allowance and executive severance costs, is primarily attributable to lower than expected sales. While our results for fiscal 2013 included approximately $23.2 million, or $0.29 per diluted share, in transition costs and incremental marketing to support our DXL roll-out, we expected that an increase in sales volume, driven by our store growth, would offset the majority of these costs.
Despite the lower than expected sales volumes in fiscal 2013, we remain very confident in our DXL strategy. Fiscal 2013 was a significant transitional year for us. The process of opening a significant number of new DXL stores, while at the same time liquidating twice as many Casual Male XL legacy stores, was challenging. Notwithstanding some of our misses in fiscal 2013, we are confident that we can improve upon our roll-out strategy as we move into fiscal 2014. Our plan was to complete the transition by the end of fiscal 2015, with 215 to 230 DXL stores opened and substantially all of our Casual Male XL stores closed. We are taking a more measured approach going forward and for fiscal 2014 we plan to open only 40 DXL stores and close 38 Casual Male XL and 2 Rochester clothing stores. We currently do not expect our transition will be complete until fiscal 2017, at which time, we expect we will have 250 DXL stores open.
| For the fiscal year ending: | ||||||||
| February 1, 2014 (Fiscal 2013) |
February 2, 2013 (Fiscal 2012) |
|||||||
| Financial Highlights: | (in millions, except per share and percentages) | |||||||
| Sales |
$ | 388.0 | $ | 399.6 | ||||
| Transition and increased marketing costs (1) |
$ | 23.2 | $ | 9.0 | ||||
| Operating income (loss) |
$ | (13.1 | ) | $ | 13.9 | |||
| EBITDA, a non-GAAP measure (2) |
$ | 7.8 | $ | 29.4 | ||||
| Tax provision (3) |
$ | 45.7 | $ | 5.2 | ||||
| Net income (loss) |
$ | (59.8 | ) | $ | 6.1 | |||
| Net income (loss) per diluted share |
$ | (1.23 | ) | $ | 0.13 | |||
| Adjusted net loss, non-GAAP measure(4) |
$ | (6.2 | ) | |||||
| Adjusted loss per diluted share, non-GAAP measure (4) |
$ | (0.13 | ) | — | ||||
| Shareholder Return(5): |
||||||||
| Total 1-year Shareholder Return |
17.0 | % | ||||||
| Total 2-year Shareholder Return |
60.6 | % | ||||||
| Total 3-year Shareholder Return |
30.0 | % | ||||||
| (1) | Transition costs summarize the one-time costs that are being incurred in connection with opening DXL stores and closing existing Casual Male XL and Rochester Clothing stores. These costs include preopening rent, lease termination costs, pre-opening payroll and training costs, and costs to close existing stores. |
| (2) | EBITDA, a non-GAAP measure, is defined as income from continuing operations before interest, taxes, depreciation and amortization. EBITDA should not be considered superior to or as a substitute for net income derived in accordance with GAAP. We use EBITDA because it: (i) measures performance over the periods in which executives can have significant impact, (ii) is directly linked to our annual incentive plan and long-term growth plan, and (iii) is a key metric used by management and the Board to assess our operating performance. EBITDA for fiscal 2013 was calculated as loss from continuing operations of $(59.7) million, plus interest of $1.0 million, taxes of $45.7 million and depreciation and amortization of $20.8 million. EBITDA for fiscal 2012 is calculated as income from continuing operations of $8.1 million, plus interest of $0.6 million, taxes of $5.2 million and depreciation and amortization of $15.5 million. |
| (3) | In the fourth quarter of fiscal 2013, based on our three-year cumulative loss and our forecasted operating loss for fiscal 2014, we established a full valuation allowance against our net deferred tax assets. |
| (4) | Adjusted Net Loss and Adjusted Loss per Diluted Share are non-GAAP measures and are not meant to be superior to or as a substitute for Net Loss or Loss per Diluted Share on a GAAP basis. No adjustments were made for fiscal 2012. The net loss for fiscal 2013 has been adjusted to exclude $2.3 million of executive severance costs, an asset impairment charge of $1.5 million and an incremental non-cash charge of $51.3 million for the establishment of the valuation allowance. For comparative purposes, an assumed normal tax rate of 40.2% was used. For fiscal 2013 Adjusted Net Loss and Adjusted Loss Per Share was calculated as follows: |
GAAP TO NON-GAAP RECONCILIATION
| $ Per diluted share | ||||||||
| (in millions, except per share data) |
||||||||
| Net loss, GAAP basis |
$ | (59.8 | ) | $ | (1.23 | ) | ||
| Add back: |
||||||||
| Executive severance accrual of $2.3 million, less tax at 40.2% of $0.9 million |
$ | 1.4 | $ | 0.03 | ||||
| Asset impairments of $1.5 million, less tax at 40.2% of $0.6 million |
$ | 0.9 | $ | 0.02 | ||||
| Charge to establish full valuation allowance |
51.3 | $ | 1.05 | |||||
|
|
|
|
|
|||||
| Adjusted net loss, non-GAAP basis |
$ | (6.2 | ) | $ | (0.13 | ) | ||
| Weighted average number of common shares outstanding on a diluted basis |
48.5 | |||||||
| (5) | Total 1-year Shareholder Return for fiscal 2013 was calculated by taking the percentage change in stock price from February 1, 2013 to January 31, 2014. Total 2-year Shareholder Return for fiscal 2013 was calculated by taking the percentage change in stock price from January 27, 2012 to January 31, 2014. Total 3-year Shareholder Return for fiscal 2012 was calculated by taking the percentage change in stock price from January 28, 2011 to January 31, 2014. No dividends were paid by us. We calculated all shareholder returns using the closing price of our common stock on the last business day of each fiscal year. |
Summary of Total Compensation Earned for Fiscal 2013 Compared to Fiscal 2012
As described above, because we did not achieve even the threshold in the majority of our performance goals in fiscal 2013, our Named Executive Officers earned only a partial award under the AIP for fiscal 2013. The actual results compared to the respective targets are discussed below under “Components of Executive Compensation –Performance-based annual cash incentives.”
As discussed above, our executives’ compensation for fiscal 2013 includes the initial grant of time-based equity awards under the LTIP 2013-2016 that will become 20% vested at the end of fiscal 2014, 40% at the end of fiscal 2015 with the remaining 40% vesting at the end of fiscal 2016. While the cash and performance-based components of the 2013-2016 LTIP will not be reflected until the time-vested cash component vests and the performance targets are achieved, the fair value of these time-based equity awards have to be reflected in the year of grant, or fiscal 2013.
With the exception of accrued severance for Mr. Hernreich and Mr. Ederle’s promotion to Chief Merchandising Officer, the increase in compensation for our Named Executive Officers for fiscal 2013 as compared to fiscal 2012 is solely due to the fair value of the time-vested portion of the equity awards granted under the 2013-2016 LTIP, which do not begin to vest until the end of fiscal 2014. As a result, our executives’ total compensation for fiscal 2013 appears substantially higher than fiscal 2012. Except as noted above, without consideration of the fair value of the time-vested portion of the awards under the 2013-2016 LTIP, total compensation for each of our Named Executive Officers in fiscal 2013 decreased over fiscal 2012. The following table summarizes total compensation earned by each Named Executive Officer for fiscal 2013 as compared to fiscal 2012. See the “Summary Compensation Table” below for a detailed description of compensation for each Named Executive Officer.
| Named Executive Officer |
% Change (1) |
February 1, 2014 (Fiscal 2013) (1) |
February 2, 2013 (Fiscal 2012) |
|||||||||
| David A. Levin, President and Chief Executive Officer |
73.7 | % | $ | 2,182,462 | $ | 1,256,675 | ||||||
| Dennis R. Hernreich (2) Former Executive Vice President, Chief Financial Officer, Chief Operating Officer, Treasurer and Secretary |
497.6 | % | $ | 3,909,699 | $ | 654,194 | ||||||
| Kenneth M. Ederle, Senior Vice President, Chief Merchandising Officer |
101.2 | % | $ | 691,969 | $ | 343,886 | ||||||
| Robert S. Molloy Senior Vice President, General Counsel and Secretary |
75.4 | % | $ | 707,704 | $ | 403,468 | ||||||
| Brian S. Reaves Senior Vice President, Store Sales and Operations |
74.8 | % | $ | 601,914 | $ | 344,423 | ||||||
| (1) | The amounts in this column include the following amounts attributable to the fair value of time-vested equity awards made to each Named Executive Officer under the 2013-2016 LTIP in fiscal 2013, none of which vested in fiscal 2013: Mr. Levin - $1,216,800; Mr. Hernreich - $932,880; Mr. Ederle - $341,250; Mr. Molloy - $341,250; Mr. Reaves - $288,750. |
| (2) | Mr. Hernreich’s time-vested awards, with a fair value of $932,880, were forfeited as a result of his termination of employment of January 30, 2014. Compensation for fiscal 2013 includes $2.3 million for accrued severance. |
Executive Compensation Philosophy and Objectives
Our Compensation Committee’s overarching compensation guiding principle is to reward our executives for the achievement of our primary business objectives: successfully complete the transformation to our DXL format, to grow our market share within the Big & Tall retail industry, to increase earnings and operating margins and, ultimately, to increase stockholder returns through increased stock price due to the increase in earnings and operating margins. For fiscal 2013, given the transformation that the Company had embarked upon, and the fact that the transition from our Casual Male XL format to our DXL format is a multi-year plan, the Committee was challenged with providing competitive, short and long-term compensation opportunities to our executives during this important transition period.
The Compensation Committee believes that the most effective executive compensation program is one designed to:
| • | Attract, retain and engage the executive talent we need to deliver on our performance expectations; |
| • | Reward the achievement of specific annual, long-term and strategic goals through a combination of both cash and stock-based compensation; |
| • | Align the executives’ interests with those of our stockholders; and |
| • | Deliver a total compensation opportunity competitive with those available to similarly situated executives at our peer companies. |
When reviewing compensation, the Compensation Committee evaluates the pay structure in two primary ways: “total cash compensation” and “total direct compensation.” The total cash compensation, which consists of the executive’s base salary and an annual performance-based cash incentive award, is tied to our annual performance targets, which is generally EBITDA but also includes other performance targets. The total direct compensation includes the total cash compensation plus target long-term incentive awards. Our current long-term incentives reward the achievement of our long-term objectives of increasing revenue and operating margin percentage, which we believe is aligned with stockholder returns.
We seek to balance the mix of short and long-term compensation in order to ensure adequate base compensation and annual incentive opportunities to attract and retain executive talent, while providing meaningful incentives for them to create long-term sustained value for our Company and our stockholders.
With respect to the overall compensation paid to our Chief Executive Officer, the Compensation Committee’s objective is to achieve a total direct compensation amount that is within our peer median if we are able to achieve financial targets. As such, the Compensation Committee’s objective is to allocate the Chief Executive Officer’s total direct compensation equally between base salary, annual and long-term incentive awards.
For our Senior Executives, the Compensation Committee’s overall objective is to provide them with a competitive base salary that is within our peer median, while providing them with an opportunity for short- and long-term compensation if our Company meets or exceeds its financial targets, such as EBITDA and operating margins.
Over the years, the Compensation Committee has continued to fine-tune the pay for performance and shareholder alignment focus of our executive compensation programs. Prior to fiscal 2008, we provided cash compensation in the form of base salary to meet competitive salary norms and rewarded performance against specific short-term goals in the form of cash bonuses. Additionally, we provided stock options to reward superior performance against specific objectives and long-term strategic goals. In fiscal 2008, with the adoption of a Long-Term Incentive Plan (“LTIP”), which was first amended in May 2010, our management team was offered a compensation plan designed to award superior performance against short-term objectives. However, any award earned (which could be in the form of cash, stock options, restricted stock or any combination thereof based on the prior election of the executives) was subject to a ratable three-year vesting period commencing on the first anniversary of the date of grant. Beginning in fiscal 2010, there were further refinements made with the intention of improving alignment of executive compensation with stockholders’ interest and the Company’s long-term strategic goals. Specifically, all participants in our LTIP, which include our Named Executive Officers, were required to elect at least 50% of any award earned in equity, either through stock options or shares of restricted stock or a combination thereof, in order to be more aligned with our stockholders.
For fiscal 2013, the Compensation Committee redefined the metrics for both the AIP and 2013-2016 LTIP to align the potential awards under these plans with the Company’s current multi-year year strategic plan to transition to the DXL format as communicated to the investment community and its shareholders. See “Components of Executive Compensation” below for more information about the 2013 AIP and 2013-2016 LTIP.
Risk Assessment
We believe that our compensation programs do not provide incentives for unnecessary risk taking by our employees. Our employment agreements with each of our executives include a “clawback” provision which permits us to demand full repayment of all amounts paid to the executive in the event we learn after the executive’s termination that the executive could have been terminated for “justifiable cause.” Our emphasis on performance-based annual and long-term incentive awards is also designed to align executives with preserving and enhancing shareholder value. Based on these considerations, among others, we do not believe that our compensation policies and practices create risks that are likely to have a material adverse effect on our Company.
Compensation Committee Process
In periodic consultations with Sibson Consulting, an independent firm which specializes in benefits and compensation, the Compensation Committee has developed a compensation program that is competitive within our peer group. Our Compensation Committee has assessed the independence of Sibson Consulting and has concluded that no conflict of interest exists with respect to the services that Sibson Consulting performs for our Compensation Committee. Sibson Consulting did not provide any services to the Company other than with respect to the services provided to the Compensation Committee as described below. The consultant most recently analyzed compensation and benefits for our Named Executive Officers in fiscal 2011 and again for Mr. Levin in the Spring of 2014, as it relates to compensation and benefits for fiscal 2014.
The Compensation Committee has the authority to retain compensation consultants and other outside advisors, without Board or management approval, to assist it in carrying out its duties, including the evaluation of compensation to be paid to our Named Executive Officers. The Compensation Committee may accept, reject or modify any recommendations by compensation consultants or other outside advisors. Since 2006, the Compensation Committee has retained Sibson Consulting to analyze compensation and benefits of our peer companies with respect to our Key Executive compensation. In 2011, the consultant analyzed total compensation for the past five-year period for our Named Executive Officers and compared that information with that of our peer companies. In addition, the consultants also reviewed total compensation paid to our Named Executive Officer in comparison to our Company’s financial performance. In fiscal 2012 and fiscal 2013, Sibson Consulting also worked with the Compensation Committee on updating and revising our current annual incentive plan and long–term incentive plan. Sibson Consulting continues to work with the Compensation Committee on an on-going basis to ensure that its compensation program remains in line with our peer group as well as with our own business objectives.
When determining peer companies, we chose public companies within the specialty retail apparel business with comparable sales and market capitalization. In April 2014, the Compensation Committee removed Coldwater Creek, The Finish Line, Hot Topic, JoS A. Bank and Rue 21 from the peer group. The Compensation Committee added bebe stores, inc., Body Central Corp., Kirkland’s Inc., MarineMax, Inc., and Zumiez, Inc. This revised peer group will be in effect for compensation decisions made in fiscal 2014:
| • bebe, inc. |
• Christopher & Banks |
• MarineMax, Inc. | ||
| • Big 5 Sporting Goods |
• Citi Trends |
• Pacific Sunwear | ||
| • Body Central Corp. |
• dELiA*s |
• Sport Chalet | ||
| • The Buckle |
• Destination Maternity |
• Wet Seal | ||
| • Cache. |
• Hibbett Sports |
• Zumiez, Inc. | ||
| • Cato Group |
• Kirkland’s, Inc. |
-Key Executives
The Committee’s overall goal is for Mr. Levin’s total direct compensation to fall within the median of our peer group; however, this guideline may differ depending on an individual’s qualifications, role content and scope, past performance, the demand for individuals with the executive’s specific expertise and experience, achievement of our financial objectives and the executive’s contribution to such achievement and overall responsibility, among other criteria.
The Compensation Committee is directly responsible for determining the compensation paid to Mr. Levin. The Compensation Committee, working with Sibson Consulting, compares each element of compensation to published survey data and proxy data from our peer group for executives with comparable positions and responsibilities. Based on that detailed review which was completed at the end of fiscal 2011, the Committee concluded that the total cash compensation and total direct compensation for Mr. Levin, as well as, Mr. Hernreich were appropriate. This conclusion was based on the following observations:
| • | Assuming that the Company’s performance targets are achieved and Mr. Levin receives performance-based compensation, Mr. Levin’s total cash compensation and total direct compensation is competitive and within our peer median. (The Committee measures “competitive” as compensation that is between 85% to 115% of targeted market level among our peers). |
| • | Mr. Hernreich’s total cash compensation and total direct compensation was above the market median for either a chief financial officer or chief operating officer when compared to our peers. However, our Company is organized differently from our peers. Until his departure, Mr. Hernreich served in multiple roles as our Executive Vice President, Chief Operating Officer, Chief Financial Officer, Treasurer and Secretary. Because of Mr. Hernreich’s multiple responsibilities, the Committee believed that compensation above the median was appropriate recognition of Mr. Hernreich’s multi-faceted responsibilities. Further, the Committee believed Mr. Hernreich’s total compensation was far below the expense which would be incurred by adding additional executives to fill each of the many roles filled by Mr. Hernreich. |
Sibson Consulting was engaged in April 2014 to review Mr. Levin’s compensation and no adjustments were made to his compensation or benefits for fiscal 2014. The Compensation Committee believes that Mr. Levin’s salary continues to be competitive and within our peer median.
-Senior Executives
Our Chief Executive Officer and the Senior Vice President of Human Resources are primarily responsible for determining the compensation paid to our Senior Executives, subject to ratification or approval by the Compensation Committee. For benchmarking purposes, several published industry compensation surveys are utilized when determining compensation packages for our Senior Executives. Through our subscriptions with Salary.com and the National Retail Federation, we have access to the latest compensation data, which includes both base salary and total compensation, inclusive of incentives. While these sites do not identify the specific companies included in the survey, we are able to access information based on industry, size, such as sales volumes, and regional area, among others. In general, we benchmark compensation against companies in the retail industry which are of similar size, based on comparative sales volumes. When recruiting a senior management position, we will also benchmark against larger or more complex business structures to ensure we retain the best talent to support future growth. A combination of performance, achievement of goals and survey data, among other criteria, is used to determine each Senior Executive’s total direct compensation opportunity. Like our Chief Executive Officer, the Senior Executives are provided with a competitive base salary within our retail industry and are provided with an opportunity to earn performance awards each year which are primarily driven by our overall financial targets. See “Components of Executive Compensation – Performance–based annual cash bonuses and –Long-term performance based awards.”
Periodically, our Compensation Committee will engage Sibson Consulting to review the compensation for Senior Executives who are also Named Executive Officers. Sibson Consulting conducted a detailed review of the Company’s top six positions in May 2011 and an updated review of compensation of the Company’s Named Executive Officers in January 2012 for fiscal 2012. As a result of the in-depth study in May 2011, the Compensation Committee observed that the compensation earned for fiscal 2010 was at or below the 50th percentile of our peer group. Further, the Committee noted that the compensation paid to our Senior Executives is more heavily weighted toward incentive programs than with our peer group. That comprehensive study was conducted during a year when bonuses were earned under the Annual Incentive Plan and the LTIP. Based on Sibson’s work, the Committee determined that the compensation opportunity for the Senior Executives who are also Named Executive Officers was appropriate given their specific roles with the Company and the intent of the Committee to emphasize rewards based on achievement of performance goals.
Components of Executive Compensation
The primary components of compensation for our Named Executive Officers include base salary, annual performance-based cash incentives and long-term incentives. The components of compensation are described as follows:
| • | Base salary |
The base salary represents the fixed component of an executive’s annual compensation. In order to be competitive in the marketplace and attract the top executive talent, we believe that it is important that our base salary be competitive, generally falling within the median of our industry peers.
Base salaries are reviewed annually and adjustments are influenced by our performance in the previous fiscal year and the executive’s contribution to that performance. The executive’s performance is measured by various factors, including, but
not limited to, achievement of specific individual and department goals. Additionally, adjustments may consider the individual’s promotion that may have occurred during the fiscal year, and any modifications in the individual’s level of responsibility.
As mentioned above, the Compensation Committee reviews Mr. Levin’s overall compensation. The Committee expects Mr. Levin’s base salary to generally fall in a range that is within the proxy peer median and that approximately one-third of his total direct compensation will be in the form of base salary. In making base salary decisions for our Senior Executives, Mr. Levin, working with Human Resources, will rely on published industry compensation surveys and target the market median range.
With the exception of Mr. Ederle, who was promoted to Senior Vice President and Chief Merchandising Officer in April 2013, the base salaries of our Named Executive Officers have remained flat for the past five years. In April 2014, Mr. Ederle received a 7.7% increase, which included a merit increase and salary adjustment as a result of a compensation review of peers and Mr. Molloy received a merit increase of 3.1%.
| • | Performance-based annual cash incentives |
The Compensation Committee believes that a substantial portion of each executive’s compensation should tie directly to our financial performance. Our compensation program includes eligibility for an annual performance-based cash incentive opportunity for all executives as well as selected non-executive employees. The Committee believes that an annual cash incentive component of compensation is necessary to provide additional incentive to help achieve the annual goals, which ultimately benefit our stockholder value.
2013 Annual Incentive Plan
With the assistance of Sibson Consulting, the Compensation Committee re-designed the financial metrics and targets for the Annual Incentive Plan (“AIP”) for fiscal 2013. With the DXL transformation, there were metrics beyond EBITDA that the Compensation Committee felt were important and warranted focus, and that the metrics should be both challenging and result in a measurable positive impact on the Company. The Committee deemed it important that performance be measured in part by how margins and debt were managed and controlled in a year when we planned increased marketing and capital expenditures. In addition, the Compensation Committee wanted to reward management for improvement in our sales growth and customer base as we continue to transition to the DXL concept. Accordingly, the Compensation Committee identified four target metrics for fiscal 2013, each of which was independent of the other, of which two were financial measures and two were strategic measures.
On April 23, 2013, the financial metrics and targets were approved by the Compensation Committee. The targets were as follows:
| Metric |
Award % Attributable to Each Target |
Minimum/Maximum Potential Payout |
Actual Results | |||||||
| Target 1 | EBITDA | 50.0 | % | -85% of EBITDA target to receive minimum payout of 50%
-125% of EBITDA target to receive maximum payout of 150% |
The EBITDA target for fiscal 2013 was $23.0 million. Actual EBITDA was $7.8 million; accordingly, there was no payout under Target 1. | |||||
| Target 2 | Merchandise Margin (internal metric) and Net Debt | 25.0 | % | -Both metrics must be met to earn 100%; otherwise no payout
-The merchandise margin target for fiscal 2013 was considered achievable, with a 50% probability
-If the maximum payout of 150% is achieved in all three of the other targets, then 150% would be paid out under this target |
Although our merchandise margin was met, our Net Debt had to be less than or equal to $13.0 million. Actual Net Debt was $21.2 million. Accordingly, there was no payout under Target 2. | |||||
| Target 3 | Customer Base Growth | 12.5 | % | 100% of payout at set target, with pro-rata percent increase up to a maximum payout of 150% at 125% of target; and a pro-rata payout for any percentage increase up to 100% of set target | The Customer Base Growth target for fiscal 2013 was an increase of 1.6% in new customers. Actual customer base did not increase; accordingly, there was no payout under Target 3. | |||||
| Target 4 | DXL Comparable Sales | 12.5 | % | -80% of DXL Store Comp target to receive minimum payout of 50%
-200% of DXL Store Comp target to receive maximum payout of 150% |
Our DXL comparable sales had to increase 15% to receive 12.5% payout. Actual DXL comparable sales were 19.3%, which resulted in a payout percentage of 114.4% of the 12.5% attributed to Target 4. | |||||
As a result of exceeding the DXL Comparable Sales target for fiscal 2013, on March 5, 2014 the Compensation Committee approved a cash bonus payout equal to 114.4% of the 12.5% target. The total cash award paid under the 2013 AIP was approximately $535,000, of which approximately $271,000 was paid to our Senior Executives and Mr. Levin. As part of his severance, Mr. Hernreich received a pro-rata portion of his award, see “Employment Agreements – Key Executives” below.
2014 Annual Incentive Plan
Similar to our 2013 AIP, the metrics for achievement under our Annual Incentive Plan for fiscal 2014 represent the primary financial goals for the Company which are to increase top line revenues while protecting merchandise margin and managing expenses during our DXL transition. In addition, increasing our sales per square foot and comparable sales from our DXL stores remain key metrics for our long-term profitability. For fiscal 2014, 10% of the award will be based on each participant’s achievement of generally two to four agreed-upon personal goals. This will reward each participant for success that may not directly tie into our financial performance, but we believe will contribute to the success of our DXL transformation. The Committee approved the financial targets and metrics on April 1, 2014. The targets were as follows:
| Metric |
Award % Attributable to Each Target |
Minimum/Maximum Potential Payout | ||||||
| Target 1 |
Sales |
25.0 | % | 100% payout at set target, with 50% payout at 98% of set target and 150% payout at 105% | ||||
| Target 2 |
EBITDA |
25.0 | % | 100% payout out at set target, with 50% payout at 90% of set target and 150% payout at 128% | ||||
| Target 3 |
Merchandise Margin |
15.0 | % | Target must be achieved for a minimum payout of 100%, with 125% payout at 102.5% of target and 150% of payout at 105% of target. | ||||
| Target 4 |
DXL Comparable Sales |
15.0 | % | 100% payout at set target, with 50% payout at 71.4% of target and 150% of payout at 1.21% of target | ||||
| Target 5 |
DXL Sales per Square Foot |
10.0 | % | 100% payout at set target, with 50% payout at 93.7% of target and 150% of payout at 109.4% | ||||
| Target 6 |
Personal Goals |
10.0 | % | Participants must achieve all personal goals for 100% payout but if all goals are not achieved participants will be able to receive a partial payout equal to the number of personal goals that were achieved. | ||||
Assuming a 100% payout is achieved under the 2014 AIP, if the 2014 AIP were to be paid today based on salaries as of May 1, 2014, the 2014 AIP would be based on salaries earned of $811,200 for Mr. Levin, $350,000 for Mr. Ederle, $335,000 for Mr. Molloy and $275,000 for Mr. Reaves. Mr. Kyees, in his interim role as Interim Chief Financial Officer, is also eligible to participate in the AIP for fiscal 2014 at a rate of 75% of his total per diem amount paid for his services as Interim Chief Financial Officer. Assuming we achieve 100% of the above targets for fiscal 2014, we estimate that the total potential payout would be approximately $4.5 million, of which $2.5 million would be paid to our Chief Executive Officer and Senior Executives and the remaining amount would be paid to the approximately 100 other participants in the AIP. The Compensation Committee believes this is a competitive level of compensation and provides incentives to all of our senior executives and other employees of the Company who serve in important job functions if we are to achieve our annual financial goals.
The Compensation Committee believes that it is possible to meet or exceed the targets set for fiscal 2014. The established targets are intended to be achievable within an approximate 50% probability as a result of executing our operating plan. The target levels are derived from our annual operating plan and budget for the fiscal year. The operating plan and budget set forth our internal goals and objectives for our growth and development and are expected to require substantial efforts by the entire Company to achieve. As a result, the likelihood of achieving the 2014 targets reflects the challenges inherent in achieving the goals and objectives in the operating plan and budget. The Compensation Committee considered the likelihood of achieving the target levels when approving the target amount, including historical achievement by our executive officers.
| • | Long-term performance based plans |
From fiscal 2008 through fiscal 2012, our long-term incentive based plan rewarded the achievement of meeting the current year objectives with the awards vesting over a three-year period once earned, ultimately benefiting our stockholders while developing and retaining a strong management team. On May 28, 2013, the 2008 Long-Term Incentive Plan (“LTIP”), as amended, was terminated and superseded by our 2013-2016 Long-Term Incentive Plan (“2013-2016 LTIP”). The 2013-2016 LTIP was designed for the specific purposes of retaining and rewarding the efforts required for the Company to transition to the DXL, which was originally expected to be four years.
2013-2016 Long-Term Incentive Plan (the “2013-2016 LTIP”)
The structure of the 2013-2016 LTIP was designed by the Compensation Committee working with Sibson Consulting. Its two primary goals are to help retain our management team during our transition to the DXL concept while also tying the reward to the achievement of our long-term objectives. Unlike the previous LTIP, the performance targets are not based solely on current year performance. Given that the Company is undergoing a several year strategic transformation of its business and the four-year 2013-2016 LTIP is a significant departure from our previous annual LTIP plan, at the request of the Compensation Committee, the full board reviewed the design and structure of the plan on May 9, 2013. On May 28, 2013, the Compensation Committee approved the 2013-2016 LTIP.
On May 28, 2013, each participant was granted an unearned and unvested award equal to four times their annual salary multiplied by their long-term incentive program percentage, which is 100% for the Chief Executive Officer and 70% for the Senior Executives. This award amount is referred to as the “Projected Benefit Amount.” Each participant was granted 50% of the Projected Benefit Amount in shares of restricted stock, 25% in stock options with the remaining 25% in cash. The closing price of the Company’s common stock on May 28, 2013 was used to determine the number of shares of restricted stock and to determine the Black-Scholes value in calculating the number of stock options issued.
Of the total Projected Benefit Amount, 50% is subject to time-based vesting and 50% is subject to performance-based vesting. The time-vested portion of the award (half of the shares of restricted stock, options and cash) will vest in three installments with 20% vesting at the end of fiscal 2014, 40% at the end of fiscal 2015 and the remaining 40% vesting at the end of fiscal 2016.
For the performance-based portion of the award to vest, the Company must achieve, during any rolling four fiscal quarter period that ends on or before the end of fiscal 2015, revenue of at least $550 million and an operating margin of not less than 8.0%. In the event that the Company achieves its target of $550 million in revenue with an operating margin not less than 8.0% during any rolling fiscal four quarters prior to the commencement of fiscal 2016, then the total Projected Benefit Amount vests in full.
If the targets for vesting of the performance-based portion of the award are not met by the end of fiscal 2015, then the performance-based target can still be met in fiscal 2016. In fiscal 2016, the Company must achieve revenue of at least $600 million and an operating margin of not less than 8.0% for participants to receive 100% vesting of the performance-based portion of the Projected Benefit Amount. If the Company does not meet the performance target at the end of fiscal 2016, but the Company is able to achieve revenue equal to or greater than $510 million at the end of fiscal 2016 and the operating margin is not less than 8.0%, then the participants will receive a pro-rata portion of the performance-based award based on minimum sales of $510 million (50% payout) and $600 million (100% payout).
Unlike the previous LTIP, the participants are not able to achieve greater than 100% of the Projected Benefit Amount. The Committee, working with Sibson Consulting, decided to construct the 2013-2016 LTIP such that any upside to be gained by participants for their efforts during this multi-year year transition to the DXL concept should be aligned with shareholders and come only from any increase in the value of the equity granted to participants at May 28, 2013.
The Compensation Committee initially believed when adopting the 2013-2016 LTIP that there was an approximate 50% probability of meeting the performance targets set forth in the plan. We believe that our performance targets were established at levels that were intended to be difficult but attainable. The target levels of the performance objectives were derived from our five-year operating plan and budget. The operating plan and budget set forth our internal goals and objectives for our growth and development and are expected to require substantial efforts by the entire Company to achieve. As a result, the likelihood of achieving the performance targets reflected the challenges inherent in achieving the goals and objectives in the operating plan and budget. The Compensation Committee considered the likelihood of achieving the target levels when approving the target amounts, including historical achievement by the Company. Based on actual results through fiscal 2013 and the expectation that the DXL roll-out will not be completed until the end of fiscal 2017, the probability of meeting the original performance targets established in May 2013 have become much more difficult. As discussed above, as the Company has determined to take a more measured approach going forward, the Company currently does not plan on the transition being completed until fiscal 2017. As a result, the Compensation Committee is currently reviewing and considering whether changes to the 2013-2016 LTIP are appropriate given the Company’s current expectations on completion of the DXL roll-out.
Assuming we achieve the performance target and 100% of the Projected Benefit Amount vests, without forfeiture, the total potential payout over this four year period will be approximately $18.5 million, of which $11.5 million would be paid to our Chief Executive Officer and Senior Executives. The compensation expense related to the time-vested portion of the award, or half of the $18.5 million, is being expensed in three tranches, based on the above vesting dates. The remaining compensation expense related to the performance-based portion of the award will not begin to be expensed until it becomes probable that the Company will be able to achieve the performance targets. We cannot predict if and how much of this award will be earned and/or vested.
Because of the long-term nature of the 2013-2016 LTIP, the plan includes provisions regarding the impact on unvested awards after fiscal 2013 of the termination of employment of a participant due to retirement, death, or disability of the participant, termination by the Company of a participant without justifiable cause (as defined in the plan) and termination by the participant for good reason (as defined in the plan) and termination in connection with a change in control of the Company. The impact on unvested awards differs depending on the nature and timing of the termination, as described below.
Termination due to Retirement
Fiscal 2014-Fiscal 2016 - The participant will be entitled to the pro-rata portion of their time-based award that would have vested at the end of the fiscal year in which the participant retired. The time-vested portion will immediately be paid out. With respect to the performance-based portion of the award, the participant will become vested in his/her pro-rata portion of the award as of the date of his termination of employment; however, the participant will not receive a payout of the award unless the Company subsequently meets its performance target, at which time, the participant will receive a payout based on the performance target achieved, if any, at the pro-rata vesting percentage at the time of retirement.
Termination due to Death or Disability of Participant
Fiscal 2014 – The participant will be entitled to the pro-rata portion of his/her time-based award. The time-vested portion will immediately be paid out. With respect to the performance-based portion of the award, the participant will become vested based on a pro-rata basis as of the date of termination and will immediately be paid out on that pro-rata basis. Such calculation will assume that the performance target will be achieved.
Fiscal 2015 – Fiscal 2016 - The participant will be entitled to 100% of his/her time-based award. The time-vested portion will immediately be paid out. With respect to the performance-based portion of the award, the participant will become 100% vested and the award will be paid out only if, when and to the extent any performance target is achieved.
Termination by the Company without justifiable cause or by the participant for good reason
Fiscal 2014 – The participant will be entitled to the pro-rata portion of his/her time-based award. The time-vested portion will immediately be paid out. With respect to the performance-based portion of the award, the participant will become vested based on a pro-rata basis as of the date of termination and will immediately be paid out on that pro-rata basis. Such calculation will assume that the performance target will be achieved.
Fiscal 2015 – Fiscal 2016 - The participant will be entitled to 100% of his/her time-based award. The time-vested portion will immediately be paid out. With respect to the performance-based portion of the award, the participant will become 100% vested and the award will be paid out only if, when and to the extent any performance target is achieved.
Termination in connection with a Change in Control
The 2013-2016 LTIP also includes a “double trigger” change in control provision that requires payment in the event of termination other than for cause or retirement 6 months before or within 18 months after a change in control in the Company. The Company believes that such “double trigger” represents good corporate governance practice. In the event of a change in control, if a participant is terminated within 6 months before or within 18 months after the change in control for any reason other than retirement or by the Company for cause, the unvested portion of the participant’s award will immediately vest and be paid out (as of the date of the change in control or the termination, whichever occurred last).
In the event that the “double trigger” change in control provision is triggered for a participant, the unvested portion of the participant’s award (both time-based and performance-based) will be valued as follows: cash is the amount of the vested cash (without interest); each vested share of restricted stock will be redeemed, based on a calculation set forth in the 2013-2016 LTIP; and each option that vests under these circumstances shall be immediately cancelled in exchange for cash payment as calculated pursuant to the 2013-3016 Plan.
| • | Long-term equity incentives |
Until fiscal 2008, as part of our long-term compensation program, our Compensation Committee had traditionally granted stock options to our Key Executives in order to align our Key Executives’ interests more closely with the interests of our stockholders. The amount of such awards was determined usually once during each fiscal year by the Compensation Committee. The Compensation Committee determined the amount of the stock-based awards granted to the Key Executives usually based on the impact of our financial and operational performance on our stock price but could also take into account other factors in determining the size of stock-based awards, including, but not limited to, special accomplishments during the preceding year.
With the adoption of the LTIP in 2008, the Compensation Committee has not made annual grants of stock options. From 2008 through fiscal 2012, our LTIP plans comprised annual performance targets. If performance targets were achieved, granted awards vested over a three-year period. The performance component of the 2013-2016 LTIP represents 50% of the total potential award, because, consistent with our peers, a time-vested component representing 50% was introduced due to the long-term nature of the performance period.
| • | Discretionary Cash and Equity Awards |
There were no discretionary cash or equity awards granted in fiscal 2013.
| • | Other Compensation |
In addition to our life insurance programs available to all of our employees, we also pay the insurance premiums for an additional $2.0 million life insurance policy for each Key Executive to the benefit of their designated beneficiary(ies). Mr. Hernreich surrendered his policy in connection with his termination of employment.
We offer our senior executives supplemental Disability Insurance and pay a portion of the premiums, which is not offered to our other employees.
Our Named Executive Officers also receive benefits under certain group health, long-term disability and life insurance plans, which are generally available to all of our eligible employees.
After six months of service with us, senior executives are eligible to participate in the 401(k) Salaried Plan. For fiscal 2013, we matched 100% of the first 1% of deferred compensation and 50% of the next 5% (with a maximum contribution of 3.5% of eligible compensation). Benefits under these plans are not tied to corporate performance. In particular circumstances, we also utilize cash signing bonuses and stock awards when certain employees join the Company.
| • | Termination Based Compensation |
We have employment agreements with our Chief Executive Officer and all of our Senior Executives. Upon termination of employment, each executive is entitled to receive severance payments under his/her employment agreements in the event of terminations without justifiable cause. These employment agreements are discussed in detail below following the “Summary Compensation Table.” Our employment agreements do not contain any tax gross ups pursuant to Section 280(g) of the Internal Revenue Code.
| • | Tax Implications |
Under Section 162(m) of the Internal Revenue Code, certain executive compensation in excess of $1 million paid to a principal executive officer and the three most highly compensated executive officers (other than the principal executive officer) at the end of any fiscal year is limited and is not deductible for federal income tax purposes unless the compensation qualifies as “performance-based compensation.” The Compensation Committee’s policy with respect to Section 162(m) is to make a reasonable effort to cause compensation to be deductible by us while simultaneously providing our executive officers with appropriate rewards for their performance. The Company’s Long-Term Incentive Plan and Annual Incentive Plan are both subject to the terms and conditions of the Company’s stockholder-approved 2006 Incentive Compensation Plan, as amended.
COMPENSATION COMMITTEE REPORT
We, the Compensation Committee of the Company, have reviewed and discussed the Compensation Discussion and Analysis required by Item 402(b) of Regulation S-K with management and, based on this review and discussion, recommend to the Board of Directors that the Compensation Discussion and Analysis be included in this Form 10-K/A.
The Compensation Committee*
George T. Porter, Jr., Chairman
Jesse Choper
Ward K. Mooney
| * | Mr. Mesdag was appointed to the Compensation Committee on February 10, 2014. He did not participate in the review and discussions relating to compensation for fiscal 2013 referred to in the Compensation, Discussion and Analysis. Mr. Mesdag was a member of the Compensation Committee when the metrics and financial targets for the fiscal 2014 AIP were approved on April 1, 2014. |
Summary Compensation Table. The following Summary Compensation Table sets forth certain information regarding compensation paid or accrued by us with respect to the President and Chief Executive Officer, the Former Chief Financial Officer/Chief Operating Officer, the Senior Vice President and Chief Merchandising Officer, the Senior Vice President. General Counsel and Secretary and the Senior Vice President, Store Sales and Operations (collectively, the “Named Executive Officers”) for fiscal 2013.
SUMMARY COMPENSATION TABLE
| Name and Principal Position |
Year | Salary ($) | Bonus ($)(1) | Stock Awards ($) (1) (2) |
Option Awards ($) (1) (2) |
Non-Equity Incentive Plan Compensation ($)(1)(3) |
Change in Pension Value and Nonqualified Deferred Compensation Earnings ($) |
All Other Compensation ($)(4) |
Total ($) | |||||||||||||||||||||||||||
| David A. Levin |
2013 | $ | 811,200 | $ | — | $ | 811,200 | $ | 405,600 | $ | 116,002 | $ | — | $ | 38,460 | $ | 2,182,462 | |||||||||||||||||||
| President and Chief Executive Officer |
2012 | $ | 811,200 | $ | 413,400 | $ | — | $ | — | $ | — | $ | — | $ | 32,075 | $ | 1,256,675 | |||||||||||||||||||
| 2011 | $ | 811,200 | $ | — | $ | — | $ | — | $ | — | $ | — | $ | 31,597 | $ | 842,797 | ||||||||||||||||||||
| Dennis R. Hernreich |
2013 | $ | 621,920 | $ | — | $ | 621,920 | $ | 310,960 | $ | — | $ | — | $ | 2,354,899 | $ | 3,909,699 | |||||||||||||||||||
| Former Executive Vice President, Chief |
2012 | $ | 621,920 | $ | 316,940 | $ | — | $ | — | $ | — | $ | — | $ | 32,633 | $ | 971,493 | |||||||||||||||||||
| Financial Officer, Chief Operating |
2011 | $ | 621,920 | $ | — | $ | — | $ | — | $ | — | $ | — | $ | 32,274 | $ | 654,194 | |||||||||||||||||||
| Officer, Treasurer and Secretary |
||||||||||||||||||||||||||||||||||||
| Kenneth M. Ederle |
2013 | $ | 313,462 | $ | — | $ | 227,500 | $ | 113,750 | $ | 15,785 | $ | — | $ | 21,473 | $ | 691,969 | |||||||||||||||||||
| Senior Vice President and Chief |
2012 | $ | 275,000 | $ | 49,050 | $ | — | $ | — | $ | — | $ | — | $ | 19,836 | $ | 343,886 | |||||||||||||||||||
| Merchandising Officer |
2011 | $ | 258,173 | $ | — | $ | — | $ | — | $ | — | $ | — | $ | 18,281 | $ | 276,454 | |||||||||||||||||||
| Robert S. Molloy |
2013 | $ | 325,000 | $ | — | $ | 227,500 | $ | 113,750 | $ | 16,266 | $ | — | $ | 25,188 | $ | 707,704 | |||||||||||||||||||
| Senior Vice President, |
2012 | $ | 325,000 | $ | 57,969 | $ | — | $ | — | $ | — | $ | — | $ | 20,499 | $ | 403,468 | |||||||||||||||||||
| General Counsel and Secretary |
2011 | $ | 325,000 | $ | — | $ | — | $ | — | $ | — | $ | — | $ | 19,600 | $ | 344,600 | |||||||||||||||||||
| Brian S. Reaves |
2013 | $ | 275,000 | $ | — | $ | 192,500 | $ | 96,250 | $ | 13,764 | $ | — | $ | 24,400 | $ | 601,914 | |||||||||||||||||||
| Senior Vice President, Store Sales |
2012 | $ | 275,000 | $ | 49,050 | $ | — | $ | — | $ | — | $ | — | $ | 20,373 | $ | 344,423 | |||||||||||||||||||
| and Operations |
2011 | $ | 275,000 | $ | — | $ | — | $ | — | $ | — | $ | — | $ | 19,486 | $ | 294,486 | |||||||||||||||||||
| (1) | The table “Discretionary and Incentive-Based Awards” below provides a detailed breakdown with respect to awards earned. |
In addition to salary, we also compensate our executives through a combination of discretionary and incentive-based awards. Since 2008, we have had two incentive-based programs, the Annual Incentive Plan (“AIP”) and the Long-Term Incentive Plan. The AIP is a cash-based program which awards certain members of management, which include our Named Executive Officers, if certain financial targets are achieved for the applicable fiscal year. In fiscal 2013, we replaced our existing Long-Term Incentive Plan with the 2013-2016 Long-Term Incentive Plan (“2013-2016 LTIP”). The 2013-2016 LTIP was designed for the specific purpose of retaining and rewarding the efforts required for the Company to transition to the DXL concept over the next three to four years. Under the plan, on May 28, 2013, eligible participants, including our Key Executives and Senior Executives, were granted an unearned and unvested award equal to four times their salary multiplied by their long-term incentive program percentage. Each participant was granted 50% of this award in shares of restricted stock, 25% in stock options with the remaining 25% in cash. In addition, 50% of each award is subject to time-based vesting and 50% is subject to performance-based vesting.
For Stock Awards and Option Awards, the amounts reflect the fair value, as of grant date, of both performance and non-performance awards computed in accordance with FASB ASC Topic 718. The fair value of each stock option award is estimated as of the date of grant using a Black-Scholes valuation model. Additional information regarding the assumptions used to estimate the fair value of all stock option awards is included in Note A to Consolidated Financial Statements contained in our Annual Report on Form 10-K for the fiscal year ended February 1, 2014.
| (2) | The amounts shown in the Stock Awards and Option Awards columns represent the aggregate grant date fair value of time-based awards computed in accordance with FASB ASC Topic 718, not the actual amount paid to or realized by the Named Executive Officers during the applicable fiscal year. These awards are subject to vesting, with 20% vesting at the end of fiscal 2014, 40% at the end of fiscal 2015 and the remaining 40% vesting at the end of fiscal 2016. Mr. Hernreich’s unvested stock award of $621,920 and unvested option award of $310,960 were forfeited as a result of his termination of employment on January 30, 2014. |
Excluded from the Stock Awards and Option Awards columns are the fair values associated with the grant of performance-based awards computed in accordance with FASB ASC Topic 718. As of February 1, 2014, the achievement of the performance targets were not deemed probable and, therefore, no compensation expense has been recognized. As a result, the following fair values, at the highest performance level, associated with the grant of performance-based awards to each of the Named Executive Officers are not reflected in the table above:
| Stock Awards | Option Awards | |||||||
| David Levin |
$ | 811,200 | $ | 405,600 | ||||
| Dennis Hernreich |
621,920 | 310,960 | ||||||
| Kenneth Ederle |
227,500 | 113,750 | ||||||
| Robert Molloy |
227,500 | 113,750 | ||||||
| Brian Reaves |
192,500 | 96,250 | ||||||
Similar to the time-vested awards above, Mr. Hernreich’s unearned performance-based awards were also forfeited due to his termination of employment.
| (3) | Cash awards granted under the 2013-2016 LTIP are excluded from the above table until such awards are earned. See “Grants of Plan-Based Awards” below, for the estimated possible payouts. |
| (4) | See table “All Other Compensation” below for a breakdown. |
The table set forth below is a supplement to the Summary Compensation Table and provides a breakdown of discretionary and incentive-based awards earned by each Named Executive Officer.
Discretionary and Incentive-Based Awards
| Discretionary Awards | Long-Term Incentive Plan All Awards Subject to Vesting (1) |
Annual Incentive Plan |
Totals per Summary Compensation Table | |||||||||||||||||||||||||||||||||||||||||||||
| Name |
Year | Bonus- Cash (2) |
Stock Awards | Option Awards |
Non-Equity (Cash) |
Stock Awards |
Option Awards |
Non-Equity (Cash) |
Bonus | Stock Awards |
Option Awards |
Non-Equity Incentive Plan Compensation |
||||||||||||||||||||||||||||||||||||
| David A. Levin |
2013 | — | — | — | $ | 811,200 | $ | 405,600 | $ | 116,002 | — | $ | 811,200 | $ | 405,600 | $ | 116,002 | |||||||||||||||||||||||||||||||
| 2012 | $ | 413,400 | — | — | — | — | — | — | $ | 413,400 | — | — | — | |||||||||||||||||||||||||||||||||||
| 2011 | — | — | — | — | — | — | — | — | — | — | — | |||||||||||||||||||||||||||||||||||||
| Dennis R. Hernreich |
2013 | — | — | — | — | $ | 621,920 | $ | 310,960 | — | — | $ | 621,920 | $ | 310,960 | — | ||||||||||||||||||||||||||||||||
| 2012 | $ | 316,940 | — | — | — | — | — | — | $ | 316,940 | — | — | — | |||||||||||||||||||||||||||||||||||
| 2011 | — | — | — | — | — | — | — | — | — | — | — | |||||||||||||||||||||||||||||||||||||
| Kenneth M. Ederle |
2013 | — | — | — | — | $ | 227,500 | $ | 113,750 | $ | 15,785 | — | $ | 227,500 | $ | 113,750 | $ | 15,785 | ||||||||||||||||||||||||||||||
| 2012 | $ | 49,050 | — | — | — | — | — | — | $ | 49,050 | — | — | — | |||||||||||||||||||||||||||||||||||
| 2011 | — | — | — | — | — | — | — | — | — | — | — | |||||||||||||||||||||||||||||||||||||
| Robert S. Molloy |
2013 | — | — | — | — | $ | 227,500 | $ | 113,750 | $ | 16,266 | — | $ | 227,500 | $ | 113,750 | $ | 16,266 | ||||||||||||||||||||||||||||||
| 2012 | $ | 57,969 | — | — | — | — | — | — | $ | 57,969 | — | — | — | |||||||||||||||||||||||||||||||||||
| 2011 | — | — | — | — | — | — | — | — | — | — | — | |||||||||||||||||||||||||||||||||||||
| Brian S. Reaves |
2013 | — | — | — | $ | 192,500 | $ | 96,250 | $ | 13,764 | — | $ | 192,500 | $ | 96,250 | $ | 13,764 | |||||||||||||||||||||||||||||||
| 2012 | $ | 49,050 | — | — | — | — | — | — | $ | 49,050 | — | — | — | |||||||||||||||||||||||||||||||||||
| 2011 | — | — | — | — | — | — | — | — | — | — | — | |||||||||||||||||||||||||||||||||||||
| (1) | Under the Company’s 2013-2016 LTIP, on May 28, 2103 each executive received a grant equal to four times their salary multiplied by each executive’s long-term incentive participation percentage. Each participant was granted 50% of this award in shares of restricted stock, 25% in stock options with the remaining 25% in cash. In addition, 50% of the total award is subject to time-based vesting and 50% is subject to performance-based vesting. |
The time-based vesting portion of the award in the above table vests in three installments with 20% vesting at the end of fiscal 2014, 40% at the end of fiscal 2015 and the remaining 40% vesting at the end of fiscal 2016. The fair value of the performance-based portion of the award is not reflected in the above table because the achievement of the performance target was not deemed probable at February 1, 2014. Mr. Hernreich’s unvested and unearned awards were forfeited as a result of his termination of employment on January 30, 2014.
No payments were made to our Named Executive Officers pursuant to our Annual Incentive Plan or previous Long-Term Incentive Plan for fiscal 2012 or fiscal 2011 because performance targets were not achieved.
| (2) | On January 31, 2013, the Board of Directors approved a discretionary cash bonus in recognition of the efforts and progress that the management team made during fiscal 2012 towards the goal of transitioning to the DXL concept. |
The table below sets forth the components of All Other Compensation listed above in the Summary Compensation Table.
All Other Compensation
| Name |
Year | Auto Allowance |
401(k) Match |
Life Insurance Premiums |
Long-Term Health Care Premiums |
Supplemental Disability Insurance |
Severance (1) | Total Other Compensation |
||||||||||||||||||||||||
| David A. Levin |
2013 | $ | 10,000 | $ | 8,925 | $ | 2,958 | $ | 5,028 | $ | 11,549 | — | $ | 38,460 | ||||||||||||||||||
| 2012 | $ | 10,000 | $ | 8,750 | $ | 2,792 | — | $ | 10,533 | — | $ | 32,075 | ||||||||||||||||||||
| 2011 | $ | 10,000 | $ | 8,575 | $ | 2,645 | — | $ | 10,377 | — | $ | 31,597 | ||||||||||||||||||||
| Dennis R. Hernreich |
2013 | $ | 10,000 | $ | 8,925 | $ | 2,206 | $ | 3,994 | $ | 12,841 | $ | 2,316,933 | $ | 2,354,899 | |||||||||||||||||
| 2012 | $ | 10,000 | $ | 8,750 | $ | 2,070 | — | $ | 11,813 | — | $ | 32,633 | ||||||||||||||||||||
| 2011 | $ | 10,000 | $ | 8,575 | $ | 1,927 | — | $ | 11,772 | — | $ | 32,274 | ||||||||||||||||||||
| Kenneth M. Ederle |
2013 | $ | 8,400 | $ | 8,925 | — | — | $ | 4,148 | — | $ | 21,473 | ||||||||||||||||||||
| 2012 | $ | 8,400 | $ | 8,750 | — | — | $ | 2,686 | — | $ | 19,836 | |||||||||||||||||||||
| 2011 | $ | 8,146 | $ | 8,575 | — | — | $ | 1,560 | — | $ | 18,281 | |||||||||||||||||||||
| Robert S. Molloy |
2013 | $ | 8,400 | $ | 8,925 | — | $ | 3,100 | $ | 4,763 | — | $ | 25,188 | |||||||||||||||||||
| 2012 | $ | 8,400 | $ | 8,750 | — | — | $ | 3,349 | — | $ | 20,499 | |||||||||||||||||||||
| 2011 | $ | 8,723 | $ | 8,575 | — | — | $ | 2,302 | — | $ | 19,600 | |||||||||||||||||||||
| Brian S. Reaves |
2013 | $ | 8,400 | $ | 8,925 | — | $ | 2,463 | $ | 4,612 | — | $ | 24,400 | |||||||||||||||||||
| 2012 | $ | 8,400 | $ | 8,750 | — | — | $ | 3,223 | — | $ | 20,373 | |||||||||||||||||||||
| 2011 | $ | 8,723 | $ | 8,575 | — | — | $ | 2,188 | — | $ | 19,486 | |||||||||||||||||||||
| (1) | Mr. Hernreich’s employment with the Company terminated on January 30, 2014. This amount represents the accrued severance payment to Mr. Hernreich at February 1, 2014. See “Employment Agreements – Key Executives” below for a further discussion. |
Employment Agreements
Key Executives
We have an employment agreement, which was revised and restated as of November 5, 2009, with Mr. Levin. The initial three-year term of Mr. Levin’s employment agreement was January 1, 2009 through December 31, 2011. On January 1, 2011 and thereafter on each anniversary of the employment agreement’s commencement date, the term is extended for a one-year period, making Mr. Levin’s employment agreement a rolling two-year agreement after the initial three-year term. We had a similar employment agreement, which was terminated on January 30, 2014 with Mr. Hernreich (collectively the “Employment Agreements.”)
The Employment Agreements require each executive to devote substantially all of the executive officer’s time and attention to our business as necessary to fulfill his respective duties. The Employment Agreements provide that Messrs. Levin and Hernreich would be paid a base salary at annual rate of $811,200 and $621,921, respectively, with an annual automobile allowance of $10,000.
Mr. Levin is eligible to participate in our Annual Incentive Plan at a target rate of 100% of his actual annual base salary, as defined in that plan, and in our Long-Term Incentive Plan at a target incentive rate of 100% of his combined actual annual base earnings for the incentive period. Until his termination, Mr. Hernreich was also eligible to participate in our Annual Incentive Plan at a target rate of 100% of his actual annual base salary and in our Long-Term Incentive Plan at a target incentive rate of 100% of his combined actual annual base earnings for the incentive period. The Employment Agreements also provide for the payment of discretionary bonuses in such amounts as may be determined by the Compensation Committee or Board of Directors.
The Employment Agreement provides that in the event the executive officer’s employment is terminated by the Company at any time for any reason other than “justifiable cause” (as defined in the Employment Agreements), disability or death, or in the event the executive officer resigns with “good reason” (as defined in the Employment Agreement), we are required to pay the executive the following:
| • | A pro rata bonus under the Annual Incentive Plan; |
| • | The accelerated vesting of 2010 LTIP awards; and |
| • | A severance comprised as the sum of (1) the executive’s monthly base salary then in effect plus (2) a monthly amount calculated by dividing by twelve the average of the sum of (i) the annual incentive bonuses earned and (ii) the cash amounts paid to the executive pursuant to the LTIP or the cash value of the options or stock issued to the executive, during each of the two most recent fiscal years, with the monthly sum of (1) plus (2) payable for 24 consecutive months. This severance benefit is conditioned upon the executive officer’s execution of a general release. |
The above-listed payments are not made if the executive officer is terminated with “justifiable cause,” the executive officer resigns and such resignation is not for “good reason”, or the executive officer dies or becomes disabled; provided, however, that if the executive officer’s employment terminates by reason of death, disability or retirement on or after age 65, the executives officer shall be entitled to a pro-rata bonus under the Annual Incentive Plan.
In the event the executive officer’s employment is terminated at any time within one year following a Change of Control (as defined in the Employment Agreement) other than for “justifiable cause,” or if the executive resigns for “good reason”, the executive is entitled to receive a lump sum payment equal to the sum of two times the executive’s base salary, and two times the executive’s target annual incentive bonus for the fiscal year in which the Change of Control occurs. Payments made under this provision are to be reduced if and to the extent necessary to avoid any payments or benefits to executive being treated as “excess parachute payments” within the meaning of Internal Revenue Code Section 280G(b)(i). This payment also is conditioned upon the executive officer’s execution of a general release.
The Employment Agreements contain confidentiality provisions pursuant to which each executive officer agrees not to disclose confidential information regarding our Company. The Employment Agreements also contain covenants pursuant to which each executive officer agrees, during the term of his employment and for a one-year period following the termination of his employment, not to have any connection with any business which is a specialty retailer that primarily distributes, sells or markets so-called “big and tall” apparel of any kind for men or which utilizes the “big and tall” retail or wholesale marketing concept as part of its business. The Employment Agreements also contain a “clawback” provision which provides for remedies in the event we learn after the executive officer’s termination by us other than for “justifiable cause” that the executive officer could have been terminated for “justifiable cause”. Subject to the implementation of final rules by the SEC, the Dodd-Frank Act requires that we implement a policy providing for the recovery of erroneously paid incentive-based compensation following a required accounting restatement. Once the final rules are issued by the SEC, we will revise, in a timely manner, the current clawback provision of our employment agreements.
The Employment Agreements also provide that we will, during the term of employment, pay the insurance premiums under one or more life insurance policies on the executive officer’s life pursuant to an arrangement under which $2,000,000 of the death benefit under the policy or policies would be payable to the executive officer’s named beneficiary (with the executive officer making the election of the designated beneficiary) upon the executive officer’s death. Mr. Hernreich surrendered his policy on January 30, 2014, as part of his termination on employment.
In accordance with the terms of his employment agreement, as discussed above, Mr. Hernreich received a severance payment payable over 24 months of $2.3 million, comprised of the following components (pursuant to the 2013-2016 LTIP, Mr. Hernreich was not entitled to, and did not receive, any payment pursuant to that plan):
| Severance Payment (in thousands) |
||||
| • Pro-rata bonus earned under the AIP for fiscal 2013 |
$ | 88 | ||
| • Cash value for accelerated vesting of 2010 LTIP award |
274 | |||
| • Health benefits, estimated for 24-month period |
20 | |||
| • Severance |
1,955 | |||
|
|
|
|||
| Total severance payment |
$ | 2,337 | ||
|
|
|
|||
Senior Executives
We also have employment agreements with each of our Senior Executives (the “Sr. Exec. Employment Agreements”). The term of each employment agreement begins on the respective effective date and continues until terminated by either party. Our Senior Executives are eligible to participate in our Annual Incentive Plan. During fiscal 2013, they participated at 35% of their respective average base salaries, as defined in the plan. Beginning in 2014, they will participate at 40% of their respective average base salaries, as defined in the plan, depending on our performance (based on achieving the metrics approved by the Compensation
Committee of the Board of Directors). Senior Executives are also eligible to participate in our 2013-2016 LTIP at 70% of their respective average base salaries, as defined in the plan, depending on our performance (based on long-term performance goals). Each executive is entitled to vacation and to participate in and receive any other benefits customarily provided by us to our senior executives.
The Sr. Exec. Employment Agreements provide that in the event the executive officer’s employment is terminated by us at any time for any reason other than “justifiable cause” (as defined in the Employment Agreements), disability or death, we are required to pay the executive his then current base salary for five months after the effective date of such termination. This severance benefit is conditioned upon the senior executive’s execution of a general release.
The above-listed payments are not made if the senior executive is terminated with “justifiable cause,” the senior executive resigns, or the senior executive dies or becomes disabled.
In the event the senior executive’s employment is terminated at any time within one year following a Change of Control (as defined in the Sr. Exec. Employment Agreement) other than for “justifiable cause,” or if the senior executive resigns for “good reason,” we shall pay the senior executive an amount equal to twelve months of executive’s highest base salary in effect at any time during the six month period ending on the date of the Change of Control. This payment also is conditioned upon the senior executive’s execution of a general release. Payments made under this provision are to be reduced if and to the extent necessary to avoid any payments or benefits to senior executive being treated as “excess parachute payments” within the meaning of Internal Revenue Code Section 280G(b)(i).
The Sr. Exec. Employment Agreements contain confidentiality provisions pursuant to which each senior executive agrees not to disclose confidential information regarding our Company. The Sr. Exec. Employment Agreements also contain covenants pursuant to which each senior executive agrees, during the term of his employment and for a one-year period following the termination of his employment, not to have any connection with any business which is a specialty retailer that primarily distributes, sells or markets so-called “big and tall” apparel of any kind for men or which utilizes the “big and tall” retail or wholesale marketing concept as part of its business. The Sr. Exec. Employment Agreements also contain a “clawback” provision which provides for remedies in the event we learn after the senior executive’s termination by us other than for “justifiable cause” that the senior executive could have been terminated for “justifiable cause”. Subject to the implementation of final rules by the SEC, the Dodd-Frank Act requires that we implement a policy providing for the recovery of erroneously paid incentive-based compensation following a required accounting restatement. Once the final rules are issued by the SEC, we will revise, in a timely manner, the current clawback provision of our employment agreements.
Grants of Plan-Based Awards. The following table sets forth certain information with respect to plan-based awards granted to the Named Executive Officers in fiscal 2013.
| All Other | ||||||||||||||||||||||||||||||||||||||||||||||||
| Option Awards: | ||||||||||||||||||||||||||||||||||||||||||||||||
| Estimated Possible Payouts | Estimated Possible Payouts | All Other Stock | Number of | |||||||||||||||||||||||||||||||||||||||||||||
| Under | Under | Awards: Number | Securities | Exercise or | ||||||||||||||||||||||||||||||||||||||||||||
| Non-Equity Incentive Plan Awards | Equity Incentive Plan Awards |
of Shares of Stock | Underlying | Base Price of | Grant Date Fair | |||||||||||||||||||||||||||||||||||||||||||
| Threshold | Target | Maximum | Threshold | Target | Maximum | or Units | Options | Option Awards | Value of Stock and | |||||||||||||||||||||||||||||||||||||||
| Grant Date |
Approval Date | ($) | ($) | ($) | (#) | (#) | (#) | (#) | (#) | ($ / Sh) | Option Awards(3) | |||||||||||||||||||||||||||||||||||||
| David A. Levin |
||||||||||||||||||||||||||||||||||||||||||||||||
| -Annual Incentive Plan (1) |
4/23/2013 | $ | 405,600 | $ | 811,200 | $ | 1,216,800 | — | — | — | — | — | — | — | ||||||||||||||||||||||||||||||||||
| -2013-2016 LTIP (2) |
5/28/2013 | $ | 405,600 | $ | 811,200 | $ | 811,200 | 356,894 | 713,788 | 713,788 | — | — | $ | 5.04 | $ | 2,433,600 | ||||||||||||||||||||||||||||||||
| Dennis R. Hernreich |
||||||||||||||||||||||||||||||||||||||||||||||||
| -Annual Incentive Plan (1) |
4/23/2013 | $ | 310,960 | $ | 621,920 | $ | 932,880 | — | — | — | — | — | — | — | ||||||||||||||||||||||||||||||||||
| -2013-2016 LTIP (2) |
5/28/2013 | $ | 310,960 | $ | 621,920 | $ | 621,920 | 273,618 | 547,236 | 547,236 | — | — | $ | 5.04 | $ | 1,865,760 | ||||||||||||||||||||||||||||||||
| Kenneth M. Ederle |
||||||||||||||||||||||||||||||||||||||||||||||||
| -Annual Incentive Plan (1) |
4/23/2013 | $ | 55,192 | $ | 110,385 | $ | 165,577 | — | — | — | — | — | — | — | ||||||||||||||||||||||||||||||||||
| -2013-2016 LTIP (2) |
5/28/2013 | $ | 113,750 | $ | 227,500 | $ | 227,500 | 100,089 | 200,178 | 200,178 | — | — | $ | 5.04 | $ | 682,500 | ||||||||||||||||||||||||||||||||
| Robert S. Molloy |
||||||||||||||||||||||||||||||||||||||||||||||||
| -Annual Incentive Plan (1) |
4/23/2013 | $ | 56,875 | $ | 113,750 | $ | 170,625 | — | — | — | — | — | — | — | ||||||||||||||||||||||||||||||||||
| -2013-2016 LTIP (2) |
5/28/2013 | $ | 113,750 | $ | 227,500 | $ | 227,500 | 100,089 | 200,178 | 200,178 | — | — | $ | 5.04 | $ | 682,500 | ||||||||||||||||||||||||||||||||
| Brian S. Reaves |
||||||||||||||||||||||||||||||||||||||||||||||||
| -Annual Incentive Plan (1) |
4/23/2013 | $ | 48,125 | $ | 96,250 | $ | 144,375 | — | — | — | ||||||||||||||||||||||||||||||||||||||
| -2013-2016 LTIP (2) |
5/28/2013 | $ | 96,250 | $ | 192,500 | $ | 192,500 | 84,690 | 169,380 | 169,380 | — | — | $ | 5.04 | $ | 577,500 | ||||||||||||||||||||||||||||||||
| (1) | On April 23, 2013, the Compensation Committee approved the annual targets pursuant to our Annual Incentive Plan for fiscal 2013. The threshold, target and maximum payouts for each executive was estimated based on achieving 50%, 100% and 150% |
| of the payout targets set by the Compensation Committee. As discussed above, under “Compensation Discussion and Analysis – Components of Executive Compensation – 2013 Annual Incentive Plan,” the Compensation Committee established four separate targets: Adjusted EBITDA, Merchandise Margin and Net Debt, Customer Base Growth and DXL Comparable Sales. On March 5, 2014, the Compensation Committee determined that the only performance target achieved in fiscal 2013 was the DXL Comparable Sales target, which represented 12.5% of the total potential award. Accordingly, the Compensation Committee approved a payout of 114.4% for the DXL Comparable Sales performance target. The respective cash payment to each of the Named Executive Officers is included in the Summary Compensation Table (and the supplemental Discretionary and Incentive-Based Awards Table) for fiscal 2013. As a result of Mr. Hernreich’s termination of employment and in accordance with his employment agreement, Mr. Hernreich received a pro-rata payment of his award of $87,906, which was included in his total severance payment discussed above. |
| (2) | On May 28, 2013, the Compensation Committee approved the long-term targets pursuant to our 2013-2016 LTIP. Pursuant to the terms of the 2013-2016 LTIP, each participant in the plan was granted on May 28, 2013 an unearned and unvested award equal to four times their annual salary multiplied by their long-term incentive program percentage, which was 100% for Messrs. Levin and Hernreich and 70% for Messrs. Ederle, Molloy and Reaves. Each award consisted of 50% in shares of restricted stock, 25% in stock options and 25% in cash. In addition, 50% of each award is subject to time-based vesting and 50% is subject to performance-based vesting. The estimated target payout for each Named Executive Officer above was estimated assuming we achieve the performance targets and all time-based awards vest. The maximum payout is the same as the target because there is no increased payout beyond the target payout. The threshold payout assumes that the performance target is not met and that only the time-based awards are earned. Mr. Hernreich’s awards under the 2013-2016 LTIP were forfeited as a result of his termination of employment. |
| (3) | Represents the fair value of the equity awards granted on May 28, 2013 pursuant to the 2013-2016 LTIP. As discussed above, each participant received 50% of the unearned and unvested award in shares of restricted stock and 25% in stock options. For Stock Awards and Option Awards, the amounts reflect the fair value, as of grant date, of both performance and non-performance awards computed in accordance with FASB ASC Topic 718. The fair value of each stock option award is estimated as of the date of grant using a Black-Scholes valuation model. Additional information regarding the assumptions used to estimate the fair value of all stock option awards is included in Note A to Consolidated Financial Statements contained in our Annual Report on Form 10-K for the fiscal year ended February 1, 2014. |
Outstanding Equity Awards at Fiscal Year-End. The following table sets forth certain information with respect to outstanding equity awards held by the Named Executive Officers at the end of fiscal 2013.
2013 OUTSTANDING EQUITY AWARDS AT FISCAL YEAR-END
| Option Awards | Stock Awards | |||||||||||||||||||||||||||||||||||
| Number of Securities Underlying Unexercised Options (#) |
Number of Securities Underlying Unexercised Options (#) |
Equity Incentive Plan Awards: Number of Securities Underlying Unexercised Unearned Options (#) |
Option Exercise Price ($) |
Option Expiration Date |
Number of Shares or Units of Stock That Have Not Vested (#) |
Market Value of Shares or Units of Stock That Have Not Vested ($)(1) |
Equity Incentive Plan Awards: Number of Unearned Shares, Units or Other Rights That Have Not Vested (#) |
Equity Incentive Plan Awards: Market or Payout Value of Unearned Shares, Units or Other Rights That Have Not Vested ($) |
||||||||||||||||||||||||||||
| Name |
Exercisable | Unexercisable | ||||||||||||||||||||||||||||||||||
| David A. Levin |
75,000 | $ | 6.24 | 5/24/2014 | ||||||||||||||||||||||||||||||||
| 391,884 | (2) | $ | 5.04 | 5/28/2023 | 321,904 | (2) | $ | 1,731,844 | ||||||||||||||||||||||||||||
| 34,203 | (3) | $ | 184,012 | |||||||||||||||||||||||||||||||||
| Dennis R. Hernreich |
21,988 | $ | 6.24 | 5/24/2014 | ||||||||||||||||||||||||||||||||
| Kenneth M. Ederle |
10,000 | $ | 7.52 | 10/22/2017 | ||||||||||||||||||||||||||||||||
| 109,902 | (2) | $ | 5.04 | 5/28/2023 | 90,276 | (2) | $ | 485,685 | ||||||||||||||||||||||||||||
| 3,984 | (3) | $ | 21,434 | |||||||||||||||||||||||||||||||||
| Robert S. Molloy |
10,000 | $ | 4.13 | 2/8/2018 | ||||||||||||||||||||||||||||||||
| 20,606 | $ | 3.19 | 3/19/2020 | |||||||||||||||||||||||||||||||||
| 13,955 | (3) | $ | 4.19 | 3/16/2021 | ||||||||||||||||||||||||||||||||
| 109,902 | (2) | $ | 5.04 | 5/28/2023 | 90,276 | (2) | $ | 485,685 | ||||||||||||||||||||||||||||
| 9,592 | (3) | $ | 51,605 | |||||||||||||||||||||||||||||||||
| Brian S. Reaves |
12,248 | (3) | 4,935 | (3) | $ | 4.19 | 3/16/2021 | |||||||||||||||||||||||||||||
| 92,992 | (2) | $ | 5.04 | 5/28/2023 | 76,388 | (2) | $ | 410,967 | ||||||||||||||||||||||||||||
| 3,428 | (3) | $ | 18,443 | |||||||||||||||||||||||||||||||||
| (1) | The value of shares was calculated using the closing price of our common stock of $5.38 on January 31, 2014. |
| (2) | These equity awards represent awards granted on May 28, 2013 in connection with our 2013-2016 LTIP. The awards are unearned and unvested as of February 1, 2014. Of the unearned and unvested stock options and restricted shares, 50% of each amount is subject to performance-based vesting and 50% is subject to time-based vesting. The time-vested awards will vest 20% at the end of fiscal 2014, 40% at the end of fiscal 2015 and 40% at the end of fiscal 2016. For the performance-based portion of the awards to vest, the Company much achieve, during any rolling four fiscal quarters that ends on or before the end of fiscal 2015, revenue of at least $550 million and an operating margin of not less than 8.0%. If the target is not achieved by the end of fiscal 2015, then the Company must achieve revenues of at least $600 million and an operating margin of not less than 8.0% by the end of fiscal 2016 in order for the performance-based awards to vest. At February 1, 2014, the performance targets under the 2013-2016 LTIP were deemed not probable. |
| (3) | These equity awards represent awards granted on March 16, 2011 in connection with the payout under our LTIP for fiscal 2010 and were in accordance with each executive’s irrevocable election. These irrevocable elections required that at least 50% of any award granted be in the form of equity. The remaining shares represent the last tranche which vested on March 16, 2014. |
Option Exercises and Stock Vested Table. The following table sets forth information for the Named Executive Officers with respect to the exercise of option awards and the vesting of stock awards during fiscal 2013.
2013 OPTION EXERCISES AND STOCK VESTED
| Option Awards | Stock Awards | |||||||||||||||
| Name |
Number of Shares Acquired on Exercise (#) |
Value Realized on Exercise ($)(1) |
Number of Shares Acquired on Vesting (#) |
Value Realized on Vesting ($)(1) |
||||||||||||
| David A. Levin |
75,000 | $ | 80,250 | 85,014 | $ | 416,745 | ||||||||||
| Dennis R. Hernreich |
27,520 | $ | 37,392 | 117,244 | $ | 574,503 | ||||||||||
| Kenneth M. Ederle |
10,000 | $ | 23,700 | 6,641 | $ | 32,674 | ||||||||||
| Robert S. Molloy |
— | — | 16,717 | $ | 82,034 | |||||||||||
| Brian S. Reaves |
— | — | 10,094 | $ | 56,930 | |||||||||||
| (1) | Represents the difference between the exercise price and fair market value of the common stock on the date of exercise. |
Pension Benefits
None of our Named Executive Officers was a participant in any pension plan and, therefore, have no accumulated benefits.
401(k) Plans
We have two defined contribution plans, the Company’s 401(k) Salaried Savings Plan and the Company’s 401(k) Hourly Savings Plan (the “401(k) Plans”). The 401(k) Plans cover all eligible employees who are at least 21 years of age and have completed the required months of service, which is six months for the 401(k) Salaried Savings Plan and 1000 hours and twelve months for the 401(k) Hourly Savings Plan. Effective January 1, 2008, we adopted the safe harbor matching and vesting provisions permitted under the Pension Protection Act of 2006 for its 401(k) Plans. Accordingly, we currently match 100% of the first 1% of deferred compensation and 50% of the next 5% (with a maximum contribution of 3.5% of eligible compensation). Our Named Executive Officers are eligible to participate in the 401(k) Plans, and the amount of any Company match to our Named Executive Officers are set forth above in the “All Other Compensation” table.
Key Man Insurance
We have key man life insurance policies on the lives of Messrs. Levin and Hernreich, each in the amount of $2,000,000. We will continue to carry our key man life insurance policy on Mr. Hernreich through the end of his severance period.
Director Compensation
The Compensation Committee is responsible for reviewing and making recommendations to our Board of Directors with respect to the compensation paid to our non-employee directors.
In January 2010, the Company established a Non-Employee Director Stock Purchase Plan to provide a convenient method for its non-employee directors to acquire shares of the Company’s common stock at fair market value by voluntarily electing to receive shares of common stock in lieu of cash for service as a director. The substance of this plan is now encompassed within the Company’s Amended and Restated Non-Employee Director Compensation Plan (the “Non-Employee Director Compensation Plan”). There are 500,000 shares authorized for issuance under this plan for the sole purpose of satisfying elections to receive shares of common stock in lieu of cash for service as a director, of which 396,722 shares remain available for future issuances at February 1, 2014. The Non-Employee Director Compensation Plan is a stand-alone plan and is not a sub-plan under our the 2006 Incentive Compensation Plan (the “2006 Plan”). Accordingly, shares issued under this plan do not reduce the shares available for issuance under the 2006 Plan.
With respect to the compensation of our non–employee directors, the Compensation Committee’s goal is to maintain a level of compensation paid to our non-employee directors that is in the median of the companies within our peer group as well as similarly-sized companies. The Compensation Committee has historically retained Sibson Consulting to review compensation for our non-employee directors in comparison to our then peer group. As described above in “Compensation Discussion and Analysis – Compensation Committee Process,” the Compensation Committee has the authority to retain compensation consultants and other outside advisors, without Board or management approval, to assist it in carrying out its duties, including the evaluation of compensation for our non–employee directors. The Compensation Committee may accept, reject or modify any recommendations by compensation consultants or other outside advisors.
Through fiscal 2013, our Non-Employee Director Compensation Plan provided that non-employee directors receive an annual retainer of $20,000 which is paid in quarterly installments of $5,000. Each director receives $1,500 for participation in each meeting of the Board and its committees and $750 for participation in each telephonic meeting. In addition, the Chairmen of the Audit Committee, Compensation Committee and Nominating and Corporate Governance Committee receive an annual payment of $10,000, $5,000 and $5,000, respectively, which is paid quarterly. Upon each non-employee director’s re-election to the Board, each director would receive $82,250. Upon the initial election to the Board, a non-employee director will receive a stock option grant of 15,000 shares under the 2006 Plan.
In June 2013, Sibson Consulting completed a review of compensation paid to our non-employee directors. While the total compensation earned by our directors was still in line with our peer group and considered competitive, suggestions were made to our payment structure. Pursuant to Sibson Consulting’s suggestion, beginning in fiscal 2014, the non-employee director’s re-election fee of $82,250 will become part of the current retainer of $20,000. The total revised retainer of $102,250 will be paid in quarterly installments of $25,562.50. In addition, it is recommended, but not required, that beginning in fiscal 2014, each non-employee director elect to receive 50% of his or her compensation in equity until such time that the fair value of equity held is equal to three times the annual retainer, or $252,750 (as valued each November).
We believe that our Non-Employee Director Compensation Plan will support our ongoing efforts to attract and retain exceptional directors to provide strategic guidance to our Company. We believe that the total compensation that our non-employee directors receive is in line with our current peer group.
Director Compensation Table
The following table sets forth the compensation paid to our directors during fiscal 2013. David A. Levin is not included in the following table as he is a Named Executive Officer and, accordingly, received no compensation for his services as a director. The compensation received by Mr. Levin as an employee of our Company is shown above in the “Summary Compensation Table.”
2013 DIRECTOR COMPENSATION TABLE
| Name |
Fees Earned or Paid in Cash ($) (1) |
Stock Awards ($)(2) |
Option Awards ($) (2) |
Non-Equity Incentive Plan Compensation ($) |
Change in Pension Value and Nonqualified Deferred Compensation Earnings ($) |
All Other Compensation ($) |
Total ($) |
|||||||||||||||||||||
| Seymour Holtzman, Chairman (3) |
— | — | — | — | — | $ | 575,000 | (3) | $ | 575,000 | ||||||||||||||||||
| Alan S. Bernikow |
$ | 126,250 | — | — | — | — | — | $ | 126,250 | |||||||||||||||||||
| Jesse Choper |
$ | 154,000 | — | — | — | — | — | $ | 154,000 | |||||||||||||||||||
| John E. Kyees |
$ | 118,750 | — | — | — | — | $ | 118,750 | ||||||||||||||||||||
| Willem Mesdag |
— | — | $ | 29,250 | — | — | — | $ | 29,250 | |||||||||||||||||||
| Ward K. Mooney |
$ | 124,750 | — | — | — | — | — | $ | 124,750 | |||||||||||||||||||
| George T. Porter, Jr. |
$ | 130,500 | — | — | — | — | — | $ | 130,500 | |||||||||||||||||||
| Mitchell S. Presser |
$ | 120,250 | — | — | — | — | — | $ | 120,250 | |||||||||||||||||||
| Ivy Ross |
$ | 112,750 | — | — | — | — | — | $ | 112,750 | |||||||||||||||||||
| (1) | Messrs. Bernikow, Choper and Ross received all fees paid during fiscal 2013 in cash. Messrs. Mooney and Presser elected to receive all fees paid during fiscal 2013 in unrestricted shares of our common stock. Mr. Porter elected to receive all fees paid |
| in cash, with the exception of his annual re-election which he elected to receive 50% in cash and 50% in stock options. Mr. Presser elected to receive all fees in a combination of cash, unrestricted shares and stock options. The number of shares issued as payment for an earned director fee is determined by taking the director fee earned and dividing by the closing price of our common stock on the grant date. The number of options issued was determined by calculating the fair value on the date of grant using a Black-Scholes valuation model and in accordance with Financial Accounting Standards Board (“FASB”) Accounting Standards Codification (“ASC”) Topic 718 (“ASC Topic 718”). This fair value was then divided into the director fee earned to determine the number of options to grant. For quarterly retainer fees, the grant date is the first business day of each respective quarter. For meetings, the grant date is the last business day of the month in which the meeting occurred and for a director’s re-election to the board, the grant date is the last business day of the month in which such re-election occurs. In addition to compensation received for board meetings and committee meetings, Mr. Choper also received a cash payment of $15,000 for serving as Chairman of both the Audit Committee and the Nominating and Corporate Governance Committee. Mr. Porter also received a cash payment of $5,000 for serving as Chairman of the Compensation Committee. Mr. Holtzman did not receive any payment for director meetings. |
| (2) | Mr. Mesdag was elected a director of the Company on January 29, 2014 and, accordingly, received a stock option grant to purchase 15,000 shares of Company stock. The amount in the Option Award column reflects the aggregate grant date fair value of this stock options award computed in accordance with ASC Topic 718. The fair value of this stock options award is estimated as of the date of grant using a Black-Scholes valuation model. Additional information regarding the assumptions used to estimate the fair value of all stock option awards is included in Note A to Consolidated Financial Statements contained in our Annual Report on Form 10-K for the fiscal year ended February 1, 2014. There were no other Stock Awards or Options Awards to any of the directors for fiscal 2013. Each director had the following number of stock options outstanding at February 1, 2014: Mr. Holtzman: 560,000; Mr. Bernikow: 40,000; Mr. Choper: 40,000; Mr. Kyees: 43,648; Mr. Mesdag: 15,000; Mr. Mooney: 25,000; Mr. Porter: 51,636; Mr. Presser: 25,000 and Ms. Ross: 15,000. |
| (3) | During fiscal 2013, Mr. Holtzman received compensation from us both directly (as an employee of our Company) and indirectly (as a consultant pursuant to a consulting agreement we had with Jewelcor Management Inc. (“JMI”)). Mr. Holtzman is the president and chief executive officer and the indirect majority shareholders of JMI. There were no services performed on behalf of the Company by JMI, other than those performed by Mr. Holtzman. All Other Compensation for Mr. Holtzman includes annual compensation paid to Mr. Holtzman of $551,000 pursuant to the JMI consulting agreement with the Company and salary of $24,000. See below, under “Chairman Compensation”, for a detailed discussion. |
Chairman Compensation
In fiscal 2006, our Compensation Committee engaged Sibson Consulting to review our current compensation and benefit program for our executives. As part of that review, the firm also reviewed and evaluated the compensation that we paid to Mr. Holtzman, either directly or indirectly through JMI. Mr. Holtzman is the president and chief executive officer and, together with his wife, indirectly, the majority shareholder of JMI. At that time, the Compensation Committee viewed the services that Mr. Holtzman provided to us as being comparable to that of our Key Executives, and accordingly, the aggregate compensation package paid to Mr. Holtzman (both directly and indirectly) was determined using many of the same metrics and benchmarks as for our Key Executives. The consulting company reviewed the overall compensation paid to Mr. Holtzman, both directly and indirectly, together with the compensation paid to both Mr. Levin and Mr. Hernreich and concluded that the total aggregate compensation paid to these three individuals, including JMI, was comparable to similar management teams within our peer group and the compensation in aggregate was at the peer median.
Pursuant to the consulting agreement, which was most recently amended in April 2011, Mr. Holtzman receives, in aggregate, annual consulting compensation of $551,000, payable in cash. In addition, Mr. Holtzman receives employment compensation of $24,000, payable in cash. If we engage Mr. Holtzman’s services to assist us in a specific and significant corporate transaction or event, the Compensation Committee, at its discretion, has the right to grant Mr. Holtzman a bonus for his additional services. No such bonus was granted during fiscal 2013. Subsequent to the end of fiscal 2013, Mr. Holtzman voluntarily reduced his consulting and employment compensation to $396,750, effective February 1, 2014.
Section 6.2(A) of our By-Laws states that the Chairman of the Board is to preside at all meetings of the Board of Directors and stockholders of the Corporation, generally supervise the affairs of the Corporation and see that all orders and resolutions of the Board of Directors are carried into effect, and, together with the President, have general supervision and direction of the other officers, employees and agents of the Corporation, subject to the control of the Board of Directors. The By-Laws further state that the Chairman has responsibility for supervision of the Corporation’s investor relations, financial and legal affairs, and shall have such other powers and perform such other duties and functions as may from time to time be assigned by the Board of Directors.
Compensation Committee Interlocks and Insider Participation
For fiscal 2013, the members of the Compensation Committee were Messrs. Choper, Mooney and Porter. Persons serving on the Compensation Committee had no relationships with our Company in fiscal 2013 other than their relationship to us as directors entitled to the receipt of standard compensation as directors and members of certain committees of the Board and their relationship to us as beneficial owners of shares of our common stock and options exercisable for shares of common stock. No person serving on the Compensation Committee or on the Board of Directors is an executive officer of another entity for which an executive officer of ours serves on such entity’s board of directors or compensation committee.
Item 12. Security Ownership of Certain Beneficial Owners and Management and Related Stockholder Matters
Security Ownership of Certain Beneficial Owners
The following table sets forth certain information with respect to persons known to us to be the beneficial owners of more than five percent of the issued and outstanding shares of our common stock as of May 7, 2014. We were informed that, except as indicated, each person has sole voting and investment power with respect to all shares of our common stock shown as beneficially owned by such person, subject to community property laws where applicable.
| Name and Address of Beneficial Owner |
Number of Shares Beneficially Owned |
Percent of Class (1) |
||||||
| Willem Mesdag |
7,527,354 | (2) | 14.90 | % | ||||
| c/o Red Mountain Capital Partners, LLC |
||||||||
| 10100 Santa Monica Boulevard, Suite 925 |
||||||||
| Los Angeles, California 90067 |
||||||||
| RBC Global Asset Management (U.S.) Inc. |
5,104,103 | (3) | 10.10 | % | ||||
| 100 South Fifth Street |
||||||||
| Suite 2300 |
||||||||
| Minneapolis, Minnesota 55402 |
||||||||
| Seymour Holtzman |
5,035,658 | (4) | 9.86 | % | ||||
| 100 N. Wilkes Barre Blvd. |
||||||||
| Wilkes Barre, Pennsylvania 18702 |
||||||||
| Glenhill Advisors, LLC |
4,470,449 | (5) | 8.85 | % | ||||
| Glenn J. Krevlin |
||||||||
| Glenhill Capital Advisors, LLC |
||||||||
| Glenhill Capital Management, LLC |
||||||||
| Glenhill Capital Overseas Master Fund, LP |
||||||||
| 600 Fifth Avenue, 11th Floor |
||||||||
| New York, New York 10020 |
||||||||
| Advisory Research, Inc. |
4,094,086 | (6) | 8.10 | % | ||||
| 180 N. Stetson |
||||||||
| Chicago, Illinois 60601 |
||||||||
| Coliseum Capital Management, LLC |
2,941,346 | (7) | 5.82 | % | ||||
| Metro Center |
||||||||
| 1 Station Place, 7th Floor South |
||||||||
| Stamford, Connecticut 06902 |
||||||||
| BlackRock, Inc. |
||||||||
| 40 East 52nd Street |
||||||||
| New York, NY 10022 |
2,630,372 | (8) | 5.21 | % | ||||
| (1) | Beneficial ownership is determined in accordance with the rules of the SEC and generally includes voting or investment power with respect to securities. In computing the number of shares beneficially owned by a person and the percentage ownership of |
| that person, shares of our common stock subject to options and warrants held by that person that are currently exercisable, or that become exercisable within 60 days, are deemed outstanding. Such shares, however, are not deemed outstanding for the purpose of computing the percentage ownership of any other person. Percentage ownership is based on 50,526,787 shares of our common stock outstanding as of May 7, 2014, plus securities deemed to be outstanding with respect to individual stockholders pursuant to Rule 13d-3(d)(1) under the Exchange Act. |
| (2) | Based on Amendment No. 5 to Schedule 13D, dated March 31, 2014, stating that Red Mountain Capital Partners LLC, a Delaware limited liability company (“RMCP LLC”), Red Mountain Partners, L.P., a Delaware limited partnership (“RMP”), RMCP GP LLC, a Delaware limited liability company (“RMCP GP”), Red Mountain Capital Management, Inc., a Delaware corporation (“RMCM”), and Willem Mesdag, a natural person and citizen of the United States of America were the beneficial owners of the number of shares of common stock set forth opposite their names in the table. RMP has the sole power to vote or direct the vote, and the sole power to disclose or direct the disposition of these shares. RMCP GP, RMCP LLC, RMCM and Mr. Mesdag may be deemed to control RMP and may be deemed to beneficially own, and to have the power to vote or direct the vote, or dispose or direct the disposition of the these shares beneficially owned by RMP. Mr. Mesdag disclaims beneficial ownership of the shares beneficially owned by RMP, and RMCM disclaims beneficial ownership of all these shares. Includes 5,000 shares subject to stock options exercisable within 60 days held directly by Willem Mesdag. |
| (3) | Based on Amendment No. 5 to Schedule 13G, dated December 31, 2013, stating that RBC Global Asset Management (U.S.) Inc. was the beneficial owner of the number of shares of common stock set forth opposite its name in the table. |
| (4) | Represents 4,475,658 outstanding shares of common stock and 560,000 shares subject to options exercisable within 60 days. |
| (5) | Based on Amendment No. 6 to Schedule 13G, dated December 31, 2013, stating that Glenhill Advisors, LLC, Glenn J. Krevlin, Glenhill Capital Advisors, LLC, Glenhill Capital Management, LLC and Glenhill Capital Overseas Master Fund, LP were the beneficial owners of the number of shares of common stock set forth opposite their names in the table (except that Glenhill Capital Overseas Master Fund, LP indicates beneficial ownership of only 2,613,573 shares). Glenn J. Krevlin is the managing member and control person of Glenhill Advisors, LLC and is the sole shareholder of Krevlin Management, Inc. Krevlin Management, Inc. is the managing member of Glenhill Capital Advisors, LLC which is the investment manager of Glenhill Capital Overseas Master Fund, LP and Glenhill Concentrated Long Master Fund LLC, each a security holder of the Company. Glenhill Advisors, LLC is the managing member of Glenhill Capital Management LLC. Glenhill Capital Management, LLC is the managing member of Glenhill Concentrated Long Master Fund, LLC and sole shareholder of Glenhill Capital Overseas GP, Ltd, which is the general partner of Glenhill Capital Overseas Master Fund, LP. |
| (6) | Based on Schedule 13G, dated December 31, 2013, stating that Advisory Research, Inc., a wholly-owned subsidiary of Piper Jaffray Companies, is the beneficial owner of the number of shares of common stock set forth opposite its name in the table. |
| (7) | Based on Amendment No. 2 to Schedule 13G, dated as of December 31, 2013, stating that Coliseum Capital Management, LLC was the beneficial owner of the number of shares of common stock set forth opposite its name in the table. |
| (8) | Based on Amendment No. 2 to Schedule 13G, dated as of December 31, 2013, stating that BlackRock, Inc. was the beneficial owner of the number of shares of common stock set forth opposite its name in the table. |
Security Ownership of Management
The following table sets forth certain information as of May 7, 2014, with respect to our directors, our Named Executive Officers (as defined above under “Executive Compensation”) and our directors and executive officers as a group. Except as indicated, each person has sole voting and investment power with respect to all shares of our common stock shown as beneficially owned by such person, subject to community property laws where applicable.
| Name and Title |
Number of Shares Beneficially Owned |
Percent of Class (1) |
||||||
| Seymour Holtzman |
5,035,658 | (2) | 9.86 | % | ||||
| Chairman of the Board |
||||||||
| David A. Levin |
1,297,526 | (3) | 2.56 | % | ||||
| Chief Executive Officer, President and Director |
||||||||
| Dennis R. Hernreich |
195,510 | (4) | * | |||||
| Former Executive Vice President, Chief Financial Officer, |
||||||||
| Chief Operating Officer, Treasurer and Secretary |
||||||||
| Ken M. Ederle |
137,921 | (5) | * | |||||
| Senior Vice President and Chief Merchandising Officer |
||||||||
| Robert S. Molloy |
198,367 | (6) | * | |||||
| Senior Vice President, General Counsel and Secretary |
||||||||
| Brian S. Reaves |
109,267 | (7) | * | |||||
| Senior Vice President, Store Sales and Operations |
||||||||
| Alan S. Bernikow, Director |
79,813 | (8) | * | |||||
| Jesse Choper, Director |
121,169 | (8) | * | |||||
| John E. Kyees, Director |
38,229 | (9) | * | |||||
| Willem Mesdag, Director |
7,527,354 | (10) | 14.90 | % | ||||
| Ward K. Mooney, Director |
66,826 | (11) | * | |||||
| George T. Porter, Jr., Director |
129,165 | (12) | * | |||||
| Mitchell S. Presser, Director |
161,979 | (11) | * | |||||
| Ivy Ross, Director |
12,445 | (13) | * | |||||
| Directors and executive officers as a group (21 persons) |
15,784,939 | (13) | 30.64 | % | ||||
| * | Less than 1% |
| (1) | Beneficial ownership is determined in accordance with the rules of the SEC and generally includes voting or investment power with respect to securities. In computing the number of shares beneficially owned by a person and the percentage ownership of that person, shares of our common stock subject to options and warrants held by that person that are currently exercisable, or that become exercisable within 60 days, are deemed outstanding. Such shares, however, are not deemed outstanding for the purpose of computing the percentage ownership of any other person. Percentage ownership is based on 50,526,787 shares of our common stock outstanding as of May 7, 2014, plus securities deemed to be outstanding with respect to individual stockholders pursuant to Rule 13d-3(d)(1) under the Exchange Act. |
| (2) | Mr. Holtzman may be deemed to have shared voting and investment power over 5,035,658 shares of common stock, which includes 560,000 shares subject to stock options exercisable within 60 days. |
| (3) | Includes 75,000 shares subject to stock options exercisable within 60 days, 160,952 shares of unvested restricted stock, 160,952 shares of unvested restricted stock subject to performance pursuant to the Long-Term Incentive Plan 2013-2016 (“LTIP 2013-2016”) and 3,539 shares held pursuant to his 401(k) Plan account. |
| (4) | Based on a Form 4 filed on December 3, 2013, Mr. Hernreich’s direct ownership was 481,636 shares. This direct ownership was reduced by the 286,126 shares of unvested restricted stock which was forfeited on January 30, 2014 in connection with his termination of employment. |
| (5) | Includes 10,000 shares subject to stock options exercisable within 60 days, 45,138 shares of unvested restricted stock and 45,138 shares of unvested restricted stock subject to performance pursuant to the LTIP 2013-2016. |
| (6) | Includes 44,561 shares subject to stock options exercisable within 60 days, 45,138 shares of unvested restricted stock, 45,138 shares of unvested restricted stock subject to performance pursuant to the LTIP 2013-2016 and 3,900 shares held pursuant to his 401(k) Plan account. |
| (7) | Includes 17,183 shares subject to stock options exercisable within 60 days, 38,194 shares of unvested restricted stock, 38,194 shares of unvested restricted stock subject to performance pursuant to the LTIP 2013-2016 and 2,633 shares held pursuant to his 401(k) Plan account. |
| (8) | Includes 40,000 shares subject to stock options exercisable within 60 days. |
| (9) | Includes 36,505 shares subject to stock options exercisable within 60 days. |
| (10) | Includes 5,000 shares subject to stock options exercisable within 60 days. Mr. Mesdag is the president, sole executive officer, sole director and sole shareholder of Red Mountain Capital Management, Inc. With the exception of the stock options, all shares are held by Red Mountain Partners, L.P., a wholly-owned subsidiary of Red Mountain Capital Management, Inc. Mr. Mesdag, by virtue of his direct or indirect control of Red Mountain Partners, L.P., is deemed to beneficially own all of the securities reported held by Red Mountain Partners, L.P. |
| (11) | Includes 25,000 shares subject to stock options exercisable within 60 days. |
| (12) | Includes 38,879 shares subject to stock options exercisable within 60 days. |
| (13) | Includes 10,000 shares subject to stock options exercisable within 60 days. |
| (14) | Includes 995,381 shares subject to stock options exercisable within 60 days, 569,631 of unvested shares of restricted stock, 567,964 shares of unvested restricted stock subject to performance pursuant to the LTIP 2013-2016 and 17,266 shares held pursuant to respective 401(k) Plan accounts. |
EQUITY COMPENSATION PLAN INFORMATION
The following is a summary of information with respect to our equity compensation plans as of February 1, 2014:
| Plan category |
Number of securities to be issued upon exercise of outstanding options, warrants and rights (a) |
Weighted- average exercise price of outstanding options, warrants and rights (b) |
Number of securities remaining available for future issuance under equity compensation plans (excluding securities reflected in column (a)) (c) |
|||||||||
| Equity compensation plans approved by security holders (1) |
3,633,344 | $ | 5.42 | 1,206,540 | (3) | |||||||
| Equity compensation plans not approved by security holders (2) |
— | — | 396,722 | |||||||||
|
|
|
|
|
|
|
|||||||
| Total |
3,633,344 | $ | 5.42 | 1,603,262 | (3) | |||||||
|
|
|
|
|
|||||||||
| (1) | During fiscal 2013, we had one stockholder-approved equity compensation plan, our 2006 Incentive Compensation Plan (as amended, the “2006 Plan”). Pursuant to the 2006 Plan, at February 2, 2014, we had a total of 7,250,000 shares authorized for issuance, of which 1,206,540 shares remained available for future issuances. At February 1, 2014, we had 2,721,569 options outstanding. We also had 911,775 options still outstanding as part of our 1992 Stock Incentive Plan (the “1992 Plan”). No further grants can be made under the 1992 Plan. |
Of the 2,721,569 options outstanding at February 1, 2014, approximately 1,156,894 options are subject to the achievement of performance targets and 1,156,894 are time-vested awards, with the first 20% not vesting until the end of fiscal 2014. At February 1, 2014, the performance targets were not deemed probable and as a result no compensation expense has been recognized as of February 1, 2014. See “Compensation Discussion and Analysis- Components of Executive Compensation – Long- term performance based plans” for more information.
| (2) | Pursuant to our Amended and Restated Non-Employee Director Compensation Plan (“Director Plan”), we have 500,000 shares authorized for stock issuances in lieu of cash director fees, of which 396,722 shares remained available at February 1, 2014. |
| (3) | Our 2006 Plan includes a limitation of 4,250,000 shares that may be issued in the form of restricted stock, deferred stock, performance awards or other stock-based awards. At February 1, 2014, 963,109 shares remained subject to this limitation. |
Item 13. Certain Relationships and Related Transactions, and Director Independence
Seymour Holtzman/Jewelcor Management, Inc.(JMI)
During fiscal 2013, Seymour Holtzman, our Chairman of the Board of Directors, was compensated by us both directly (as an employee of our Company) and indirectly (as the president and chief executive officer and, together with his wife, indirectly, the majority shareholder of JMI). A complete summary of all compensation and consulting fees paid to Mr. Holtzman is described above under Item 11, “Executive Compensation – 2013 Director Compensation Table” and “Chairman Compensation.”
Review, Approval or Ratification of Transactions with Related Persons
Through JMI, Mr. Holtzman has received consulting compensation from the Company pursuant to a consulting agreement originally entered into with JMI in October 1999 and most recently amended April 2011. Due to Mr. Holtzman’s role as our Chairman of the Board of Directors and the relevance of the services he provides on a consulting basis, our Compensation Committee has had the primary responsibility for reviewing and approving all amendments to the consulting agreement since March 2000.
Our Audit Committee Charter, which was adopted in June 2003, provides that our Audit Committee shall review all related party transactions on an ongoing basis and all such transactions must be approved by the Audit Committee, to the extent required by the Sarbanes–Oxley Act of 2002, the Securities Exchange Commission and NASDAQ. Because NASDAQ provides that such oversight can be conducted by either a company’s audit committee or another independent body of the board of directors, the Audit Committee determined that due to the nature of the consulting agreement with JMI the review and approval of all transactions pursuant to this arrangement should continue to be the primary responsibility of the Compensation Committee. Over the years, the Compensation Committee, at its discretion, has at times taken its recommendations, as they relate to the JMI consulting agreement, to the Board of Directors for ratification (without participation from Seymour Holtzman). For all other related party transactions, the review and approval of such transactions is the responsibility of our Audit Committee.
Director Independence
Our Board of Directors is currently comprised of ten members. A majority of the members of the Board are “independent” under the rules of NASDAQ. The Board has determined that the following directors are independent: Messrs. Bernikow, Choper, Mesdag, Mooney, Porter, Presser and Ross. Mr. Kyees, who served as a member of the Audit Committee, was considered independent until February 2, 2014, when he assumed the position of Interim Chief Financial Officer. Mr. Mesdag filled Mr. Kyees position on the Audit Committee.
Item 14. Principal Accounting Fees and Services
The Audit Committee engaged KPMG LLP to serve as our independent registered public accounting firm during the fiscal year ended February 1, 2014. KPMG LLP has served as the Company’s independent registered public accounting firm since June 6, 2013. Ernst & Young LLP served as the Company’s independent registered accounting firm from October 2000 to June 6, 2013.
Principal Accounting Fees and Services
The following table sets forth the fees accrued or paid to the Company’s independent registered accounting firms for the fiscal years ended February 1, 2014 (“fiscal 2013”) and February 2, 2013 (“fiscal 2012”):
| KPMG LLP Fiscal 2013 |
Ernst & Young LLP Fiscal 2012 |
|||||||
| Audit fees (1) |
$ | 484,073 | $ | 585,681 | ||||
| Audit-related fees (2) |
— | — | ||||||
| Tax fees (3) |
— | — | ||||||
| Other fees (4) |
1,650 | 1,995 | ||||||
|
|
|
|
|
|||||
| Total fees |
$ | 485,723 | $ | 587,676 | ||||
|
|
|
|
|
|||||
| (1) | Audit fees relate to professional services rendered in connection with the audits of our financial statements included in our Annual Reports on Form 10-K for fiscal 2013 and fiscal 2012, for services performed related to compliance with Section 404 of the Sarbanes-Oxley Act of 2002, reviews of the financial statements included in each of our Quarterly Reports on Form 10-Q and for services performed in connection with our response to a comment letter received from the SEC in fiscal 2012. |
| (2) | Audit-related fees, if any, comprise fees for professional services that reasonably relate to the performance of the audit or review of our financial statements. |
| (3) | Tax fees, if any, relate to professional services rendered in comment with tax audits or tax planning services. |
| (4) | Other fees relate to an annual fee for online accounting research tools. |
Pre-Approval of Services by Independent Auditors
The Audit Committee has adopted a policy governing the provision of audit and non-audit services by our independent registered public accounting firm. Pursuant to this policy, the Audit Committee will consider annually and, if appropriate, approve the provision of audit services (including audit review and attest services) by its independent registered public accounting firm and consider and, if appropriate, pre-approve the provision of certain defined permitted non-audit services within a specified dollar limit. It will also consider on a case-by-case basis and, if appropriate, approve specific engagements that do not fit within the definition of pre-approved services or established fee limits.
The policy provides that any proposed engagement that does not fit within the definition of a pre-approved service or is not within the fee limits must be presented to the Audit Committee for consideration at its next regular meeting or to the Chairman of the Audit Committee in time sensitive cases. The Audit Committee will regularly review summary reports detailing all services (and related fees and expenses) being provided to us by the independent registered public accounting firm.
All of the services provided under Audit Fees, Audit-Related Fees, Tax Fees and All Other Fees are approved by the Audit Committee.
PART IV.
Item 15. Exhibits, Financial Statement Schedules
15(a)(3) Exhibits
Index to Exhibits
| 31.1 | Certification of Chief Executive Officer of the Company pursuant to Rule 13a-14(a) under the Securities Exchange Act of 1934. | |
| 31.2 | Certification of Chief Financial Officer of the Company pursuant to Rule 13a-14(a) under the Securities Exchange Act of 1934. | |
SIGNATURES
Pursuant to the requirements of Section 13 or 15(d) of the Securities Exchange Act of 1934, the Company has duly caused this report to be signed on its behalf by the undersigned, thereunto duly authorized.
| DESTINATION XL GROUP, INC. | ||||||
| June 2, 2014 | ||||||
| By: | /s/ DAVID A. LEVIN | |||||
| David A. Levin President and Chief Executive Officer | ||||||
| /s/ PETER H. STRATTON, JR. | ||||||
| Peter H. Stratton, Jr. | ||||||
| Senior Vice President, Chief Financial Officer and Treasurer | ||||||