Attached files
| file | filename |
|---|---|
| 8-K - 8-K CURRENT REPORT - Campus Crest Communities, Inc. | v380359_8k.htm |
| EX-99.1 - EXHIBIT 99.1 - Campus Crest Communities, Inc. | v380359_ex99-1.htm |

June 2014 NAREIT – New York
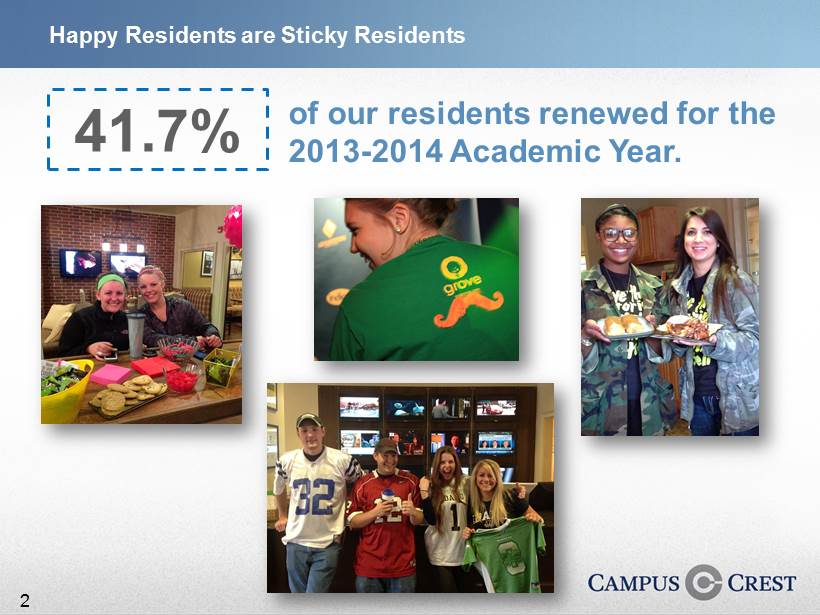
Happy Residents are Sticky Residents 41.7% of our residents renewed for the 2013 - 2014 Academic Year. 2
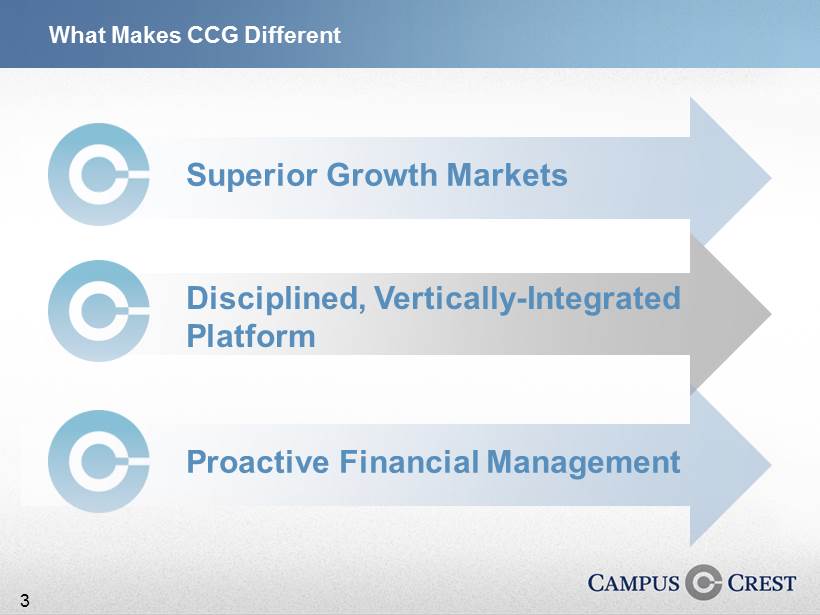
What Makes CCG Different Superior Growth Markets Drive consistent NOI growth through operational excellence Create value through a disciplined development process that utilizes the Company’s vertical integration Opportunistically seek redevelopment opportunities in high - barrier - to - entry markets Maintain financial flexibility by accessing most attractive sources of capital to fund growth Balance economic success with social and environmental stewardship Disciplined, Vertically - Integrated Platform Proactive Financial Management 3
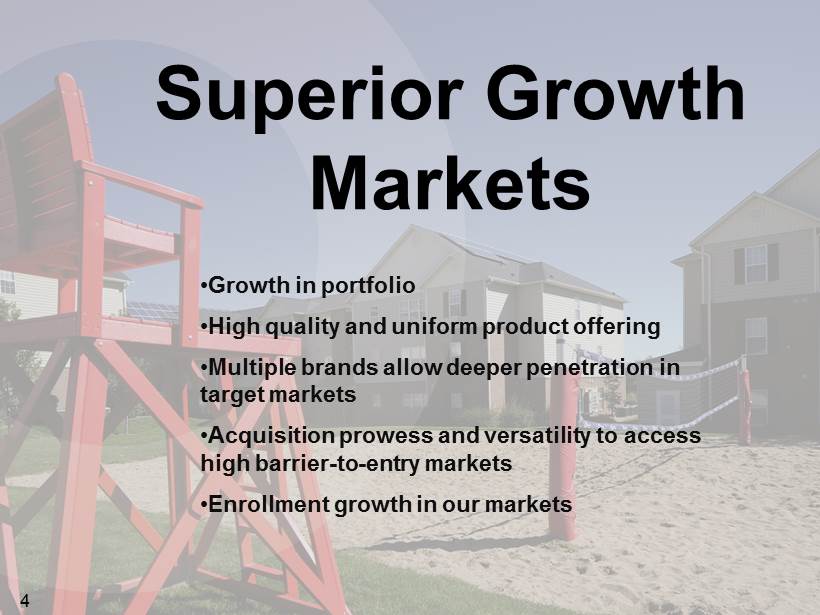
Superior Growth Markets • Growth in portfolio • High quality and uniform product offering • Multiple brands allow deeper penetration in target markets • Acquisition prowess and versatility to access high barrier - to - entry markets • Enrollment growth in our markets 4

October 2010 February 2014 (1) Enterprise value based on Company share price as of 5/29/2014 (2) Includes the redevelopment property in Toledo, OH EV at IPO: $495mm MARKETS: 27 PROPERTIES: 27 BEDS: 13,580 EMPLOYEES: 350 EV (1) : $1,509mm MARKETS (2) : 64 PROPERTIES (2) : 80 BEDS: 43,000+ EMPLOYEES: 950 Significant Growth Since IPO 5
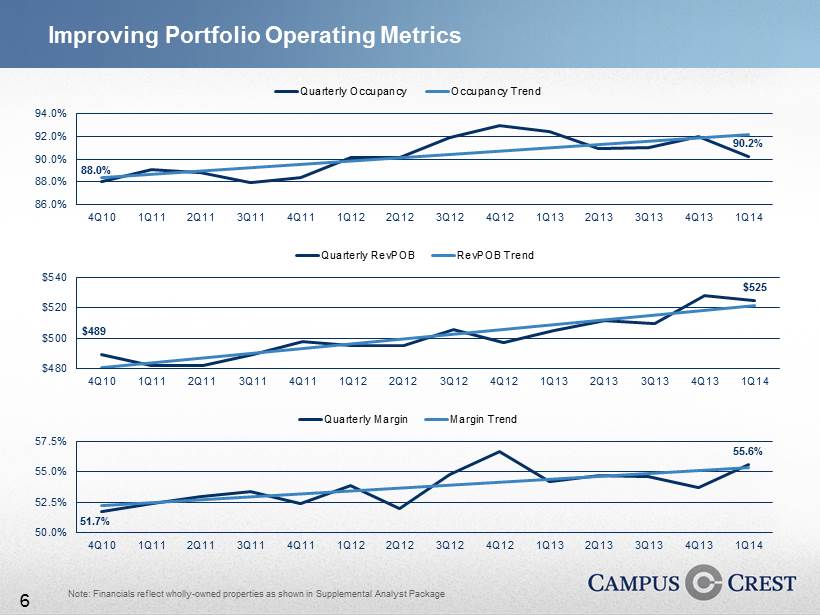
Improving Portfolio Operating Metrics Note: Financials reflect wholly - owned properties as shown in Supplemental Analyst Package 88.0% 90.2% 86.0% 88.0% 90.0% 92.0% 94.0% 4Q10 1Q11 2Q11 3Q11 4Q11 1Q12 2Q12 3Q12 4Q12 1Q13 2Q13 3Q13 4Q13 1Q14 Quarterly Occupancy Occupancy Trend $489 $525 $480 $500 $520 $540 4Q10 1Q11 2Q11 3Q11 4Q11 1Q12 2Q12 3Q12 4Q12 1Q13 2Q13 3Q13 4Q13 1Q14 Quarterly RevPOB RevPOB Trend 51.7% 55.6% 50.0% 52.5% 55.0% 57.5% 4Q10 1Q11 2Q11 3Q11 4Q11 1Q12 2Q12 3Q12 4Q12 1Q13 2Q13 3Q13 4Q13 1Q14 Quarterly Margin Margin Trend 6
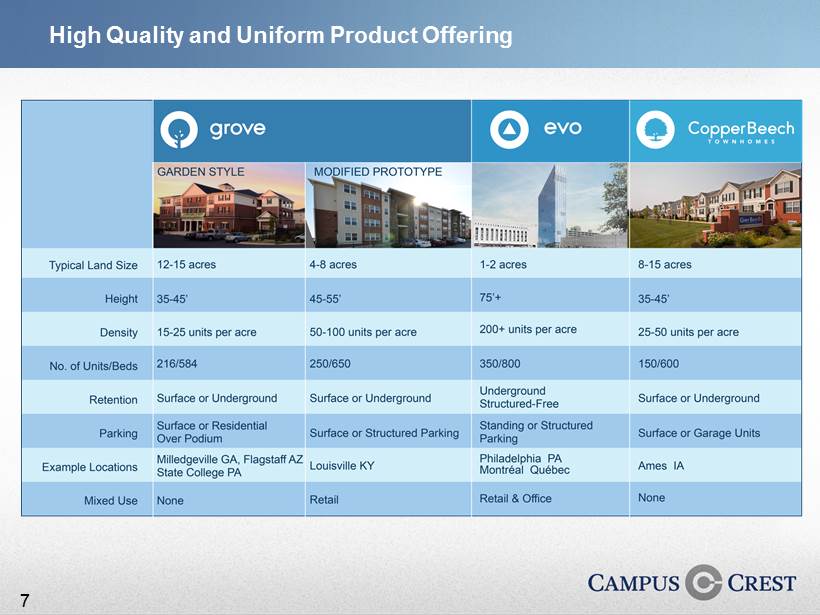
High Quality and Uniform Product Offering 7
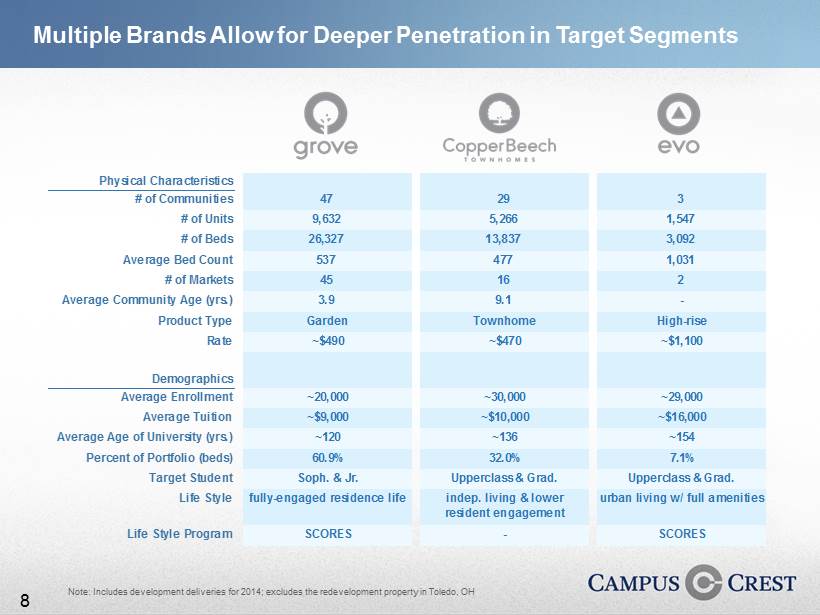
Targeting Different Segments of Students Note: Includes development deliveries for 2014; excludes the redevelopment property in Toledo, OH Physical Characteristics # of Communities 47 29 3 # of Units 9,632 5,266 1,547 # of Beds 26,327 13,837 3,092 Average Bed Count 537 477 1,031 # of Markets 45 16 2 Average Community Age (yrs.) 3.9 9.1 - Product Type Garden Townhome High-rise Rate ~$490 ~$470 ~$1,100 Demographics Average Enrollment ~20,000 ~30,000 ~29,000 Average Tuition ~$9,000 ~$10,000 ~$16,000 Average Age of University (yrs.) ~120 ~136 ~154 Percent of Portfolio (beds) 60.9% 32.0% 7.1% Target Student Soph. & Jr. Upperclass & Grad. Upperclass & Grad. Life Style fully-engaged residence life indep. living & lower resident engagement urban living w/ full amenities Life Style Program SCORES - SCORES Multiple Brands Allow for Deeper Penetration in Target Segments 8
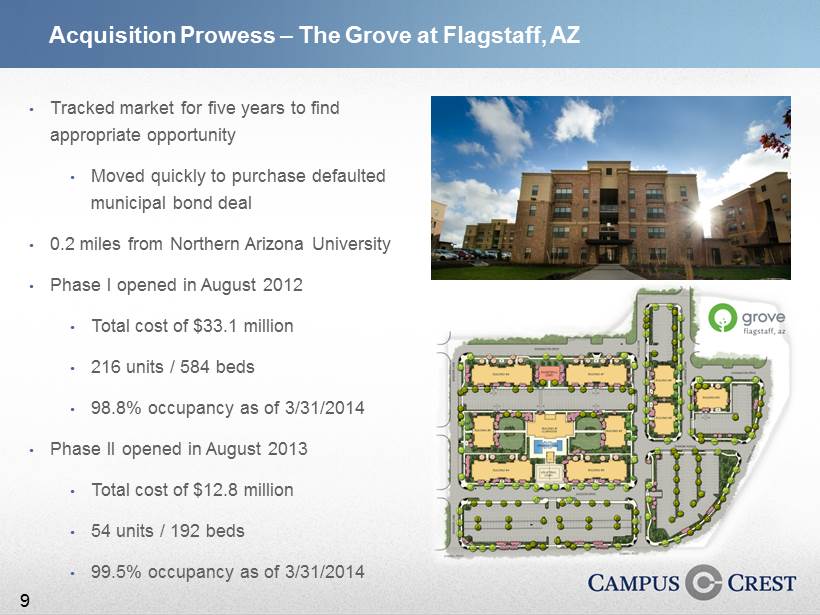
Acquisition Prowess – The Grove at Flagstaff, AZ • Tracked market for five years to find appropriate opportunity • Moved quickly to purchase defaulted municipal bond deal • 0.2 miles from Northern Arizona University • Phase I opened in August 2012 • Total cost of $33.1 million • 216 units / 584 beds • 98.8% occupancy as of 3/31/2014 • Phase II opened in August 2013 • Total cost of $12.8 million • 54 units / 192 beds • 99.5% occupancy as of 3/31/2014 9
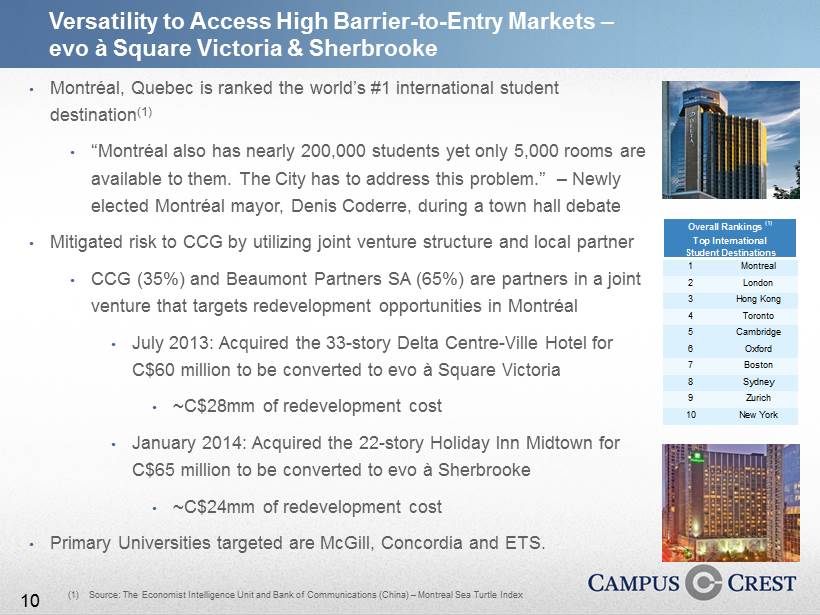
• Montréal, Quebec is ranked the world’s #1 international student destination (1) • “Montréal also has nearly 200,000 students yet only 5,000 rooms are available to them. The City has to address this problem.” – Newly elected Montréal mayor, Denis Coderre , during a town hall debate • Mitigated risk to CCG by utilizing joint venture structure and local partner • CCG (35%) and Beaumont Partners SA (65%) are partners in a joint venture that targets redevelopment opportunities in Montréal • July 2013: Acquired the 33 - story Delta Centre - Ville Hotel for C$60 million to be converted to evo à Square Victoria • ~C$28mm of redevelopment cost • January 2014: Acquired the 22 - story Holiday Inn Midtown for C$65 million to be converted to evo à Sherbrooke • ~C$24mm of redevelopment cost • Primary Universities targeted are McGill, Concordia and ETS. (1) Source: The Economist Intelligence Unit and Bank of Communications (China) – Montreal Sea Turtle Index Versatility to Access High Barrier - to - Entry Markets – evo à Square Victoria & Sherbrooke 1 Montreal 2 London 3 Hong Kong 4 Toronto 5 Cambridge 6 Oxford 7 Boston 8 Sydney 9 Zurich 10 New York Overall Rankings (1) Top International Student Destinations 10
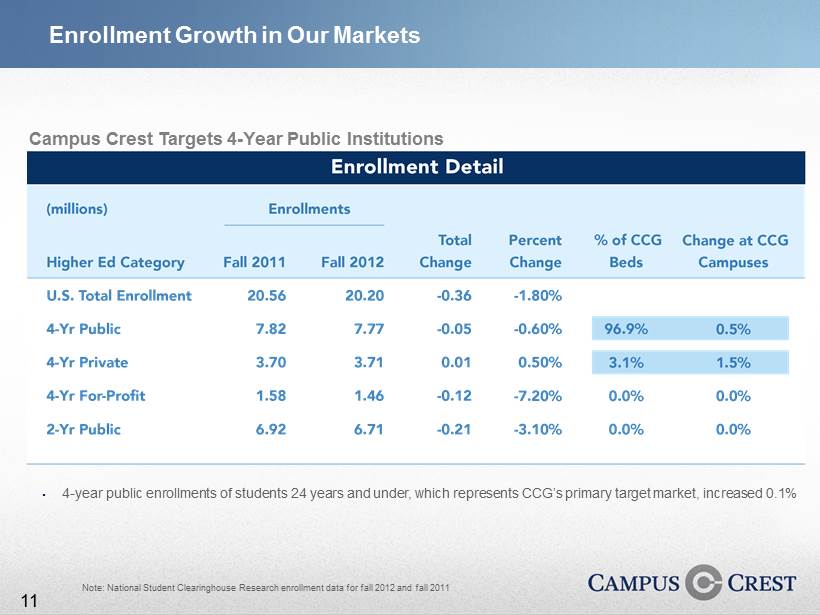
Enrollment Growth in Our Markets Campus Crest Targets 4 - Year Public Institutions Note: National Student Clearinghouse Research enrollment data for fall 2012 and fall 2011 • 4 - year public enrollments of students 24 years and under, which represents CCG’s primary target market, increased 0.1% 11
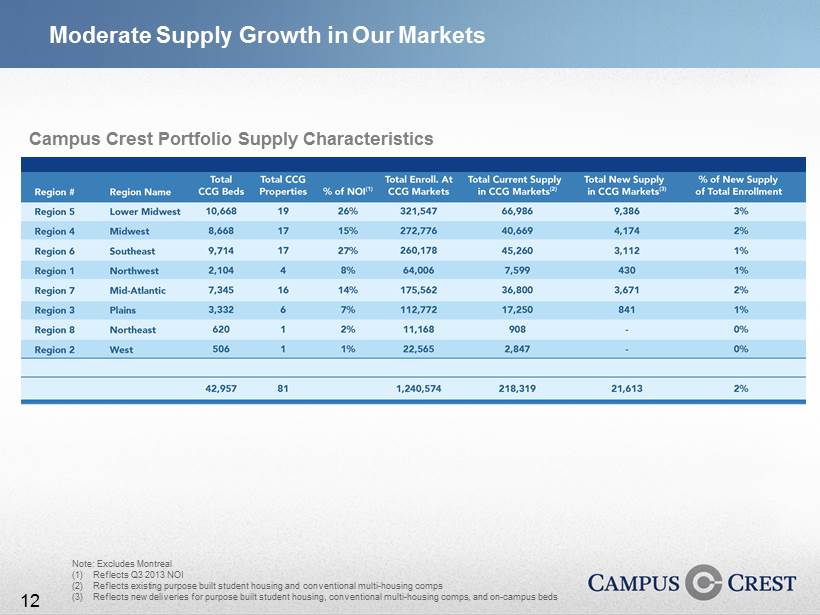
Moderate Supply Growth in Our Markets Campus Crest Portfolio Supply Characteristics Note: Excludes Montreal (1) Reflects Q3 2013 NOI (2) Reflects existing purpose built student housing and conventional multi - housing comps (3) Reflects new deliveries for purpose built student housing, conventional multi - housing comps, and on - campus beds 12
Disciplined, Vertically - Integrated Platform • Proprietary development pipeline • Faster time to market • Multiple construction and operational cost efficiencies 13
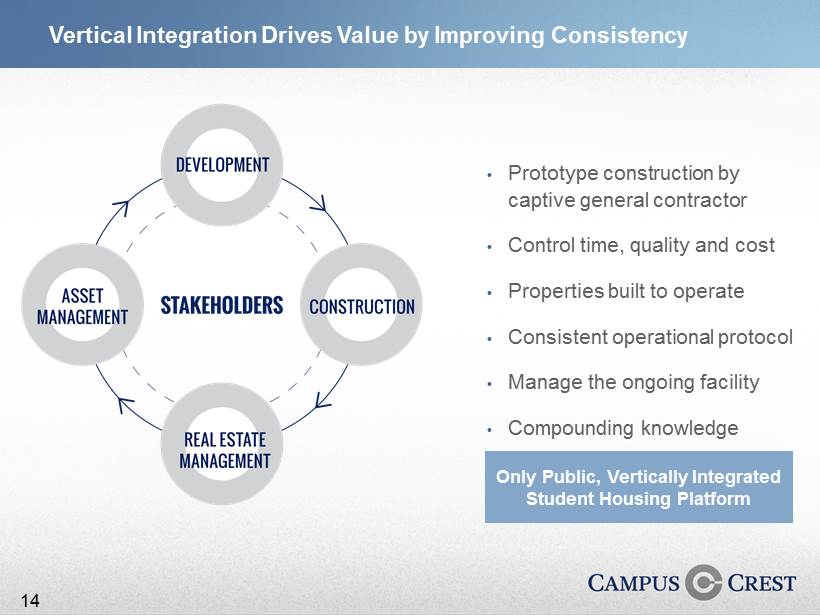
• Prototype construction by captive general contractor • Control time, quality and cost • Properties built to operate • Consistent operational protocol • Manage the ongoing facility • Compounding knowledge Only Public, Vertically Integrated Student Housing Platform Vertical Integration Drives Value by Improving Consistency 14
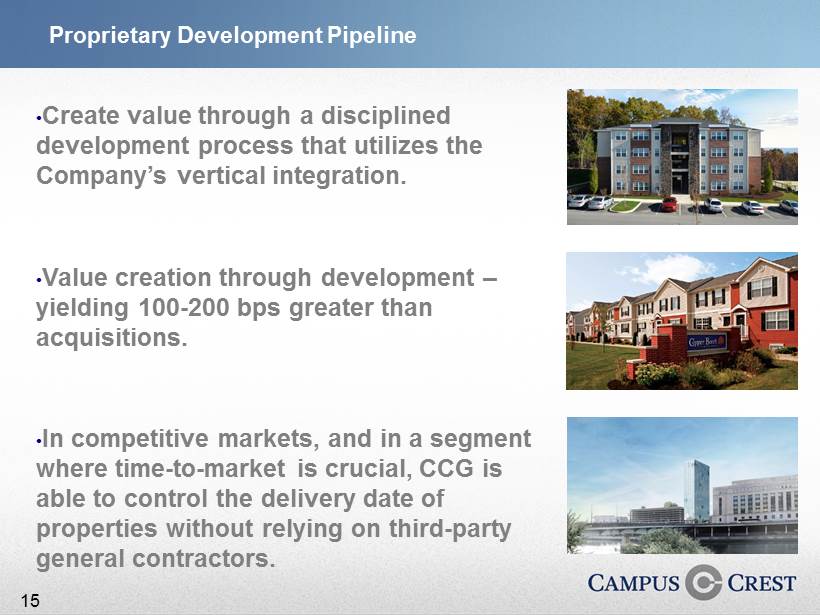
Proprietary Development Pipeline • Create value through a disciplined development process that utilizes the Company’s vertical integration. • Value creation through development – yielding 100 - 200 bps greater than acquisitions. • In competitive markets, and in a segment where time - to - market is crucial, CCG is able to control the delivery date of properties without relying on third - party general contractors. 15
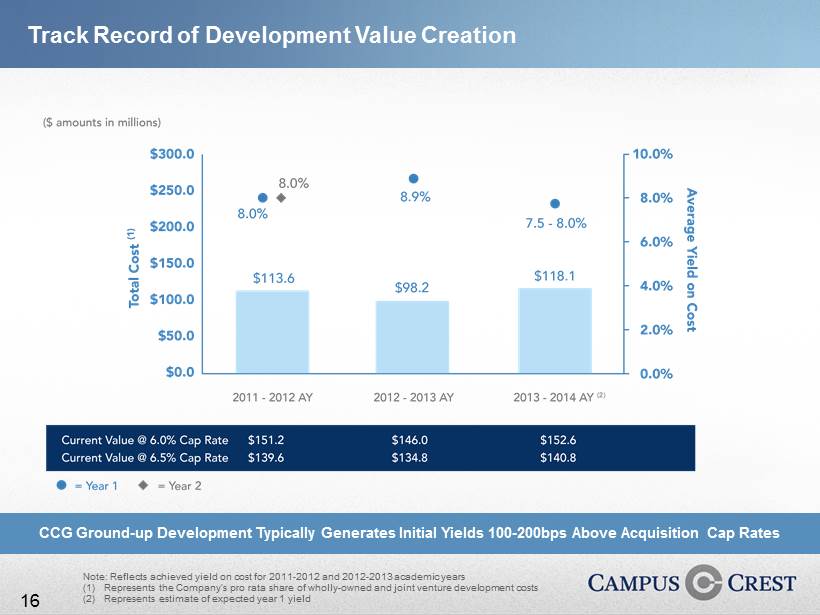
Track Record of Development Value Creation Note: Reflects achieved yield on cost for 2011 - 2012 and 2012 - 2013 academic years (1) Represents the Company’s pro rata share of wholly - owned and joint venture development costs (2) Represents estimate of expected year 1 yield CCG Ground - up Development Typically Generates Initial Yields 100 - 200bps Above Acquisition Cap Rates 16
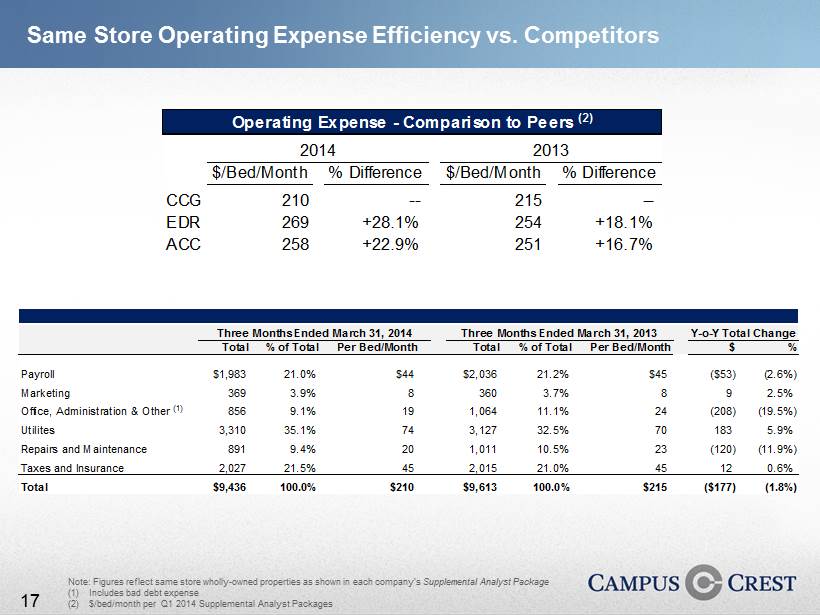
Note: Figures reflect same store wholly - owned properties as shown in each company’s Supplemental Analyst Package (1) Includes bad debt expense (2) $/bed/month per Q1 2014 Supplemental Analyst Packages Same Store Operating Expense Efficiency vs. Competitors Three Months Ended March 31, 2014 Y-o-Y Total Change Three Months Ended March 31, 2014 Total % of Total Per Bed/Month Total % of Total Per Bed/Month $ % Payroll $1,983 21.0% $44 $2,036 21.2% $45 ($53) (2.6%) Marketing 369 3.9% 8 360 3.7% 8 9 2.5% Office, Administration & Other (1) 856 9.1% 19 1,064 11.1% 24 (208) (19.5%) Utilites 3,310 35.1% 74 3,127 32.5% 70 183 5.9% Repairs and Maintenance 891 9.4% 20 1,011 10.5% 23 (120) (11.9%) Taxes and Insurance 2,027 21.5% 45 2,015 21.0% 45 12 0.6% Total $9,436 100.0% $210 $9,613 100.0% $215 ($177) (1.8%) Three Months Ended March 31, 2013 Operating Expense - Comparison to Peers (2) 2014 2013 $/Bed/Month % Difference $/Bed/Month % Difference CCG 210 -- 215 -- EDR 269 +28.1% 254 +18.1% ACC 258 +22.9% 251 +16.7% 17
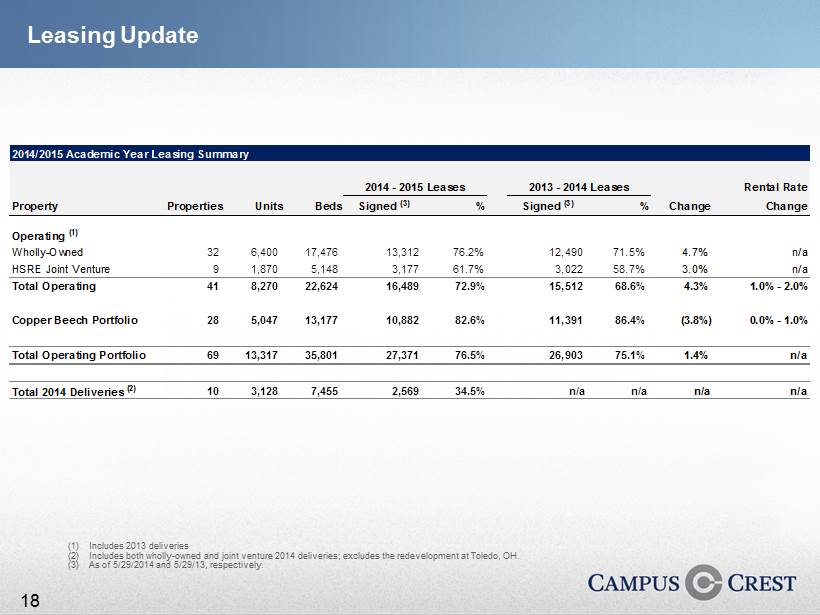
Leasing Update (1) Includes 2013 deliveries (2) Includes both wholly - owned and joint venture 2014 deliveries; excludes the redevelopment at Toledo, OH. (3) As of 5/29/2014 and 5/29/13, respectively. 2014/2015 Academic Year Leasing Summary 2014 - 2015 Leases 2013 - 2014 Leases Rental Rate Property Properties Units Beds Signed (3) % Signed (3) % Change Change Operating (1) Wholly-Owned 32 6,400 17,476 13,312 76.2% 12,490 71.5% 4.7% n/a HSRE Joint Venture 9 1,870 5,148 3,177 61.7% 3,022 58.7% 3.0% n/a Total Operating 41 8,270 22,624 16,489 72.9% 15,512 68.6% 4.3% 1.0% - 2.0% Copper Beech Portfolio 28 5,047 13,177 10,882 82.6% 11,391 86.4% (3.8%) 0.0% - 1.0% Total Operating Portfolio 69 13,317 35,801 27,371 76.5% 26,903 75.1% 1.4% n/a Total 2014 Deliveries (2) 10 3,128 7,455 2,569 34.5% n/a n/a n/a n/a 18
Proactive Financial Management • Maximum utilization of available capital • Diversified balance sheet • Reliable and attractive dividend 19
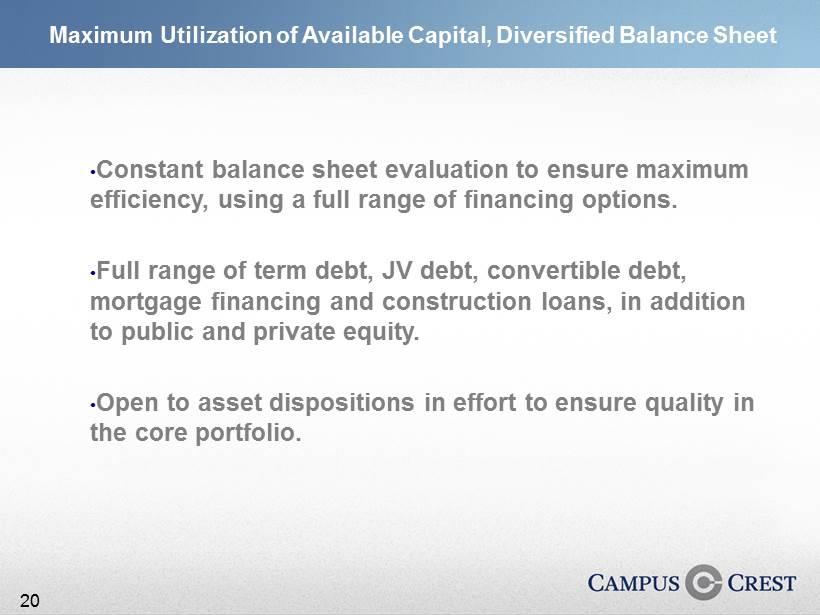
Maximum Utilization of Available Capital, Diversified Balance Sheet • Constant balance sheet evaluation to ensure maximum efficiency, using a full range of financing options. • Full range of term debt, JV debt, convertible debt, mortgage financing and construction loans, in addition to public and private equity. • Open to asset dispositions in effort to ensure quality in the core portfolio. 20

Debt MaturityProfile Note : As of 3/31/2014 (1) Excludes principal amortization and assumes exercise of extension options Debt Maturities (1) $1,351mm Pro Forma Weighted Average Interest Rate: 4.2% $16.9 $108.2 $208.8 $63.4 $312.4 $105.1 2.1% 13.3% 25.6% 7.8% 38.3% 12.9% 0.0% 10.0% 20.0% 30.0% 40.0% 50.0% $0 $50 $100 $150 $200 $250 $300 $350 $400 $450 $500 2014 2015 2016 2017 2018 Thereafter ($mm) Term Loan / Revolver Mortgage Debt Construction Debt Pro Rata JV Debt Pro Rata CBTC Debt Unsecured Convertible Other Debt RC Capacity 21

Note: As of 3/31/2014; excludes net cash from operations and transactions that occurred subsequent to 3/31/2014 (1) Includes $15.6 million of restricted cash from the December 2013 asset dispositions (2) Revolver availability as of 3/31/2014 (3) Remaining estimated equity spend at pro rata share; committed construction debt facilities are in place for 2014 deliveries (4) Assumes six deliveries at an average project cost of $30 million, 20% CCG ownership, and 70% LTC, of which CCG has already funded their required equity contribution in this scenario. 2014 Liquidity Profile and Recent Capital Raises There is sufficient liquidity from existing financing to fund 2014 commitments 4Q 2013 Capital Raises ($mm) Capital Source Proceeds Generated Preferred Equity $95 Exchangeable Notes 100 Non-Core Property Sales 49 Total Capital Generated $244 ($mm) Sources of Liquidity Liquidity Needs Cash on Balance Sheet (1) $35 2014 Wholly-Owned and JV Deliveries - at share (3) $19 Revolver Credit Facility Availability (2) 103 2015 Joint Venture Deliveries - at share (4) 0 Potential Property Dispositions or JVs TBD Total Potential Liquidity $138 Total Liquidity Needs $19 Excess Liquidity / (Need) $120 22
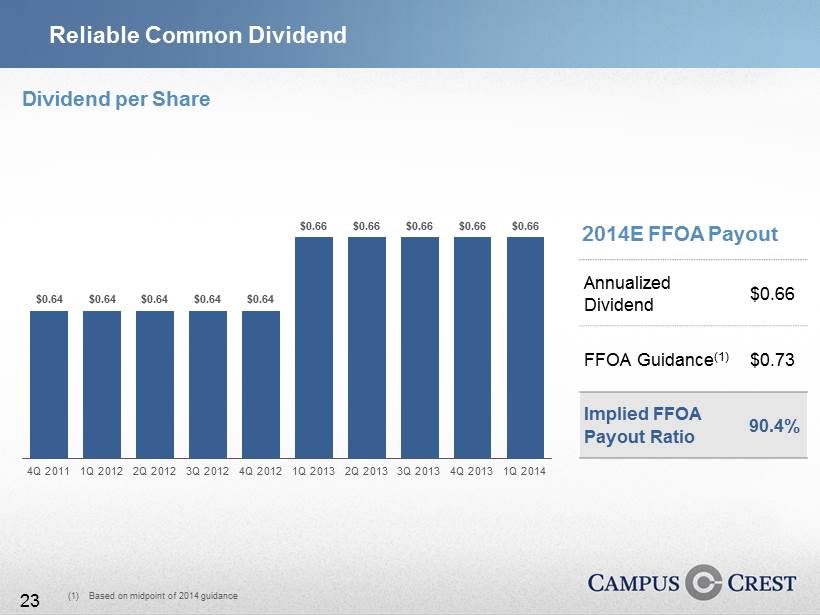
$0.64 $0.64 $0.64 $0.64 $0.64 $0.66 $0.66 $0.66 $0.66 $0.66 4Q 2011 1Q 2012 2Q 2012 3Q 2012 4Q 2012 1Q 2013 2Q 2013 3Q 2013 4Q 2013 1Q 2014 Reliable Common Dividend Dividend per Share 2014E FFOA Payout Annualized Dividend $0.66 FFOA Guidance (1) $0.73 Implied FFOA Payout Ratio 90.4% (1) Based on midpoint of 2014 guidance 23
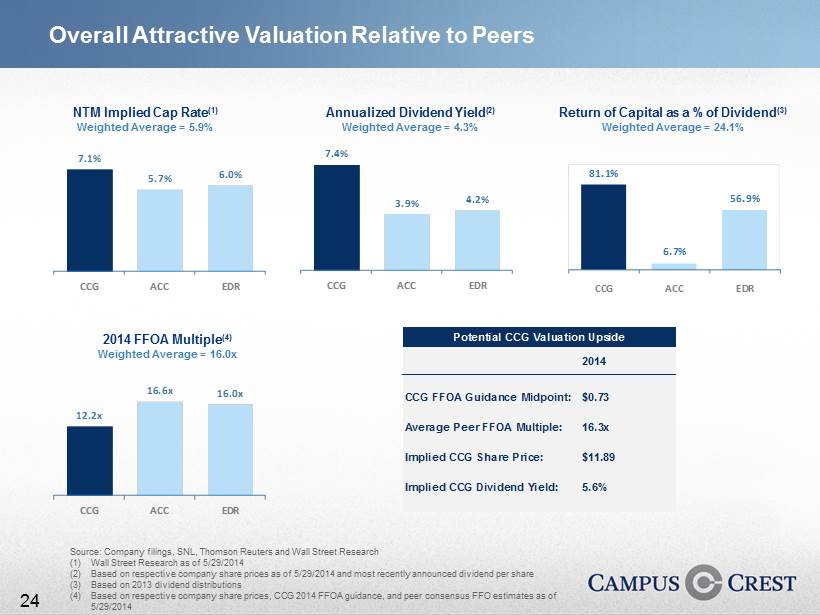
• CCG 2013 FFO Consensus: $0.86/share • 2013 Average Peer FFO Multiple: 15.7x • Implied CCG Share Price: $13.50 • Implied CCG Dividend Yield: 4.9% Source: Company filings, SNL, Thomson Reuters and Wall Street Research (1) Wall Street Research as of 5/29/2014 (2) Based on respective company share prices as of 5/29/2014 and most recently announced dividend per share (3) Based on 2013 dividend distributions (4) Based on respective company share prices, CCG 2014 FFOA guidance, and peer consensus FFO estimates as of 5/29/2014 Overall Attractive Valuation Relative to Peers NTM Implied Cap Rate (1) Weighted Average = 5.9% Annualized Dividend Yield (2) Weighted Average = 4.3% Return of Capital as a % of Dividend (3) Weighted Average = 24.1% 81.1% 6.7% 56.9% CCG ACC EDR 2014 FFOA Multiple (4) Weighted Average = 16.0x 7.4% 3.9% 4.2% CCG ACC EDR 12.2x 16.6x 16.0x CCG ACC EDR Potential CCG Valuation Upside 2014 CCG FFOA Guidance Midpoint: $0.73 Average Peer FFOA Multiple: 16.3x Implied CCG Share Price: $11.89 Implied CCG Dividend Yield: 5.6% 7.1% 5.7% 6.0% CCG ACC EDR 24
25
Appendix 26

Portfolio Overview – Wholly Owned Portfolio Overview – Wholly - Owned Property Name Market # of Props Units Beds Median Distance to Campus (miles) Age Total Enrollment Tuition Wholly-Owned Operating Properties The Grove at Asheville, NC UNC - Asheville 154 448 0.1 8.63 3,751 7,334 The Grove at Carrollton, GA University of West Georgia 168 492 0.1 7.63 11,769 6,710 The Grove at Las Cruces, NM New Mexico State University 168 492 0.4 7.63 17,651 6,041 The Grove at Milledgeville, GA Georgia College & State University 168 492 0.1 7.63 6,444 6,634 The Grove at Abilene, TX Abilene Christian University 192 504 0.5 6.63 4,367 28,350 The Grove at Ellensburg, WA Central Washington University 192 504 0.5 6.55 11,268 5,946 The Grove at Greeley, CO University of Northern Colorado 192 504 1.0 6.63 13,070 6,837 The Grove at Mobile, AL-Phase I & II University of South Alabama 384 1,008 0.0 6.63 14,636 7,950 The Grove at Nacogdoches, TX - Phase I & II Stephen F. Austin State University 260 682 0.4 6.63 12,999 7,928 The Grove at Cheney, WA Eastern Washington University 192 512 0.5 5.54 12,587 10,577 The Grove at Lubbock, TX Texas Tech University 192 504 1.2 5.63 32,467 8,942 The Grove at Stephenville, TX Tarleton State University 192 504 0.8 5.63 12,524 7,064 The Grove at Troy, AL Troy University 192 514 0.4 5.63 22,554 8,134 The Grove at Waco, TX Baylor University 192 504 0.8 5.63 15,364 33,916 The Grove at Murfreesboro, TN Middle Tennessee State University 186 504 0.8 4.63 25,394 7,492 The Grove at San Marcos, TX Texas State University 192 504 1.7 4.63 34,225 8,770 The Grove at Moscow, ID University of Idaho 192 504 0.5 4.63 12,420 6,212 The Grove at Huntsville, TX Sam Houston State University 192 504 0.2 3.63 18,461 8,120 The Grove at Statesboro, GA Georgia Southern University 200 536 0.7 3.63 20,574 6,724 The Grove at Ames, IA Iowa State University 216 584 0.3 2.63 30,748 7,726 The Grove at Clarksville, TN Austin Peay State University 208 560 1.3 2.63 10,597 6,918 The Grove at Columbia, MO University of Missouri 216 632 0.9 2.63 34,704 9,257 The Grove at Ft. Wayne, IN Indiana University / Purdue University 204 540 1.1 2.63 13,771 7,640 The Grove at Valdosta, GA Valdosta State University 216 584 1.9 2.63 12,515 6,762 The Grove at Auburn, AL Auburn University 216 600 0.0 1.62 25,134 9,446 The Grove at Flagstaff, AZ Northern Arizona University 216 584 0.2 1.62 25,991 7,364 The Grove at Orono, ME University of Maine 188 620 0.5 1.62 10,901 10,594 The Grove at Denton, TX University of North Texas 216 584 0.8 2.63 37,950 8,717 The Grove at Ft. Collins, CO Colorado State University 218 612 0.0 0.62 30,659 8,648 The Grove at Muncie, IN Ball State University 216 584 0.1 0.62 21,053 8,980 The Grove at Pullman, WA Washington State University 216 584 0.0 0.62 27,679 11,386 The Grove at Flagstaff, AZ - Phase II Northern Arizona University 54 192 0.2 0.62 25,991 7,364 Toledo, OH University of Toledo 382 660 0.0 29.87 21,453 9,054 Total - Wholly-Owned Operating 33 6,782 18,136 0.5 5.05 19,142 9,380 Note: The totals are sums of the values, with the following exceptions: - Distance to campus: median value of all properties - Age of property, total enrollment, tuition: average of all properties’ values 27

Portfolio Overview – Joint Venture and 2014 Deliveries Note: The totals are sums of the values, with the following exceptions: - Distance to campus: median value of all properties - Age of property, total enrollment, tuition: average of all properties’ values Property Name Market # of Props Units Beds Distance to Campus (miles) Age Total Enrollment Tuition HSRE Joint Venture Operating Properties The Grove at Lawrence, KS Kansas University 172 500 1.6 4.63 27,135 9,678 The Grove at San Angelo, TX Angelo State University 192 504 0.3 4.63 6,888 7,500 The Grove at Conway, AR University of Central Arkansas 180 504 0.4 3.63 11,107 7,332 The Grove at Fayetteville, AR University of Arkansas 232 632 0.5 1.62 24,537 7,554 The Grove at Laramie, WY University of Wyoming 224 612 0.3 1.62 12,903 8,556 The Grove at Stillwater, OK Oklahoma State University 206 612 0.8 1.62 25,708 8,382 The Grove at Norman, OK University of Oklahoma 224 600 0.6 0.62 27,507 8,706 The Grove at State College, PA Penn State University 216 584 0.8 0.62 45,783 16,444 The Grove at Indiana, pA Indiana University of Pennsylvania 224 600 0.6 0.62 15,596 8,672 Total - HSRE Joint Venture Operating 9 1,870 5,148 0.6 2.2 21,907 9,203 2014 Wholly-Owned Deliveries The Grove at Slippery Rock Slippery Rock University of Pennsylvania 201 603 0.3 0.00 8,559 8,506 The Grove at Gainesville University of Florida 253 676 0.3 0.00 49,913 5,656 The Grove at Grand Forks University of North Dakota 224 600 0.1 0.00 15,250 7,254 The Grove at Mt. Pleasant, MI Central Michigan University 216 584 0.9 0.00 27,626 10,950 Total - 2014 Wholly-Owned Deliveries 4 894 2,463 0.3 - 25,337 8,092 2014 Joint Venture Deliveries The Grove at Greensboro University of North Carolina Greensboro 216 584 0.5 0.00 18,516 6,136 The Grove at Louisville University of Louisville 252 656 0.1 0.00 21,239 8,930 evo at Cira Centre South UPENN 344 850 0.0 0.00 24,725 43,738 Drexel 0.2 25,500 41,500 Copper Beech at Ames Iowa State University 219 660 0.3 0.00 30,748 7,726 evo à Square Victoria McGill 715 1290 0.6 0.00 n/a 3,591 Concordia 0.8 n/a 3,322 ETS 0.3 n/a 3,317 evo à Sherbrooke McGill 488 952 0.1 0.00 n/a 3,591 Total - 2014 Joint Venture Deliveries 6 2,234 4,992 0.3 - 24,146 13,539 Total - 2014 Deliveries 10 3,128 7,455 0.3 0.00 24,675 11,863 Total - Grove Operating and 2014 Grove Deliveries 39 8,144 21,839 0.5 3.83 20,380 9,159 Total Portfolio (not including Copper Beech Operating) 52 11,780 30,739 0.6 3.58 20,606 9,938 28
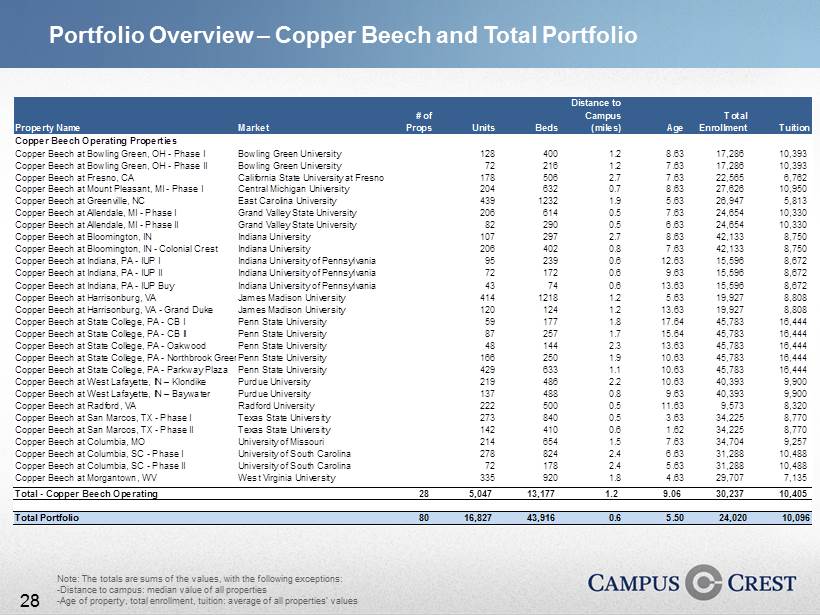
Portfolio Overview – Copper Beech and Total Portfolio Note: The totals are sums of the values, with the following exceptions: - Distance to campus: median value of all properties - Age of property, total enrollment, tuition: average of all properties’ values Property Name Market # of Props Units Beds Distance to Campus (miles) Age Total Enrollment Tuition Copper Beech Operating Properties Copper Beech at Bowling Green, OH - Phase I Bowling Green University 128 400 1.2 8.63 17,286 10,393 Copper Beech at Bowling Green, OH - Phase II Bowling Green University 72 216 1.2 7.63 17,286 10,393 Copper Beech at Fresno, CA California State University at Fresno 178 506 2.7 7.63 22,565 6,762 Copper Beech at Mount Pleasant, MI - Phase I Central Michigan University 204 632 0.7 8.63 27,626 10,950 Copper Beech at Greenville, NC East Carolina University 439 1232 1.9 5.63 26,947 5,813 Copper Beech at Allendale, MI - Phase I Grand Valley State University 206 614 0.5 7.63 24,654 10,330 Copper Beech at Allendale, MI - Phase II Grand Valley State University 82 290 0.5 6.63 24,654 10,330 Copper Beech at Bloomington, IN Indiana University 107 297 2.7 8.63 42,133 8,750 Copper Beech at Bloomington, IN - Colonial Crest Indiana University 206 402 0.8 7.63 42,133 8,750 Copper Beech at Indiana, PA - IUP I Indiana University of Pennsylvania 95 239 0.6 12.63 15,596 8,672 Copper Beech at Indiana, PA - IUP II Indiana University of Pennsylvania 72 172 0.6 9.63 15,596 8,672 Copper Beech at Indiana, PA - IUP Buy Indiana University of Pennsylvania 43 74 0.6 13.63 15,596 8,672 Copper Beech at Harrisonburg, VA James Madison University 414 1218 1.2 5.63 19,927 8,808 Copper Beech at Harrisonburg, VA - Grand Duke James Madison University 120 124 1.2 13.63 19,927 8,808 Copper Beech at State College, PA - CB I Penn State University 59 177 1.8 17.64 45,783 16,444 Copper Beech at State College, PA - CB II Penn State University 87 257 1.7 15.64 45,783 16,444 Copper Beech at State College, PA - Oakwood Penn State University 48 144 2.3 13.63 45,783 16,444 Copper Beech at State College, PA - Northbrook GreensPenn State University 166 250 1.9 10.63 45,783 16,444 Copper Beech at State College, PA - Parkway Plaza Penn State University 429 633 1.1 10.63 45,783 16,444 Copper Beech at West Lafayette, IN – Klondike Purdue University 219 486 2.2 10.63 40,393 9,900 Copper Beech at West Lafayette, IN – Baywater Purdue University 137 488 0.8 9.63 40,393 9,900 Copper Beech at Radford, VA Radford University 222 500 0.5 11.63 9,573 8,320 Copper Beech at San Marcos, TX - Phase I Texas State University 273 840 0.5 3.63 34,225 8,770 Copper Beech at San Marcos, TX - Phase II Texas State University 142 410 0.6 1.62 34,225 8,770 Copper Beech at Columbia, MO University of Missouri 214 654 1.5 7.63 34,704 9,257 Copper Beech at Columbia, SC - Phase I University of South Carolina 278 824 2.4 6.63 31,288 10,488 Copper Beech at Columbia, SC - Phase II University of South Carolina 72 178 2.4 5.63 31,288 10,488 Copper Beech at Morgantown, WV West Virginia University 335 920 1.8 4.63 29,707 7,135 Total - Copper Beech Operating 28 5,047 13,177 1.2 9.06 30,237 10,405 Total Portfolio 80 16,827 43,916 0.6 5.50 24,020 10,096 28

Copper Beech Purchase Schedule – As Amended September 2013 UPDATE If CB deal changes Summary of Copper Beech Amendment ($mm) Timing Investment Dollars Debt Paydown Total Investment Cumulative Direct Equity Interest Cash Flow Stage 1 30 Properties n/a $143.7 1 $106.7 $250.4 67% $13 preferred & 67% 2 7 Properties n/a $0.0 $0.0 $0.0 0% 0% Total $143.7 $106.7 $250.4 n/a n/a Purchase Option 1 30 Properties $93.5 $21.0 $114.5 85% 100% 7 Properties $16.9 $0.0 $16.9 18% 33% Total $110.4 $21.0 $131.4 n/a n/a Purchase Option 2 37 Properties Through March 2015 $100.7 3 $19.0 $119.7 88.9% 100% Purchase Option 3 37 Properties Through March 2016 $53.4 4 $0.0 $53.4 100% 100% Total $408.2 $146.7 $554.9 100% 100% 1 Includes $16.2 million of loan repayment proceeds and $4 million as consideration for entering into the amendment. 2 Per original agreement, CCG entitled to first $13 million of cash flow in year 1; per subject amendment, CCG is entitled to 67% of residual cash flow after preferred. 3 Includes $10.7 million originally part of the loan that will be repaid by Copper Beech. 4 Includes $4.8 million originally part of the loan that will be repaid by Copper Beech. Investment Dollars March 18 - August 18, 2014 30
This presentation contains certain forward - looking statements that are subject to risks and uncertainties . These forward - looking statements are based on certain assumptions, discuss future expectations, describe future plans and strategies, contain financial and operating projections or state other forward - looking information . The Company’s ability to predict results or the actual effect of future events, actions, plans or strategies is inherently uncertain . Although the Company believes that the expectations reflected in such forward - looking statements are based on reasonable assumptions, the Company’s actual results and performance could differ materially from those set forth in, or implied by, the forward - looking statements . You are cautioned not to place undue reliance on any of these forward - looking statements, which reflect the Company’s views on this date . Furthermore, except as required by law, the Company is under no duty to, and does not intend to, update any of our forward - looking statements after this date, whether as a result of new information, future events or otherwise . This presentation does not constitute, and may not be used in connection with, an offer or solicitation by anyone in any jurisdiction in which such offer or solicitation is not permitted by law or in which the person making the offer or solicitation is not qualified to do so or to any person to whom it is unlawful to make such offer or solicitation . Forward Looking Statements 31