Attached files
| file | filename |
|---|---|
| 8-K - FORM 8-K - WILLIS TOWERS WATSON PLC | d729420d8k.htm |
 WILLIS
GROUP HOLDINGS Fact Book
First Quarter 2014
May 2014
Exhibit 99.1 |
 2014
financial reporting changes (effective January 1) | 2
Operational changes:
Moved Willis UK from International to Global
Moved Mexico from North America to International
Allocation changes:
Amortization of intangibles allocated to the segments (previously in
Corporate) Certain group costs that had previously been allocated to segments
are now allocated to Corporate (leadership, project costs, marketing, legal,
etc) The non-servicing or financing elements of the defined benefit
pension scheme cost (income) are now allocated to Corporate
Change in presentation:
New
line
item
below
operating
income
–
“Other
income/expense”–
comprises
FX
gains
and
losses,
primarily on revaluation of monetary balance sheet assets and liabilities, and
gains and losses on disposal of operations, previously reported within Total
operating expenses Prior period amounts have been reclassified to conform to
this presentation. Moved
Facultative
Reinsurance
and
Captives
Consulting
from
North
America
to
Global |
 Global risk
adviser and broker | 3
Commission and fee mix
~ 70% / 30%
Client
Globally diverse
client base in >150
countries
Segmented: Large
corporates, small
and middle market
Insurer
Placed ~$50 billion
in premium in 2013
More than 2,500
carrier
relationships
Adviser Broker
Broad P&C
Specialty
Human Capital & Benefits
Reinsurance
Capital Markets
Analytics |
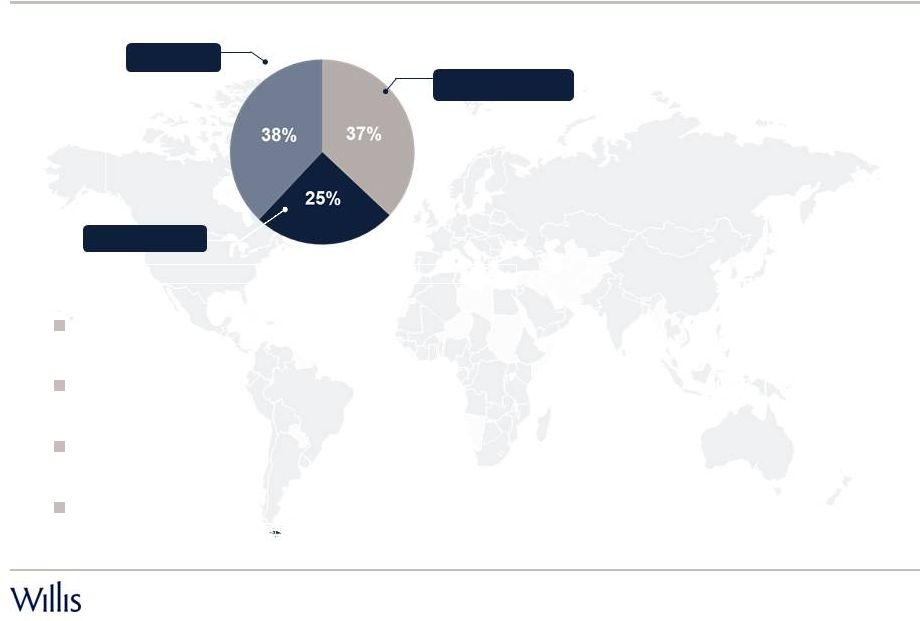 Global risk
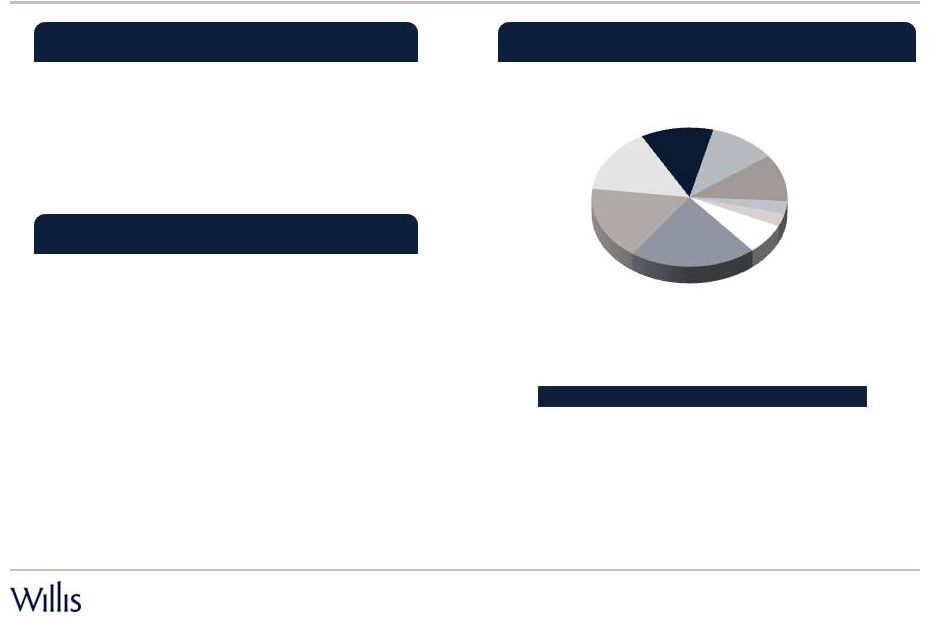
advisor and broker | 4
2013
revenue
-
$3.7
billion
Global
International
North America
With roots dating to 1828, Willis operates today on every continent, with
approximately 18,000 employees in over 400 offices
Across geographies, industries and specialties, Willis provides its local and
multinational clients with resilience for a risky world
Willis is known for its market-leading products and professional services in
risk management and risk transfer
Willis experts rank among the world’s leading authorities on analytics,
modelling and mitigation strategies at the intersection of global commerce
and extreme events |
 1Q 2014
Commissions and fees growth 1Q 2014
Reported
Organic
North America
3.9%
4.7%
International
5.7%
7.2%
Global
3.5%
2.0%
Group
4.2%
4.2%
| 5
See important disclosures regarding non-GAAP measures starting on page 18
North America –
Organic 4.7%
Growth well distributed across geographic regions and in most product and industry
practices. Construction up low teens and Human Capital up mid-single
digits International –
Organic 7.2%
Excluding
$6
million
favorable
impact
from
4Q
2013
China
revenue
recognition
adjustment,
organic
growth
of
4.7%
Good growth from emerging and developing markets: Eastern Europe, Latin America,
and Asia Global –
Organic 2.0%
High single digit growth in Reinsurance
Global Insurance down high single digits, with both UK retail and Specialty
businesses down |
 Q1 2014
summary financial results | 6
Q1 2014
Q1 2013
Adjusted operating income
$ 326 m
$ 327 m
Adjusted EPS
$1.36
$1.46
Adjusted tax rate
22%
19%
Average diluted shares outstanding
182 m
176 m
Q1 2014 versus Q1 2013:
FX movements :
Higher tax rate :
$0.05 per diluted share negative impact
Higher share count :
$0.05 per diluted share negative impact
See important disclosures regarding non-GAAP measures starting on page 18
$0.03 per diluted share negative impact |
 Q1 2014
operating margins | 7
Q1 2014
Q1 2013
Change
FX Impact
Change (ex FX)
North America
25.9%
23.0%
290 bps
-
290 bps
International
29.9%
29.3%
60bps
-
60 bps
Global
40.6%
43.7%
(310) bps
80 bps
(230) bps
Group (adjusted)
29.7%
31.1%
(140) bps
50 bps
(90) bps
See important disclosures regarding non-GAAP measures starting on page 18
|
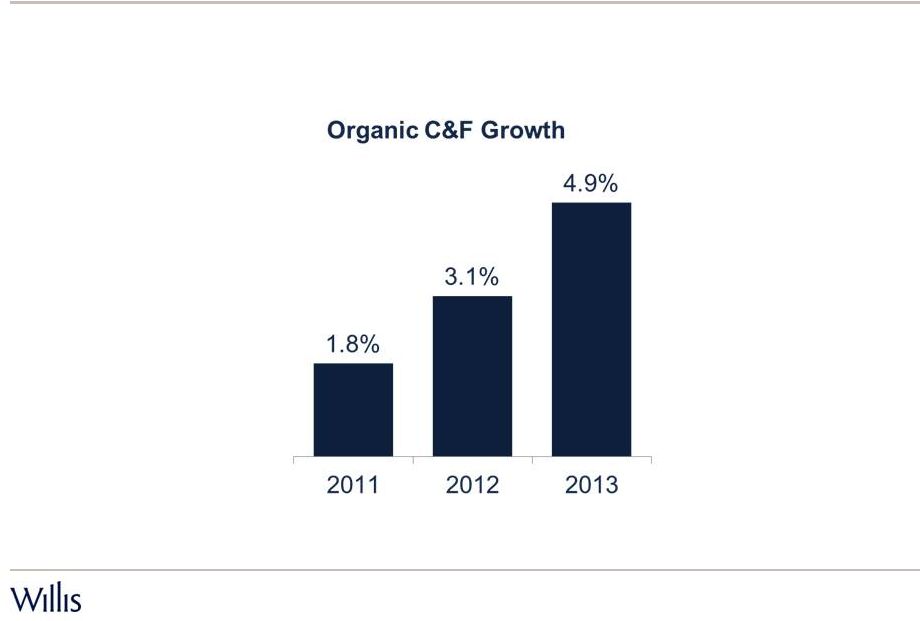 Organic
commissions and fees growth | 8
See important disclosures regarding non-GAAP measures starting on page 18
|
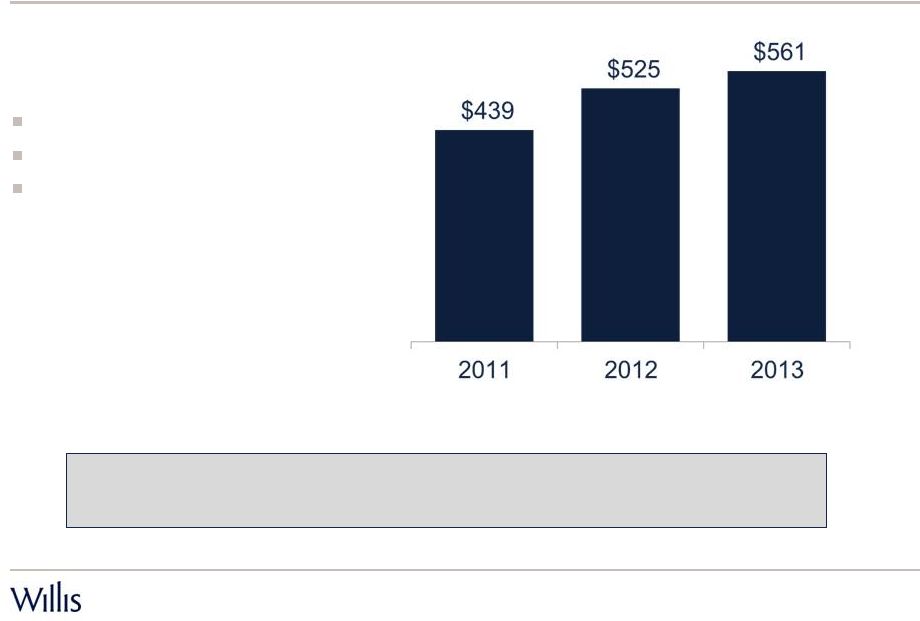 ($
millions) 2013 corporate/non-operating uses of cash
Dividends $193 million
Capex $112 million
M&A expenditures of ~$34 million
$36 million increase in cash flow from operations in 2013
$734 million of cash and cash equivalents at March 31, 2014
Strong cash flow from operations
| 9 |
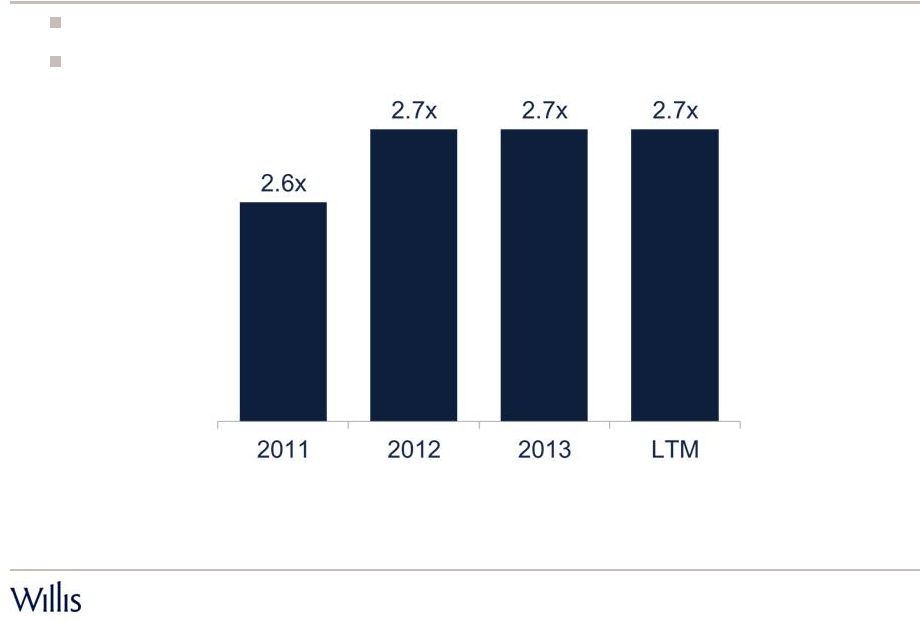 Debt
/ Adjusted EBITDA Adjusted LTM EBITDA $854 million as of March 31, 2014
Debt outstanding $2.3 billion as at March 31, 2014
Leverage ratios
| 10
See important disclosures regarding non-GAAP measures starting on page 18
|
 SEGMENT
OVERVIEWS |
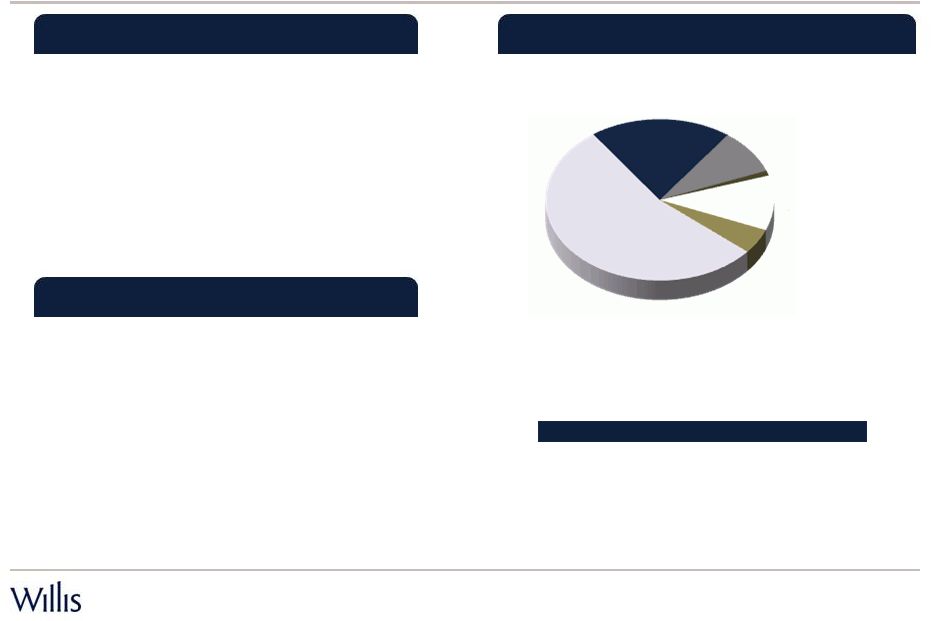
 2013
North America C&F: $1.35 billion Willis North America overview
| 12
(1)
CAPPPS: Captives, Actuarial, Programs, Pooling and Personal Lines
Major practices
•
More than 5,000 associates delivering
industry and product specific solutions to
our clients
•
Over 100 locations, broad geographic
reach with ability to connect with Willis
network.
Segment
•
Human Capital ~25% of 2013 North
America C&F
•
Construction ~14% of North America C&F
•
Healthcare
•
Real estate/hospitality
•
Financial and Executive risk
Atlantic
15%
West
12%
South
11%
CAPPPS (1)
11%
Other
3%
Canada
3%
California
7%
Northeast
21%
Midwest
17%
2013
commissions
and
fees
–
by
region |
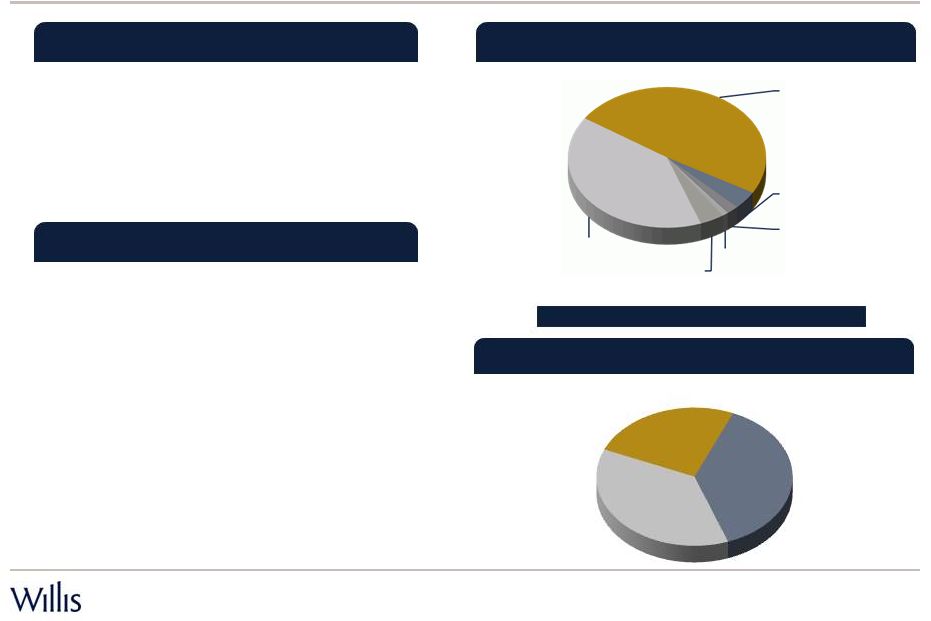
 2013
International C&F: $0.9 billion Willis International overview
| 13
Segment
2013
commissions
and
fees
–
by
region
•
Approximately 6,000 associates in over 40
countries
•
Offices designed to grow business locally
around the world, making use of the skills,
industry knowledge and expertise available
within segment and elsewhere in the
Group
Retail operations
•
Western and Eastern Europe
•
Latin America
•
Asia Pacific
•
South Africa
•
Middle East
•
Australasia
Latin America
20%
Australasia
9%
South Africa
1%
Asia Pacific
11%
Easter
Europe
5%
Western
Europe
54% |
 Willis
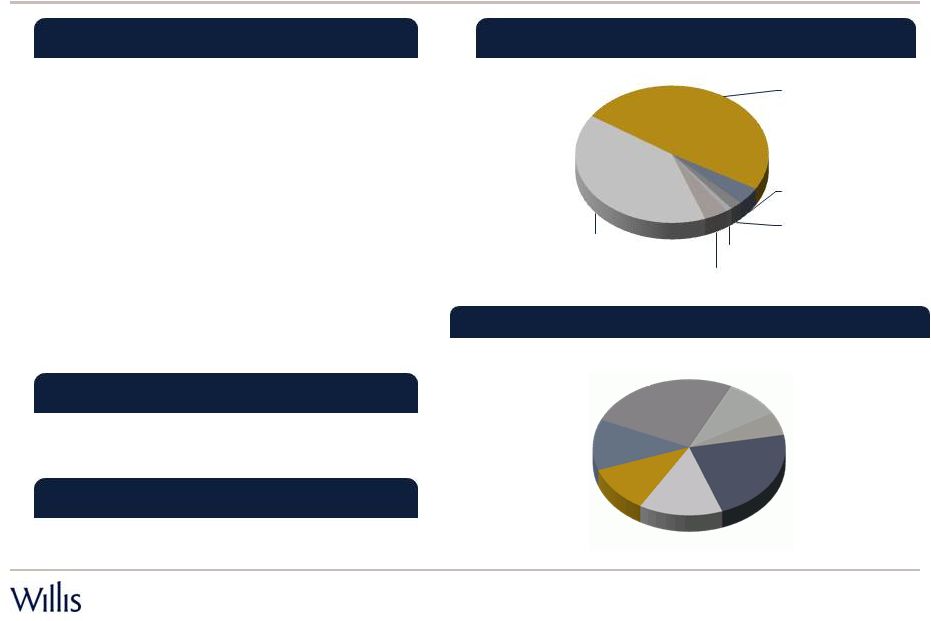
Global overview | 14
2013
commissions
and
fees
–
by
business
Segment
Willis Re
•
One of the world’s largest reinsurance
brokers with three divisions: North
America, International and Specialty
•
Strong market share in major markets,
particularly marine and aviation
•
Complete range of transactional
capabilities including, in conjunction with
WCM&A, a wide variety of capital markets
based products
•
Cutting edge analytical and advisory
services, including Willis Research
Network, the insurance industry’s largest
partnership with global academic
•
Reinsurance, Specialty Insurance and
Capital Markets businesses
•
Approximately 4,000 associates
•
Clients around the globe
2013 Global C&F: $1.36 billion
2013
Reinsurance
C&F
–
by
division
Specialties
25%
International
37%
North America
38%
Global Insurance
49%
Facultative
4%
Risk
2%
Willis Capital
Markets
1%
Other
4%
Reinsurance
40% |
 Willis
Global overview (continued) | 15
Global Insurance
•
Combination of Global Specialty business
and UK retail business, creating a
seamless client proposition
•
Strong global positions in:
•
Transport –
includes aerospace,
inspace and marine
•
Natural resources
•
Construction
•
Political, people and terrorism (PP&T)
•
Financial and executive risk
(Finex/Finmar)
•
Fine art, jewelry, art, specie, bloodstock
•
Faber Global –
wholesale and facultative
solutions through London, European &
Bermuda markets
Willis Capital Markets & Advisory
•
Advises on M&A and capital markets
transactions
Facultative
Global Insurance
49%
Facultative
4%
Risk
2%
Willis Capital
Markets
1%
Other
4%
Reinsurance
40%
Natural Resources
9%
Other
6%
Willis UK
22%
P&C Construction
14%
PP&T
11%
Finex/Finmar
12%
Transport
26%
2013 commissions and fees – by business
2013 Global Insurance C&F – by specialty
|
 APPENDIX |
 Important
disclosures regarding forward-looking statements | 17
This presentation contains certain “forward-looking statements” within the meaning of
Section 27A of the Securities Act of 1933, and Section 21E of the Securities Exchange Act of
1934, which are intended to be covered by the safe harbors created by those laws. These
forward-looking statements include information about possible or assumed future results of
our operations.
All statements, other than statements of historical facts, included in this document that address
activities, events or developments that we expect or anticipate may occur in the future,
including such things as our outlook, potential cost savings and accelerated adjusted operating margin
and adjusted earnings per share growth, future capital expenditures, growth in commissions and
fees, business strategies, competitive strengths, goals, the benefits of new initiatives, growth of our business and operations, plans, and references to future
successes are forward-looking statements. Also, when we use the words such as
‘anticipate’, ‘believe’, ‘estimate’, ‘expect’, ‘intend’, ‘plan’, ‘probably’, or similar expressions, we are
making forward-looking statements.
There are important uncertainties, events and factors that could cause our actual results or
performance to differ materially from those in the forward-looking statements contained in this
document, including the following: the impact of any regional, national or global political, economic,
business, competitive, market, environmental or regulatory conditions on our global business
operations; the impact of current global economic conditions on our results of operations and financial condition, including as a result of those associated with the Eurozone,
any insolvencies of or other difficulties experienced by our clients, insurance companies or financial
institutions;= our ability to implement and fully realize anticipated benefits of our new
growth strategy and revenue generating initiatives; our ability to implement and realize anticipated
benefits of any expense reduction initiative, including our ability to achieve expected savings
from the multi-year operational improvement program as a result of unexpected costs or delays and demand on managerial, operational and administrative resources and/or
macroeconomic factors affecting the program; volatility or declines in insurance markets and premiums
on which our commissions are based, but which we do not control; our ability to develop and
implement technology solutions and invest in innovative product offerings in an efficient and effective manner; our ability to continue to manage our significant
indebtedness; our ability to compete in our industry, including any impact if we continue to refuse to
accept contingent commissions from carriers in the non-Human Capital areas of our retail
brokerage business; our ability to develop new products and services; material changes in commercial property and casualty markets generally or the availability of insurance
products or changes in premiums resulting from a catastrophic event, such as a hurricane; our ability
to retain key employees and clients and attract new business; the timing or ability to carry
out share repurchases and redemptions; the timing or ability to carry out refinancing or take other steps to manage our capital and the limitations in our long-term debt agreements
that may restrict our ability to take these actions; fluctuations in our earnings as a result of
potential changes to our valuation allowance(s) on our deferred tax assets; any fluctuations in
exchange and interest rates that could affect expenses and revenue; the potential costs and
difficulties in complying with a wide variety of foreign laws and regulations and any related
changes, given the global scope of our operations; rating agency actions, including a downgrade to our
credit rating, that could inhibit our ability to borrow funds or the pricing thereof and in
certain circumstances cause us to offer to buy back some of our debt; a significant decline in the value of investments that fund our pension plans or changes in our pension plan
liabilities or funding obligations; our ability to achieve anticipated benefits of any acquisition or
other transactions in which we may engage, including any revenue growth or operational
efficiencies; our ability to effectively integrate any acquisition into our business; our inability to
exercise full management control over our associates, such as Gras Savoye; our ability to
receive dividends or other distributions in needed amounts from our subsidiaries; changes in the tax
or accounting treatment of our operations and fluctuations in our tax rate; any potential
impact from the US healthcare reform legislation; our involvement in and the results of any regulatory investigations, legal proceedings and other contingencies; underwriting,
advisory or reputational risks associated with non-core operations as well as the potential
significant impact our non-core operations (including the Willis Capital Markets & Advisory
operations) can have on our financial results; our exposure to potential liabilities arising from
errors and omissions and other potential claims against us; and the interruption or loss of our
information processing systems, data security breaches or failure to maintain secure information
systems; impairment of the goodwill in one of our reporting units, in which case we may
be required to record significant charges to earnings.
Although we believe that the assumptions underlying our forward-looking statements are reasonable,
any of these assumptions, and therefore also the forward-looking statements based on these
assumptions, could themselves prove to be inaccurate. In light of the significant uncertainties inherent in the forward-looking statements included in this presentation,
our inclusion of this information is not a representation or guarantee by us that our objectives and
plans will be achieved. Our forward-looking statements speak only as of the date made and
we will not update these forward-looking statements unless the securities laws require us to do so. In light of these risks, uncertainties and assumptions, the forward-looking
events discussed in this presentation may not occur, and we caution you against unduly relying on
these forward-looking statements. The foregoing list of factors is not exhaustive and new factors may emerge from
time to time that could also affect actual performance and results. For more information see the
section
entitled
‘‘Risk
Factors’’
included
in
Willis’
Form
10-K
for
the
year
ended
December
31,
2013
and
our
subsequent
filings
with
the
Securities
and
Exchange
Commission.
Copies are available online at http://www.sec.gov or
www.willis.com. |
 Important
disclosures regarding non-GAAP measures This
presentation contains references to
"non-GAAP financial measures" as defined in Regulation G of SEC rules.
We present these measures because we believe they are of interest to the
investment community and they provide additional meaningful methods of
evaluating certain aspects of the Company’s operating performance from period to period on a basis
that may not be otherwise apparent on a generally accepted accounting principles
(GAAP) basis. These financial measures should be viewed in addition to, not
in lieu of, the Company’s condensed consolidated income statements and balance sheet
as
of
the
relevant
date.
Consistent
with
Regulation
G,
a
description
of
such
information
is
provided
below
and
a
reconciliation
of
certain
of
such
items
to
GAAP
information
can
be
found
in
our
periodic
filings
with
the
SEC.
Our
method
of
calculating
these non-GAAP financial measures may differ from other companies and therefore
comparability may be limited. Adjusted operating income
is defined as operating income (loss), excluding certain items as set out on pages
19 and 20. Adjusted
operating
margin
is
defined
as
the
percentage
of
adjusted
operating
income
to
total
revenues.
Adjusted
net
income
is
defined
as
net
(loss)
income,
excluding
certain
items
as
set
out
on
pages
21
and
22.
Adjusted earnings per share (Adjusted EPS)
is defined as adjusted net income per diluted share.
Adjusted
EBITDA
is
defined
as
Adjusted
operating
income,
excluding
depreciation
and
amortization
as
set
out
on
pages
23
and 24.
Organic commissions & fees growth
excludes: (i) the impact of foreign currency translation; (ii) the first twelve
months of net
commission
and
fee
revenues
generated
from
acquisitions;
and
(iii)
the
net
commission
and
fee
revenues
related
to
operations disposed of in each period presented, as set out on pages 25 and 26.
Reconciliations to GAAP measures are provided for selected non-GAAP
measures. | 18 |
 Important
disclosures regarding non-GAAP measures (continued) Operating income (loss)
to adjusted operating income See related footnotes on page 27
| 19
FY
2011
FY
2012
FY
2013
(In millions)
Operating income (loss)
$571
($225)
$663
Excluding:
Fees related to extinguishment of debt
(a)
-
-
1
Expense reduction initiative
(b)
-
-
46
Goodwill impairment charge
(c)
-
492
-
Write-off of unamortized cash retention awards
(d)
-
200
-
2012 cash bonus accrual
(e)
-
252
-
Insurance recovery
(f)
-
(10)
-
Write-off of uncollectible accounts receivable and
legal fees
(g)
22
13
-
India JV settlement
(h)
-
11
-
2011 Operational review
(i)
180
-
-
Financial Services Authority regulatory settlement
11
-
-
Adjusted operating income
$784
$733
$710
Operating margin
16.6%
(6.5%)
18.1%
Adjusted operating margin
22.7%
21.1%
19.4% |
 Important
disclosures regarding non-GAAP measures (continued) Operating income to
adjusted operating income See related footnotes on page 27
| 20
2013
2014
(In millions)
1Q
2Q
3Q
4Q
FY
1Q
Operating income
$281
$167
$70
$145
$663
$326
Excluding:
Fees related to the extinguishment
of debt
(a)
-
-
1
-
1
-
Expense reduction initiative
(b)
46
-
-
-
46
-
Adjusted Operating income
$327
$167
$71
$145
$710
$326
Operating Margin
26.7%
18.8%
8.8%
15.8%
18.1%
29.7%
Adjusted Operating Margin
31.1%
18.8%
8.9%
15.8%
19.4%
29.7% |
 Important
disclosures regarding non-GAAP measures (continued) Net income (loss) to
adjusted net income See related footnotes on page 27
| 21
FY
2011
FY
2012
FY
2013
(In millions, except per share data)
Net income (loss)
$203
($446)
$365
Excluding the following, net of tax:
Fees related to the extinguishment of debt
(a)
-
-
1
Debt extinguishment charge
(a)
-
-
60
Expense reduction initative
(b)
-
-
38
Goodwill impairment charge
(c)
-
458
-
Write-off of unamortized cash retention awards
(d)
-
138
-
2012 cash bonus accrual
(e)
-
175
-
Insurance recovery
(f)
-
(6)
-
Write-off of uncollectible accounts receivable and legal fees
(g)
13
8
-
India JV settlement
(h)
-
11
-
2011 Operational review
(i)
128
-
-
Financial Services Authority regulatory settlement
11
-
-
Deferred tax valuation allowance
-
113
10
Make-whole amounts on repurchase and redemption of Senior
Notes and write-off of unamortized debt costs
131
-
-
Net (gain) loss on disposal of operations
(4)
3
(2)
Adjusted net income
$482
$454
$472
Diluted shares outstanding
176
176
179
Net income (loss) per diluted share
Adjusted net income per diluted share
$2.04
$2.64
$1.15
$2.74
($2.58)
$2.58 |
 Important
disclosures regarding non-GAAP measures (continued) Net income (loss) to
adjusted net income See related footnotes on page 27
| 22
2013
2014
(In millions, except per share data)
1Q
2Q
3Q
4Q
FY
1Q
Net income (loss) from continuing operations
$219
$105
($27)
$68
$365
$246
Excluding the following, net of tax:
Fees related to the extinguishment of debt
(a)
-
-
1
-
1
-
Debt extinguishment charge
(a)
-
-
60
-
60
-
Expense reduction initiative
(b)
38
-
-
-
38
-
Net (gain) loss on disposal of operations
-
-
-
(2)
(2)
2
Deferred tax valuation allowance
-
-
-
10
10
-
Adjusted Net income from continuing operations
$257
$105
$34
$76
$472
$248
Diluted shares outstanding
176
178
180
182
179
182
Net income
per diluted share
$(0.15)
$0.37
1.35
Adjusted net income
per diluted share
1.36
$2.04
$2.64
$0.19
$1.46
$0.59
$0.59
$1.24
$0.42 |
 Important
disclosures regarding non-GAAP measures (continued) Adjusted EBITDA and
Debt/Adjusted EBITDA See related footnotes on page 27
| 23
FY
2011
FY
2012
FY
2013
(In millions)
Operating income (loss)
$571
($225)
$663
Excluding:
Fees related to the extinguishment of debt
(a)
-
-
1
Expense reduction initiative
(b)
-
-
46
Goodwill impairment charge
(c)
-
492
-
Write-off of unamortized cash retention awards
(d)
-
200
-
2012 cash bonus accrual
(e)
-
252
-
Insurance recovery
(f)
-
(10)
-
Write-off of uncollectible accounts receivable and
legal fees
(g)
22
13
-
India JV settlement
(h)
-
11
-
2011 Operational review
(i)
180
-
-
Financial Services Authority regulatory settlement
11
-
-
Adjusted operating income
$784
$733
$710
Add back
Depreciation
69
79
89
Amortization of intangibles
68
59
55
Adjusted EBITDA
$912
$871
$854
Debt
2,369
2,353
2,326
Debt / Adjusted EBITDA
2.6x
2.7x
2.7x |
 Important
disclosures regarding non-GAAP measures (continued) Adjusted EBITDA and
Debt/Adjusted EBITDA See related footnotes on page 27
| 24
2014
(In millions)
1Q
2Q
3Q
4Q
FY
1Q
LTM
Operating income
$281
$167
$70
$145
$663
$326
$708
Excluding:
Fees related to extinguishment of debt
(a)
-
-
1
-
1
-
1
Expense reduction initiative
(b)
46
-
-
-
46
-
-
Adjusted Operating income
$327
$167
$71
$145
$710
$326
$709
Add back
Depreciation
21
21
21
26
89
23
91
Amortization of intangibles
14
14
14
13
55
13
54
Adjusted EBITDA
$362
$202
$106
$184
$854
$362
$854
Debt
2,322
Debt / Adjusted EBITDA
2.7x
2013 |
 Important
disclosures regarding non-GAAP measures (continued) Commissions and fees
analysis | 25
2014
2013
Change
Foreign
currency
translation
Acquisitions
and disposals
Organic
commissions
and fees growth
($ millions)
%
%
%
%
Three months ended March
31, 2014
North America
$369
$355
3.9
(0.1)
(0.7)
4.7
International
279
264
5.7
(1.5)
0.0
7.2
Global
442
427
3.5
1.6
(0.1)
2.0
Total
$1,090
$1,046
4.2
0.3
(0.3)
4.2 |
 Important
disclosures regarding non-GAAP measures (continued) Commissions and fees
analysis | 26
2013
2012
Change
Foreign
currency
translation
Acquisitions
and
disposals
Organic
commissions
and fees growth
($ millions)
%
%
%
%
2013 Full year
North America
$1,349
$1,281
5.3
(0.1)
0.6
4.8
International
926
874
5.9
0.1
-
5.8
Global
1,358
1,303
4.2
(0.9)
0.8
4.3
Commissions and Fees
$3,633
$3,458
5.1
(0.3)
0.5
4.9
2012
2011
Change
Foreign
currency
translation
Acquisitions
and
disposals
Organic
commissions
and fees growth
($ millions)
%
%
%
%
2012 Full year
North America
$1,281
$1,285
(0.3)
0.1
-
(0.4)
International
874
870
0.5
(5.8)
-
6.3
Global
1,303
1,259
3.5
(1.4)
0.2
4.7
Commissions and Fees
$3,458
$3,414
1.3
(1.8)
-
3.1
2011
2010
Change
Foreign
currency
translation
Acquisitions
and
disposals
Organic
commissions
and fees growth
($ millions)
%
%
%
%
2011 Full year
North America
$1,285
$1,344
(4.4)
(0.1)
1.3
(5.6)
International
870
777
12.0
4.7
-
7.3
Global
1,259
1,172
7.4
2.5
(2.3)
7.2
Commissions and Fees
$3,414
$3,293
3.7
2.1
(0.2)
1.8 |
 Important
disclosures regarding non-GAAP measures (continued) | 27
(a)
In August 2013, Willis bought back $521 million of outstanding 2015, 2017 and 2019 senior notes
through a tender offer. In conjunction with this activity, the Company recorded a loss on debt
extinguishment of $60 million. Willis also recorded a $1 million expense for tender related fees (recorded within other
operating expenses).
(b)
$46 million pre-tax charge associated with expense reduction initiative in 1Q13. (c)
Impairment charge to reduce carrying value of North America segment goodwill. (d)
Charge to write-off unamortized balance of past cash retention awards related to change in
remuneration policy.
(e)
Accrual for 2012 bonuses paid in 2013 related to change in remuneration policy. (f)
Insurance recovery related to (g) below. (g)
Write-off of uncollectible accounts receivable balance, together with associated legal costs. (h)
Settlement with former partners related to the termination of a joint venture arrangement in India. (i)
$180 million pre-tax charge in FY2011 relating to the 2011 operational review, including $98
million of severance costs relating to the elimination of approximately 1,200 positions in
FY2011. |
 WILLIS
GROUP HOLDINGS Fact Book
First Quarter 2014
May 2014 |