Attached files
| file | filename |
|---|---|
| 8-K - FORM 8-K - New York REIT Liquidating LLC | v379097_8k.htm |

0 February 2014 Investor Presentation May 2014

1 Forward Looking Statements Certain statements included in this presentation are forward - looking statements . Those statements include statements regarding the intent, belief or current expectations of New York REIT, Inc . (the "Company," "we," "our" or "us") and members of our management team , as well as the assumptions on which such statements are based, and generally are identified by the use of words such as "may," " will", " seeks," "anticipates," "believes," "estimates," "expects," " plans," "intends," "should" or similar expressions . Actual results may differ materially from those contemplated by such forward - looking statements . Further, forward - looking statements speak only as of the date they are made, and we undertake no obligation to update or revise forward - looking statements to reflect changed assumptions, the occurrence of unanticipated events or changes to future operating results over time, unless required by law .

2 The following are some of the risks and uncertainties, although not all risks and uncertainties, that could cause our actual results to differ materially from those presented in our forward - looking statements : • All of our executive officers are also officers, managers and/or holders of a direct or indirect interest in our Advisor and other American Realty Capital - affiliated entities ; as a result, our executive officers, our Advisor and its affiliates face conflicts of interest, including significant conflicts created by our Advisor’s compensation arrangements with us and other investor entities advised by American Realty Capital affiliates, and conflicts in allocating time among these entities and us, which could negatively impact our operating results ; • Because investment opportunities that are suitable for us may also be suitable for other American Realty Capital - advised programs or investors, our Advisor and its affiliates face conflicts of interest relating to the purchase of properties and other investments and such conflicts may not be resolved in our favor, meaning that we could invest in less attractive assets, which could reduce the investment return to our stockholders ; • We depend on tenants for our revenue, and, accordingly, our revenue is dependent upon the success and economic viability of our tenants ; • We may not be able to achieve our rental rate incentives and our expenses could be greater, which may impact our results of operations ; • Increases in interest rates could increase the amount of our debt payments and limit our ability to pay distributions ; • We may not generate cash flows sufficient to pay our distributions to stockholders, as such, we may be forced to borrow at higher rates or depend on our Advisor or our Property Manager, New York Recovery Properties, LLC, to waive reimbursement of certain expenses and fees to fund our operations ; • We may be unable to pay or maintain cash distributions or increase distributions over time ; • We are obligated to pay fees, which may be substantial, to our Advisor and its affiliates, including fees payable upon the sale of properties ; • We are subject to risks associated with the significant dislocations and liquidity disruptions that recently existed or occurred in the credit markets of the United States ; • We may fail to continue to qualify to be treated as a real estate investment trust for U . S . federal income tax purposes (“REIT”) ; • Our properties may be adversely affected by economic cycles and risks inherent to the New York metropolitan statistical area (“MSA”), especially New York City ; and • Changes in general economic, business and political conditions, including the possibility of intensified international hostilities, acts of terrorism, and changes in conditions of United States or international lending, capital and financing markets . Forward - Looking Statements (cont’d)
3 Michael A. Happel, President Mr . Happel has over 25 years of experience investing in real estate including acquisitions of office, retail, multifamily, industrial, and hotel properties as well as acquisitions of real estate companies and real estate debt . From 1988 - 2002 , he worked at Morgan Stanley & Co . , specializing in real estate and becoming co - head of acquisitions for the Morgan Stanley Real Estate Funds, or MSREF, in 1994 . While at MSREF, he was involved in acquiring over $ 10 billion of real estate and related assets in MSREF I and MSREF II . As stated in a report prepared by Wurts & Associates for the Fresno County Employees’ Retirement Association for the period ending September 30 , 2008 , both MSREF I and MSREF II generated approximately a 48 % gross IRR for investors and MSREF II generated approximately a 27 % gross IRR for investors . Mr . Happel later joined Westbrook Partners, a real estate private equity firm with over $ 5 billion of real estate assets . In 2004 , he joined Atticus Capital, a multi - billion dollar hedge fund, as the head of real estate with responsibility for investing primarily in REITs and other publicly traded real estate securities . Gregory W. Sullivan, Chief Financial Officer Mr . Sullivan was Chief Financial Officer, Executive Vice President and Treasurer of STAG Capital Partners prior to joining ARC . Mr . Sullivan served on the Board of Managers of STAG Capital Partners, LLC and STAG Capital Partners III, LLC from 2004 to 2011 . He served as Executive Vice President for Corporate Development for New England Development LLC (NED) from 2002 to 2011 , where his role was to expand and diversify NED's real estate and non - real estate private equity activities . Prior to joining NED in 2002 , Mr . Sullivan was Executive Vice President and Chief Financial Officer of Trizec Hahn Corporation from 1994 to 2001 , a publicly traded real estate company headquartered in Toronto . From 1987 to 1994 , Mr . Sullivan served in various capacities at AEW Capital Management in Boston including overseeing investments for the company's real estate opportunity fund and heading the capital markets group . In addition, from 1982 to 1987 , he served as a senior finance officer at M/A - COM, Inc . , a Boston based telecommunications company and, from 1980 to 1982 , he served as an investment banker at Smith Barney in New York . Mr . Sullivan received his Bachelor of Sciences degree from the University of Vermont and his Master of Business Administration degree from The Wharton School of the University of Pennsylvania . Andrew G. Backman, Managing Director – Investor Relations and Public Relations Andrew G . Backman is a global financial and operational executive with 20 + years of experience in all aspects of the business lifecycle ; from initial public offerings through bankruptcy avoidance, leading high - profile telecommunications, financial services, commercial real estate finance and media & entertainment organizations . Andy has developed and executed fully integrated and award winning Investor Relations and Public Relations programs, provided strategic counsel, reputation management, crisis management and strategic communication to executive management and Boards of Directors in multiple industries during some of the most challenging markets in recent time . Andy guided major established and IPO organizations through the beginning and ultimate implosion of the telecom bubble of the late 1990 ’s and early 2000 ’s including AT&T Corporation, Lucent Technologies, Corvis Corporation and Broadwing Communications . Following a successful 15 year career in telecommunications, Andy then developed and executed the Investor Relations, Public Relations, Advertising and Marketing strategies, and was integrally involved in all capital markets and restructuring initiatives for iStar Financial, one of the largest (> $ 15 b AUM) and most respected diversified Commercial Real Estate Investment Trusts (REITs) in the country, managing through the unprecedented market turmoil, including bankruptcy avoidance, occurring since 2007 in the broader financial and commercial real estate markets . Andy has a B . A . in economics from Boston College and is a graduate of AT&T / Lucent Technologies prestigious Financial Leadership Development Program (FLDP), an intense, two - year rotation finance and accounting program for high - performing executives where he graduated at the top of his class . Senior Management Team

4 Introduction » New York REIT, Inc. (“NYRT”) is a publicly traded real estate investment trust listed on the New York Stock Exchange • Listed on the NYSE on April 15, 2014 • Ticker symbol NYRT » Enterprise value of approximately $2.8 billion (1) but “under - followed” • No sell side research yet • Not added to the major indexes yet » NYRT’s portfolio includes 23 properties with over 3.1 million square feet • 100% located in New York City • 90% office and retail properties (1) Based on the May 9, 2014 closing price of $10.57 per share, and March 31, 2014 debt balances and share count

5 Investment Highlights (1) Assumes 48.9% of Projected Cash NOI at Worldwide Plaza; does not include adjustment for preferred return . (2) Based on May 9, 2014 closing share price of $10.57 » Pure play on New York City • 100% New York City / 96% Manhattan » Strong internal growth opportunity • 13% to 15% same store cash NOI growth from 2014 to 2015 (1) » Proven acquisition capabilities • Acquired over $2 billion of Manhattan real estate • Fixed price option to buy remaining portion of Worldwide Plaza » Strong balance sheet • 33% debt/enterprise value (2) • Minimal near term debt maturities » Experienced management team
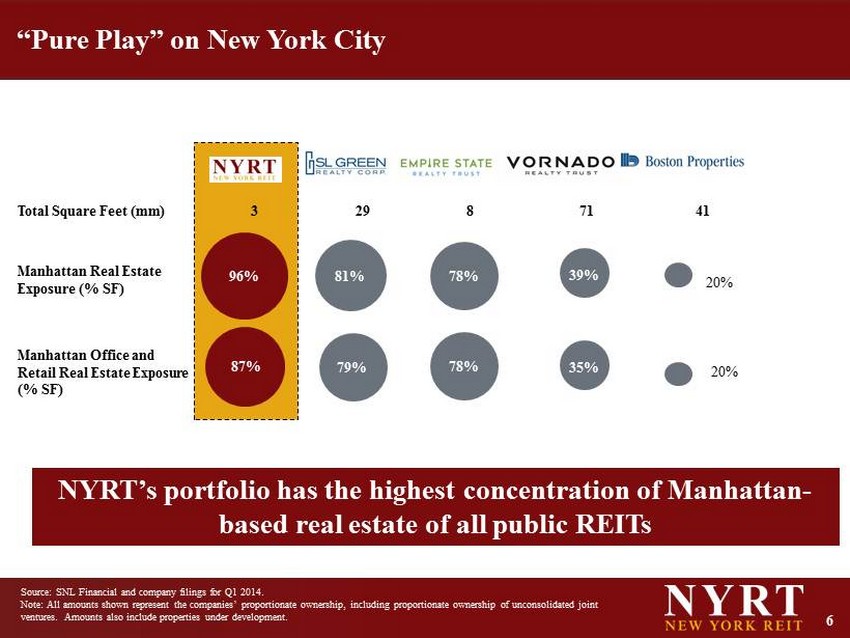
6 “Pure Play” on New York City Source: SNL Financial and company filings for Q1 2014. Note: All amounts shown represent the companies’ proportionate ownership, including proportionate ownership of unconsolidated jo int ventures. Amounts also include properties under development. 96% 81% Total Square Feet (mm) 3 29 8 71 41 Manhattan Real Estate Exposure (% SF) 20% Manhattan Office and Retail Real Estate Exposure (% SF) 20% NYRT’s portfolio has the highest concentration of Manhattan - based real estate of all public REITs 78% 78% 87% 79% 39% 35%
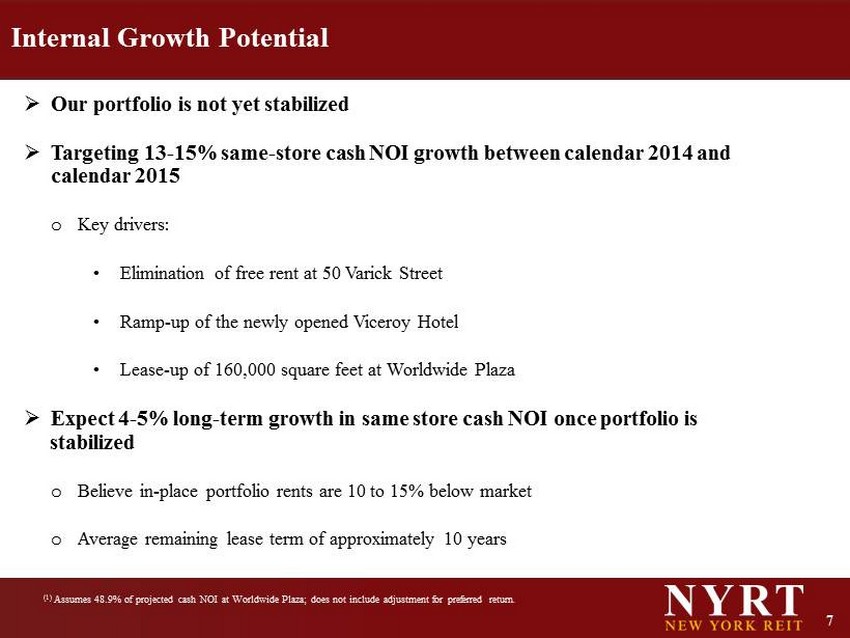
7 Internal Growth Potential » Our portfolio is not yet stabilized » Targeting 13 - 15% same - store cash NOI growth between calendar 2014 and calendar 2015 o Key drivers: • Elimination of free rent at 50 Varick Street • Ramp - up of the newly opened Viceroy Hotel • Lease - up of 160,000 square feet at Worldwide Plaza » Expect 4 - 5% long - term growth in same store cash NOI once portfolio is stabilized o Believe in - place portfolio rents are 10 to 15% below market o Average remaining lease term of approximately 10 years (1) Assumes 48.9% of projected cash NOI at Worldwide Plaza; does not include adjustment for preferred return .
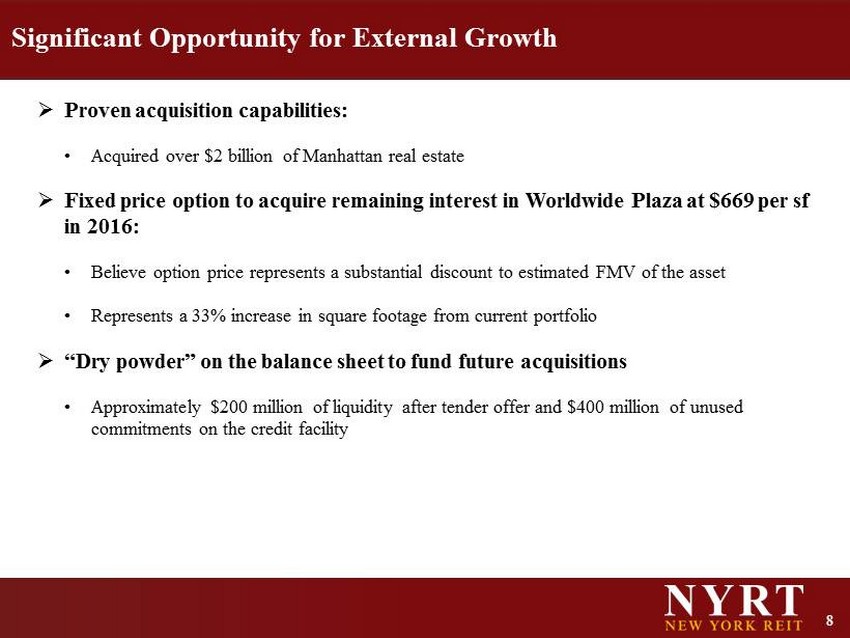
8 Significant Opportunity for External Growth » Proven acquisition capabilities: • Acquired over $2 billion of Manhattan real estate » Fixed price option to acquire remaining interest in Worldwide Plaza at $669 per sf in 2016: • Believe option price represents a substantial discount to estimated FMV of the asset • Represents a 33% increase in square footage from current portfolio » “Dry powder” on the balance sheet to fund future acquisitions • Approximately $200 million of liquidity after tender offer and $400 million of unused commitments on the credit facility
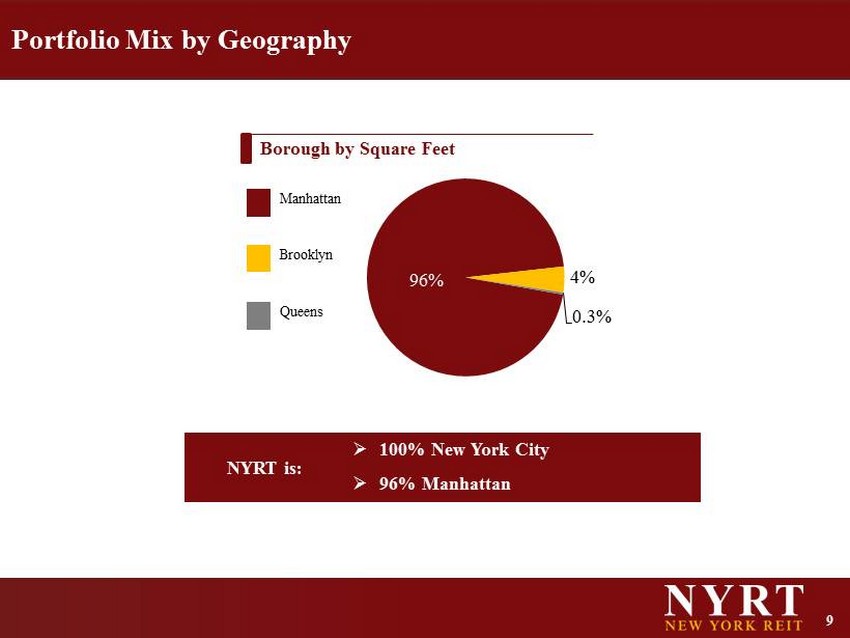
9 96% 4% 0.3 % Manhattan Brooklyn Queens Borough by S quare Feet NYRT is: » 100% New York City » 96% Manhattan Portfolio Mix by Geography
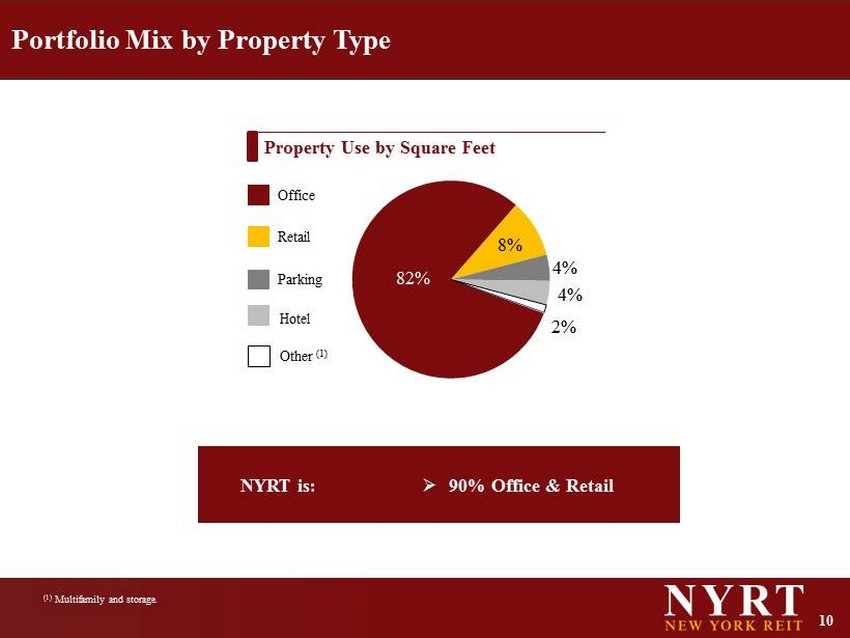
10 NYRT is: » 90% Office & Retail Portfolio Mix by Property Type 82% 8% 4 % 4% 2% Property Use by Square Feet Office Retail Parking Hotel Other (1) (1) Multifamily and storage .

11 218 West 18 th Street 50 Varick Street 256 West 38 th Street 306 East 61 st Street 229 West 36 th Street 1440 Broadway Worldwide Plaza 333 West 34 th Street Manhattan Office Portfolio Snapshot
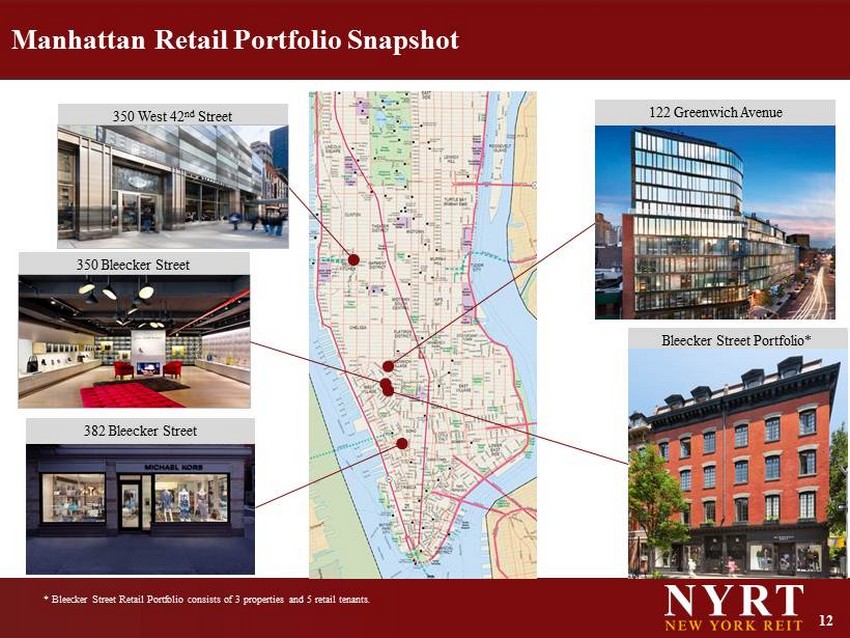
12 350 Bleecker Street 350 West 42 nd Street 382 Bleecker Street 122 Greenwich Avenue Bleecker Street Portfolio* Manhattan Retail Portfolio Snapshot * Bleecker Street Retail Portfolio consists of 3 properties and 5 retail tenants .

13 Note: As of March 31, 2014. Excludes Hotel and Multifamily properties. Well - Staggered Lease Maturity Schedule Weighted Average Remaining Lease Term of 10 years Only 24% expiring over the next five years 2.4% 12.0% 3.9% 3.9% 1.7% 0.0% 2.0% 4.0% 6.0% 8.0% 10.0% 12.0% 14.0% 2014 2015 2016 2017 2018
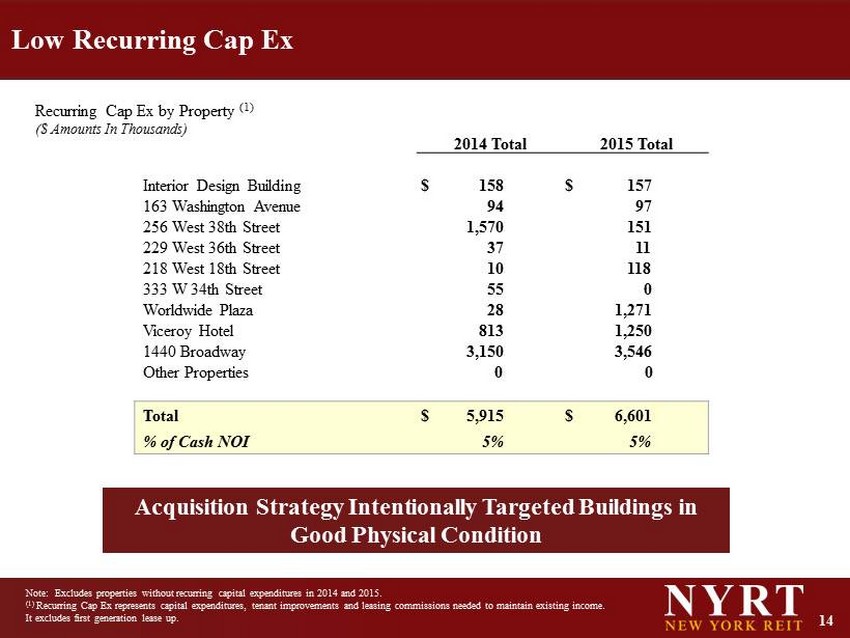
14 Low Recurring Cap Ex Note: Excludes properties without recurring capital expenditures in 2014 and 2015. (1) Recurring Cap Ex represents capital expenditures, tenant improvements and leasing commissions needed to maintain existing inc ome . It excludes first generation lease up. 2014 Total 2015 Total Interior Design Building $ 158 $ 157 163 Washington Avenue 94 97 256 West 38th Street 1,570 151 229 West 36th Street 37 11 218 West 18th Street 10 118 333 W 34th Street 55 0 Worldwide Plaza 28 1,271 Viceroy Hotel 813 1,250 1440 Broadway 3,150 3,546 Other Properties 0 0 Total $ 5,915 $ 6,601 % of Cash NOI 5 % 5 % Recurring Cap Ex by Property (1) ($ Amounts In Thousands) Acquisition Strategy Intentionally Targeted Buildings in Good Physical Condition
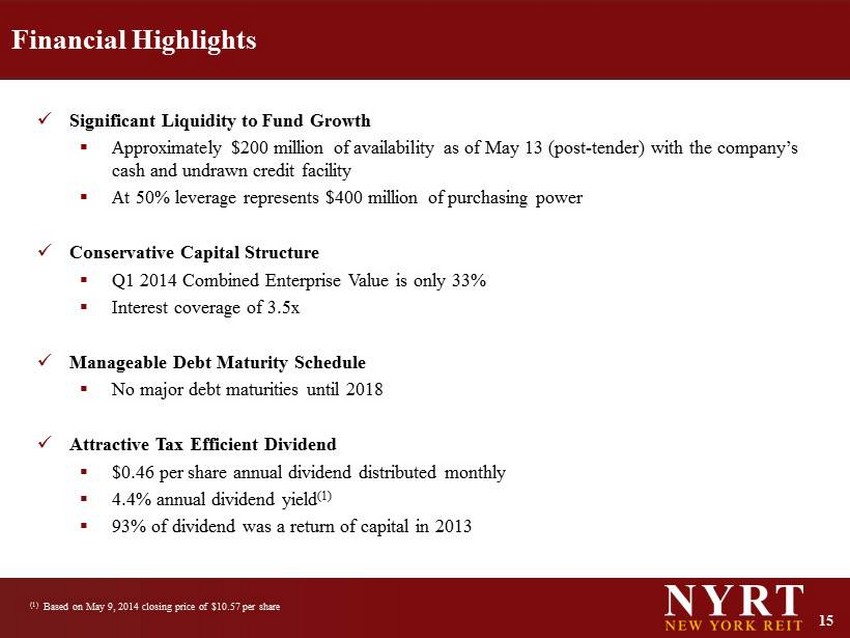
15 Financial Highlights x Significant Liquidity to Fund Growth ▪ Approximately $200 million of availability as of May 13 (post - tender) with the company’s cash and undrawn credit facility ▪ At 50% leverage represents $400 million of purchasing power x Conservative Capital Structure ▪ Q1 2014 Combined Enterprise Value is only 33% ▪ Interest coverage of 3.5x x Manageable Debt Maturity Schedule ▪ No major debt maturities until 2018 x Attractive Tax Efficient Dividend ▪ $0.46 per share annual dividend distributed monthly ▪ 4.4% annual dividend yield (1) ▪ 93% of dividend was a return of capital in 2013 (1) Based on May 9, 2014 closing price of $10.57 per share
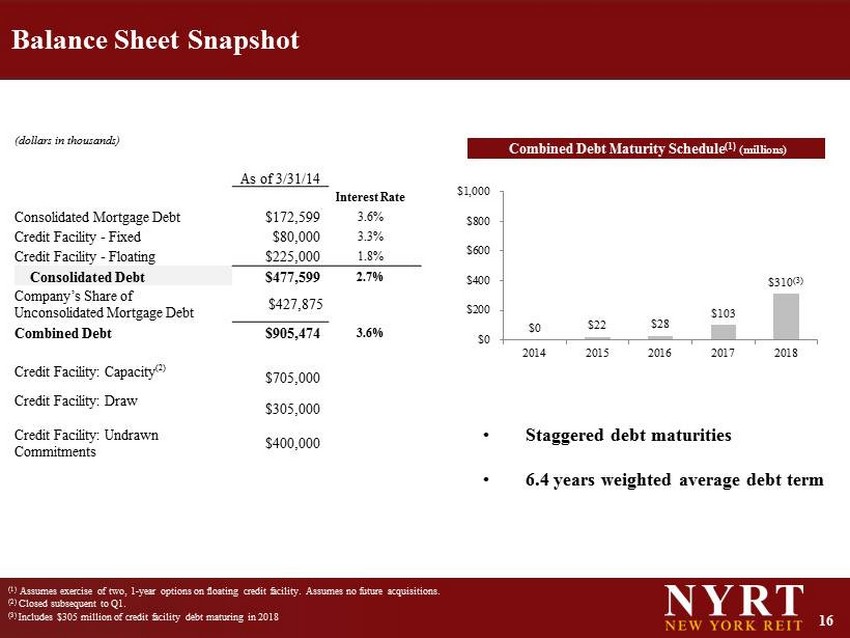
16 Balance Sheet Snapshot (1) Assumes exercise of two, 1 - year options on floating credit facility. Assumes no future acquisitions. (2) Closed subsequent to Q1. (3) Includes $305 million of credit facility debt maturing in 2018 (dollars in thousands ) As of 3/31/14 Interest Rate Consolidated Mortgage Debt $172,599 3.6% Credit Facility - Fixed $80,000 3.3% Credit Facility - Floating $225,000 1.8% Consolidated Debt $477,599 2.7% Company’s Share of Unconsolidated Mortgage Debt $427,875 Combined Debt $905,474 3.6% Credit Facility: Capacity (2) $705,000 Credit Facility: Draw $305,000 Credit Facility: Undrawn Commitments $400,000 Combined Debt Maturity Schedule (1 ) (millions) $0 $22 $28 $103 $ 310 (3) $0 $200 $400 $600 $800 $1,000 2014 2015 2016 2017 2018 • Staggered debt maturities • 6.4 years weighted average debt term

17 Debt Strategy » Strong balance sheet consistent with investment grade metrics • More unsecured financings • Target 40% to 60% unencumbered assets as a percentage of total assets • Target debt/enterprise value less than 50% • Maintain interest coverage in excess of 2.5 times • Target less than 35% floating rate debt • Maintain well staggered debt maturities

18 External Management CBD office peers » NYRT is externally managed by American Realty Capital at an annual fee of 50 basis points on assets (1) o Creates a lower cost structure for the benefit of NYRT shareholders o Allows NYRT to retain full management team that built the company o Enables NYRT to access numerous resources available at the American Realty platform » NYRT board of directors will elect to become self - managed when economically advantageous to do so o There will be no “internalization fee” charged (1) Asset management fee of 50 basis points on portfolio assets of up to $3 billion. Asset management fee will be reduced to 40 basis points for total portfolio assets of over $3 billion. The fee may be paid in cash or stock at the election of the advisor. Additional Services From Advisor Operations IT Marketing Accounting Legal Human Resources Originations Due Diligence Investment Banking Investor Relations Financing
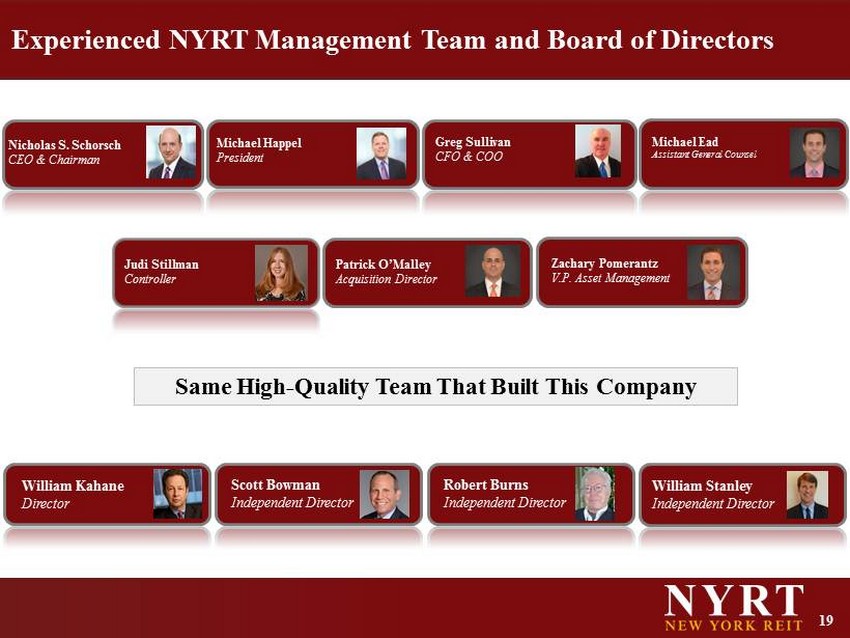
19 Michael Ead Assistant General Counsel William Stanley Independent Director Michael Happel President Judi Stillman Controller Greg Sullivan CFO & COO Robert Burns Independent Director Scott Bowman Independent Director Zachary Pomerantz V.P. Asset Management Patrick O’Malley Acquisition Director Nicholas S. Schorsch CEO & Chairman William Kahane Director Experienced NYRT Management Team and Board of Directors Same High - Quality Team That Built This Company
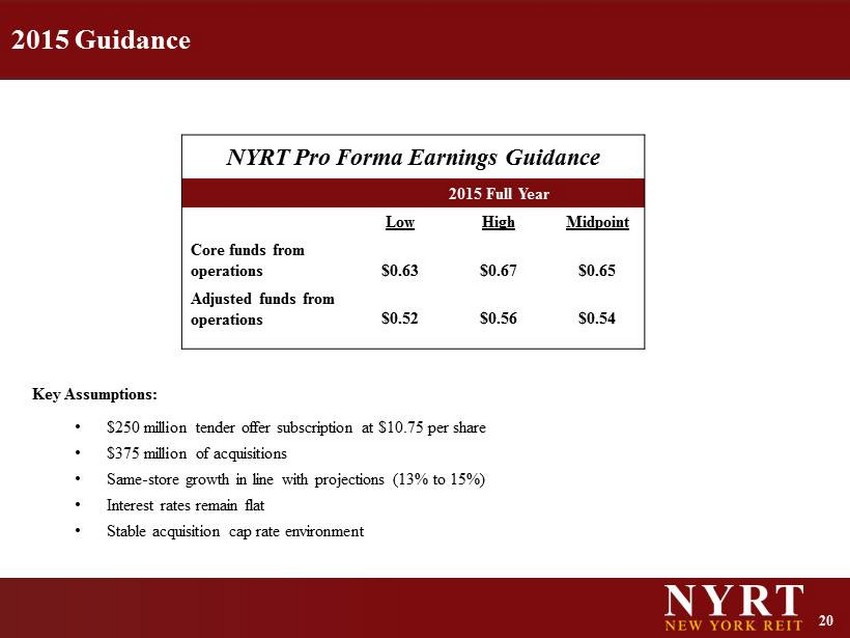
20 2015 Guidance Key Assumptions: • $250 million tender offer subscription at $10.75 per share • $375 million of acquisitions • Same - store growth in line with projections (13% to 15%) • Interest rates remain flat • Stable acquisition cap rate environment NYRT Pro Forma Earnings Guidance 2015 Full Year Low High Midpoint Core funds from operations $0.63 $0.67 $0.65 Adjusted funds from operations $0.52 $0.56 $0.54
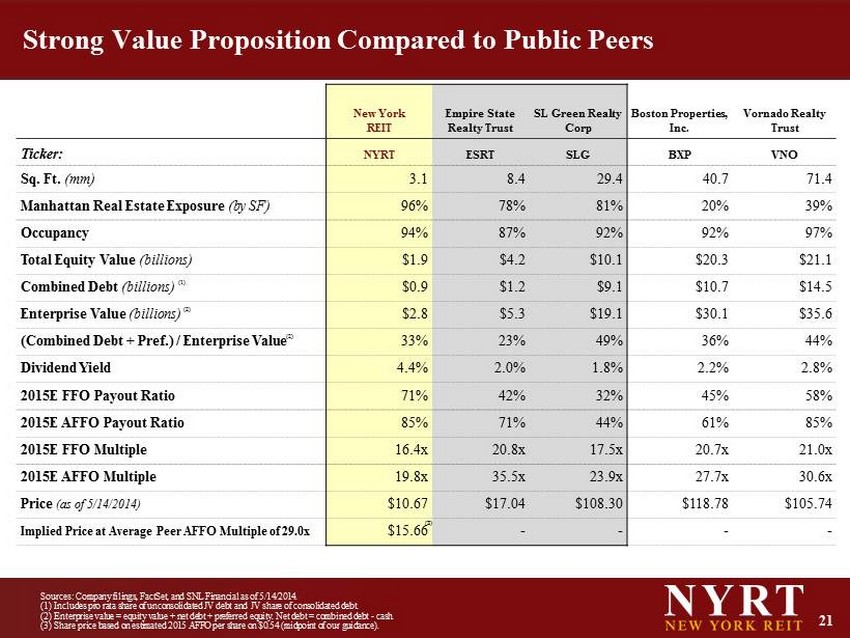
21 Strong Value Proposition Compared to Public Peers Sources : Company filings, FactSet , and SNL Financial as of 5/14/2014. (1) Includes pro rata share of unconsolidated JV debt and JV share of consolidated debt. (2) Enterprise value = equity value + net debt + preferred equity. Net debt = combined debt - cash. (3) Share price based on estimated 2015 AFFO per share on $0.54 (midpoint of our guidance). New York REIT Empire State Realty Trust SL Green Realty Corp Boston Properties, Inc. Vornado Realty Trust Ticker: NYRT ESRT SLG BXP VNO Sq. Ft. (mm) 3.1 8.4 29.4 40.7 71.4 Manhattan Real Estate Exposure (by SF) 96% 78% 81% 20% 39% Occupancy 94% 87% 92% 92% 97% Total Equity Value (billions) $1.9 $4.2 $10.1 $20.3 $21.1 Combined Debt (billions) (1) $0.9 $1.2 $9.1 $10.7 $14.5 Enterprise Value (billions) (2) $ 2.8 $5.3 $19.1 $30.1 $35.6 (Combined Debt + Pref.) / Enterprise Value (2) 33% 23% 49% 36% 44% Dividend Yield 4.4% 2.0% 1.8% 2.2% 2.8% 2015E FFO Payout Ratio 71% 42% 32% 45% 58% 2015E AFFO Payout Ratio 85% 71% 44% 61% 85% 2015E FFO Multiple 16.4x 20.8x 17.5x 20.7x 21.0x 2015E AFFO Multiple 19.8x 35.5x 23.9x 27.7x 30.6x Price (as of 5/14/2014) $10.67 $17.04 $108.30 $118.78 $105.74 Implied Price at Average Peer AFFO Multiple of 29.0x $15.66 - - - - (3)
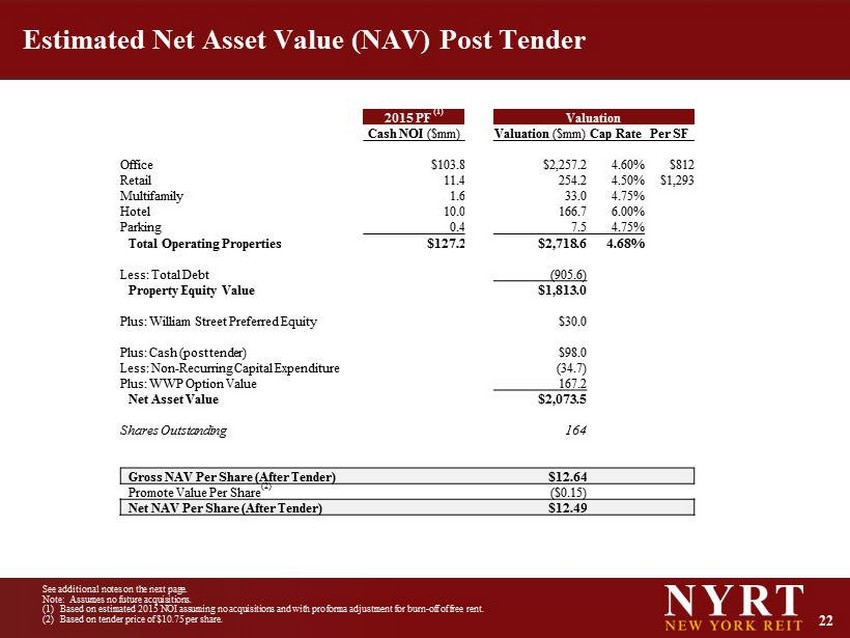
22 Estimated Net Asset Value (NAV) Post Tender 2015 PF (1) Valuation Cash NOI ($mm) Valuation ($mm) Cap Rate Per SF Office $103.8 $ 2,257.2 4.60% $812 Retail 11.4 254.2 4.50% $ 1,293 Multifamily 1.6 33.0 4.75% Hotel 10.0 166.7 6.00% Parking 0.4 7.5 4.75% Total Operating Properties $ 127.2 $ 2,718.6 4.68% Less: Total Debt (905.6) Property Equity Value $ 1,813.0 Plus: William Street Preferred Equity $30.0 Plus: Cash (post tender) $98.0 Less: Non - Recurring Capital Expenditure ( 34.7) Plus: WWP Option Value 167.2 Net Asset Value $ 2,073.5 Shares Outstanding 164 Gross NAV Per Share (After Tender) $ 12.64 Promote Value Per Share (2) ($0.15) Net NAV Per Share (After Tender) $ 12.49 See additional notes on the next page. Note : Assumes no future acquisitions. (1) Based on estimated 2015 NOI assuming no acquisitions and with pro forma adjustment for burn - off of free rent. (2) Based on tender price of $10.75 per share.

23 Notes Regarding NAV Estimate of Cash NOI: We estimated our 2015 Cash NOI based solely on the cash revenues and cash expenses we expect based on the properties that we own as of the date of this report. We projected revenues and expenses for each property based either on existing in - place leases or in the case of expiring or vacant leases, based on our experience regarding new or renewal lease rates and the expenses associated there with. We did not assume any acquisitions for these purposes. See " Abo ut the Data" herein for a discussion of Cash NOI. Cap Rate: We assumed capitalization or “cap” rates for each property type based on our recent experience in acquiring our portfolio which we believe reflects market cap rates. Promote: For purposes of calculating the promote in the form of a listing note to be issued to an affiliate of our Advisor in respect of a special interest held by th e a ffiliate in our operating partnership, we assumed "market value" would be equal to $10.75 (the tender price) multiplied the number of shares outstanding as of April 30, 2014 . WWP Option Value: We estimated the value of the property using a projection of Cash NOI and related cap rate and then subtracted the payment we wo uld have to make to acquire our partners interest. Thus, the value above reflects solely the value of our option with respect to the property . Additional Notes: Estimating NAV involves a number of subjective judgments and assumptions such as those relating to estimated cash NOI and app lic able cap rates. The assumptions that we used to estimate NAV may or may not prove to be correct, and if different assumptions were used, a differ ent estimate would likely result. Furthermore, our estimate of NAV may not fully reflect certain extraordinary events, including, without limitation, the unexp ect ed renewal or termination of a material lease, or unanticipated structural or environmental events on our portfolio. Our estimate of NAV does not represent the fair value of our assets less liabilities under GAAP. Furthermore, we did not retain a third party to value our properties. Our estimate of NAV is not a representation, warranty or guarantee of: (a) what a stockholder would ultimately realize upon a liq uid ation of our assets and settlement of our liabilities or upon any other liquidity event, (b) the price that the shares of our common stock may trade on the NYSE and (c ) w hat any third party in an arms - length transaction would offer to purchase all or substantially all of our shares of common stock .

24 Case Studies

25 • In October 2013, NYRT completed an off - market acquisition of a 48.9% equity interest in One Worldwide Plaza at a discount to replacement cost • The Trophy New York office building is currently 91 % occupied » 84 % is leased to two high - quality tenants: Nomura Holdings (Moody's: Baa3, S&P: BBB+) and Cravath Swaine & Moore • Embedded growth through contractual option to purchase the remaining 51.1% in three years at a fixed price, valuing the whole building at $1.375 billion ($669 per sf ). Total building is over 2 million square feet. • Value creation opportunity from both vacant space lease up and contractual rent increases in existing leases • NYRT currently sweeps disproportionate cash flow through its 7 % preferred return • Built in 1987 and LEED Gold certified, the asset is in excellent physical condition thus requiring minimal future capital Case Study: One Worldwide Plaza
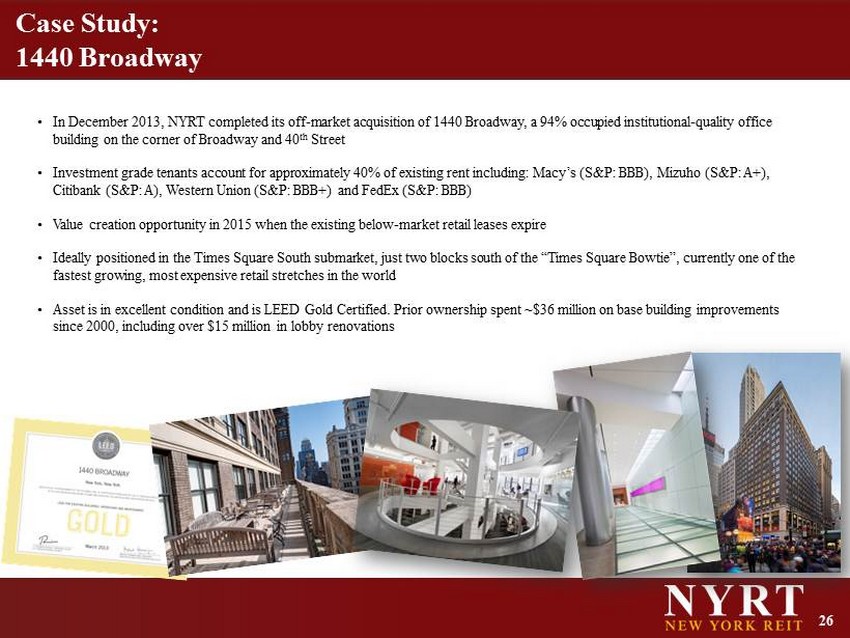
26 • In December 2013, NYRT completed its off - market acquisition of 1440 Broadway, a 94% occupied institutional - quality office building on the corner of Broadway and 40 th Street • Investment grade tenants account for approximately 40% of existing rent including: Macy’s (S&P: BBB), Mizuho (S&P: A+), Citibank (S&P: A), Western Union (S&P: BBB +) and FedEx (S&P: BBB ) • Value creation opportunity in 2015 when the existing below - market retail leases expire • Ideally positioned in the Times Square South submarket, just two blocks south of the “Times Square Bowtie”, currently one of the fastest growing, most expensive retail stretches in the world • Asset is in excellent condition and is LEED Gold Certified. Prior ownership spent ~$36 million on base building improvements since 2000, including over $15 million in lobby renovations Case Study: 1440 Broadway

27 • In March 2013, NYRT completed its acquisition of the fee simple interest in 218 West 18 th Street, a 165,670 square foot office building located on West 18 th Street between 7 th & 8 th Avenues • The 84% occupied, institutional - quality office building was acquired off market at a price well below replacement cost • Located just three blocks from the 'Google Building' at 111 Eighth Avenue, the property sits in the heart of "Silicon Alley" in the Chelsea submarket of Midtown South, Manhattan • Value creation opportunity through vacant lease up of 27,008 square feet in Midtown South, the most supply constrained submarket in Manhattan. • The building attracts a mix of tenants in the creative and technology sectors including credit tenants Red Bull, and Yammer (recently purchased by Microsoft) Case Study: 218 West 18 th Street

28 Appendix
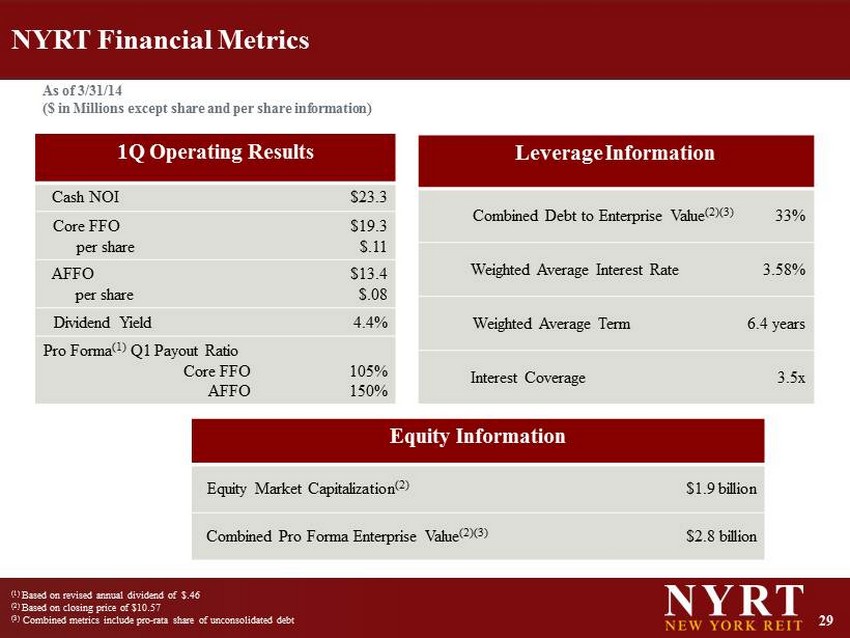
29 NYRT Financial Metrics 1Q Operating Results Cash NOI $23.3 Core FFO $19.3 per share $.11 AFFO $13.4 per share $.08 Dividend Yield 4.4% Pro Forma (1) Q1 Payout Ratio Core FFO 105% AFFO 150% Leverage Information Combined Debt to Enterprise Value (2)(3) 33% Weighted Average Interest Rate 3.58% Weighted Average Term 6.4 years Interest Coverage 3.5x As of 3/31/14 ($ in Millions except share and per share information) (1) Based on revised annual dividend of $.46 (2) Based on closing price of $10.57 (3) Combined metrics include pro - rata share of unconsolidated debt Equity Information Equity Market Capitalization (2) $1.9 billion Combined Pro Forma Enterprise Value (2)(3) $2.8 billion
30 About the Data Funds from operations (FFO) Pursuant to the revised definition of funds from operations adopted by the Board of Governors of the National Association of Rea l Estate Investment Trusts (“NAREIT”), we calculate funds from operations (FFO); a non - GAAP financial measure; by adjusting net income (loss) attributable stockholders (c omputed in accordance with GAAP, including non - recurring items) for gains (or losses) from sales of properties, impairment losses on depreciable real estate of c onsolidated real estate, impairment losses on investments in unconsolidated joint ventures driven by a measurable decrease in the fair value of depreciable real estate hel d b y the unconsolidated joint ventures, real estate related depreciation and amortization, and after adjustment for unconsolidated partnerships and joint ventures. FFO is a non - GAA P financial measure. The use of FFO, combined with the required primary GAAP presentations, has been fundamentally beneficial in improving the understanding of op era ting results of REITs among the investing public and making comparisons of REIT operating results more meaningful. Management generally considers FFO to be a us eful measure for reviewing our comparative operating and financial performance because, by excluding gains and losses related to asset sales (land and prope rty ), impairment losses and real estate asset depreciation and amortization (which can vary among owners of identical assets in similar condition based on historical cost acc ounting and useful life estimates), FFO can help one compare the operating performance of a company’s real estate between periods or as compared to different companies. Our computation of FFO may not be comparable to FFO reported by other REITs or real estate companies that do not define the term in accordance with the current NA REIT definition or that interpret the current NAREIT definition differently. FFO should not be considered as an alternative to net income attributable to stockhol der s (determined in accordance with GAAP) as an indication of our performance. FFO does not represent cash generated from operating activities determined in accordance w ith GAAP, and is not a measure of liquidity or an indicator of our ability to make cash distributions. We believe that to further understand our performance, FFO should be com pared with our reported net income attributable to stockholders and considered in addition to cash flows determined in accordance with GAAP, as presented in our co nsolidated financial statements. Adjusted funds from operations (AFFO) AFFO; a non - GAAP financial measure; is core FFO excluding certain income or expense items that we consider more reflective of in vesting activities, other non - cash income and expense items and the income and expense effects of other activities that are not a fundamental attribute of our b usi ness plan. These items include unrealized gains and losses, which may not ultimately be realized, such as gains or losses on derivative instruments, gains or losses on co ntingent valuation rights, gains and losses on investments and early extinguishment of debt. In addition, by excluding non - cash income and expense items such as amortization o f above and below market leases, amortization of deferred financing costs, straight - line rent and non - cash equity compensation from AFFO we believe we provide us eful information regarding income and expense items which have no cash impact and do not provide liquidity to the company or require capital resources of the compa ny. We exclude distributions related to Class B units and certain interest expenses related to securities that are convertible to common stock as the shares are assumed to ha ve converted to common stock in our calculation of weighted average common shares - fully diluted. Furthermore we include certain cash inflow and outflows that are r eflective of operating activities including preferred returns on joint ventures, second generation tenant improvement and leasing commissions (included in the period in whi ch the lease commences) and recurring capital expenditures. Although our AFFO may not be comparable to that of other REITs and real estate companies, we believe it provides a meaningful in dicator of our ability to fund cash needs and to make cash distributions to stockholders. In addition, we believe that to further understand our liquidity, AFFO should be compared with our cash flows determined in accordance with GAAP, as presented in our consolidated financial statements. AFFO does not represent cash generated from oper ati ng activities determined in accordance with GAAP, and AFFO should not be considered as an alternative to net income (determined in accordance with GAAP) as an indic ati on of our performance, as an alternative to net cash flows from operating activities (determined in accordance with GAAP), or as a measure of our liquidit y.
31 About the Data Earnings before interest, taxes, depreciation and amortization (EBITDA) EBITDA; a non - GAAP financial measure; is defined as net income in accordance with GAAP before interest, taxes, depreciation and amortization. We believe EBITDA is an appropriate measure of our ability to incur and service debt. EBITDA should not be considered as an alternative to cash flows fr om operating activities, as a measure of our liquidity or as an alternative to net income as an indicator of our operating activities. Other REITs may calculate EBITDA di ffe rently and our calculation should not be compared to that of other REITs. EBITDA is adjusted to include our pro - rata share of EBITDA from unconsolidated joint ventures. Net operating income (NOI) Net operating income (NOI) is a non - GAAP financial measure equal to net income attributable to stockholders, the most directly c omparable GAAP financial measure, less discontinued operations, plus corporate general and administrative expense, acquisition and transaction costs, depreciation a nd amortization and interest expense, income from unconsolidated joint ventures, interest and other income and gains from investments in securities. NOI is adjusted to in clu de our pro - rata share of NOI from unconsolidated joint ventures. We use NOI internally as a performance measure and believe NOI provides useful information to in vestors regarding our financial condition and results of operations because it reflects only those income and expense items that are incurred at the property level. Th ere fore, we believe NOI is a useful measure for evaluating the operating performance of our real estate assets and to make decisions about resource allocations. Further, we bel ieve NOI is useful to investors as a performance measure because, when compared across periods, NOI reflects the impact on operations from trends in occupancy rat es, rental rates, operating costs acquisition activity on an unleveraged basis, providing perspective not immediately apparent from net income. NOI excludes certain compon ent s from net income in order to provide results that are more closely related to a property's results of operations. For example, interest expense is not necessarily li nked to the operating performance of a real estate asset and is often incurred at the corporate level as opposed to the property level. In addition, depreciation and amortizati on, because of historical cost accounting and useful life estimates, may distort operating performance at the property level. NOI presented by us may not be comparable to NOI rep ort ed by other REITs that define NOI differently. We believe that in order to facilitate a clear understanding of our operating results, NOI should be examined in co njunction with net income as presented in our consolidated financial statements. NOI should not be considered as an alternative to net income as an indication of our perfo rma nce or to cash flows as a measure of our liquidity or ability to make distributions. Cash net operating income (Cash NOI) NOI, presented on a cash basis, which is equal to NOI after eliminating the effects of straight - lining of rent and fair value le ase revenue.