Attached files
| file | filename |
|---|---|
| 8-K - 8-K - SOUTH JERSEY INDUSTRIES INC | form8-k.htm |

May 19, 2014 1

Certain statements contained in this presentation may qualify as “forward-looking statements” within the meaning of Section 27A of the Securities Act of 1933 and Section 21E of the Securities Exchange Act of 1934. All statements other than statements of historical fact included in this Report should be considered forward-looking statements made in good faith by South Jersey Industries (SJI or the Company) and are intended to qualify for the safe harbor from liability established by the Private Securities Litigation Reform Act of 1995. When used in this presentation, or any other of the Company's documents or oral presentations, words such as “anticipate,” “believe,” “expect,” “estimate,” “forecast,” “goal,” “intend,” “objective,” “plan,” “project,” “seek,” “strategy” and similar expressions are intended to identify forward-looking statements. Such forward-looking statements are subject to risks and uncertainties that could cause actual results to differ materially from those expressed or implied in the statements. These risks and uncertainties include, but are not limited to the risks set forth under “Risk Factors” in Part I, Item 1A of our Annual Report on Form 10-K. These cautionary statements should not be construed by you to be exhaustive and they are made only as of the date of this Report. While the Company believes these forward-looking statements to be reasonable, there can be no assurance that they will approximate actual experience or that the expectations derived from them will be realized. Further, SJI undertakes no obligation to update or revise any of its forward-looking statements whether as a result of new information, future events or otherwise. Forward Looking Statements 2

Goals 2014 guidance target for Economic EPS at high end of 6%-12% growth range 2015 & Beyond targeted for average long term annual economic earnings per share growth of at least 6%-7% At least 6%-7% annual dividend improvements – Target 50%-60% payout ratio Execute from low-to-moderate risk platform 3

*Board review of dividend typically occurs at November meeting Year Increase Per Share SJI Payout Ratio Percentage Increase Peer Percentage Increase 2009 13¢ 51.4% 10.9% 4.6% 2010 14¢ 50.2% 10.6% 6.4% 2011 15¢ 51.8% 10.3% 5.0% 2012 16¢ 54.5% 9.9% 1.8% 2013 12¢ 62.4% 6.8% 4.6% Dividend Growth 4

Q1 2014 Performance 5 Economic Earnings $10 $20 $30 $40 $50 $60 $70 $80 Economic Earnings ($MM) 2013 2014 $48.4 $66.2 Economic EPS $0.50 $1.00 $1.50 $2.00 $2.50 Economic Earnings Per Share 2013 2014 $1.52 $2.02

Full Year 2014 Projected Performance 6 Economic Earnings $85 $95 $105 $115 Economic Earnings ($MM) 2013 2014 $97.1 $111.0 Economic EPS $2.50 $2.75 $3.00 $3.25 $3.50 Economic Earnings Per Share 2013 2014 $3.03 $3.39 Assumes high end of 2014 guidance range, Economic EPS growth of 12%

Business Drivers – 2014 & Beyond Utility • AIRP • Customer Growth • Rate Case – Q4 impact Complemented beyond 2014 by: • Rate case – full year impact • SHARP • BL England • Liquefaction Non-Utility • Leverage Energy Production Assets • CHP Portfolio Growth • Improving SREC Market • Fuel Manager Contracts • Targeted Solar Growth • Growing Retail Volumes and Customers 7

Utility Growth Summary Investment 2014 Incremental Net Income Benefit ($MM) 2015 Incremental Net Income Benefit ($MM) Incremental Net Income Benefit 2016 & Beyond ($MM) Rate Case - Core Filing 3.9 8.8 Next case 2017? AIRP 1.8 1.8 1.8 / year SHARP 0.0 2.0 2.0 / year Customer Growth 2.0 2.0 2.4 – 3.5 / year - CHP 0.0 0.5 1.0 – 2.0 / year - CNG 0.5 0.5 0.5 – 1.0 / year BL England 0.2* 1.0* 5.0 Liquefaction – Phase II 0.4* 1.0* 2.2 Total Incremental Net Income Benefit $8.8 $17.6 8 * Represents contribution from AFUDC Projections only, not inclusive of factors that may negatively impact total earnings for future periods indicated.

Base Rate Case • Anticipated net income value $10MM - $15MM, excluding BL England and Liquefaction, if considered under current treatment • Settlement anticipated Q4 2014 Utility Infrastructure Growth 9

AIRP • $35.3MM annual investment • Replaces bare steel and cast iron system-wide • Incremental annual net income contribution of $1.8MM through 2021 (with program extension) SHARP • $40MM proposed annual investment for 7 years • Replaces low-pressure cast iron main in coastal communities • Incremental annual net income contribution of $2.0MM through 2021 Utility Infrastructure Growth 10

Utility Customer Growth 2014 2015 Forward Conversions 6,500 6,500 – 7,500 New Construction 2,570 3,000 – 4,000 Total Customers 9,070 9,500 – 11,500 Net Customers 7,070 7,500 – 9,500 Residential Margin/Customer Commercial Margin/Customer $265 $2,200 Residential vs. Commercial Customer split 93% 7% Annual Incremental Net Margin Benefit $2.0MM $2.4 – 3.5MM 11

$55MM investment in system redundancy $1.0MM net income from AFUDC in 2015 $3.0MM net income in 2016 and beyond $35MM investment in customer dedicated line $2.0MM net income in 2016 and beyond B.L. England Pipeline 12

$43MM investment in system reliability $1.0MM net income from AFUDC in 2015 $2.2MM net income in 2016 and beyond Potential to add net income from limited sale of excess LNG Liquefaction 13

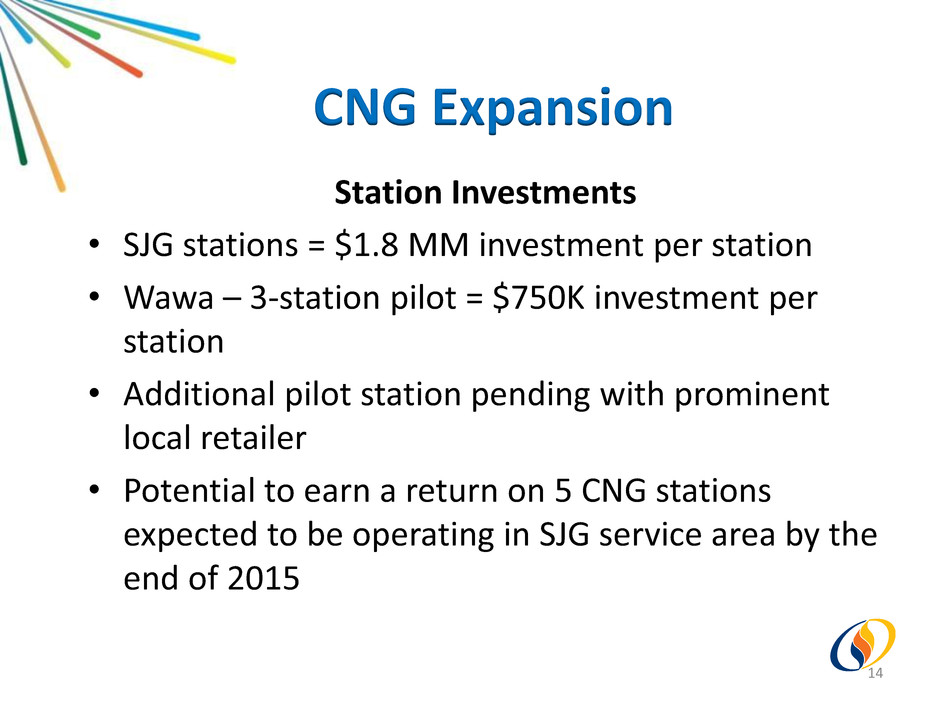
CNG Expansion Station Investments • SJG stations = $1.8 MM investment per station • Wawa – 3-station pilot = $750K investment per station • Additional pilot station pending with prominent local retailer • Potential to earn a return on 5 CNG stations expected to be operating in SJG service area by the end of 2015 14

CNG Expansion Margin Growth Expectation • 90,000 fleet potential 10% anticipated market penetration • Average vehicle payback period of 4.5 years compels conversion by fleet owners • $500 per vehicle margin – based on throughput Station ROI + Vehicle Margin ≈ $0.5MM -$1.0MM / year Incremental Net Income 15

Non-utility Growth Summary Drivers 2014 Anticipated Net Income Contribution 2015 Anticipated Net Income Contribution 2016 & Beyond Growth Drivers Energy Group 6-15% 6-10% Additional fuel management contracts Additional transportation capacity from Marcellus Retail customer growth Energy Services CHP 5-10% 5-10% Hardening incentives could significantly benefit CHP Renewable 15-20% 15-20% Targeted project investment Strengthening SREC market SJES Anticipated Contribution Range 35% - 40% 30% - 40% 16

NextEra • 750 mw, NJ based, natural gas fired, combined cycle generator • 50 mw natural gas fired, simple cycle unit • Operational since 2004 • Evergreen contract to serve 80K DTs per day LS Power • 738 mw, NJ based, natural gas fired, combined cycle generator • Q2 2014 test gas, full capacity before year end • 15-year contract to serve 36K DTs per day Panda Liberty • 829 mw, PA based, natural gas fired, combined cycle generator • 2015 test gas, full capacity in early 2016 • 5-year contract to serve up to 137K DTs per day Panda Patriot • 829 mw PA based, natural gas fired, combined cycle generator • 2015 test gas, full capacity in 2016 at 137K DTs per day • 4-year contract to serve up to 137K DTs per day Actively negotiating multiple new contracts Fuel Supply Management 17

• Annuity-like income stream from multi-year agreements • Fixed monthly fee, with index+ based commodity price sets baseline margin • Incremental margin potential from optimizing contract loads against our assets and Marcellus position • Aggregate incremental net income per year of $1MM - $2MM Fuel Supply Management 18

Capacity added since the beginning of 2013, benefiting 2014 and beyond Strategic Pipeline Capacity Pipeline Incremental Capacity Receipt National Fuel 69,310 Leidy (Marcellus – NE PA) Texas Eastern 56,000 M2 (Marcellus – SE PA) Tennessee 65,200 Tenn Z4 (NE Marcellus) Tennessee 30,000 Tenn Z4 (NE Marcellus) *Columbia 40,000 Tenn Z4 (Milford) 260,510 DTs / day 19 *Expected to benefit 2015 earnings when contract commences, increasing capacity through 2018

• Current queue of $585MM in development opportunities • $71 million in advanced stages of negotiation • ROE averages 15% - 20% • Equity component of 20% - 30% CHP 20

CHP/Thermal Projects Potential Universe 21 Based on full potential for asset hardening in New Jersey Project Facility Category Number of Targeted Facilities Estimated Size of Total Projects Estimated Total Projects Costs ($millions) Prisons 37 49 MW $121.8 Hospitals 56 149 MW $373.7 Higher Education 56 136 MW $336.4 Universe of Targeted CHP Projects Enhanced by Asset Hardening Incentives

Retail NJ PA NY ME NH MA CT RI • Active in 8 states • Targeting customer growth through geographic expansion and organic growth • Improving margins • Electric & gas both profitable in Q1 22

Average Cost per watt $2.35 Average IRR (AT) 24.95% Total Investment $47.0MM Total MW 19.8 MW Total Net Income Contribution - Year 1 $11.6MM Total Annual Net Income Contribution - Years 2-15 $1.0MM Solar Net Income Contribution from Two New Major Solar Generating Projects Expected to come on-line in 2014 or 2015 23

• Targeted project additions in support of long-term solar portfolio performance • SREC production nearly double 2013 on a YTD basis • Stabilizing SREC prices – NJ currently at $183 – MA currently at $276 • Improving project performance helps mitigate potential decline in solar ITC from incentive expiration at year-end 2016 Lower development costs + increasing SREC price + energy payments = more utility-like income stream from solar SREC Market Update 24

2014 Expected Total Contribution to Earnings 2015 Expected Total Contribution to Earnings Utility 60% - 65% 60% - 70% Utility Like (CHP) 5% - 10% 5% - 10% Total Utility & Utility Like Earnings Composition 65% - 75% 65% - 80% Competitive 25% - 35% 20% - 30% Earnings Growth 25

Goals 2014 guidance target for Economic EPS at high end of 6%-12% growth range 2015 & Beyond targeted for average long term annual economic earnings per share growth of at least 6%-7% At least 6%-7% annual dividend improvements – Target 50%-60% payout ratio Execute from low-to-moderate risk platform 26

APPENDIX 27

• 364,000+ utility customers in 115 municipalities in Southern NJ • $1.8 billion market cap • 6,300 miles of utility distribution • Assets as of 3/31/14 Utility = $1.97B Non-utility = $1.05B • $1 billion rate base • Q1 2014 Economic Earnings = $66.2M • 2013 FY Economic Earnings = $97.1M 28 SJI Overview

Total Shareholder Return – 10 Yr. % 50% 100% 150% 200% 250% 300% 350% S&P 500 S&P Utilities Index Peer Group SJI Return 29 Reflects 2004-2013 Performance
