Attached files
| file | filename |
|---|---|
| 8-K - 8-K - WILSHIRE BANCORP INC | a14-12613_18k.htm |
Exhibit 99.1
|
|
May 13, 2014 FINANCIAL SERVICES CONFERENCE J.W. Yoo / President & CEO Alex Ko / EVP & CFO Peter Koh / SVP & CCO |

|
|
Safe Harbor Statement 2 Except for the historical information in this presentation, subject matters described herein include forward-looking statements that are subject to risks and uncertainties outside of Wilshire Bancorp’s control that could cause actual results to differ materially from those expected in the forward-looking statements. Among these are governmental fiscal policy, interest rate and credit risk, the ability to succeed in new markets and business lines, balance sheet management, the global and local economies, general interest rate changes and other economic, competitive and operational factors. Investors are cautioned not to place undue reliance on forward-looking statements, which speak only as of the date of this presentation. Wilshire Bancorp disclaims any obligation to announce publicly future events or developments that may affect the accuracy the forward-looking statements herein. |
|
|
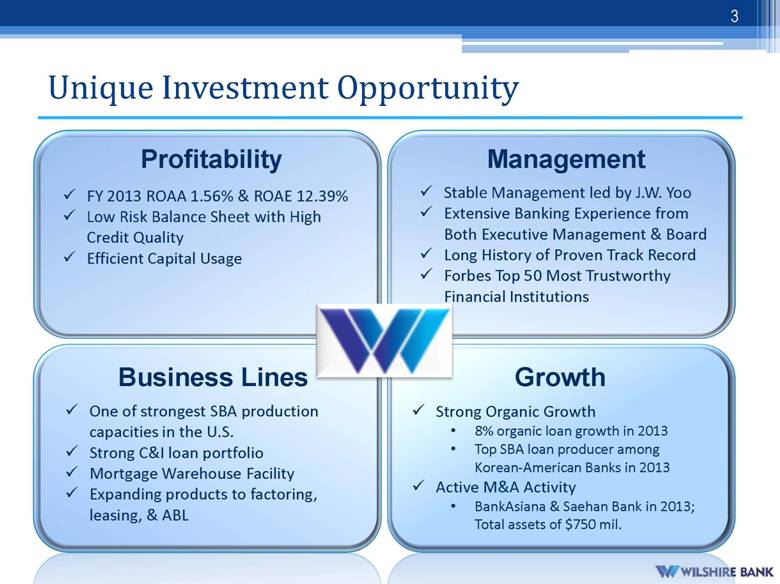
Unique Investment Opportunity 3 Profitability Management Business Lines Growth Strong Organic Growth 8% organic loan growth in 2013 Top SBA loan producer among Korean-American Banks in 2013 Active M&A Activity BankAsiana & Saehan Bank in 2013; Total assets of $750 mil. One of strongest SBA production capacities in the U.S. Strong C&I loan portfolio Mortgage Warehouse Facility Expanding products to factoring, leasing, & ABL Stable Management led by J.W. Yoo Extensive Banking Experience from Both Executive Management & Board Long History of Proven Track Record Forbes Top 50 Most Trustworthy Financial Institutions FY 2013 ROAA 1.56% & ROAE 12.39% Low Risk Balance Sheet with High Credit Quality Efficient Capital Usage |
|
|
Key Milestones 1980 Wilshire State Bank Opened 2004 Wilshire Bancorp Assets Surpassed $1 bil. Opened Dallas Branch 2006 Acquired Liberty Bank New York Reached $2 bil. in Assets 2013 Acquired BankAsiana, NJ Acquired Saehan Bancorp, CA 2009 Acquired Mirae Bank through FDIC-Assisted Transaction 2011 New Management Team Led by CEO J.W. Yoo Raised $108.7 million Capital 1980 2004 2006 2013 2009 2011 2012 2012 Full Redemption of TARP Preferred Shares and Warrants 4 2014 Named Forbes 2014 Top 50 Most Trustworthy Financial Institutions 2014 |
|
|
Forbes Top 50 Most Trustworthy Financial Companies 5 |
|
|
Long History of Continued Growth 6 Total Asset CAGR of 22% since 1996 ($ in billions) |
|
|
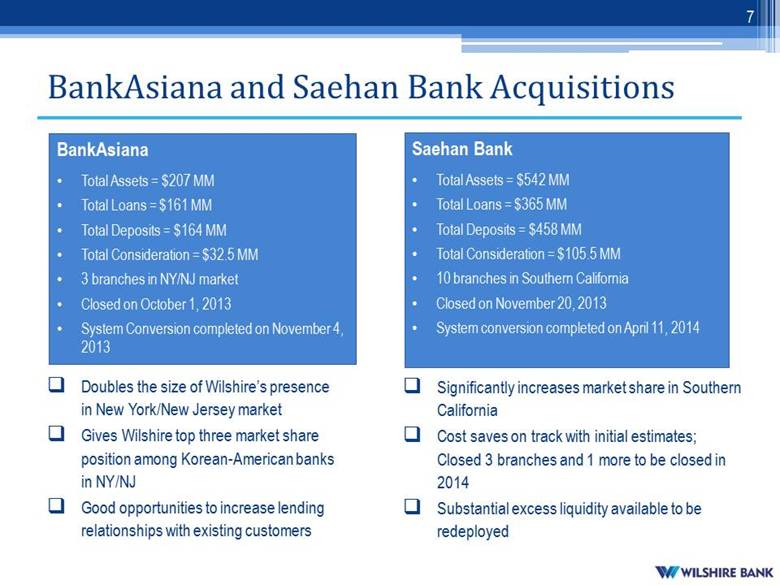
BankAsiana and Saehan Bank Acquisitions Doubles the size of Wilshire’s presence in New York/New Jersey market Gives Wilshire top three market share position among Korean-American banks in NY/NJ Good opportunities to increase lending relationships with existing customers 7 BankAsiana Total Assets = $207 MM Total Loans = $161 MM Total Deposits = $164 MM Total Consideration = $32.5 MM 3 branches in NY/NJ market Closed on October 1, 2013 System Conversion completed on November 4, 2013 Saehan Bank Total Assets = $542 MM Total Loans = $365 MM Total Deposits = $458 MM Total Consideration = $105.5 MM 10 branches in Southern California Closed on November 20, 2013 System conversion completed on April 11, 2014 Significantly increases market share in Southern California Cost saves on track with initial estimates; Closed 3 branches and 1 more to be closed in 2014 Substantial excess liquidity available to be redeployed |
|
|
Experienced Management & Board Driving Success 8 Name Title Years of Banking Experience Years with Wilshire Board of Directors Diversified expertise among the Board members from various backgrounds such as investment banking, IT, and business management Average of 30+ years Varies Jae Whan Yoo President & Chief Executive Officer 38 3 Alex Ko EVP & Chief Financial Officer 18 6 Peter Koh SVP & Chief Credit Officer 12 12 |
|
|
National Branch Network Wilshire State Bank Branches Orange County Los Angeles County San Bernardino County Summary of Operations 25 Branches in California 8 Branches in New York & New Jersey 2 Branches in Texas 7 Loan Production Offices New York Dallas Annandale San Jose Atlanta Los Angeles Denver Wilshire Bank Branches Loan Production Office 9 Queens Manhattan Fort Lee Palisades Park |
|
|
Q1 2014 Financial Highlights Net income available to common shareholders of $13.1 million, or $0.17 per share Return on average assets of 1.44% Return on average equity of 11.73% Total revenue of $50.3 million, an increase of 34% from the first quarter of 2013 Loans receivable totaled $2.87 billion at March 31, 2014, an increase of 40% from $2.05 billion at March 31, 2013 Total deposits were $2.92 billion at March 31, 2014, an increase of 35% from $2.16 billion at March 31, 2013 Non-interest bearing deposits represent largest component of deposit mix (29.7%) 67% increase in quarterly cash dividend from $0.03 to $0.05 per common share 10 |
|
|
Pre-Tax Pre-Provision Income (Consolidated; non-GAAP) 11 *Pre-Tax Pre-Provision Income is a non-GAAP measure. Non-GAAP measures have limitations as analytical tools and investors should not consider them in isolation or as a substitute for analysis of Wilshire’s results as reported under GAAP. RECONCILIATION OF GAAP FINANCIAL MEASURES TO NON-GAAP FINANCIAL MEASURES: Q1 2013 Q2 2013 Q3 2013 Q4 2013 Q1 2014 Net Income 11,589 11,539 11,334 10,914 13,113 Add Back - Income Tax Provision (Benefit) 5,384 5,465 5,357 6,075 6,789 Add Back - Credit for Losses on Loans and Loan Commitments - - - - - Pre-Tax, Pre-Provision Income (PTPP) 16,973 17,004 16,691 16,989 19,902 |
|
|
Profitability – ROAA and ROAE Source: SNL for peer average; Peer Average is based on national peers with assets between $3 to $5 billion. Figures shown as of 3/31/2014 12 |
|
|
Net Interest Margin Source: SNL for peer average; Peer Average is based on national peers with assets between $3 to $5 billion. Figures shown as of 3/31/2014 13 |
|
|
Active Capital Management & Deployment 14 Redeemed $62.5MM of TARP preferred stock Called $15.5MM of junior subordinated debt with an interest rate of 3.24% Authorized the repurchase of up to 5% of outstanding shares of common stock, or 3.6 MM shares, of which 651,412 were repurchased for $4.3MM Reinstated quarterly cash dividend at $0.03 per share Acquired Saehan Bancorp, 50%-50% cash and stock deal of $105.5MM Mar. 2012 Dec. 2012 Mar. 2013 Sep. 2013 Nov. 2013 Acquired BankAsiana, 100% cash deal of $32.5MM May 2013 Mar. 2014 Increased quarterly cash dividend by 67% to $0.05 per share |
|
|
Strong Loan Production (in thousands) 15 ($ '000) Q1 2013 Q2 2013 Q3 2013 Q4 2013 Q1 2014 RESIDENTIAL MTG $ 22,831 $ 20,022 $ 8,714 $ 13,858 $ 29,063 SBA LOANS 27,379 40,209 36,001 44,599 35,305 COMMERCIAL 55,096 40,927 23,710 30,541 36,619 REAL ESTATE 86,839 93,606 145,361 132,780 96,266 CONSUMER 537 75 540 546 632 TOTAL $ 192,682 $ 194,839 $ 214,326 $ 222,325 $ 197,886 Data as of 3/31/2014 |
|
|
Strong Credit Quality *Excluding HFS loans 16 Data as of 3/31/2014 |
|
|
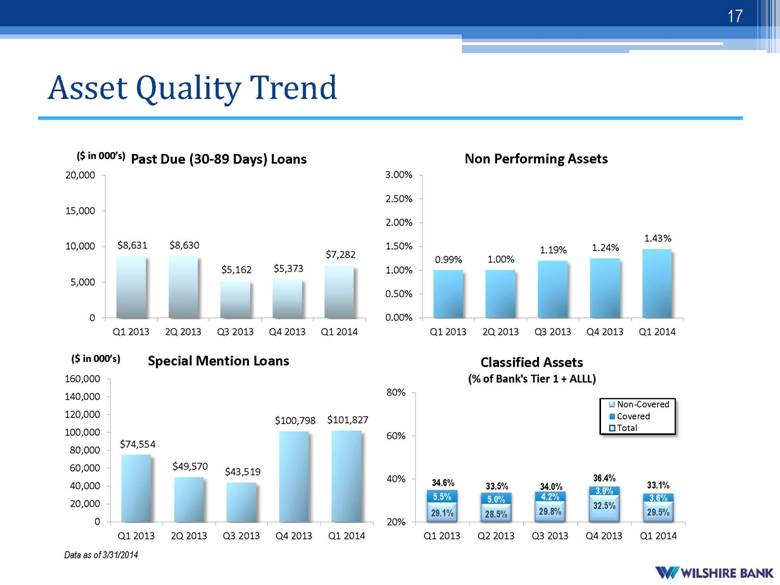
Asset Quality Trend Data as of 3/31/2014 17 |
|
|
Loan Composition 18 Data as of 3/31/2014 |
|
|
Positioned for Rising Interest Rates 19 Expected Change in Net Interest Income* (400 basis point parallel increase) ($ in thousands) Loan Type Outstanding Avg. Size Real Estate $2,276,209 $1,153 C&I 374,644 263 SBA* 242,438 145 Others 14,393 106 Gross Loans 2,907,684 $558 Loan Rate Mix * From base case with stable interest rates ** Assumes loan growth of 6.6% and 7.2% and deposit growth of 7.8% and 6.6% for year 1 and year 2, respectively * Average size of SBA loans produced is $556K Wilshire stands to benefit as short-term rates rise Data as of 3/31/2014 |
|
|
CRE Concentration by Type & Region 20 Owner Occupied Non-Owner Occupied 35% 65% Data as of 3/31/2014 |
|
|
Commercial and Industrial Loans by Type 21 Data as of 3/31/2014 |
|
|
Deposit Composition 22 Data as of 3/31/2014 ($ in millions) |
|
|
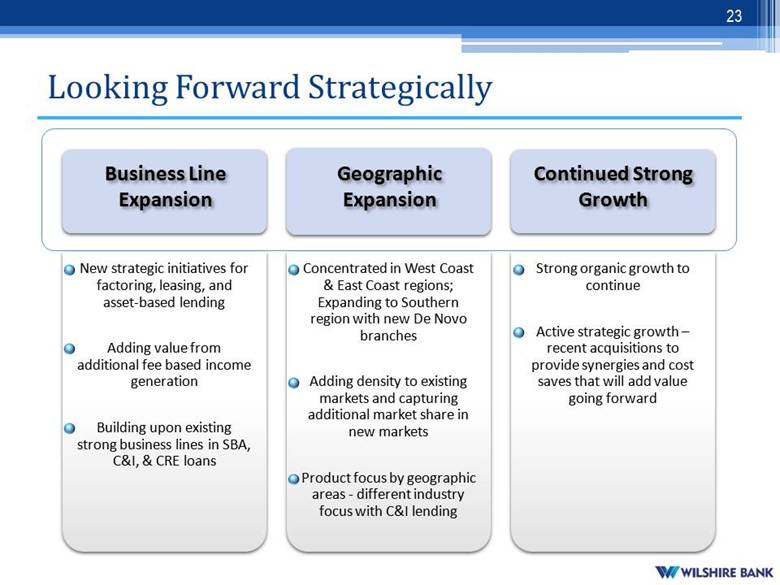
Looking Forward Strategically 23 Business Line Expansion Geographic Expansion Continued Strong Growth |
|
|
24 |

|
|
25 |