Attached files
| file | filename |
|---|---|
| 8-K - FORM 8-K - Starwood Waypoint Homes | d727613d8k.htm |
| EX-99.1 - EX-99.1 - Starwood Waypoint Homes | d727613dex991.htm |
| Exhibit 99.2
|

FIRST QUARTER 2014 Supplemental Operating & Financial Data
Starwood Waypoint Residential Trust (“SWAY”) acquires, renovates, leases, maintains and manages single family homes. We also invest in non-performing loans to supplement growth and seek optimal resolutions for each loan by working with interested and qualified borrowers to find the most appropriate solutions to keep them in their home or, alternatively, converting loans into homes for rent or sale. We are focused on building a leading, nationally recognized brand based on a foundation of respect for our residents and the communities in which we operate. Our mission is to reinvent the home rental experience by providing quality homes, great service and rewarding lease programs that offer valuable benefits to our residents while generating attractive returns for our investors.
|
|
Table of Contents Pages ABOUT SWAY 1-6 FINANCIAL INFORMATION Selected Financial & Other Information 7 Consolidated Balance Sheets 8 Consolidated Statements of Operations 9 Funds From Operations & Core Funds From Operations 10 Net Operating Income 11 Estimated Net Asset Value 12 CAPITAL MARKETS 13 PORTFOLIO INFORMATION Total Rental Homes Portfolio 14-15 Leasing Statistics 16 Non-Performing Loan Portfolio 17
TRANSACTION ACTIVITY 18 DEFINITIONS AND RECONCILIATIONS 19-20
|
|
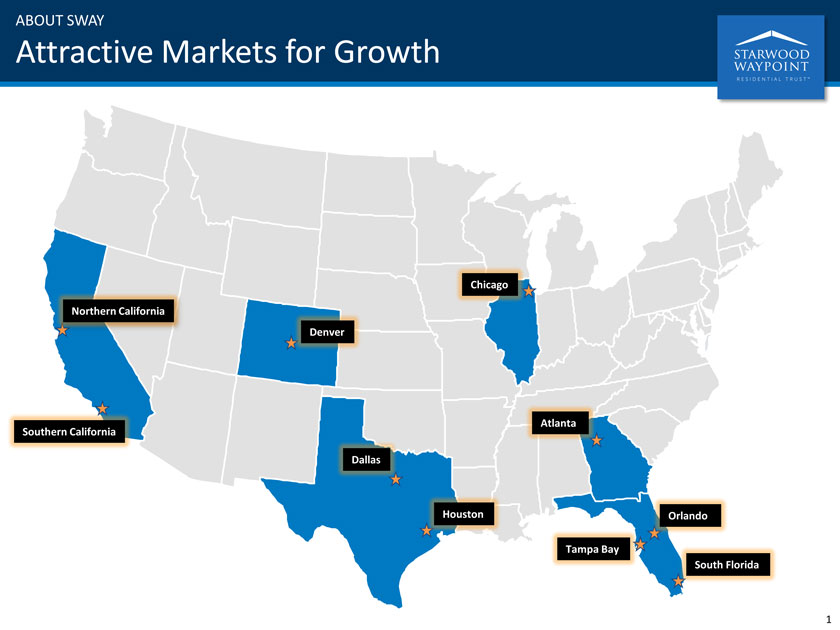
ABOUT SWAY Attractive Markets for Growth Chicago Northern California Denver Southern California Atlanta Dallas Houston Orlando Tampa Bay South florida
|
|
ABOUT SWAY
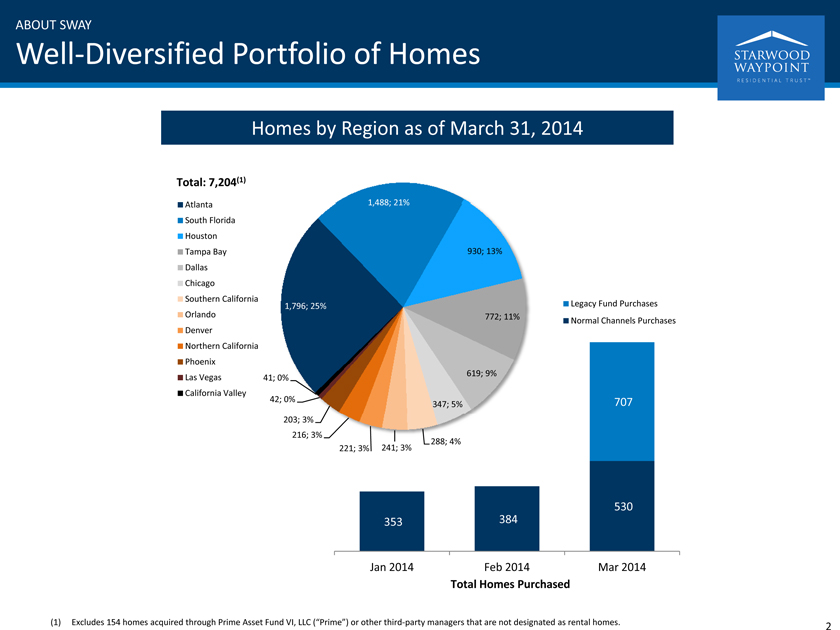
Well-Diversified Portfolio of Homes
Homes by Region as of March 31, 2014
Total: 7,204(1)
Atlanta South Florida Houston Tampa Bay Dallas Chicago Southern California Orlando Denver Northern California Phoenix Las Vegas California Valley
1,488; 21%
930; 13%
1,796; 25%
772; 11%
619; 9% 41; 0%
42; 0%
347; 5% 203; 3% 216; 3% 288; 4% 221; 3% 241; 3%
Legacy Fund Purchases
Normal Channels Purchases
353 384
707
530
Jan 2014 Feb 2014 Mar 2014
Total Homes Purchased
(1) Excludes 154 homes acquired through Prime Asset Fund VI, LLC (“Prime”) or other third-party managers that are not designated as rental homes.
2
|
|
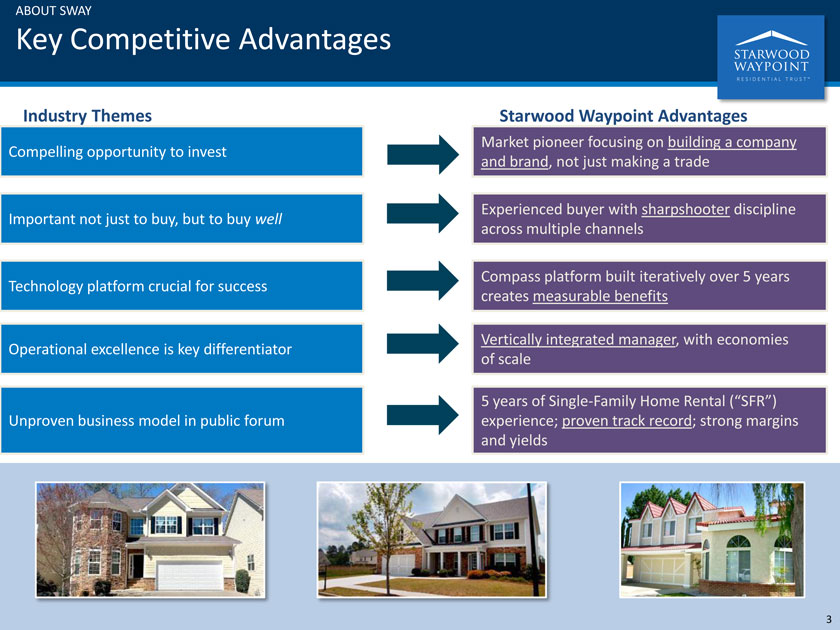
ABOUT SWAY Key Competitive Advantages Industry Themes Compelling opportunity to invest Important not just to buy, but to buy well Technology platform crucial for success Operational excellence is key differentiator Unproven business model in public forum Starwood Waypoint Advantages Market pioneer focusing on building a company and brand, not just making a trade Experienced buyer with sharpshooter discipline across multiple channels Compass platform built iteratively over 5 years creates measurable benefits Vertically integrated manager, with economies of scale 5 years of Single-Family Home Rental (“SFR”) experience; proven track record; strong margins and yields 3
|
|
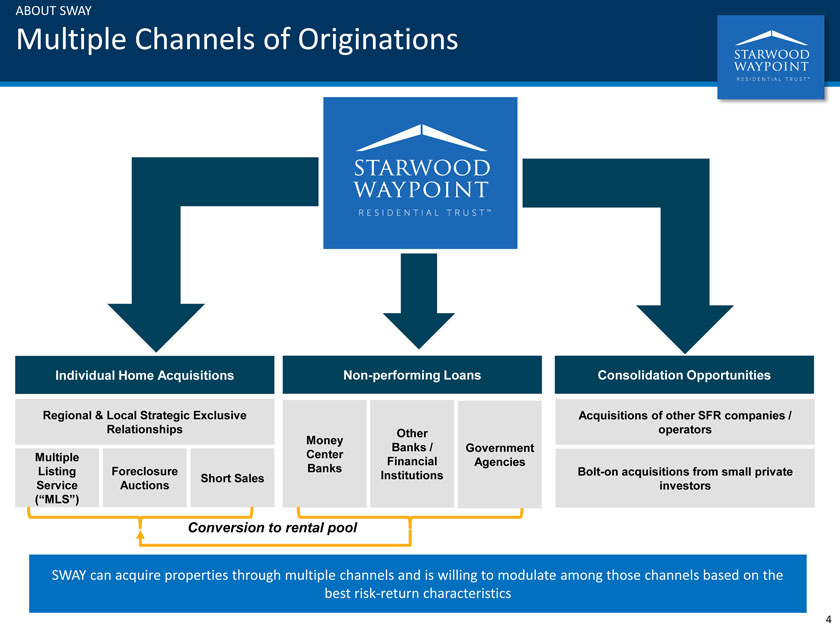
ABOUT SWAY Multiple Channels of Originations Individual Home Acquisitions Non-performing Loans Consolidation Opportunities Regional & Local Strategic Exclusive Acquisitions of other SFR companies / Relationships Other operators Money Banks / Government Multiple Center Financial Agencies Listing Foreclosure Banks Bolt-on acquisitions from small private Service Auctions Short Sales Institutions investors (“MLS”) Conversion to rental pool SWAY can acquire properties through multiple channels and is willing to modulate among those channels based on the best risk-return characteristics 4
|
|
ABOUT SWAY
First Quarter 2014 Highlights
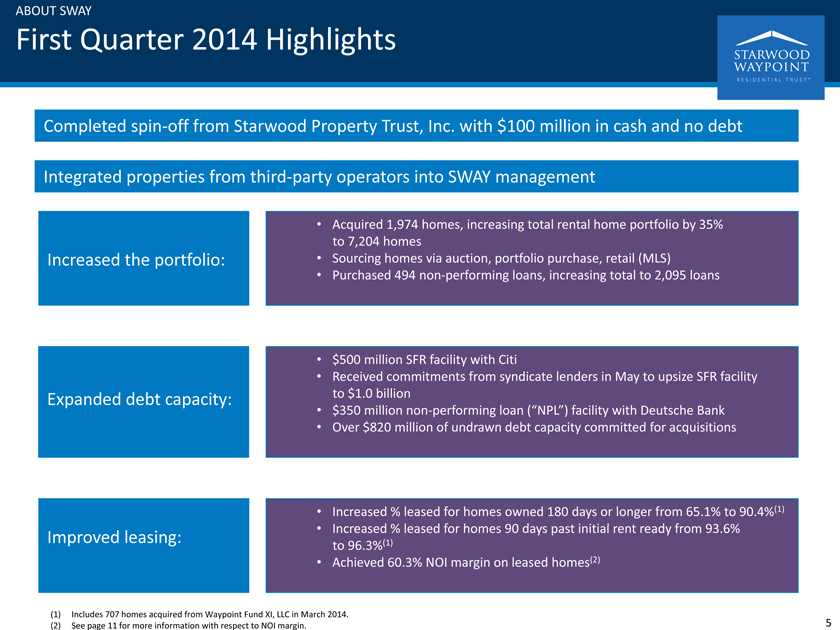
Completed spin-off from Starwood Property Trust, Inc. with $100 million in cash and no debt
Integrated properties from third-party operators into SWAY management
Increased the portfolio:
Acquired 1,974 homes, increasing total rental home portfolio by 35% to 7,204 homes Sourcing homes via auction, portfolio purchase, retail (MLS) Purchased 494 non-performing loans, increasing total to 2,095 loans
Expanded debt capacity:
$500 million SFR facility with Citi
Received commitments from syndicate lenders in May to upsize SFR facility to $1.0 billion $350 million non-performing loan (“NPL”) facility with Deutsche Bank Over $820 million of undrawn debt capacity committed for acquisitions
Improved leasing:
Increased % leased for homes owned 180 days or longer from 65.1% to 90.4%(1) Increased % leased for homes 90 days past initial rent ready from 93.6% to 96.3%(1) Achieved 60.3% NOI margin on leased homes(2)
(1) Includes 707 homes acquired from Waypoint Fund XI, LLC in March 2014. (2) See page 11 for more information with respect to NOI margin.
5
|
|
ABOUT SWAY
Off To A Great Start
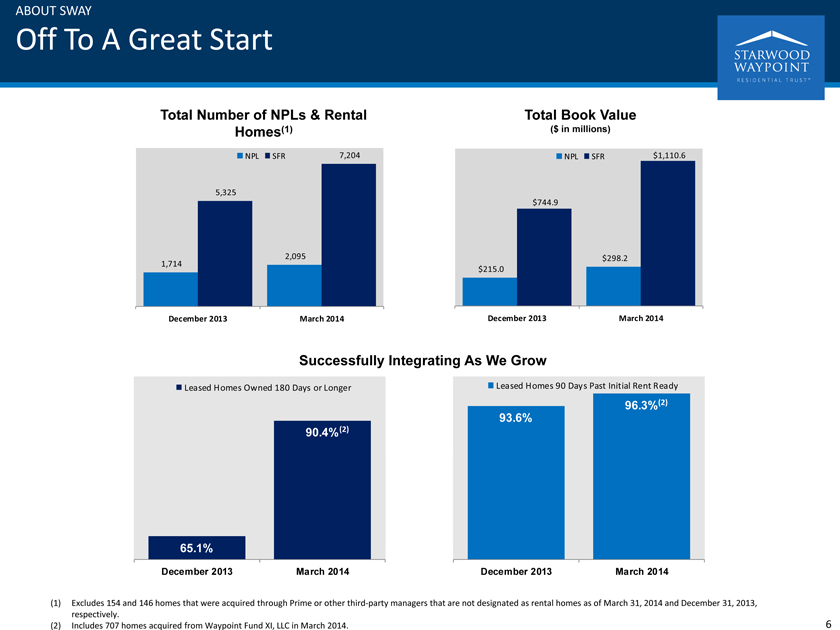
Total Number of NPLs & Rental Homes(1)
NPL SFR 7,204
5,325
2,095 1,714
December 2013 March 2014
Total Book Value
($ in millions)
NPL SFR $1,110.6
$744.9
$298.2 $215.0
December 2013 March 2014
Successfully Integrating As We Grow
Leased Homes Owned 180 Days or Longer
90.4%(2)
65.1%
December 2013 March 2014
Leased Homes 90 Days Past Initial Rent Ready
96.3%(2)
93.6%
December 2013 March 2014
(1) Excludes 154 and 146 homes that were acquired through Prime or other third-party managers that are not designated as rental homes as of March 31, 2014 and December 31, 2013, respectively.
(2) Includes 707 homes acquired from Waypoint Fund XI, LLC in March 2014.
6
|
|
FINANCIAL INFORMATION
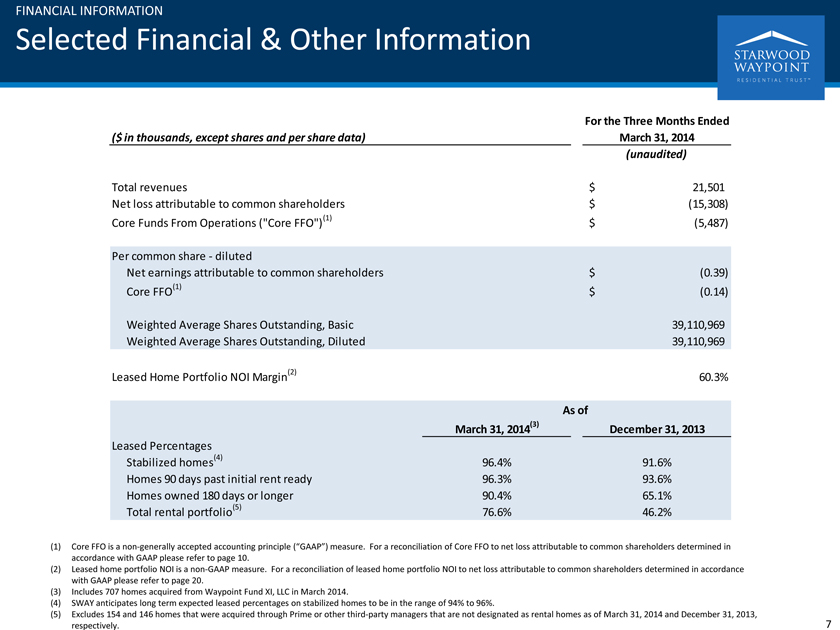
Selected Financial & Other Information
For the Three Months Ended
($ in thousands, except shares and per share data) March 31, 2014
(unaudited)
Total revenues $ 21,501
Net loss attributable to common shareholders $ (15,308)
Core Funds From Operations (“Core FFO”)(1) $ (5,487)
Per common share - diluted
Net earnings attributable to common shareholders $ (0.39)
Core FFO(1) $ (0.14)
Weighted Average Shares Outstanding, Basic 39,110,969
Weighted Average Shares Outstanding, Diluted 39,110,969
Leased Home Portfolio NOI Margin(2) 60.3%
As of
March 31, 2014(3) December 31, 2013
Leased Percentages
Stabilized homes(4) 96.4% 91.6%
Homes 90 days past initial rent ready 96.3% 93.6%
Homes owned 180 days or longer 90.4% 65.1%
Total rental portfolio(5) 76.6% 46.2%
(1) Core FFO is a non-generally accepted accounting principle (“GAAP”) measure. For a reconciliation of Core FFO to net loss attributable to common shareholders determined in accordance with GAAP please refer to page 10.
(2) Leased home portfolio NOI is a non-GAAP measure. For a reconciliation of leased home portfolio NOI to net loss attributable to common shareholders determined in accordance with GAAP please refer to page 20.
(3) Includes 707 homes acquired from Waypoint Fund XI, LLC in March 2014.
(4) SWAY anticipates long term expected leased percentages on stabilized homes to be in the range of 94% to 96%.
(5) Excludes 154 and 146 homes that were acquired through Prime or other third-party managers that are not designated as rental homes as of March 31, 2014 and December 31, 2013, respectively.
7
|
|
FINANCIAL INFORMATION
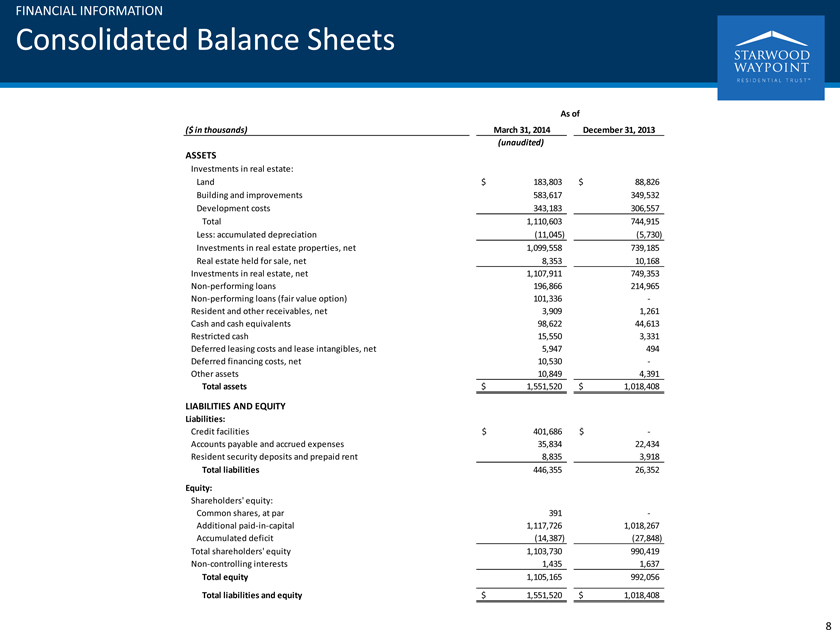
Consolidated Balance Sheets
As of
($ in thousands) March 31, 2014 December 31, 2013
(unaudited)
ASSETS
Investments in real estate:
Land $ 183,803 $ 88,826
Building and improvements 583,617 349,532
Development costs 343,183 306,557
Total 1,110,603 744,915
Less: accumulated depreciation (11,045) (5,730)
Investments in real estate properties, net 1,099,558 739,185
Real estate held for sale, net 8,353 10,168
Investment in real estate, net 1,107,911 749,353
Non-performing loans 196,866 214,965
Non-performing loans (fair value option) 101,336 -
Resident and other receivables, net 3,909 1,261
Cash and cash equivalents 98,622 44,613
Restricted cash 15,550 3,331
Deferred leasing costs and lease intangibles, net 5,947 494
Deferred financing costs, net 10,530 -
Other assets 10,849 4,391
Total assets $ 1,551,520 $ 1,018,408
LIABILITIES AND EQUITY
Liabilities:
Credit facilities $ 401,686 $ -
Accounts payable and accrued expenses 35,834 22,434
Resident security deposits and prepaid rent 8,835 3,918
Total liabilities 446,355 26,352
Equity:
Shareholders’ equity:
Common shares, at par 391 -
Additional paid-in-capital 1,117,726 1,018,267
Accumulated deficit (14,387) (27,848)
Total shareholders’ equity 1,103,730 990,419
Non-controlling interests 1,435 1,637
Total equity 1,105,165 992,056
Total liabilities and equity $ 1,551,520 $ 1,018,408
8
|
|
FINANCIAL INFORMATION
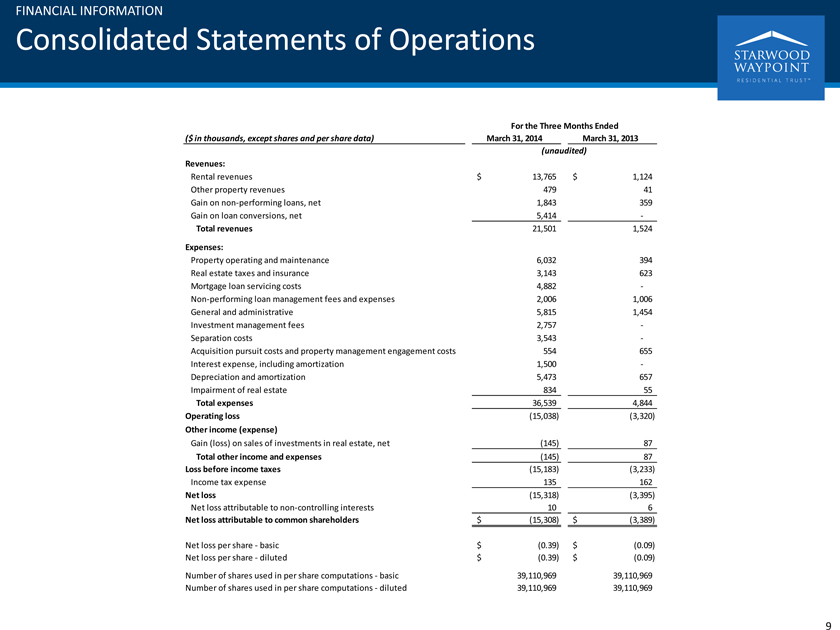
Consolidated Statements of Operations
For the Three Months Ended
($ in thousands, except shares and per share data) March 31, 2014 March 31, 2013
(unaudited)
Revenues:
Rental revenues $ 13,765 $ 1,124
Other property revenues 479 41
Gain on non-performing loans, net 1,843 359
Gain on loan conversions, net 5,414 -
Total revenues 21,501 1,524
Expenses:
Property operating and maintenance 6,032 394
Real estate taxes and insurance 3,143 623
Mortgage loan servicing costs 4,882 -
Non-performing loan management fees and expenses 2,006 1,006
General and administrative 5,815 1,454
Investment management fees 2,757 -
Separation costs 3,543 -
Acquisition pursuit costs and property management engagement costs 554 655
Interest expense, including amortization 1,500 -
Depreciation and amortization 5,473 657
Impairment of real estate 834 55
Total expenses 36,539 4,844
Operating loss (15,038) (3,320)
Other income (expense)
Gain (loss) on sales of investments in real estate, net (145) 87
Total other income and expenses (145) 87
Loss before income taxes (15,183) (3,233)
Income tax expense 135 162
Net loss (15,318) (3,395)
Net loss attributable to non-controlling interests 10 6
Net loss attributable to common shareholders $ (15,308) $ (3,389)
Net loss per share - basic $ (0.39) $ (0.09)
Net loss per share - diluted $ (0.39) $ (0.09)
Number of shares used in per share computations - basic 39,110,969 39,110,969
Number of shares used in per share computations - diluted 39,110,969 39,110,969
9
|
|
FINANCIAL INFORMATION
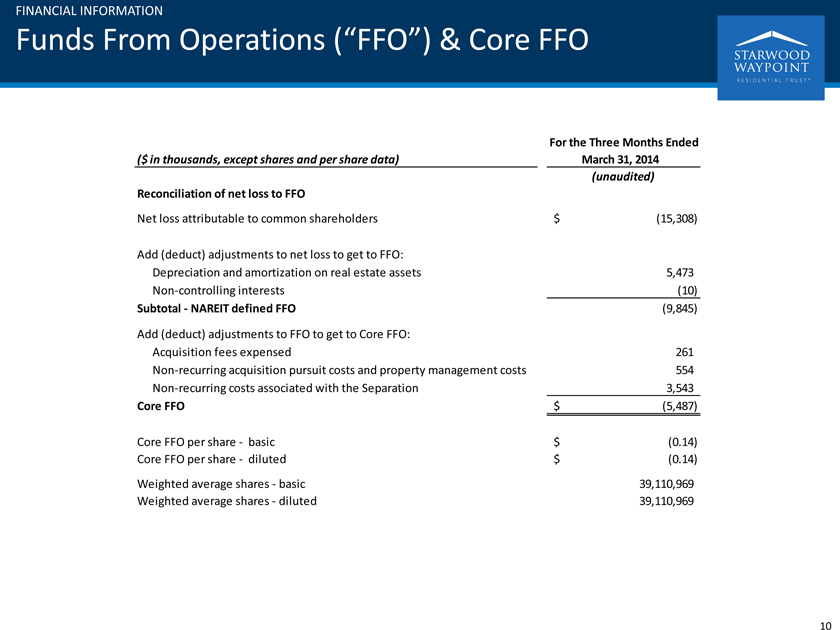
Funds From Operations (“FFO”) & Core FFO
For the Three Months Ended
($ in thousands, except shares and per share data) March 31, 2014
(unaudited)
Reconciliation of net loss to FFO
Net loss attributable to common shareholders $ (15,308)
Add (deduct) adjustments to net loss to get to FFO:
Depreciation and amortization on real estate assets 5,473
Non-controlling interests (10)
Subtotal - NAREIT defined FFO (9,845)
Add (deduct) adjustments to FFO to get to Core FFO:
Acquisition fees expensed 261
Non-recurring acquisition pursuit costs and property management costs 554
Non-recurring costs associated with the Separation 3,543
Core FFO $ (5,487)
Core FFO per share - basic $ (0.14)
Core FFO per share - diluted $ (0.14)
Weighted average shares - basic 39,110,969
Weighted average shares - diluted 39,110,969
10
|
|
FINANCIAL INFORMATION
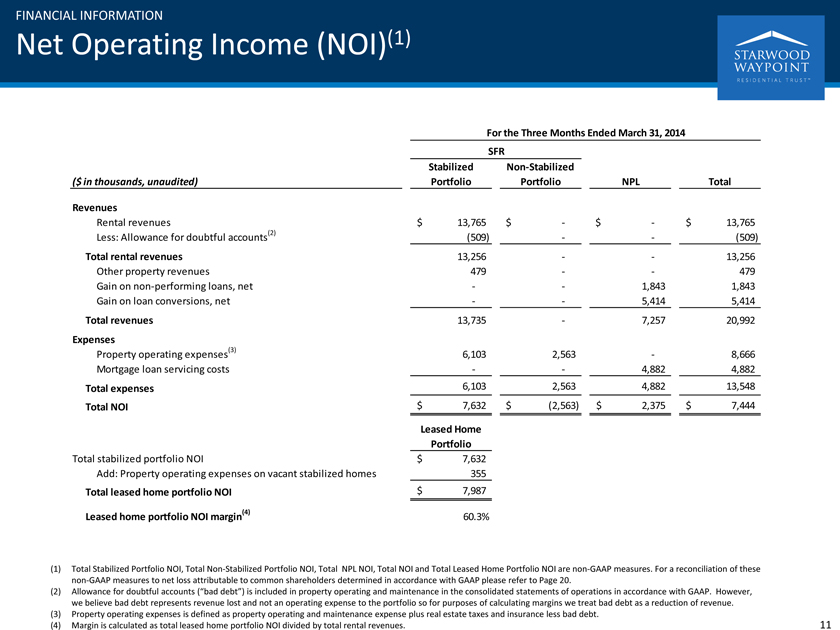
Net Operating Income (NOI)(1)
For the Three Months Ended March 31, 2014
SFR
Stabilized Non-Stabilized
($ in thousands, unaudited) Portfolio Portfolio NPL Total
Revenues
Rental revenues $ 13,765 $ - $ - $ 13,765
Less: Allowance for doubtful accounts(2) (509) - - (509)
Total rental revenues 13,256 - - 13,256
Other property revenues 479 - - 479
Gain on non-performing loans, net - - 1,843 1,843
Gain on loan conversions, net - - 5,414 5,414
Total revenues 13,735 - 7,257 20,992
Expenses
Property operating expenses(3) 6,103 2,563 - 8,666
Mortgage loan servicing costs - - 4,882 4,882
Total expenses 6,103 2,563 4,882 13,548
Total NOI $ 7,632 $ (2,563) $ 2,375 $ 7,444
Leased Home
Portfolio
Total stabilized portfolio NOI $ 7,632
Add: Property operating expenses on vacant stabilized homes 355
Total leased home portfolio NOI $ 7,987
Leased home portfolio NOI margin(4) 60.3%
(1) Total Stabilized Portfolio NOI, Total Non-Stabilized Portfolio NOI, Total NPL NOI, Total NOI and Total Leased Home Portfolio NOI are non-GAAP measures. For a reconciliation of these non-GAAP measures to net loss attributable to common shareholders determined in accordance with GAAP please refer to Page 20.
(2) Allowance for doubtful accounts (“bad debt”) is included in property operating and maintenance in the consolidated statements of operations in accordance with GAAP. However, we believe bad debt represents revenue lost and not an operating expense to the portfolio so for purposes of calculating margins we treat bad debt as a reduction of revenue. (3) Property operating expenses is defined as property operating and maintenance expense plus real estate taxes and insurance less bad debt.
(4) Margin is calculated as total leased home portfolio NOI divided by total rental revenues.
11
|
|
FINANCIAL INFORMATION
Estimated Net Asset Value (“NAV”)(1)
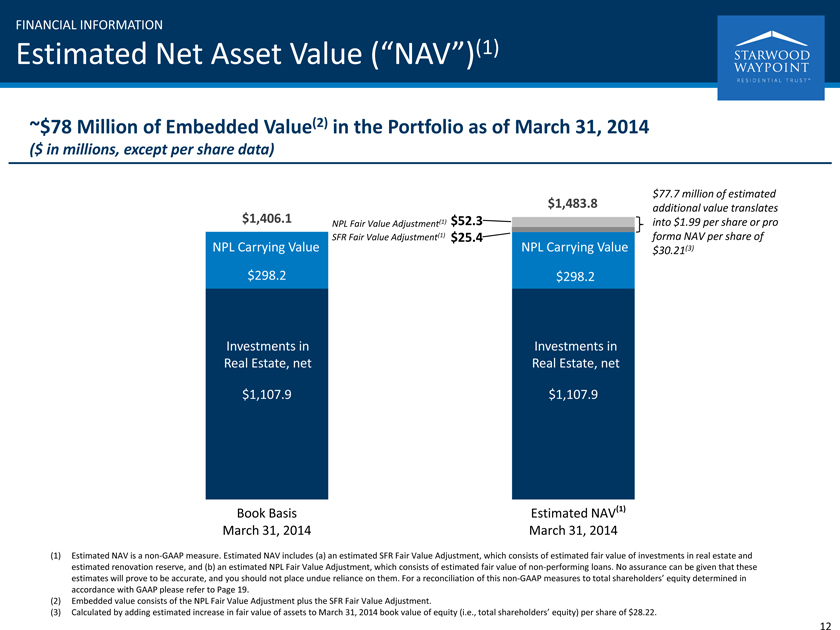
~$78 Million of Embedded Value(2) in the Portfolio as of March 31, 2014
($ in millions, except per share data)
$1,483.8 $77.7 million of estimated $1,406.1 additional value translates NPL Fair Value Adjustment(1) $52.3 into $1.99 per share or pro
SFR Fair Value Adjustment(1) $25.4 forma NAV per share of
NPL Carrying Value NPL Carrying Value $30.21(3) $298.2 $298.2
Investments in Investments in Real Estate, net Real Estate, net
$1,107.9 $1,107.9
Book Basis Estimated NAV(1) March 31, 2014 March 31, 2014
(1) Estimated NAV is a non-GAAP measure. Estimated NAV includes (a) an estimated SFR Fair Value Adjustment, which consists of estimated fair value of investments in real estate and estimated renovation reserve, and (b) an estimated NPL Fair Value Adjustment, which consists of estimated fair value of non-performing loans. No assurance can be given that these estimates will prove to be accurate, and you should not place undue reliance on them. For a reconciliation of this non-GAAP measures to total shareholders’ equity determined in accordance with GAAP please refer to Page 19.
(2) Embedded value consists of the NPL Fair Value Adjustment plus the SFR Fair Value Adjustment.
(3) Calculated by adding estimated increase in fair value of assets to March 31, 2014 book value of equity (i.e., total shareholders’ equity) per share of $28.22.
12
|
|
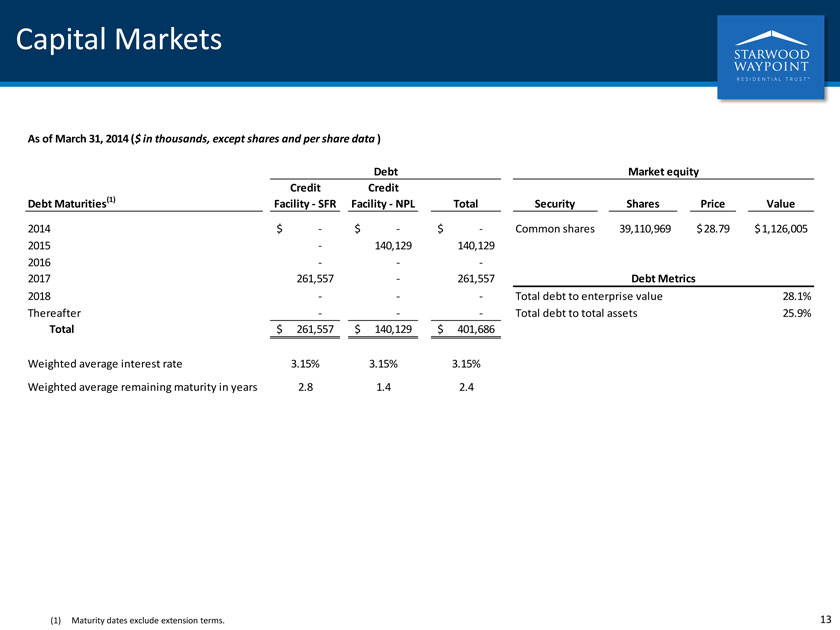
Capital Markets As of March 31, 2014 ($ in thousands, except shares and per share data ) Debt Market equity Credit Credit Debt Maturities(1) Facility—SFR Facility—NPL Total Security Shares Price Value 2014 $ —$ —$ —Common shares 39,110,969 $ 28.79 $ 1,126,005 2015 — 140,129 140,129 2016 — — -2017 261,557 — 261,557 Debt Metrics 2018 — — —Total debt to enterprise value 28.1% Thereafter — — —Total debt to total assets 25.9% Total $ 261,557 $ 140,129 $ 401,686 Weighted average interest rate 3.15% 3.15% 3.15% Weighted average remaining maturity in years 2.8 1.4 2.4 (1) Maturity dates exclude extension terms. 13
|
|
PORTFOLIO INFORMATION
Total Rental Homes Portfolio - March 31, 2014
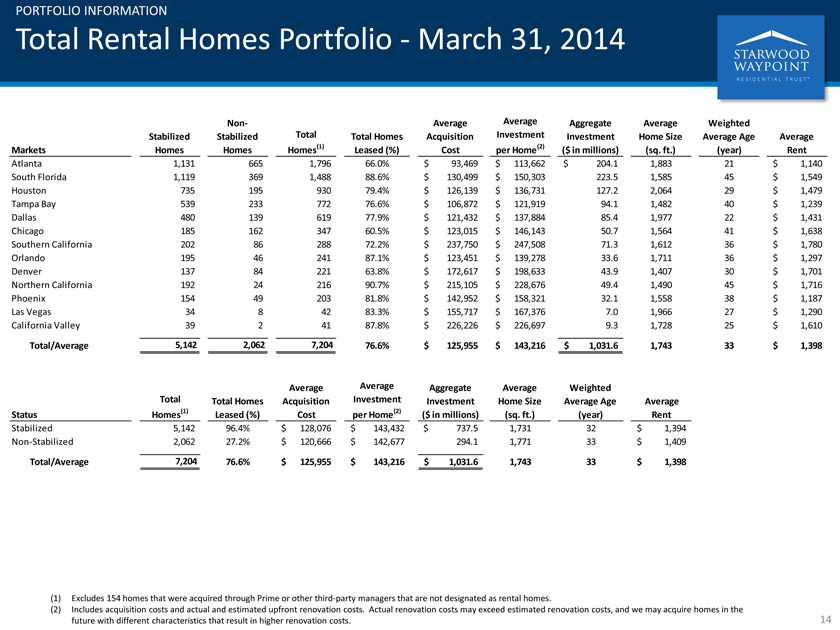
Non- Average Average Aggregate Average Weighted
Stabilized Stabilized Total Total Homes Acquisition Investment Investment Home Size Average Age Average
Markets Homes Homes Homes(1) Leased (%) Cost per Home(2) ($ in millions) (sq. ft.) (year) Rent
Atlanta 1,131 665 1,796 66.0% $ 93,469 $ 113,662 $ 204.1 1,883 21 $ 1,140
South Florida 1,119 369 1,488 88.6% $ 130,499 $ 150,303 223.5 1,585 45 $ 1,549
Houston 735 195 930 79.4% $ 126,139 $ 136,731 127.2 2,064 29 $ 1,479
Tampa Bay 539 233 772 76.6% $ 106,872 $ 121,919 94.1 1,482 40 $ 1,239
Dallas 480 139 619 77.9% $ 121,432 $ 137,884 85.4 1,977 22 $ 1,431
Chicago 185 162 347 60.5% $ 123,015 $ 146,143 50.7 1,564 41 $ 1,638
Southern California 202 86 288 72.2% $ 237,750 $ 247,508 71.3 1,612 36 $ 1,780
Orlando 195 46 241 87.1% $ 123,451 $ 139,278 33.6 1,711 36 $ 1,297
Denver 137 84 221 63.8% $ 172,617 $ 198,633 43.9 1,407 30 $ 1,701
Northern California 192 24 216 90.7% $ 215,105 $ 228,676 49.4 1,490 45 $ 1,716
Phoenix 154 49 203 81.8% $ 142,952 $ 158,321 32.1 1,558 38 $ 1,187
Las Vegas 34 8 42 83.3% $ 155,717 $ 167,376 7.0 1,966 27 $ 1,290
California Valley 39 2 41 87.8% $ 226,226 $ 226,697 9.3 1,728 25 $ 1,610
Total/Average 5,142 2,062 7,204 76.6% $ 125,9vb55 $ 143,216 $ 1,031.6 1,743 33 $ 1,398
Average Average Aggregate Average Weighted
Total Total Homes Acquisition Investment Investment Home Size Average Age Average
Status Homes(1) Leased (%) Cost per Home(2) ($ in millions) (sq. ft.) (year) Rent
Stabilized 5,142 96.4% $ 128,076 $ 143,432 $ 737.5 1,731 32 $ 1,394
Non-Stabilized 2,062 27.2% $ 120,666 $ 142,677 294.1 1,771 33 $ 1,409
Total/Average 7,204 76.6% $ 125,955 $ 143,216 $ 1,031.6 1,743 33 $ 1,398
Excludes 154 homes that were acquired through Prime or other third-party managers that are not designated as rental homes. Includes acquisition costs and actual and estimated upfront renovation costs. Actual renovation costs may exceed estimated renovation costs, and we may acquire homes in the future with different characteristics that result in higher renovation costs.
|
|
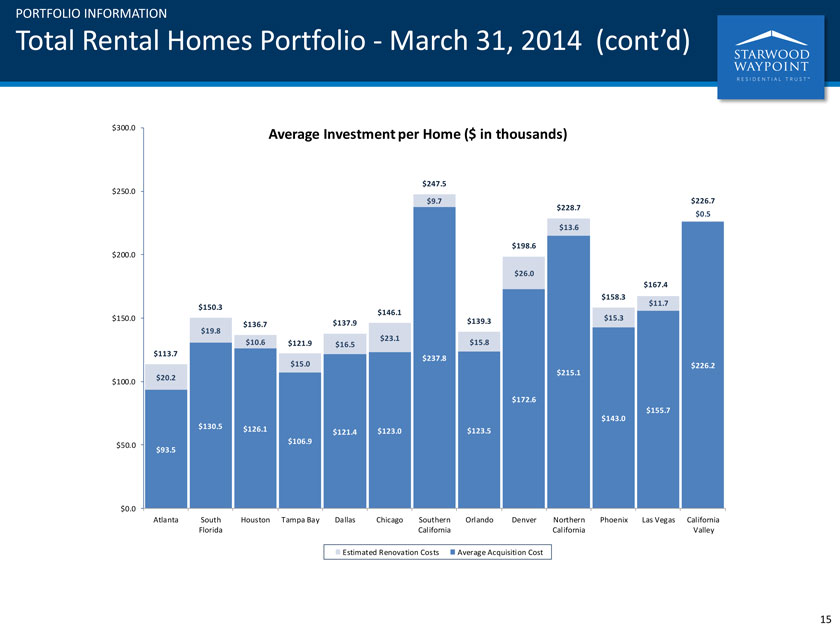
PORTFOLIO INFORMATION Total Rental Homes Portfolio—March 31, 2014 (cont’d) $300.0 Average Investment per Home ($ in thousands) $247.5 $250.0 $9.7 $226.7 $228.7 $0.5 $13.6 $198.6 $200.0 $26.0 $167.4 $158.3 $11.7 $150.3 $146.1 $150.0 $15.3 $137.9 $139.3 $19.8 $136.7 $23.1 $10.6 $121.9 $16.5 $15.8 $113.7 $15.0 $237.8 $226.2 $215.1 $20.2 $100.0 $172.6 $155.7 $143.0 $130.5 $126.1 $121.4 $123.0 $123.5 $106.9 $50.0 $93.5 $0.0 Atlanta South Houston Tampa Bay Dallas Chicago Southern Orlando Denver Northern Phoenix Las Vegas California Florida California California Valley Estimated Renovation Costs Average Acquisition Cost 15
|
|
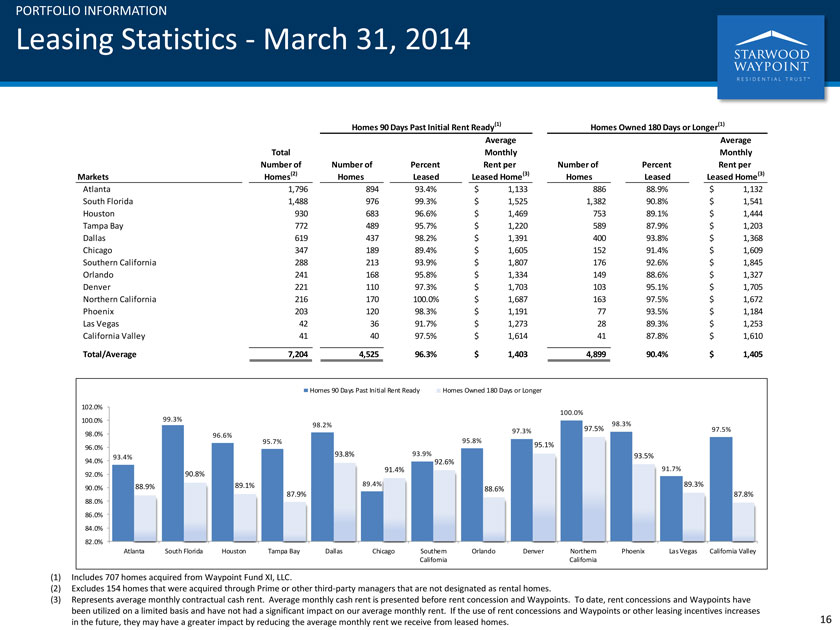
PORTFOLIO INFORMATION Leasing Statistics—March 31, 2014 Homes 90 Days Past Initial Rent Ready(1) Homes Owned 180 Days or Longer(1) Average Average Total Monthly Monthly Number of Number of Percent Rent per Number of Percent Rent per Markets Homes(2) Homes Leased Leased Home(3) Homes Leased Leased Home(3) Atlanta 1,796 894 93.4% $ 1,133 886 88.9% $ 1,132 South Florida 1,488 976 99.3% $ 1,525 1,382 90.8% $ 1,541 Houston 930 683 96.6% $ 1,469 753 89.1% $ 1,444 Tampa Bay 772 489 95.7% $ 1,220 589 87.9% $ 1,203 Dallas 619 437 98.2% $ 1,391 400 93.8% $ 1,368 Chicago 347 189 89.4% $ 1,605 152 91.4% $ 1,609 Southern California 288 213 93.9% $ 1,807 176 92.6% $ 1,845 Orlando 241 168 95.8% $ 1,334 149 88.6% $ 1,327 Denver 221 110 97.3% $ 1,703 103 95.1% $ 1,705 Northern California 216 170 100.0% $ 1,687 163 97.5% $ 1,672 Phoenix 203 120 98.3% $ 1,191 77 93.5% $ 1,184 Las Vegas 42 36 91.7% $ 1,273 28 89.3% $ 1,253 California Valley 41 40 97.5% $ 1,614 41 87.8% $ 1,610 Total/Average 7,204 4,525 96.3% $ 1,403 4,899 90.4% $ 1,405 Homes 90 Days Past Initial Rent Ready Homes Owned 180 Days or Longer 102.0% 100.0% 100.0% 99.3% 98.2% 98.3% 98.0% 97.3% 97.5% 97.5% 96.6% 95.8% 95.7% 96.0% 95.1% 93.8% 93.9% 93.5% 93.4% 94.0% 92.6% 91.4% 91.7% 92.0% 90.8% 88.9% 89.1% 89.4% 89.3% 90.0% 87.9% 88.6% 87.8% 88.0% 86.0% 84.0% 82.0% Atlanta South Florida Houston Tampa Bay Dallas Chicago Southern Orlando Denver Northern Phoenix Las Vegas California Valley California California (1) Includes 707 homes acquired from Waypoint Fund XI, LLC. (2) Excludes 154 homes that were acquired through Prime or other third-party managers that are not designated as rental homes. (3) Represents average monthly contractual cash rent. Average monthly cash rent is presented before rent concession and Waypoints. To date, rent concessions and Waypoints have been utilized on a limited basis and have not had a significant impact on our average monthly rent. If the use of rent concessions and Waypoints or other leasing incentives increases in the future, they may have a greater impact by reducing the average monthly rent we receive from leased homes.
|
|
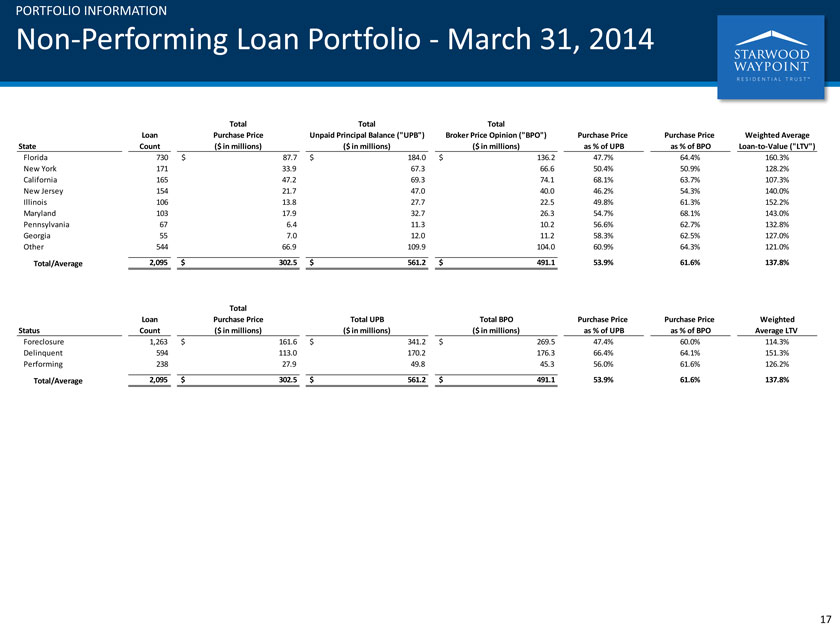
PORTFOLIO INFORMATION Non-Performing Loan Portfolio—March 31, 2014 Total Total Total Loan Purchase Price Unpaid Principal Balance (“UPB”) Broker Price Opinion (“BPO”) Purchase Price Purchase Price Weighted Average State Count ($ in millions) ($ in millions) ($ in millions) as % of UPB as % of BPO Loan-to-Value (“LTV”) Florida 730 $ 87.7 $ 184.0 $ 136.2 47.7% 64.4% 160.3% New York 171 33.9 67.3 66.6 50.4% 50.9% 128.2% California 165 47.2 69.3 74.1 68.1% 63.7% 107.3% New Jersey 154 21.7 47.0 40.0 46.2% 54.3% 140.0% Illinois 106 13.8 27.7 22.5 49.8% 61.3% 152.2% Maryland 103 17.9 32.7 26.3 54.7% 68.1% 143.0% Pennsylvania 67 6.4 11.3 10.2 56.6% 62.7% 132.8% Georgia 55 7.0 12.0 11.2 58.3% 62.5% 127.0% Other 544 66.9 109.9 104.0 60.9% 64.3% 121.0% Total/Average 2,095 $ 302.5 $ 561.2 $ 491.1 53.9% 61.6% 137.8% Total Loan Purchase Price Total UPB Total BPO Purchase Price Purchase Price Weighted Status Count ($ in millions) ($ in millions) ($ in millions) as % of UPB as % of BPO Average LTV Foreclosure 1,263 $ 161.6 $ 341.2 $ 269.5 47.4% 60.0% 114.3% Delinquent 594 113.0 170.2 176.3 66.4% 64.1% 151.3% Performing 238 27.9 49.8 45.3 56.0% 61.6% 126.2% Total/Average 2,095 $ 302.5 $ 561.2 $ 491.1 53.9% 61.6% 137.8% 17
|
|
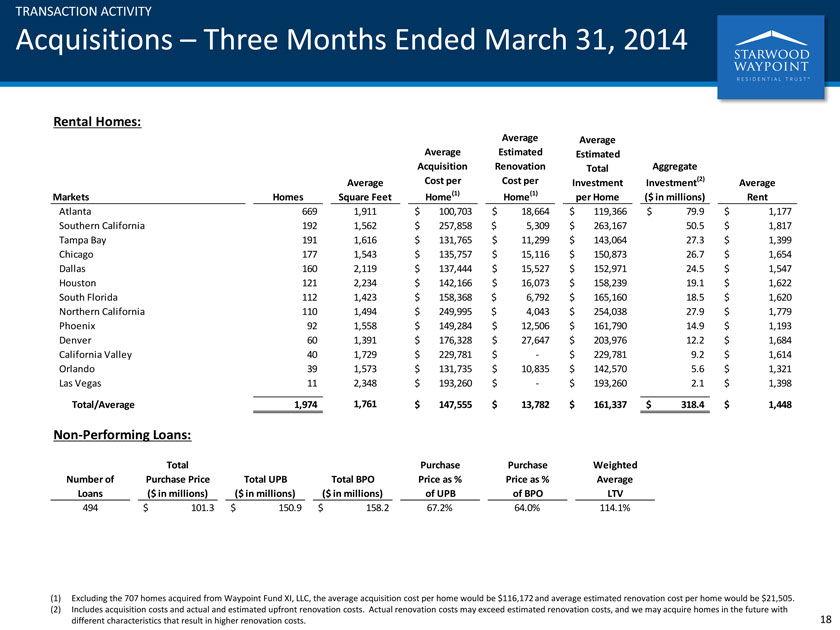
TRANSACTION ACTIVITY Acquisitions – Three Months Ended March 31, 2014 Rental Homes: Average Average Average Estimated Estimated Acquisition Renovation Total Aggregate Average Cost per Cost per Investment Investment(2) Average Markets Homes Square Feet Home(1) Home(1) per Home ($ in millions) Rent Atlanta 669 1,911 $ 100,703 $ 18,664 $ 119,366 $ 79.9 $ 1,177 Southern California 192 1,562 $ 257,858 $ 5,309 $ 263,167 50.5 $ 1,817 Tampa Bay 191 1,616 $ 131,765 $ 11,299 $ 143,064 27.3 $ 1,399 Chicago 177 1,543 $ 135,757 $ 15,116 $ 150,873 26.7 $ 1,654 Dallas 160 2,119 $ 137,444 $ 15,527 $ 152,971 24.5 $ 1,547 Houston 121 2,234 $ 142,166 $ 16,073 $ 158,239 19.1 $ 1,622 South Florida 112 1,423 $ 158,368 $ 6,792 $ 165,160 18.5 $ 1,620 Northern California 110 1,494 $ 249,995 $ 4,043 $ 254,038 27.9 $ 1,779 Phoenix 92 1,558 $ 149,284 $ 12,506 $ 161,790 14.9 $ 1,193 Denver 60 1,391 $ 176,328 $ 27,647 $ 203,976 12.2 $ 1,684 California Valley 40 1,729 $ 229,781 $ —$ 229,781 9.2 $ 1,614 Orlando 39 1,573 $ 131,735 $ 10,835 $ 142,570 5.6 $ 1,321 Las Vegas 11 2,348 $ 193,260 $ —$ 193,260 2.1 $ 1,398 Total/Average 1,974 1,761 $ 147,555 $ 13,782 $ 161,337 $ 318.4 $ 1,448 Non-Performing Loans: Total Purchase Purchase Weighted Number of Purchase Price Total UPB Total BPO Price as % Price as % Average Loans ($ in millions) ($ in millions) ($ in millions) of UPB of BPO LTV 494 $ 101.3 $ 150.9 $ 158.2 67.2% 64.0% 114.1% (1) Excluding the 707 homes acquired from Waypoint Fund XI, LLC, the average acquisition cost per home would be $116,172 and average estimated renovation cost per home would be $21,505. (2) Includes acquisition costs and actual and estimated upfront renovation costs. Actual renovation costs may exceed estimated renovation costs, and we may acquire homes in the future with different characteristics that result in higher renovation costs. 18
|
|
Definitions and Reconciliations
Enterprise Value. We define Enterprise Value as market equity plus debt plus non-controlling interests less cash and cash equivalents.
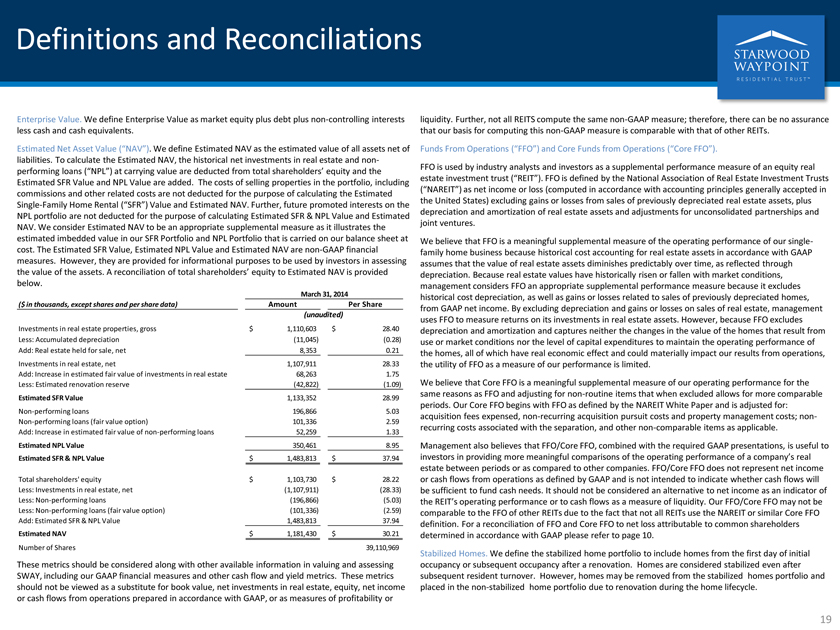
Estimated Net Asset Value (“NAV”). We define Estimated NAV as the estimated value of all assets net of liabilities. To calculate the Estimated NAV, the historical net investments in real estate and non-performing loans (“NPL”) at carrying value are deducted from total shareholders’ equity and the
Estimated SFR Value and NPL Value are added. The costs of selling properties in the portfolio, including commissions and other related costs are not deducted for the purpose of calculating the Estimated Single-Family Home Rental (“SFR”) Value and Estimated NAV. Further, future promoted interests on the NPL portfolio are not deducted for the purpose of calculating Estimated SFR & NPL Value and Estimated NAV. We consider Estimated NAV to be an appropriate supplemental measure as it illustrates the estimated imbedded value in our SFR Portfolio and NPL Portfolio that is carried on our balance sheet at cost. The Estimated SFR Value, Estimated NPL Value and Estimated NAV are non GAAP financial measures. However, they are provided for informational purposes to be used by investors in assessing the value of the assets. A reconciliation of total shareholders’ equity to Estimated NAV is provided below.
March 31, 2014
($ in thousands, except shares and per share data) Amount Per Share
(unaudited)
Investments in real estate properties, gross $ 1,110,603 $ 28.40 Less: Accumulated depreciation (11,045) (0.28) Add: Real estate held for sale, net 8,353 0.21
Investments in real estate, net 1,107,911 28.33 Add: Increase in estimated fair value of investments in real estate 68,263 1.75 Less: Estimated renovation reserve (42,822) (1.09)
Estimated SFR Value 1,133,352 28.99
Non-performing loans 196,866 5.03 Non-performing loans (fair value option) 101,336 2.59 Add: Increase in estimated fair value of non-performing loans 52,259 1.33
Estimated NPL Value 350,461 8.95 Estimated SFR & NPL Value $ 1,483,813 $ 37.94
Total shareholders’ equity $ 1,103,730 $ 28.22 Less: Investments in real estate, net (1,107,911) (28.33) Less: Non-performing loans (196,866) (5.03) Less: Non-performing loans (fair value option) (101,336) (2.59) Add: Estimated SFR & NPL Value 1,483,813 37.94 Estimated NAV $ 1,181,430 $ 30.21
Number of Shares 39,110,969
These metrics should be considered along with other available information in valuing and assessing SWAY, including our GAAP financial measures and other cash flow and yield metrics. These metrics should not be viewed as a substitute for book value, net investments in real estate, equity, net income or cash flows from operations prepared in accordance with GAAP, or as measures of profitability or liquidity. Further, not all REITS compute the same non-GAAP measure; therefore, there can be no assurance that our basis for computing this non-GAAP measure is comparable with that of other REITs.
Funds From Operations (FFO”) and Core Funds from Operations (Core FFO”).
FFO is used by industry analysts and investors as a supplemental performance measure of an equity real estate investment trust (REIT”). FFO is defined by the National Association of Real Estate Investment Trusts (NAREIT”) as net income or loss (computed in accordance with accounting principles generally accepted in the United States) excluding gains or losses from sales of previously depreciated real estate assets, plus depreciation and amortization of real estate assets and adjustments for unconsolidated partnerships and joint ventures.
We believe that FFO is a meaningful supplemental measure of the operating performance of our single-family home business because historical cost accounting for real estate assets in accordance with GAAP assumes that the value of real estate assets diminishes predictably over time, as reflected through depreciation. Because real estate values have historically risen or fallen with market conditions, management considers FFO an appropriate supplemental performance measure because it excludes historical cost depreciation, as well as gains or losses related to sales of previously depreciated homes, from GAAP net income. By excluding depreciation and gains or losses on sales of real estate, management uses FFO to measure returns on its investments in real estate assets. However, because FFO excludes depreciation and amortization and captures neither the changes in the value of the homes that result from use or market conditions nor the level of capital expenditures to maintain the operating performance of the homes, all of which have real economic effect and could materially impact our results from operations, the utility of FFO as a measure of our performance is limited.
We believe that Core FFO is a meaningful supplemental measure of our operating performance for the same reasons as FFO and adjusting for non-routine items that when excluded allows for more comparable periods. Our Core FFO begins with FFO as defined by the NAREIT White Paper and is adjusted for: acquisition fees expensed, non-recurring acquisition pursuit costs and property management costs; non-recurring costs associated with the separation, and other non-comparable items as applicable.
Management also believes that FFO/Core FFO, combined with the required GAAP presentations, is useful to investors in providing more meaningful comparisons of the operating performance of a company’s real estate between periods or as compared to other companies. FFO/Core FFO does not represent net income or cash flows from operations as defined by GAAP and is not intended to indicate whether cash flows will be sufficient to fund cash needs. It should not be considered an alternative to net income as an indicator of the REIT’s operating performance or to cash flows as a measure of liquidity. Our FFO/Core FFO may not be comparable to the FFO of other REITs due to the fact that not all REITs use the NAREIT or similar Core FFO definition. For a reconciliation of FFO and Core FFO to net loss attributable to common shareholders determined in accordance with GAAP please refer to page 10.
Stabilized Homes. We define the stabilized home portfolio to include homes from the first day of initial occupancy or subsequent occupancy after a renovation. Homes are considered stabilized even after subsequent resident turnover. However, homes may be removed from the stabilized homes portfolio and placed in the non-stabilized home portfolio due to renovation during the home lifecycle.
|
|
Definitions and Reconciliations (cont’d)
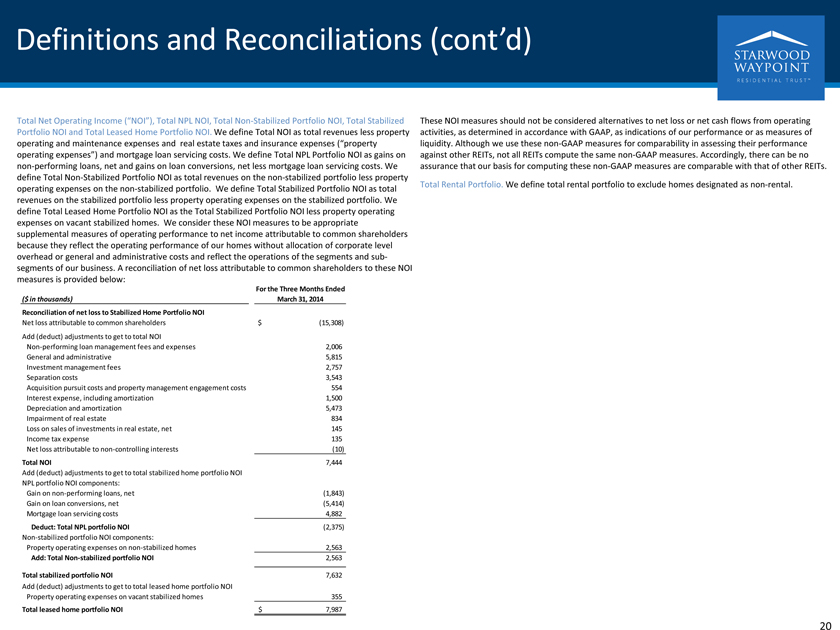
Total Net Operating Income (“NOI”), Total NPL NOI, Total Non-Stabilized Portfolio NOI, Total Stabilized Portfolio NOI and Total Leased Home Portfolio NOI. We define Total NOI as total revenues less property operating and maintenance expenses and real estate taxes and insurance expenses (“property operating expenses”) and mortgage loan servicing costs. We define Total NPL Portfolio NOI as gains on non-performing loans, net and gains on loan conversions, net less mortgage loan servicing costs. We define Total Non-Stabilized Portfolio NOI as total revenues on the non-stabilized portfolio less property operating expenses on the non-stabilized portfolio. We define Total Stabilized Portfolio NOI as total revenues on the stabilized portfolio less property operating expenses on the stabilized portfolio. We define Total Leased Home Portfolio NOI as the Total Stabilized Portfolio NOI less property operating expenses on vacant stabilized homes. We consider these NOI measures to be appropriate supplemental measures of operating performance to net income attributable to common shareholders because they reflect the operating performance of our homes without allocation of corporate level overhead or general and administrative costs and reflect the operations of the segments and sub-segments of our business. A reconciliation of net loss attributable to common shareholders to these NOI measures is provided below:
For the Three Months Ended
($ in thousands) March 31, 2014
Reconciliation of net loss to Stabilized Home Portfolio NOI
Net loss attributable to common shareholders $ (15,308)
Add (deduct) adjustments to get to total NOI
Non-performing loan management fees and expenses 2,006
General and administrative 5,815
Investment management fees 2,757
Separation costs 3,543
Acquisition pursuit costs and property management engagement costs 554
Interest expense, including amortization 1,500
Depreciation and amortization 5,473
Impairment of real estate 834
Loss on sales of investments in real estate, net 145
Income tax expense 135
Net loss attributable to non-controlling interests (10)
Total NOI 7,444
Add (deduct) adjustments to get to total stabilized home portfolio NOI
NPL portfolio NOI components:
Gain on non-performing loans, net (1,843)
Gain on loan conversions, net (5,414)
Mortgage loan servicing costs 4,882
Deduct: Total NPL portfolio NOI (2,375)
Non-stabilized portfolio NOI components:
Property operating expenses on non-stabilized homes 2,563
Add: Total Non-stabilized portfolio NOI 2,563
Total stabilized portfolio NOI 7,632
Add (deduct) adjustments to get to total leased home portfolio NOI
Property operating expenses on vacant stabilized homes 355
Total leased home portfolio NOI $ 7,987
These NOI measures should not be considered alternatives to net loss or net cash flows from operating activities, as determined in accordance with GAAP, as indications of our performance or as measures of liquidity. Although we use these non-GAAP measures for comparability in assessing their performance against other REITs, not all REITs compute the same non-GAAP measures. Accordingly, there can be no assurance that our basis for computing these non-GAAP measures are comparable with that of other REITs.
Total Rental Portfolio. We define total rental portfolio to exclude homes designated as non-rental.
20
|
|
Forward Looking Statements The statements herein that are not historical facts are forward-looking statements within the meaning of Section 27A of the Securities Act of 1933, as amended, and Section 21E of the Securities Exchange Act of 1934, as amended. These forward-looking statements are based on current expectations, estimates and projections about the industry and markets in which we operate, management’s beliefs and assumptions made by management. Such statements involve uncertainties that could significantly impact our financial results. Words such as “expects,” “anticipates,” “ intends,” “plans,” “believes,” “seeks,” “estimates,” variations of such words and similar expressions are intended to identify such forward-looking statements, which generally are not historical in nature. All statements that address operating performance, events or developments that we expect or anticipate will occur in the future — including statements relating to rent and occupancy growth, acquisition and disposition activity, renovation activity, general conditions in the geographic areas where we operate, our debt and financial position — are forward-looking statements. These statements are not guarantees of future performance and involve certain risks, uncertainties and assumptions that are difficult to predict. Although we believe the expectations reflected in any forward-looking statements are based on reasonable assumptions, we can give no assurance that our expectations will be attained and therefore, actual outcomes and results may differ materially from what is expressed or forecasted in such forward-looking statements. Some of the factors that may affect outcomes and results include, but are not limited to: (i) national, regional and local economic climates; (ii) changes in financial markets, and interest rates; (iii) increased or unanticipated competition for our homes; (iv) risks associated with acquisitions, dispositions and renovation of homes; (v) maintenance of REIT status and tax structuring; (vi) availability of financing and capital, the levels of debt that we maintain and our credit ratings; (vii) risks related to our investments in distressed and non-performing residential mortgage loans; (viii) environmental uncertainties, including risks of natural disasters; and (ix) those additional factors discussed in reports filed with the Securities and Exchange Commission by us under the heading “Risk Factors.” We undertake no duty to update any forward-looking statements appearing herein. Florida