Attached files
| file | filename |
|---|---|
| 8-K - 8-K - SI Financial Group, Inc. | d727694d8k.htm |
 Annual
Meeting May 14, 2014
Exhibit 99.1 |
 Forward Looking
Statements 2
This presentation contains forward-looking statements, which can be identified by the use
of words such as “believes,” “expects,”
“anticipates,”
“estimates”
or similar expressions. These forward-looking statements include, but are not limited
to: statements of our goals, intentions and expectations;
statements regarding our business plans, prospects, growth and operating strategies;
statements regarding the asset quality of our loan and investment portfolios; and
estimates of our risks and future costs and benefits.
These forward-looking statements are subject to significant risks and uncertainties.
Actual results may differ materially from those contemplated by the forward-looking
statements due to, among others, the following factors: general economic conditions,
either nationally or in our market areas, that are different than expected; changes in
the interest rate environment that reduce our margins or reduce the fair value of
financial instruments; increased competitive pressures among financial services
companies; Difficulties in integrating Newport Federal Savings Bank or failing to
achieve the expected cost savings or revenue synergies; changes in consumer spending,
borrowing and savings habits; legislative or regulatory changes that adversely affect
our business; adverse changes in the securities and credit markets; and
changes in accounting policies and practices, as may be adopted by bank regulatory agencies or
the Financial Accounting Standards Board.
Any of the forward-looking statements that we make in this presentation and in other
public statements we make may later prove incorrect because of inaccurate assumptions,
the factors illustrated above or other factors that we cannot foresee. Consequently, no
forward-looking statement can be guaranteed.
Because of these and other uncertainties, our actual future results may be materially
different from the results indicated by these forward-looking statements. We
do not undertake, and specifically disclaim any obligation, to revise any forward-looking statements
contained in this presentation. |
 3
(1)
Close price on April 30, 2014
(2)
See Appendix –
Non-GAAP Financial Measures
Market Summary as of April 30, 2014
Issuer:
SI Financial Group, Inc.
Listing / Ticker Symbol:
Nasdaq Global Market / “SIFI”
Market Price Per Share:
(1)
$11.80
Shares Outstanding:
12,828,406
Market Capitalization:
$151.4 million
Tangible Book Value Per Share:
(2)
$10.52
Price to Tangible Book Value:
112.17%
Dividend Yield:
1.04% |
 Company
Overview |
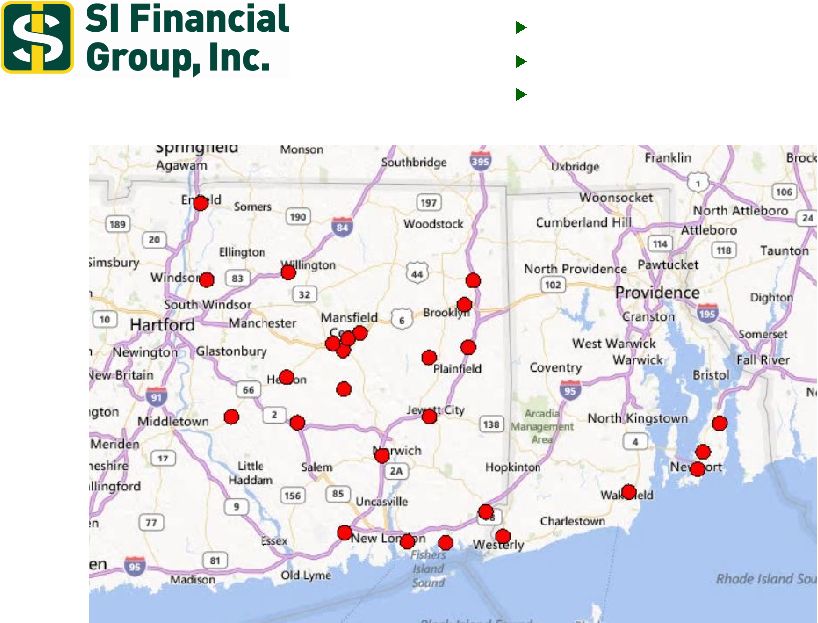 5
Headquartered in Willimantic, CT
Established in 1842
Total assets in 1995: $252 million |
 Business
Strategy 6
Continue community oriented focus by offering a full range of financial products
and services to its customers
Optimize future growth opportunities by executing a proven business model and
by opportunistically seeking branch or whole bank acquisitions in areas in or
adjacent to existing market area
Prudently diversify the asset mix and geographic concentration by selectively
increasing the percentage of commercial business loans, multi-family and
commercial real estate loans locally and in the New England region and by
expanding the existing portfolio of time share and homeowner association loans
Continue conservative underwriting practices and maintain a high
quality loan
portfolio
Increase core deposits by emphasizing exceptional customer service, cross-selling
our full range of financial products and increasing our commercial deposits
Supplement noninterest income through expanded mortgage banking operations
and wealth management operations |
 Financial
Highlights |
 Franchise
Growth 8
Savings Institute has grown organically and through acquisitions, resulting in an
asset CAGR from 2009 to 2013 of 11.5%
Total Assets
(In Thousands) |
 Deposits
- Trend
Total deposits exclude mortgagors’
and investors’
escrow
accounts
From December 2009 to March 2014, total
deposits have grown at CAGR of 8.8% $65,407
$66,845
$85,958
$89,836
$139,428
$136,297
$282,071
$304,306
$343,331
$338,076
$494,765
$505,652
$311,309
$289,563
$272,637
$277,236
$350,556
$362,334
$0
$100,000
$200,000
$300,000
$400,000
$500,000
$600,000
$700,000
$800,000
$900,000
$1,000,000
2009
2010
2011
2012
2013
Mar 2014
Demand
NOW/Savings/MMDA
Time
Average
Interest Rate
2.25%
1.55%
1.18%
0.97%
0.75%
0.62%
9 |
 Loan Portfolio
- Trend
10
$0
$100,000
$200,000
$300,000
$400,000
$500,000
$600,000
$700,000
$800,000
$900,000
$1,000,000
$1,100,000
2009
2010
2011
2012
2013
Mar 2014
Com'l RE
Com'l Bus
Construction
1-4 Family
Consumer
(In Thousands) |
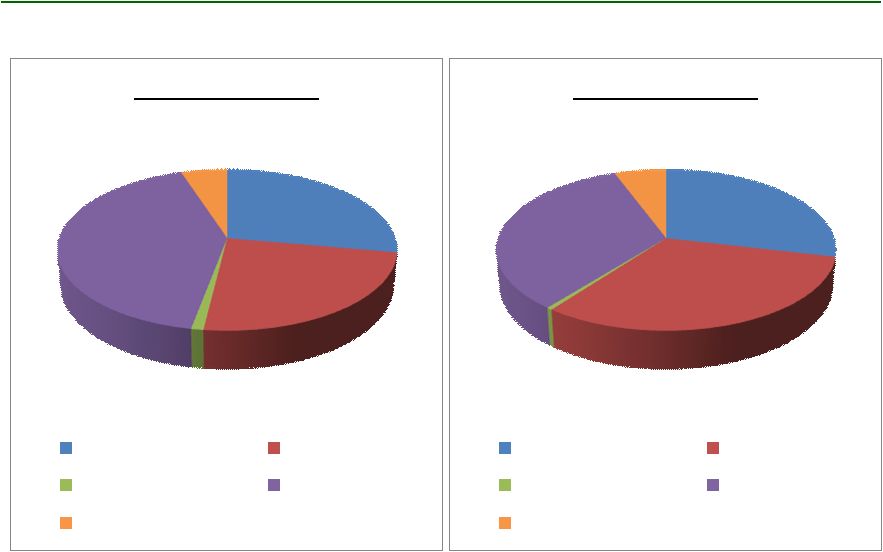 Loan Portfolio
– Comparison
27.80%
24.13%
1.01%
41.99%
5.06%
March 31, 2014
Com'l RE
Com'l Bus
Construction
1-4 Family
Consumer
28.66%
31.62%
0.48%
33.55%
5.69%
March 31, 2013
Com'l RE
Com'l Bus
Construction
1-4 Family
Consumer
11 |
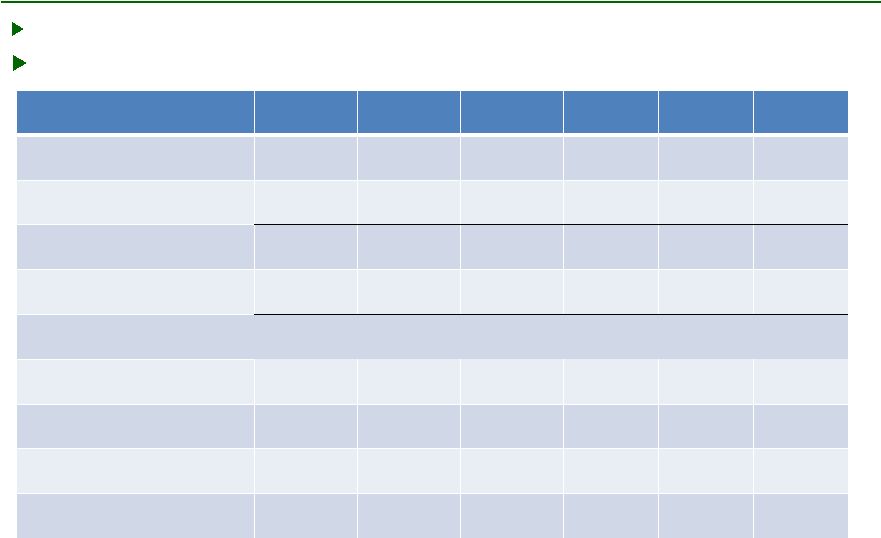 Asset Quality
– Trend
12
Savings
Institute has maintained high asset quality with solid reserve coverage
Aggressive with early recognition of nonperforming loans
2009
2010
2011
2012
2013
Mar 2014
Nonperforming loans
$ 3,007
$ 4,925
$ 10,591
$ 7,654
$ 6,993
$ 5,983
Other real estate owned
3,680
1,285
976
1,293
2,429
2,037
Nonperforming assets
6,687
6,210
11,567
8,947
9,422
8,020
Accruing TDRs
67
5,261
4,620
3,826
2,192
3,178
Total NPAs and TDRs
6,754
11,471
16,187
12,773
11,614
11,198
NPLs/Loans
0.49%
0.81%
1.70%
1.11%
0.66%
0.57%
NPAs and TDRs /Assets
0.77%
1.24%
1.69%
1.34%
0.86%
0.82%
Reserves/Loans
0.80%
0.79%
0.80%
0.93%
0.66%
0.69%
Reserves/NPLs
162.65%
97.44%
46.93%
83.45%
98.90%
121.21% |
 Securities
Portfolio – March 31, 2014
13
Savings Institute maintains a diversified securities portfolio totaling $170.0
million at March 31, 2014
Savings Institute performs impairment analyses on its securities
portfolio
quarterly. As of March 31, 2014, all securities were of investment grade.
|
 Noninterest
Income - Trend
14
$10,181
$10,685
$11,127
$8,717
$8,305
$7,000
$8,000
$9,000
$10,000
$11,000
$12,000
2009
2010
2011
2012
2013
(In Thousands) |
 Electronic
Banking 15
2012
2013
Transaction at SIBT ATMs
870,399
914,204
Debit Signature Transactions
2,473,993
3,274,051
Debit POS/ATM Transactions
2,611,065
2,912,075
On-line Bill Pay Transactions
329,014
367,446
eStatement Accounts
13,906
22,506
EBills
1,180
1,762
Mobile Browser Sessions
243,671
367,446 |
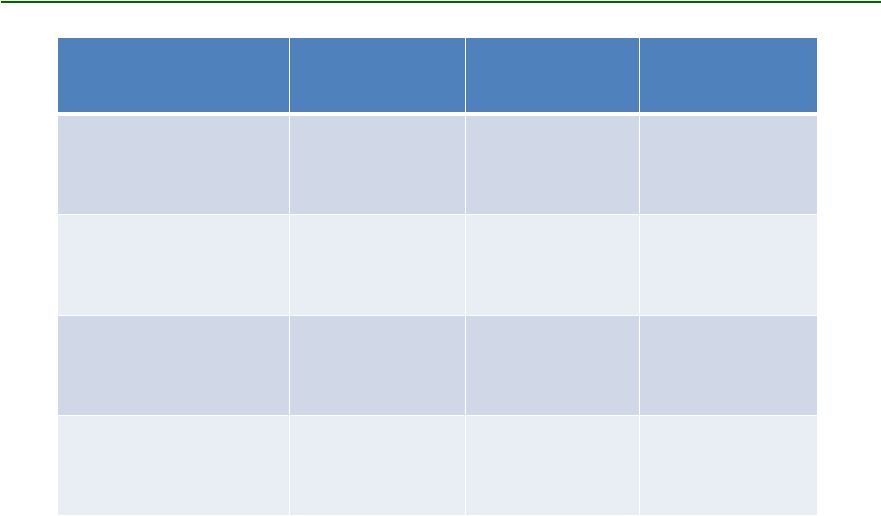 Financial
Strength – March 31, 2014
* Represents regulatory capital ratios for Savings Institute.
16
Ratio *
Minimum
Required
Well
Capitalized
Risk-Based Capital
15.76%
8.00%
10.00%
Tier 1 Risk-Based
Capital
14.80%
4.00%
6.00%
Tier 1 Capital
8.98%
4.00%
5.00%
Tangible
Equity
Ratio
8.98%
1.50%
N/A |
 Earnings
17
2013 –
Net Loss of $855,000
$2.6 million of Pre-tax Merger-related Expenses for Newport Acquisition
$1.2 million in Losses on the Sale of Securities
$659,000 in Federal Home Loan Bank Prepayment Penalties for the Early
Extinguishment of Debt
Includes Operations of Newport effective September 6, 2013
4 Quarter of 2013 –
Net Income of $1.0 million
1 Quarter of 2014 –
Net Income of $906,000
th
st |
 Appendix
– Non-GAAP Financial Measures |
 Non-GAAP
Financial
Measures
–
March
31,
2014
19
Tangible Book Value Per Share:
Book value per share
$12.03
Effect of intangible assets per share
( 1.51)
Tangible book value per share
$10.52
Tangible Common Equity:
Equity
$154,298
Less: Intangible assets
(19,402)
Tangible equity
$134,896
Dollars in thousands, except per share amounts |