Attached files
| file | filename |
|---|---|
| 8-K - FORM 8-K - FNB CORP/PA/ | d727139d8k.htm |
 F.N.B. Corporation
Investor Presentation
First Quarter 2014
May 14, 2014
Exhibit 99.1 |
 Cautionary Statement Regarding Forward-Looking Information
and Non-GAAP Financial Information
2
This presentation and the reports F.N.B. Corporation files with the Securities and Exchange Commission
often contain “forward-looking statements” relating to present or future trends
or factors affecting the banking industry and, specifically, the financial operations, markets and products of F.N.B.
Corporation. These forward-looking statements involve certain risks and uncertainties. There are a
number of important factors that could cause F.N.B. Corporation’s future results to differ
materially from historical performance or projected performance. These factors include, but are not limited
to: (1) a significant increase in competitive pressures among financial institutions; (2) changes in
the interest rate environment that may reduce interest margins; (3) changes in prepayment
speeds, loan sale volumes, charge-offs and loan loss provisions; (4) general economic conditions; (5)
various monetary and fiscal policies and regulations of the U.S. government that may adversely affect
the businesses in which F.N.B. Corporation is engaged; (6) technological issues which may
adversely affect F.N.B. Corporation’s financial operations or customers; (7) changes in the securities
markets; (8) risk factors mentioned in the reports and registration statements F.N.B. Corporation
files with the Securities and Exchange Commission; (9) housing prices; (10) job market; (11)
consumer confidence and spending habits; (12) estimates of fair value of certain F.N.B. Corporation assets
and liabilities; (13) transaction risks associated with the pending merger of OBA Financial Services
Inc., and integration challenges related to the completed mergers with BCSB Bancorp, Inc., PVF
Capital Corp. and Annapolis Bancorp, Inc. and the difficulties encountered in expanding into a new
market; (14) the effects of current, pending and future legislation, regulation and regulatory
actions, or (15) the impact on federal regulated agencies that have oversight or review of
F.N.B. Corporation’s business and securities activities. F.N.B. Corporation undertakes no obligation to revise these
forward-looking statements or to reflect events or circumstances after the date of this
presentation. To
supplement its consolidated financial statements presented in accordance with Generally Accepted Accounting Principles (GAAP), the
Corporation provides additional measures of operating results, net income and earnings per share (EPS)
adjusted to exclude certain costs, expenses, and gains and losses. The Corporation
believes that these non-GAAP financial measures are appropriate to enhance the
understanding of its past performance as well as prospects for its future performance. In the event of such a disclosure or release, the Securities
and Exchange Commission’s Regulation G requires: (i) the presentation of the most directly
comparable financial measure calculated and presented in accordance with GAAP and (ii) a
reconciliation of the differences between the non-GAAP financial measure presented and the most
directly comparable financial measure calculated and presented in accordance with GAAP. The Appendix to this
presentation contains non-GAAP financial measures used by the Corporation to provide information useful to investors in
understanding the Corporation's operating performance and trends, and facilitate comparisons with the
performance of the Corporation's peers. While the Corporation believes that these
non-GAAP financial measures are useful in evaluating the Corporation, the information should be
considered supplemental in nature and not as a substitute for or superior to the relevant financial
information prepared in accordance with GAAP. The non-GAAP financial measures used by
the Corporation may differ from the non-GAAP financial measures other financial institutions use to
measure their results of operations. This information should be reviewed in conjunction with the
Corporation’s financial results disclosed on April 23, 2014 and in its periodic filings
with the Securities and Exchange Commission. |
 Important Information About the Pending Merger
Merger
of
F.N.B.
and
OBA
Financial
Services
Inc.
In
connection
with
the
proposed
merger
between
F.N.B.
and
OBA
Financial
Services,
Inc.,
a
definitive
proxy statement of and OBA Financial Services, Inc. and prospectus of F.N.B. will
be filed with the SEC. SHAREHOLDERS OF OBA FINANCIAL SERVICES, INC. ARE
ADVISED TO READ THE PROXY STATEMENT/PROSPECTUS WHEN IT BECOMES AVAILABLE AND ANY OTHER RELEVANT DOCUMENTS
FILED WITH THE SEC, AS WELL AS ANY AMENDMENTS OR SUPPLEMENTS TO THOSE DOCUMENTS,
BECAUSE THEY WILL CONTAIN IMPORTANT INFORMATION.
F.N.B. and OBA Financial Services, Inc. and certain of their directors and
executive officers may be deemed to be participants in the solicitation of proxies from
OBA
Financial
Services,
Inc.
shareholders
in
connection
with
the
proposed
merger.
Information
concerning
such
participants’
ownership
of
OBA
Financial
Services, Inc. common stock will be set forth in the definitive proxy
statement/prospectus. Where to Find Additional Information. A free copy of
the definitive proxy statement/prospectus for each pending merger, as well as other documents containing
information
about
F.N.B.
Corporation
and
OBA
Financial
Services,
Inc.,
may
be
obtained
at
the
SEC’s
Internet
site
(http://www.sec.gov).
In
addition,
investors
and security holders may obtain free copies of the documents that F.N.B. and OBA
Financial Services, Inc. have filed with the SEC by contacting the following
persons at each corporation:
F.N.B.:
James
G.
Orie,
Chief
Legal
Officer,
F.N.B.
Corporation,
One
F.N.B.
Boulevard,
Hermitage,
PA
16148,
telephone:
(724)
983-3317
OBA Financial Services, Inc.: Charles E. Weller, President and Chief
Executive Officer, OBA Financial Services, Inc., 20300 Seneca Meadows Parkway
Germantown, MD 20876, telephone: (301) 916-0742.
3 |
 4
F.N.B. Corporation
About F.N.B. Corporation
Experienced Leadership Team
Favorably Positioned for Long-Term Success
Strong Operating Trends |
 About F.N.B. Corporation
5
(1) Pro-forma for the pending acquisition of OBA Financial Services, Inc., which is
expected to close in 3Q14, with assets of approximately $0.4 billion, loans of $0.3
billion, deposits of $0.3 billion and 6 banking locations; (2) SNL Financial, excludes custodian bank
•
Assets: $14.9 billion
(1)
•
Loans: $10.2 billion
(1)
•
Deposits: $12.2 billion
(1)
•
Banking locations: 289
(1)
•
Market Capitalization: $2.1 billion
•
Attractive and expanding footprint: PA/OH/MD/WV: Banking locations span
57
counties and four states
(1)
•
Presence in three major metropolitan markets
(2)
•
#3 market share in the Pittsburgh, Pennsylvania MSA
•
#10 market share in the Baltimore, Maryland MSA
•
#14 market share in the Cleveland, Ohio MSA
•
Solid profitability performance
•
Consistent, high-quality results
•
Industry-leading, consistent loan growth
•
Solid shareholder returns
•
Position for sustained growth; maintain low risk profile
•
Reposition and reinvest in the franchise
•
Maintain disciplined expense control
•
Expand market share potential and growth opportunities
•
Maintain low-risk profile
High-Quality,
Growing Regional Financial Institution
Positioned for Sustained Growth
Consistent, Strong Operating Results
Operating Strategy |
 Years of
Banking
Experience
Joined FNB
Prior Experience
President and CEO
Vincent J. Delie, Jr.
27
2005
National City
President, First National Bank
John C. Williams, Jr.
43
2008
Huntington
National City
Mellon Bank
Chief Financial Officer
Vincent J. Calabrese, Jr.
26
2007
People’s United
Chief Credit Officer
Gary L. Guerrieri
28
2002
FNB
Promistar
Experienced Leadership Team
6
Experienced and respected executive management team has guided FNB through the cycle, and
positioned Company for long-term, sustained growth |
 Favorably Positioned for Long-Term Success
7
High-Quality Earnings and Consistent Strong Performance Relative to Peers
Full Year 2013 -
Record net income, record loan production of $3.3 billion, solid operating results
First Quarter 2014 –
Continued solid profitability performance and high-quality earnings
Organic
growth
in
total
loans
for
19
consecutive
quarters,
led
by
strong
C&I
average
loan
growth
of
10%
annualized.
Strong funding mix with transaction deposits and customer repos representing 76% of total
deposits and customer repos at March 31, 2014. Loans to deposits and customer
repurchase agreements ratio of 85%. Consistent loan and low-cost deposit growth
supports stability in the net interest margin. Solid
and
consistent
asset
quality
results
-
provision
for
loan
losses
continued
to
exceed
net
charge-offs
to
support
loan growth.
1Q14 efficiency ratio of 59% slightly improved from prior year quarter.
FNB
recently
named
as
a
“Best
Performing
Regional
Bank
of
2013”
by
SNL
Financial.
Expanded Footprint and Growth Potential
Recent acquisitions in dynamic markets enhance organic growth opportunities.
Repositioned and Enhanced Delivery Channel
Full suite of online and mobile banking products, 54k customers currently enrolled, with
continued growth expected. Branch optimization strategy has resulted in 52
consolidations and 10 de-novo expansions since 2010 . Significant Talent
Acquisition Leadership and team build-outs over past several years in existing
markets Leadership and team build in expansion markets essentially complete
Sales Management Process and Culture
Developed and implemented proprietary systems, processes and strong culture over the past
several years Deployed across FNB business units
Consistent Investments in Enterprise-Wide Risk Management Infrastructure
Well-positioned to continue successfully navigating regulatory environment
Recent Capital Actions Strengthen Capital Structure, Support Growth Objectives and Address Basel
III Provisions |
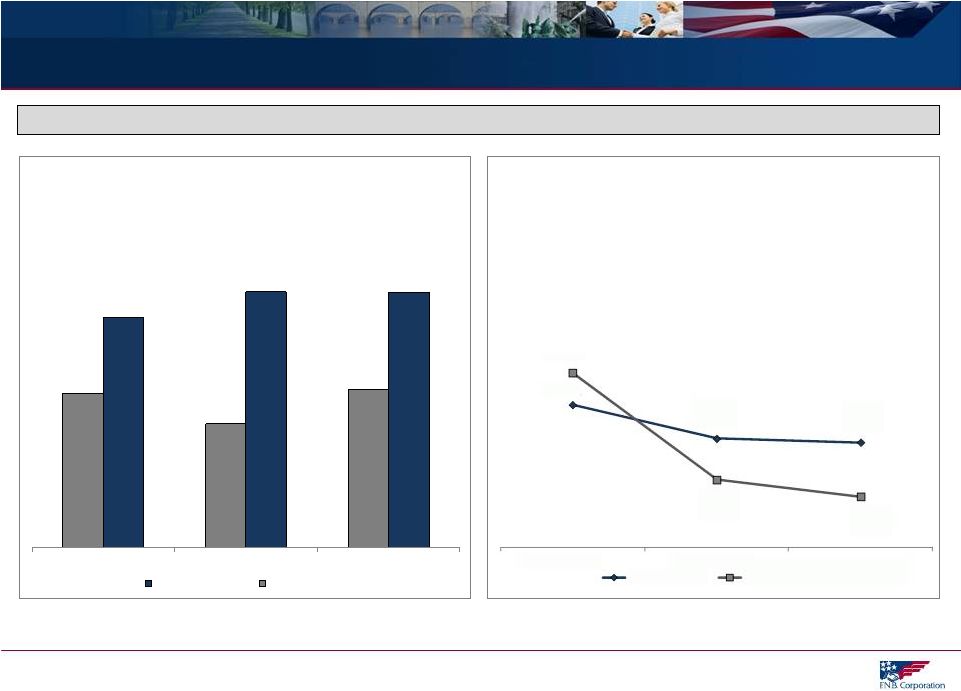
 Operating Results Relative to Peers
8
The
above
represents
full-year
2010,
2011,
2012, 2013
or
quarterly
results
as
noted.
Refer
to
Supplemental
Information
for
peer
group
listing.
(1) Operating results, refer to Supplemental Information.
1Q14 = First
Full Quarter of
4Q13 Capital
Actions
59.0%
57.8%
59.7%
58.6%
59.7%
30.0%
35.0%
40.0%
45.0%
50.0%
55.0%
60.0%
65.0%
70.0%
1Q14
4Q13
3Q13
2Q13
1Q13
Efficiency Ratio
FNB
Peer Group Median
0.00%
0.20%
0.40%
0.60%
0.80%
1.00%
1.20%
1.40%
1Q14
2013
2012
2011
2010
Net Charge-Offs to Average Loans
FNB
Peer Group Median
0.28%
0.28%
0.35%
0.58%
0.77%
3.62%
3.67%
3.64%
3.63%
3.66%
2.50%
2.70%
2.90%
3.10%
3.30%
3.50%
3.70%
3.90%
1Q14
4Q13
3Q13
2Q13
1Q13
Net Interest Margin
FNB
Peer Group Median
14.60%
17.35%
18.75%
16.32%
14.71%
0.00%
2.00%
4.00%
6.00%
8.00%
10.00%
12.00%
14.00%
16.00%
18.00%
20.00%
1Q14
2013
2012
2011
2010
ROTCE
(1)
FNB
Peer Group Median |
 Consistent Loan and Transaction Deposit Growth
9
(1) Organic balances exclude initial respective balances acquired upon transaction close for
BCSB (2/14), PVFC (10/2013), ANNB (4/2013), PVSA (1/2012) and CBT (1/2011).
Consistent Growth in Loans and Transaction Deposits
Loans
(Spot Balances, In Billions)
Transaction Deposits and Customer Repos
(Spot Balances, In Billions)
CAGR 4Q10 –
1Q14
Total
18.7%
Organic
(1)
9.3%
CAGR 4Q10 –
1Q14
Total
16.3%
Organic
(1)
6.6%
$9.9
$9.5
$8.1
$6.9
$6.1
$7.5
$7.4
$6.8
$6.4
$6.1
3/31/14
12/31/13
12/31/12
12/31/11
12/31/10
Total
Organic
$8.9
$8.4
$7.4
$5.8
$5.1
$6.9
$6.6
$6.2
$5.5
$5.1
3/31/14
12/31/13
12/31/12
12/31/11
12/31/10
Total
Organic |
 Transaction
Deposit
Growth
-
Strengthened
Funding
Mix
10
(1) Based on period-end balances
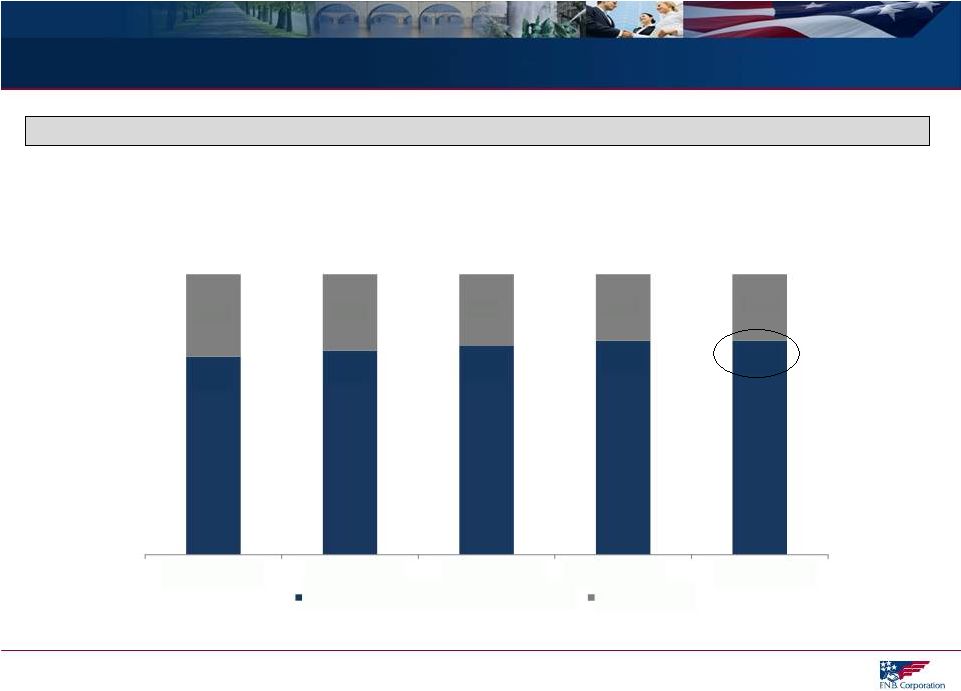
Consistent Transaction Deposit Growth Results in Strengthened Deposit Mix
Total Transaction Deposits and Customer Repos Mix
76%
76%
74%
73%
71%
24%
24%
26%
27%
29%
3/31/2014
12/31/2013
12/31/2012
12/31/2011
12/31/2010
Transaction Deposits and Customer Repos
Time Deposits |
 126%
126%
113%
78%
61%
76%
1Q14
2013 FY
2012 FY
FNB
Peer Group Median
Consistent Asset Quality –
Continued High-Quality Earnings
11
(1) At respective period-end. FNB levels represents allowance for loan losses to
total originated loans. Peer data per SNL Financial. FNB Continues to
Deliver High-Quality Earnings Provision for Loan Losses as % of Net
Charge-Offs ($) FNB provision for loan losses exceeds net charge-offs
to support consistent, solid loan growth results
Allowance for Loan Losses/Total Loans (%)
(1)
FNB allowance for loan losses to total loans (originated
portfolio) has remained relatively stable
1.28
1.29
1.38
1.14
1.18
1.47
3/31/2014
12/31/2013
12/31/2012
FNB
Peer Group Median |
 1Q14 Comparative EPS Trends
12
(1) Operating results, a non-GAAP measure, refer to Appendix for GAAP to Non-GAAP
Reconciliation details $0.19
$0.21
$0.20
$0.03
$0.01
1Q14
4Q13
1Q13
Operating EPS per Common Share
Items Impacting Comparative EPS
1Q14, Linked-Quarter and Prior Year Quarter EPS Trends
(1)
1Q14 Comparative EPS Impacted
Initial full quarter impact from 4Q13
capital actions completed to proactively
position FNB for Basel III
Third quarter of Durbin-related revenue
impact
Increased state taxes due to tax law
revisions
Above items impacted 1Q14 EPS
per common share by $0.03
Pleased with 1Q14 Results
Proven strong, consistent, fundamental key
drivers deliver high-quality earnings
Absorbing above headwind items into run-
rate earnings
Well-positioned to continue organic growth
strategy and achieve incremental benefits
from recent expansion efforts
1Q14 efficiency ratio remained below 60%
due to revenue generation, diligent
expense control and cost-saving initiatives,
well-positioned to gain additional
efficiencies |
 Enhanced Capital Position
13
Tier 1
Common
Non-
Common
Tier 1
Tier 2
6.1%
6.8%
9/30/2013
3/31/2014
$5.04
$5.58
9/30/2013
3/31/2014
Tier 1
10.6%
Tier 1
11.3%
Total Risk-Based Capital
Tangible Common Equity/
Tangible Assets
Tangible Book Value
Per Share
Capital Position as of March 31, 2014
Capital levels at March 31, 2014 reflect benefit of fourth quarter of 2013 capital
actions Raised $161.3 million in net proceeds through the issuance of 4.7
million shares of common stock and 4.4 million depositary shares of
non-cumulative perpetual preferred stock Strengthened capital structure
to address Basel III provisions Redeemed $138 million of trust preferred
securities through March 31, 2014 Trust
preferred
securities
now
represent
6%
of
Tier
1
capital
at
March
31,
2014
compared
to
19%
at
September
30,
2013 (pre-capital actions), and 39% of non-common Tier 1 capital compared
to100% at September 30, 2013 TCE/TA
and
TBV
per
share
have
each
increased
11%
since
September
30,
2013
2.0%
1.7%
1.5%
1.3%
12.1%
12.6%
8.6%
9.6%
9/30/2013
3/31/2014 |
 Market Position
Strong Market Position
Regional Alignment
Presence in Major Markets
Acquisition-Related Expansion Enhances Organic Growth Opportunities
14 |
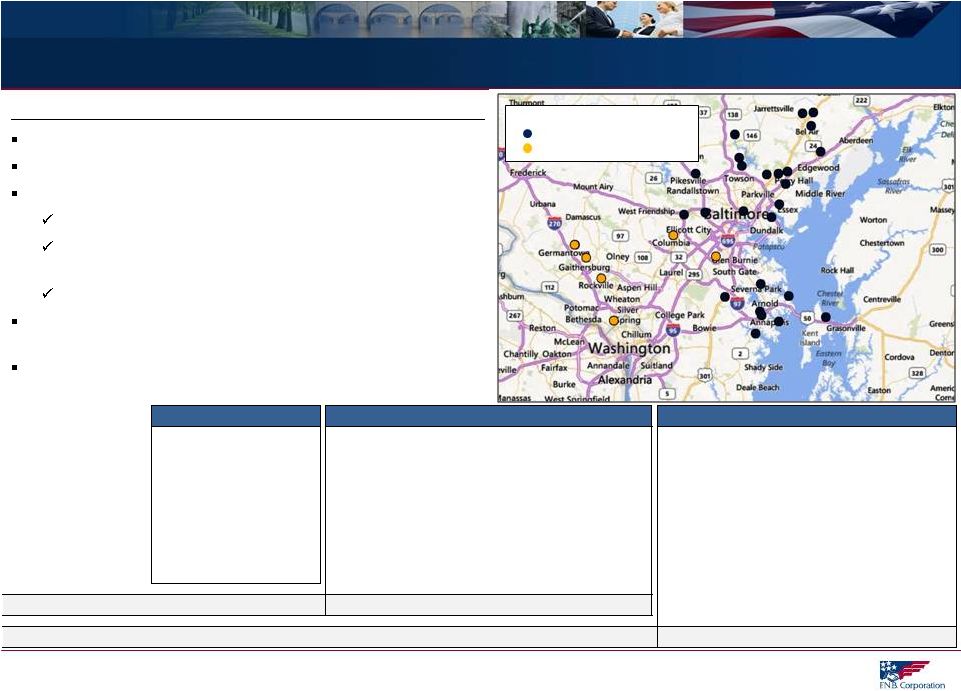
 FNB’s model utilizes six regions, including three in major metropolitan
markets, with each having a regional headquarters housing cross-functional
teams. The five most recent announced acquisitions position FNB in
dynamic metro markets. FNB Banking Footprint
15
Source: SNL Financial
FNB Recent Acquisition Summary
MSA
FNB
Market
Share
MSA
Population
Pittsburgh
#3
2.4 Million
(#22 MSA)
PVSA -
Closed 1Q12
Baltimore
#10
2.7 Million
(#20 MSA)
ANNB -
Closed 2Q13
BCSB -
Closed 1Q14
OBAF –
Pending, expected close 3Q14
Cleveland
#14
2.1 Million
(#29 MSA)
PVFC -
Closed 4Q13
Cleveland
MSA
Pittsburgh
MSA
Baltimore
MSA
Current FNB Locations
OBAF Locations |
 MSA
Market
Share
-
Proven
Success,
Opportunity
For
Growth
16
Source: SNL Financial, deposit data as of June 30, 2013, pro-forma as of April 30,
2014, excludes custodial bank (Pittsburgh MSA and Washington DC MSA). All Other MSAs
represent MSA’s with FNB presence excluding Pittsburgh, Cleveland and Baltimore MSAs.
Established
MSA
Markets
–
Proven
Success,
Leading
Share
Position
Achieved
Recent
Expansion
MSA
Markets
–
Opportunity
for
Growth
Pittsburgh, PA MSA
Rank
Institution
Total Deposits
($000)
Market
Share (%)
1
PNC Financial Services Group Inc.
46,290,008
56.1%
2
Royal Bank of Scotland Group Plc
7,129,530
8.6%
3
F.N.B. Corp.
3,835,905
4.6%
4
Dollar Bank Federal Savings Bank
3,556,646
4.3%
5
First Niagara Financial Group Inc.
2,762,262
3.3%
6
Huntington Bancshares Inc.
2,512,422
3.0%
7
First Commonwealth
2,465,101
3.0%
8
TriState Capital Holdings Inc.
1,940,243
2.4%
9
S&T Bancorp Inc.
1,674,394
2.0%
10
Northwest Bancshares Inc.
1,045,914
1.3%
All Other FNB MSAs
Rank
Institution
Total Deposits
($000)
Market
Share (%)
1
Wells Fargo & Co.
28,625,288
11.5%
2
Capital One Financial Corp.
21,808,231
8.8%
3
PNC Financial Services Group Inc.
21,451,640
8.6%
4
Bank of America Corp.
21,178,566
8.5%
5
SunTrust Banks Inc.
16,558,202
6.7%
6
BB&T Corp.
13,395,183
5.4%
7
M&T Bank Corp.
11,277,819
4.5%
8
Citigroup Inc.
6,617,764
2.7%
9
F.N.B. Corp.
5,400,417
2.2%
10
United Bankshares Inc.
4,538,141
1.8%
Baltimore -
Towson, MD MSA
Rank
Institution
Total Deposits
($000)
Market
Share (%)
1
Bank of America Corp.
16,059,885
25.4%
2
M&T Bank Corp.
14,128,448
22.3%
3
PNC Financial Services Group Inc.
6,716,296
10.6%
4
Wells Fargo & Co.
6,049,235
9.6%
5
BB&T Corp.
3,883,370
6.1%
6
SunTrust Banks Inc.
2,046,469
3.2%
7
First Mariner Bancorp
1,093,935
1.7%
8
Susquehanna Bancshares Inc.
1,082,184
1.7%
9
Capital One Financial Corp.
976,373
1.5%
10
F.N.B. Corp.
965,219
1.5%
Cleveland-Elyria-Mentor, OH MSA
Rank
Institution
Total Deposits
($000)
Market
Share (%)
1
KeyCorp
11,363,682
21.9%
2
PNC Financial Services Group Inc.
6,331,873
12.2%
3
TFS Financial Corp. (MHC)
5,425,587
10.4%
4
Huntington Bancshares Inc.
4,261,126
8.2%
5
Royal Bank of Scotland Group Plc
4,104,874
7.9%
6
FirstMerit Corp.
3,469,571
6.7%
7
Fifth Third Bancorp
3,384,743
6.5%
8
JPMorgan Chase & Co.
2,893,731
5.6%
9
U.S. Bancorp
2,032,321
3.9%
10
Dollar Bank Federal Savings Bank
1,701,264
3.3%
14
F.N.B. Corp.
623,947
1.2% |
 Significant Commercial Prospects
17
Note: Above metrics at the MSA and County level
(1)
Data per U.S. Census Bureau, and does not include total businesses related to pending OBAF
acquisition (2)
Data per Hoover’s as of May 2, 2014
(3)
Montgomery County, Maryland, presented as potential prospects related to pending OBAF
acquisition expansion Significant
Commercial
Prospects
Concentrated
in
Pittsburgh,
Maryland
&
Cleveland
Opportunity
to
Leverage
Core
Competency
and
Drive
Sustained
Organic
Growth
(1)
(2)
Strong Concentration of Commercial Prospects In
Metro Expansion Markets
Over 175,000 Total Businesses
(1)
(3)
1,882
1,993
2,090
8,867
9,674
10,340
4,584
12,851
13,345
13,410
52,149
59,240
65,169
Youngstown, OH
MSA
Scranton, PA
MSA
Harrisburg, PA
MSA
Cleveland, OH
MSA
Pittsburgh, PA
MSA
Baltimore, MD
MSA
Montgomery
County, MD
# of Business with Revenue >$1M
Total Businesses |
 Disciplined
Acquisition
Strategy
–
Platform
for
Organic
Growth
18
Disciplined and Consistent Acquisition Strategy
Strategy
Disciplined identification and focus on markets that offer
potential to leverage core competencies and growth
opportunities
Criteria
Create shareholder value
Meet strategic vision
Fit culturally
Evaluation
Targeted financial and capital recoupment hurdles
Proficient and experienced due diligence team
Extensive and detailed due diligence process
Execution
Superior post-acquisition execution
Execute FNB’s proven, scalable, business model
Proven success assimilating FNB’s strong sales culture
13th bank acquisition announced since 2002 (OBAF)
Fifth consecutive acquisition in a major MSA
Five acquisitions completed since 2010
Ten acquisitions completed since 2005
Execution
Strategy
Criteria
Evaluation
Experienced Acquirer |
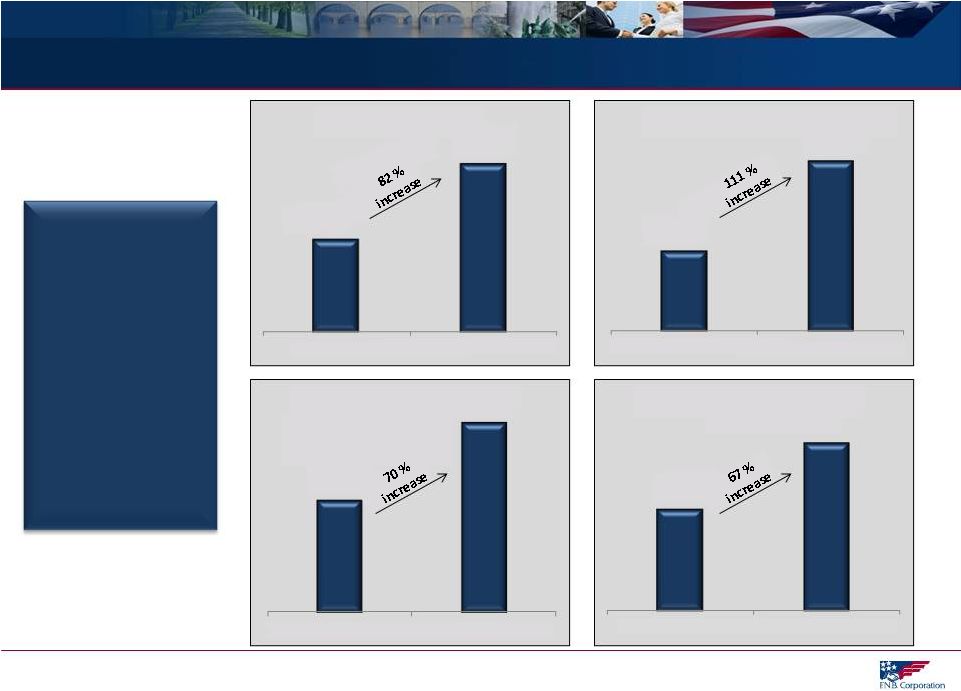 Expanded Franchise = Enhanced Organic Growth Prospects
19
Note: Market population and market businesses represent current metrics based on respective
FNB MSA presence Data per FNB, SNL Financial and/or U.S. Census Bureau
(Businesses) Acquisition-
Related
Expansion in
Higher Growth
Markets
Enhances
Organic Growth
Opportunities
In Millions
159
289
2007
1Q14 Pro
-Forma
FNB Branches
27
57
2007
1Q14 Pro
-Forma
FNB Counties of Operation
7.4
12.6
2007
1Q14 Pro
-Forma
FNB Markets Population
(MSA)
3.0
5.0
2007
1Q14 Pro
-Forma
FNB Markets Households
(MSA) |
 FNB
Maryland
Acquisitions
–
Platform
For
Growth
In
Place
20
FNB Maryland
Acquisition History
Announce
Completion
Assets
Loans
Deposits
Branches
Credit Mark
Cost Savings
OBAF
4/2014
3Q14
0.4
$
0.3
$
0.3
$
6
1.3
x
3%
40%
BCSB
6/2013
2/2014
0.6
$
0.3
$
0.5
$
16
1.4
x
6%
25%
ANNB
10/2012
4/2013
0.4
$
0.3
$
0.4
$
8
1.6
x
6%
30%
FNB Regional HQ
3/2014
1
Total Scale
1.4
$
0.9
$
1.2
$
31
Average P/TBV, Credit Mark, Cost Savings
1.4
x
5%
32%
Dates
Scale
(1)
Pricing/Credit Marks/Cost Savings
(2)
P/TBV
($ in billions)
(1)
As
of
close
for
completed
acquisitions
,
announce
date
for
pending
acquisition;
(2)
As
of
announce
date
FNB’s Expanding Maryland Presence Continues to Strengthen
Solid
platform
for
growth
established
in
under
one
year
Top 10 deposit market share
Cost effective, lower-risk acquisitions
Attractively priced at an average of 1.4x TBV
Solid,
performing
acquired
portfolios
-
average
credit mark of 5%
Established presence enables realization of cost savings
Steady pace of acquisitions has allowed time to build strong,
in-market leadership and team
Leverages FNB’s experienced integration team
FNB Maryland Presence
Current FNB Locations
OBAF Locations |
 21
Strong Operating Results
1Q14 Highlights and Trends |
 1Q14 Operating and Strategic Highlights
22
First Quarter 2014 Operating Result Highlights
1Q14 operating
(1)
net income available to common shareholders of $30.8 million; earnings per diluted
common share of $0.19 First full quarter of 4Q13 capital raise, third
quarter of Durbin impact and increased bank shares tax impacted EPS per
common share by $0.03 Solid profitability performance and continued
high-quality earnings Return
on
average
tangible
assets
of
1.06%
(1)
Return
on
average
tangible
common
equity
of
14.60%
(1)
Net interest margin of 3.62%, continued stability in core net interest
margin Efficiency ratio of 59%
Expense
control
effective
–
year-over-year
operating
expense
growth
of
11%
relative
to
21%
asset
growth
Strong organic loan growth
Total organic average loan growth of $144.3 million or 6.2% annualized
Continued good asset quality results
Net charge-offs of 0.28% annualized of average originated loans
Non-performing loans and OREO to total originated loans and OREO at
1.46% Total
delinquency
for
the
originated
portfolio
improved
11
basis
points
to
1.17%
Tangible common equity to tangible asset ratio of 6.8%, highest level in over 10
years Strategic Accomplishments
Announced signing of merger agreement with OBA Financial Services, Inc. (OBAF) on
April 8, 2014 Completed and integrated BCSB Bancorp, Inc. (BCSB) acquisition
on February 15, 2014 Realized net gain of $9.5 million on sale of certain
securities, including trust preferred securities portfolio Completed
redemption of pooled trust preferred securities in conjunction with 4Q13 capital actions
(1) Operating results, a non-GAAP measure, refer to Appendix for GAAP to Non-GAAP
Reconciliation details |
 1Q14 Financial Highlights –
Quarterly Trends
23
Current
Quarter
1Q14
Prior
Quarter
4Q13
Prior Year
Quarter
1Q13
Operating
Earnings
(1)
Net Income ($ millions)
$33.1
$32.5
$28.8
Net income available to common shareholders ($ millions)
$30.8
$32.5
$28.8
Earnings per diluted common share
$0.19
$0.21
$0.20
Profitability
Performance
ROTCE
(1)
14.60%
16.45%
17.43%
ROTA
(1)
1.06%
1.07%
1.08%
Reported net interest margin
3.62%
3.67%
3.66%
Core net interest margin
3.60%
3.61%
3.62%
Efficiency ratio
59.0%
57.8%
59.7%
Strong
Balance Sheet
Organic Growth
Trends
(% Annualized)
(2)
Total loan growth
6.2%
5.9%
6.4%
Commercial loan growth
9.8%
4.4%
10.8%
Consumer loan growth
5.7%
13.8%
6.1%
Transaction deposits and customer repo growth
-1.4%
6.8%
2.6%
(3)
(1) Non-GAAP measure, refer to Appendix for GAAP to Non-GAAP Reconciliation details;
(2) Average, annualized linked quarter organic growth results. Organic growth
results exclude balances acquired in the BCSB acquisition (1Q14) and PVFC acquisition (4Q13); (3) Total deposits excluding time deposits
|
 Balance
Sheet
Highlights
–
Quarterly
Averages
24
(1) Linked-quarter growth, organic growth % is annualized and represents total growth less
balances acquired from the BCSB acquisition completed February 15, 2014; (2) Includes
Direct Installment, Indirect Installment and Consumer LOC portfolios; (3) Excludes time deposits; (4) Period-end as of
March 31, 2014
Average Balances, $ in Millions
1Q14
Reported
Growth
(1)
Organic
Growth
(1)
1Q14 Highlights
Balance
$
$
%
Securities
$2,496
$180.6
-
-
Continued balance sheet growth, both
organically and through acquisitions
Total reported growth reflects the
benefit from the completion of the BCSB
acquisition on February 15, 2014
Organic growth in average total loans of
$144.3 million or 6.2% annualized
Strong organic growth of 9.8%
annualized in average commercial
loans
Quarterly average organic results for
transaction deposits and customer
repurchase agreements reflect timing of
seasonality trends. Organic growth on
a period-end basis strong at $230
million or 10.8% annualized.
Strong Funding Mix
Lower cost, relationship-based
transaction deposits and customer
repurchase agreements represent
76% of total transaction deposits
and customer repurchase
agreements
(4)
Loans to deposits and customer
repos ratio of 85%
Total loans
$9,696
$373.0
$144.3
6.2%
Commercial loans
$5,425
$271.6
$125.1
9.8%
Consumer loans
(2)
$3,120
$80.6
$43.3
5.7%
Residential mortgage loans
$1,107
$21.9
-$23.0
-8.5%
Earning assets
$12,243
$468.5
-
-
Total deposits and customer repos
$11,339
$225.7
-$106.0
-3.8%
Transaction deposits and customer
repos
(3)
$8,644
$139.9
-$30.2
-1.4%
Time deposits
$2,695
$85.8
-$75.8
-11.6%
Non-interest bearing deposits
$2,223
$53.9
$28.6
5.3% |
 Net
Interest Margin Trends 25
Net Interest Margin Trends
Net Interest Margin Trends
Accretable yield benefit of $0.6 million in 1Q14 compared to $1.7 million
and $1.3 million in 4Q13 and 1Q13, respectively. 1Q14 net interest income
(FTE) totaled $109.5 million, growing $0.9 million, or 0.8%, linked quarter, and $14.7 million, or 15.5%,
compared to the prior year quarter
Continued stability in the core net interest margin |
 Asset Quality Results
(1)
26
$ in Thousands
1Q14
4Q13
1Q13
1Q14 Highlights
NPL’s+OREO/Total loans+OREO
1.46%
1.44%
1.59%
Overall consistent, solid performance
NPL’s+OREO/Total loans +OREO consistent
with the prior quarter, with the slight increase
reflecting the 3 basis point impact from the
addition of BCSB OREO, and improved from
the year-ago quarter
Delinquency improved compared to the prior
quarter and the year-ago quarter
Total provision continues to exceed net-charge-
offs
Net charge-off results remain at good levels
Year-over-year reserve position reflects
favorable credit migration in the portfolio, pay-
downs and improved non-performing loan
levels
Total delinquency
1.17%
1.28%
1.45%
Provision for loan losses
(2)
$7,006
$8,366
$7,541
Net charge-offs (NCO’s)
(2)
$5,571
$7,634
$4,213
NCO’s/Total average loans
(2)
0.23%
0.32%
0.21%
NCO’s/Total average originated loans
0.28%
0.30%
0.22%
Allowance for loan losses/
Total loans
1.28%
1.29%
1.39%
Allowance for loan losses/
Total non-performing loans
134.88%
135.42%
124.80%
(1)
Metrics shown are originated portfolio metrics unless noted as a total portfolio metric.
“Originated portfolio” or “Originated loans” excludes loans
acquired at fair value and accounted for in accordance with ASC 805 (effective January 1, 2009), as the risk of credit loss
has been considered by virtue of the Corporation’s estimate of fair value. (2)
Total portfolio
metric |
 Asset Quality Trends
27
Peer
data
per
SNL
Financial,
refer
to
Appendix
for
peer
listing;
(1)
Metrics
shown
are
originated
portfolio.
“Originated
portfolio”
or
“Originated
loans”
excludes loans acquired at fair value and accounted for in accordance with ASC 805 (effective
January 1, 2009), as the risk of credit loss has been considered by virtue of the
Corporation’s estimate of fair value; (2) Based on balances at quarter end for each period presented; (3) Full year or
quarterly results annualized.
NCO’s Originated Loans/
Total
Originated
Loans
(1)(3)
NPL’s+OREO/
Total
Originated
Loans+OREO
(1)(2) |
 28
Investment Thesis
Long-Term Investment Thesis |
 Long-Term
Investment
Thesis
-
Return
Focused
29
Long-Term Investment Thesis
5-6%
4-6%
Implied Total Shareholder Return
9-12%
FNB’s long-term investment thesis reflects a commitment to efficient capital management
and creating value for our shareholders
Targeted EPS Growth
Targeted Dividend Yield
(Targeted Payout Ratio 60-70%) |
 Consistent Operating Results
30
FNB = 93% Percentile
FNB = 92% Percentile
Data per FNB and/or SNL Financial
Refer to Supplemental Information for peer listing
FNB’s ability to deliver consistent operating results exceeds peer results
0.000%
0.010%
0.020%
0.030%
0.040%
0.050%
0.060%
2013 Peer Median
FNB
Revenue/Avg Assets Volatility
0.00%
0.05%
0.10%
0.15%
0.20%
0.25%
2014 Peer Median
FNB
ROAA Volatility
FNB
and
Peer
Volatility
(Standard
Deviation
1Q10
–
1Q14) |
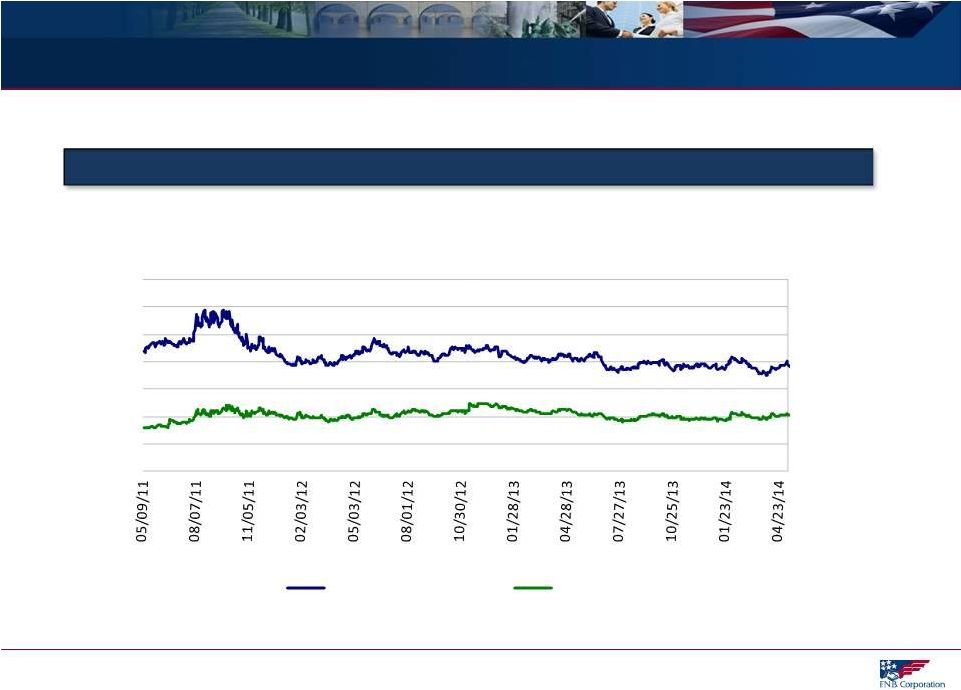
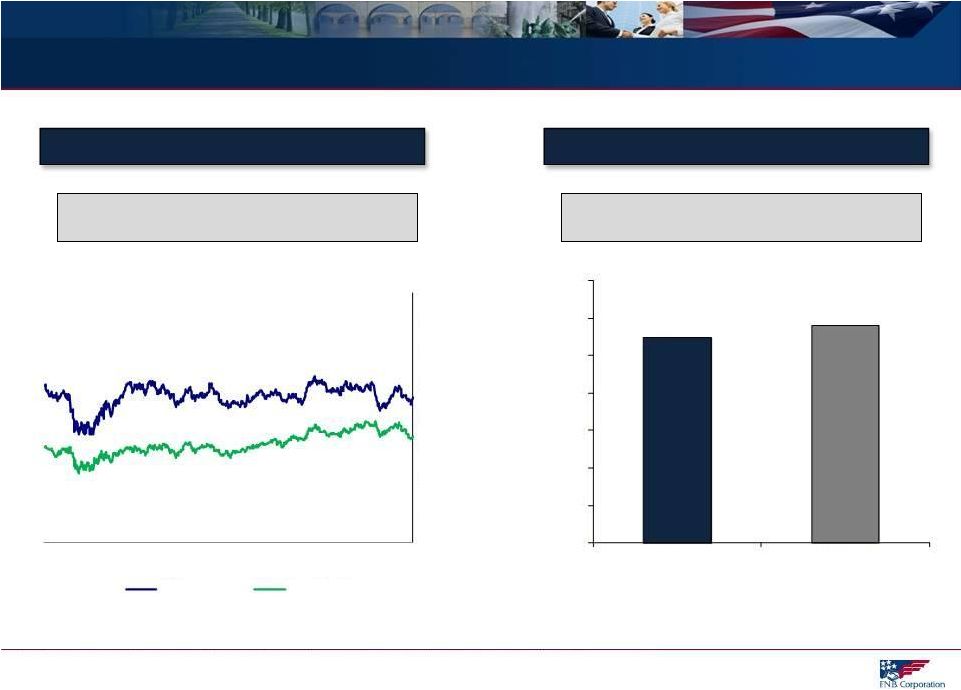 Attractive P/E Valuation Highlights Potential Upside
Market data per SNL Financial as of May 9, 2014. Refer to Supplemental Information for
regional peer listing. 31
Consistent premium to peers based on price to
tangible book value per share
FNB currently reflects an attractive valuation
based on future earnings
0.00x
0.50x
1.00x
1.50x
2.00x
2.50x
3.00x
3.50x
4.00x
05/09/11
05/09/12
05/09/13
05/09/14
FNB
Peer Median
13.49x
13.81x
8.00x
9.00x
10.00x
11.00x
12.00x
13.00x
14.00x
15.00x
FNB
2014 Peer Median
Historical Price / TBV Per Share (x)
Price / 2015 EPS Estimate (x) |
 FNB
Dividend Yield Market data per SNL Financial as of May 9, 2014. Refer to
Supplemental Information for regional peer listing. 32
FNB Dividend Yield Consistently Above Peer Levels
0.0%
1.0%
2.0%
3.0%
4.0%
5.0%
6.0%
7.0%
Annualized Dividend Yield
FNB
Peer Median |
 33
Supplemental Information |
 34
Supplemental Information Index
Diversified Loan Portfolio
Deposits and Customer Repurchase Agreements
Investment Portfolio
Loan Risk Profile
Regency Finance Company Profile
Regional Peer Group Listing
GAAP to Non-GAAP Reconciliation |
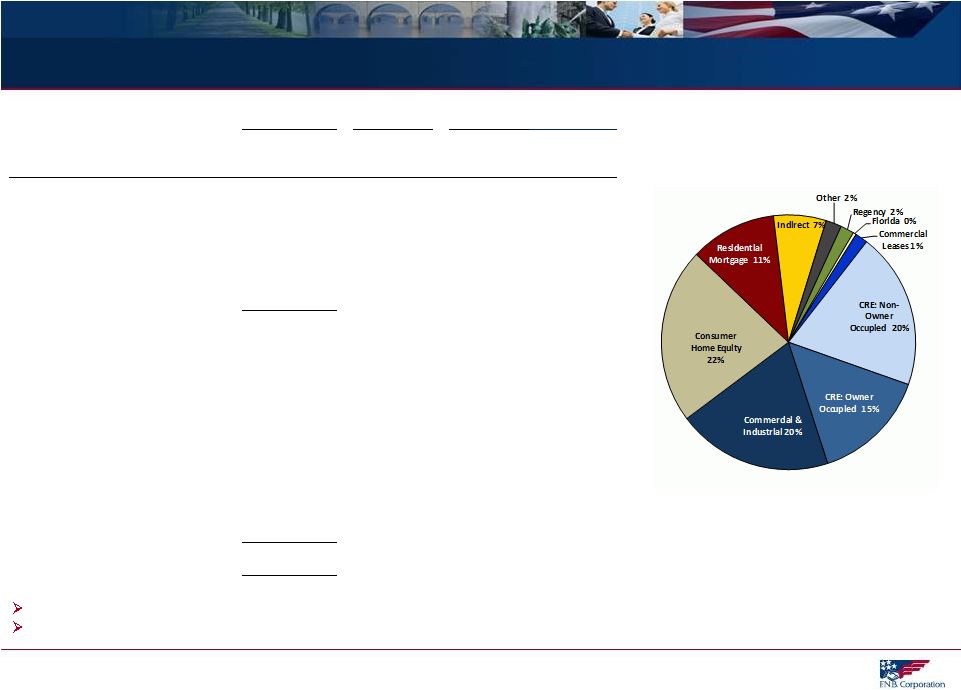 Diversified Loan Portfolio
35
Note: Balance, CAGR and % of Portfolio based on period-end balances
3/31/2014
CAGR
% of Portfolio
($ in millions)
Balance
12/31/08-
3/31/14
12/31/08
3/31/14
C&I
$1,965
14.9%
16%
20%
CRE: Non-Owner Occupied
1,973
15.3%
16%
20%
CRE: Owner Occupied
1,453
7.4%
17%
15%
Commercial Leases
161
32.3%
1%
1%
Total Commercial
$5,552
13.0%
50%
56%
Consumer Home Equity
2,221
12.2%
21%
22%
Residential Mortgage
1,093
12.9%
10%
11%
Indirect
666
5.3%
9%
7%
Other
200
4.8%
3%
2%
Regency
171
1.5%
2%
2%
Florida
39
-31.9%
5%
<1%
Total Loan Portfolio
$9,943
10.7%
100%
100%
Well diversified portfolio
Strong growth results driven by commercial loan growth
$9.9 Billion Loan Portfolio
March 31, 2014
C&I + Owner Occupied CRE =
34% of Total Loan Portfolio |
 Deposits and Customer Repurchase Agreements
36
Note: Balance, CAGR and % of Portfolio based on period-end balances; (1) Transaction
deposits include savings, NOW, MMDA and non-interest bearing deposits; (2) December
31, 2008 through March 31, 2014 3/31/2014
CAGR
Mix %
($ in millions)
Balance
12/31/08-
3/31/14
12/31/08
3/31/14
Savings, NOW, MMDA
$5,543
13.8%
44%
47%
Time Deposits
2,777
3.5%
36%
24%
Non-Interest Bearing
2,353
19.6%
14%
20%
Customer Repos
1,052
19.4%
6%
9%
Total Deposits and
Customer Repo Agreements
$11,726
12.0%
100%
100%
Transaction Deposits
(1)
and
Customer Repo Agreements
$8,949
15.8%
64%
76%
Loans to Deposits and Customer Repo Agreements Ratio =
85% at March 31, 2014
New client acquisition and relationship-based focus reflected in favorable deposit
mix –
15.8% average growth for transaction deposits and customer repo agreements
(2)
–
76% of total deposits and customer repo agreements are transaction-based deposits
(1)
$11.7 Billion Deposits and
Customer Repo Agreements
March 31, 2014 |
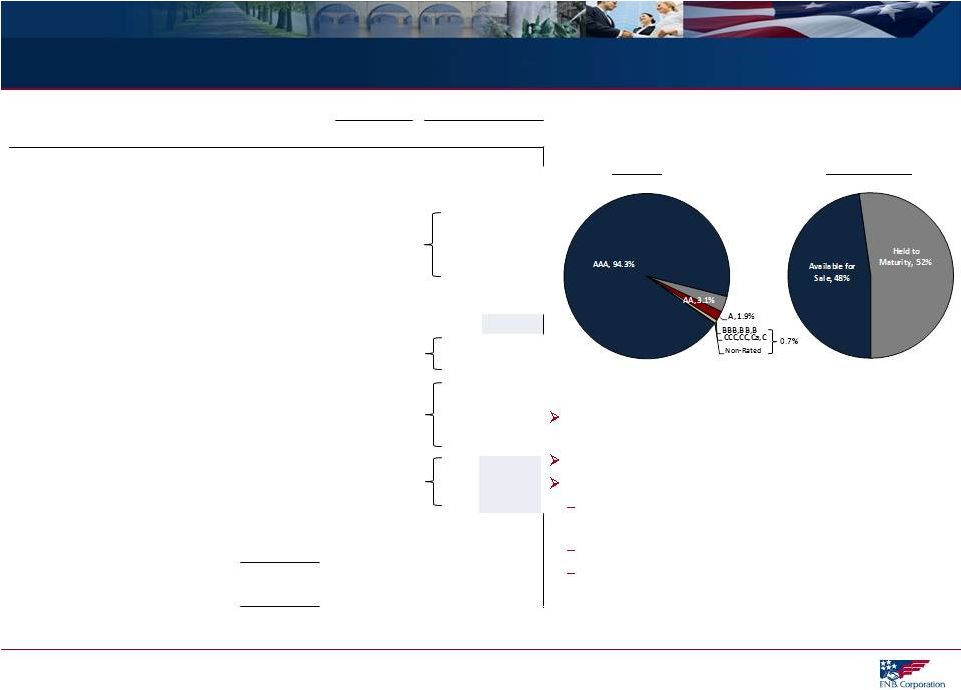 Investment Portfolio
37
(1) Amounts reflect GAAP
Highly Rated $2.7 Billion Investment Portfolio
March 31, 2014
Ratings
Composition
%
Ratings
($ in millions
(1)
)
Portfolio
Investment %
Agency MBS
$1,081
40%
AAA
97% of total portfolio rated AA or better, 99% rated A or
better
Relatively low duration of 3.6
Municipal bond portfolio
Highly rated with an average rating of AA and 98.5%
of the portfolio rated A or better
General obligation bonds = 98.9% of portfolio
80.9% from municipalities located throughout
Pennsylvania
CMO Agency
1,063
39%
AAA
100%
Agency Senior Notes
366
13%
AAA
100%
Municipals
146
5%
AAA
AA
A
BBB
11%
57%
31%
1%
Short Term
25
<1%
AAA
100%
Commercial MBS
11
<1%
AAA
100%
Corporate
10
<1%
A
BBB
50%
50%
CMO Private Label
8
<1%
AA
A
BBB
BB
22%
11%
36%
31%
Trust Preferred
6
<1%
BBB
BB
B
28%
40%
32%
Bank Stocks
2
<1%
Non-Rated
US Treasury
1
<1%
AAA
100%
Total Investment Portfolio
$2,719
100%
100% |
 38
Loan Risk Profile
(1)
Originated portfolio metric
$ in millions
Balance
3/31/2014
% of Loans
NPL's/Loans
(1)
YTD Net Charge-
Offs/Loans
(1)
Total Past
Due/Loans
(1)
Commercial and Industrial
$1,965
19.8%
0.24%
0.03%
0.37%
CRE: Non-Owner Occupied
1,973
19.8%
0.75%
-0.03%
0.80%
CRE: Owner Occupied
1,453
14.6%
2.13%
0.69%
2.40%
Home Equity and Other Consumer
2,362
23.8%
0.54%
0.17%
0.71%
Residential Mortgage
1,093
11.0%
1.25%
0.06%
2.05%
Indirect Consumer
666
6.7%
0.19%
0.34%
0.76%
Regency Finance
171
1.7%
4.44%
4.21%
3.54%
Commercial Leases
161
1.6%
0.46%
0.15%
1.17%
Florida
39
0.4%
24.09%
-0.06%
24.09%
Other
59
0.6%
0.00%
1.94%
0.39%
Total
$9,943
100.0%
0.95%
0.28%
1.17% |
 Consumer
finance
business
with
over
80
years
of
consumer
lending
experience
Credit quality: 1Q14 net charge-offs to average loans of 4.15%
Returns: 1Q14: ROA 3.73%, ROE 37.45%, ROTE 41.50%
Regency Finance Company Profile
(1)
Return on average tangible common equity (ROTCE) is calculated by dividing net
income less amortization of intangibles by average common equity less
average intangibles. Tennessee
Ohio
Pennsylvania
Kentucky
39
72 Locations
Spanning Four
States
Regency Finance Company
$171 Million Loan Portfolio
86% of Real Estate Loans are First Mortgages |
 Regional Peer Group Listing
40
Ticker
Institution
Ticker
Institution
ASBC
Associated Bancorp
ONB
Old National Bancorp
AF
Astoria Financial Corporation
PVTB
Private Bancorp, Inc.
CBSH
Commerce Bancshares, Inc.
SUSQ
Susquehanna Bancshares, Inc.
FMER
First Merit Corp.
UMBF
UMB Financial Corp.
FULT
Fulton Financial Corporation
VLY
Valley National Bancorp
MBFI
MB Financial, Inc
WBS
Webster Financial Corporation
NPBC
National Penn Bancshares, Inc.
WTFC
Wintrust Financial Corporation |
 GAAP to Non-GAAP Reconciliation
41
Operating Return on Average Tangible Common Equity
Operating Return on Average Tangible Assets
March 31, 2014
December 31, 2013
March 31, 2013
Operating net income
Net income available to common shareholders
$32,203
$28,439
$28,538
Add: Merger and severance costs, net of tax
4,711
2,599
229
Add: Debt issuance costs, net of tax
-
1,412
-
Less: Net gain on sale of TPS and other securities, net of tax
6,150
-
-
Operating net income available to common shareholders
$30,764
$32,450
$28,767
Operating diluted earnings per share
Diluted earnings per common share
$0.20
$0.18
$0.20
Add: Merger and severance costs, net of tax
0.03
0.02
0.00
Add: Debt issuance costs, net of tax
-
0.01
-
Less: Net gain on sale of TPS and other securities, net of tax
(0.04)
-
-
Operating diluted earnings per common share
$0.19
$0.21
$0.20
Operating return on average tangible common equity
Operating net income avail to common shareholders (annualized)
$124,764
$128,742
$116,668
Amortization of intangibles, net of tax (annualized)
6,018
6,045
5,076
$130,782
$134,787
$121,744
Average shareholders' common equity
$1,722,721
$1,623,543
$1,410,827
Less: Average intangible assets
827,344
804,098
712,466
Average tangible
common equity $895,377
$819,446
$698,361
Operating return on average tangible common equity
14.60%
16.45%
17.43%
Operating return on average tangible assets
Operating net income (annualized)
$134,180
$128,742
$116,668
Amortization of intangibles, net of tax (annualized)
6,018
6,045
5,076
$140,198
$134,787
$121,744
Average total assets
$13,989,304
$13,456,936
$12,004,759
Less: Average intangible assets
827,344
804,098
712,466
Average tangible
assets 13,161,960
$
12,652,838
$
11,292,292
$
Operating return on average tangible assets
1.06%
1.07%
1.08%
For the Quarter Ended |
 GAAP to Non-GAAP Reconciliation
42
Full Year
Non-GAAP Reconciliation
2013
2012
2011
2010
Operating net income
Net income
$117,804
$110,410
$87,047
$74,652
Add: Merger and severance costs, net of tax
5,336
5,203
3,238
402
Add: Litigation settlement accrual, net of tax
-
1,950
-
-
Add: Branch consolidation costs, net of tax
-
1,214
-
-
Add: Debt redemption costs, net of tax
1,412
-
-
-
Less: Gain on extinguishment of debt, net of tax
(1,013)
-
-
-
Less: Gain on sale of building, net of tax
-
(942)
-
-
Less: One-time pension expense credit, next of tax
-
-
-
(6,853)
Operating net income
$123,540
$117,835
$90,285
$68,201
Operating diluted earnings per share
Diluted earnings per share
$0.80
$0.79
$0.70
$0.65
Add: Merger and severance costs, net of tax
0.04
0.04
0.02
0.00
Add: Litigation settlement accrual, net of tax
-
0.01
-
-
Add: Branch consolidation costs, net of tax
-
0.01
-
-
Add: Debt redemption costs, net of tax
0.01
-
-
-
Less: Gain on extinguishment of debt, net of tax
(0.01)
-
-
-
Less: Gain on sale of building, net of tax
-
(0.01)
-
-
Less: One-time pension expense credit, next of tax
-
-
-
(0.05)
Operating diluted earnings per share
$0.84
$0.84
$0.72
$0.60
Operating return on average tangible common equity
Operating net income (annualized)
$123,539
$117,835
$90,285
$68,201
Amortization of intangibles, net of tax (annualized)
5,465
5,801
4,698
4,364
$129,004
$123,635
$94,983
$72,565
Average shareholders' common equity
$1,496,544
$1,376,493
$1,181,941
$1,057,732
Less: Average intangible assets
752,894
717,031
599,851
564,448
Average tangible common equity
$743,651
$659,462
$582,089
$493,284
Operating return on average tangible common equity
17.35%
18.75%
16.32%
14.71%
Operating return on average tangible assets
Operating net income (annualized)
$123,539
$117,835
$90,285
$68,201
Amortization of intangibles, net of tax (annualized)
5,465
5,801
4,698
4,364
$129,004
$123,635
$94,983
$72,565
Average total assets
$12,640,685
$11,782,821
$9,871,164
$8,906,734
Less: Average intangible assets
752,894
717,031
599,851
564,448
Average tangible assets
11,887,792
$
11,065,789
$
9,271,313
$
8,342,286
$
Operating return on average tangible assets
1.09%
1.12%
1.02%
0.87%
Year Ended December 31, |