Attached files
| file | filename |
|---|---|
| EX-32 - EX-32 - WisdomTree Investments, Inc. | d713067dex32.htm |
| EX-31.1 - EX-31.1 - WisdomTree Investments, Inc. | d713067dex311.htm |
| EX-31.2 - EX-31.2 - WisdomTree Investments, Inc. | d713067dex312.htm |
| EXCEL - IDEA: XBRL DOCUMENT - WisdomTree Investments, Inc. | Financial_Report.xls |
Table of Contents
UNITED STATES
SECURITIES AND EXCHANGE COMMISSION
Washington, D.C. 20549
Form 10-Q
(Mark One)
| x | QUARTERLY REPORT PURSUANT TO SECTION 13 OR 15(d) OF THE SECURITIES EXCHANGE ACT OF 1934 |
For the quarterly period ended March 31, 2014
or
| ¨ | TRANSITION REPORT PURSUANT TO SECTION 13 OR 15(d) OF THE SECURITIES EXCHANGE ACT OF 1934 |
For the transition period from to .
Commission File Number 001-10932
WisdomTree Investments, Inc.
(Exact name of registrant as specified in its charter)
| Delaware | 13-3487784 | |
| (State or other jurisdiction of incorporation or organization) |
(IRS Employer Identification No.) | |
| 245 Park Avenue, 35th Floor New York, New York |
10167 | |
| (Address of principal executive officers) | (Zip Code) | |
212-801-2080
(Registrant’s Telephone Number, Including Area Code)
Indicate by check mark whether the registrant (1) has filed all reports required to be filed by Section 13 or 15(d) of the Securities Exchange Act of 1934, as amended (the “Exchange Act”) during the preceding 12 months (or for such shorter period that the registrant was required to file such reports), and (2) has been subject to such filing requirements for the past 90 days. Yes x No ¨
Indicate by check mark whether the registrant has submitted electronically and posted on its corporate Web site, if any, every Interactive Data File required to be submitted and posted pursuant to Rule 405 of Regulation S-T (§232.405 of this chapter) during the preceding 12 months (or for such shorter period that the registrant was required to submit and post such files). x Yes ¨ No
Indicate by check mark whether the registrant is a large accelerated filer, an accelerated filer, a non-accelerated filer or a smaller reporting company. See definitions of “large accelerated filer,” “accelerated filer” and “smaller reporting company” in 12b-2 of the Exchange Act.
| Large accelerated filer | x | Accelerated filer | ¨ | |||
| Non-accelerated filer | ¨ | Smaller reporting company | ¨ | |||
Indicate by check mark whether the registrant is a shell company (as defined in Rule 12b-2 of the Exchange Act). Yes ¨ No x
As of April 30, 2014 there were 133,265,903 shares of the registrant’s Common Stock, $0.01 par value per share, outstanding.
Table of Contents
WISDOMTREE INVESTMENTS, INC.
Form 10-Q
For the Quarterly Period Ended March 31, 2014
| Page Number |
||||
| 4 | ||||
| 4 | ||||
| Item 2. Management’s Discussion and Analysis of Financial Condition and Results of Operations |
15 | |||
| Item 3. Quantitative and Qualitative Disclosures about Market Risk |
25 | |||
| 25 | ||||
| 25 | ||||
| 25 | ||||
| 25 | ||||
| Item 2. Unregistered Sales of Equity Securities and Use of Proceeds |
26 | |||
| 26 | ||||
| 26 | ||||
| Item 5. Other Information |
||||
| 27 | ||||
2
Table of Contents
CAUTIONARY NOTE REGARDING FORWARD-LOOKING STATEMENTS
This Quarterly Report on Form 10-Q contains forward-looking statements that are based on our management’s belief and assumptions and on information currently available to our management. Although we believe that the expectations reflected in these forward-looking statements are reasonable, these statements relate to future events or our future financial performance, and involve known and unknown risks, uncertainties and other factors that may cause our actual results, levels of activity, performance or achievements to be materially different from any future results, levels of activity, performance or achievements expressed or implied by these forward-looking statements.
In some cases, you can identify forward-looking statements by terminology such as “may,” “will,” “should,” “expects,” “intends,” “plans,” “anticipates,” “believes,” “estimates,” “predicts,” “potential,” “continue” or the negative of these terms or other comparable terminology. These statements are only predictions. You should not place undue reliance on forward-looking statements because they involve known and unknown risks, uncertainties and other factors, which are, in some cases, beyond our control and which could materially affect results. Factors that may cause actual results to differ materially from current expectations include, among other things, those listed in the section entitled “Risk Factors” included in our Annual Report on Form 10-K for the fiscal year ended December 31, 2013. If one or more of these risks or uncertainties occur, or if our underlying assumptions prove to be incorrect, actual events or results may vary significantly from those implied or projected by the forward-looking statements. No forward-looking statement is a guarantee of future performance. You should read this Report and the documents that we reference in this Report and have filed with the Securities and Exchange Commission as exhibits to this Report, completely and with the understanding that our actual future results may be materially different from any future results expressed or implied by these forward-looking statements.
In particular, forward-looking statements in this Report include statements about:
| • | anticipated trends, conditions and investor sentiment in the global markets and exchange traded funds (“ETFs”); |
| • | anticipated levels of inflows into and outflows out of our ETFs; |
| • | our ability to deliver favorable rates of return to investors; |
| • | our ability to develop new products and services; |
| • | our ability to maintain current vendors or find new vendors to provide services to us at favorable costs; |
| • | our ability to successfully expand our business into non-U.S. markets; |
| • | timing of payment of our cash income taxes; |
| • | competition in our business; and |
| • | the effect of laws and regulations that apply to our business. |
The forward-looking statements in this Report represent our views as of the date of this Report. We anticipate that subsequent events and developments may cause our views to change. However, while we may elect to update these forward-looking statements at some point in the future, we have no current intention of doing so except to the extent required by applicable law. Therefore, these forward-looking statements do not represent our views as of any date other than the date of this Report.
3
Table of Contents
| ITEM 1. | CONSOLIDATED FINANCIAL STATEMENTS |
WisdomTree Investments, Inc. and Subsidiaries
Consolidated Balance Sheets
(In Thousands, Except Per Share Amounts)
| March 31, 2014 |
December 31, 2013 |
|||||||
| (Unaudited) | ||||||||
| Assets |
||||||||
| Current assets: |
||||||||
| Cash and cash equivalents |
$ | 104,780 | $ | 104,316 | ||||
| Accounts receivable |
17,815 | 18,100 | ||||||
| Other current assets |
1,927 | 1,320 | ||||||
|
|
|
|
|
|||||
| Total current assets |
124,522 | 123,736 | ||||||
| Fixed assets, net |
9,587 | 6,252 | ||||||
| Investments |
11,835 | 11,748 | ||||||
| Deferred tax asset, net |
13,725 | — | ||||||
| Other noncurrent assets |
56 | 55 | ||||||
|
|
|
|
|
|||||
| Total assets |
$ | 159,725 | $ | 141,791 | ||||
|
|
|
|
|
|||||
| Liabilities and stockholders’ equity |
||||||||
| Liabilities: |
||||||||
| Current liabilities: |
||||||||
| Fund management and administration payable |
$ | 11,752 | $ | 10,394 | ||||
| Compensation and benefits payable |
2,805 | 14,278 | ||||||
| Accounts payable and other liabilities |
4,921 | 4,384 | ||||||
|
|
|
|
|
|||||
| Total current liabilities |
19,478 | 29,056 | ||||||
| Noncurrent liabilities |
4,349 | 3,706 | ||||||
|
|
|
|
|
|||||
| Total liabilities |
23,827 | 32,762 | ||||||
|
|
|
|
|
|||||
| Stockholders’ equity: |
||||||||
| Preferred stock, par value $0.01; 2,000 shares authorized |
— | — | ||||||
| Common stock, par value $0.01; 250,000 shares authorized; issued: 133,265 and 132,247; outstanding: 131,525 and 130,350 |
1,332 | 1,322 | ||||||
| Additional paid-in capital |
180,856 | 184,201 | ||||||
| Accumulated deficit |
(46,290 | ) | (76,494 | ) | ||||
|
|
|
|
|
|||||
| Total stockholders’ equity |
135,898 | 109,029 | ||||||
|
|
|
|
|
|||||
| Total liabilities and stockholders’ equity |
$ | 159,725 | $ | 141,791 | ||||
|
|
|
|
|
|||||
The accompanying notes are an integral part of these consolidated financial statements
4
Table of Contents
WisdomTree Investments, Inc. and Subsidiaries
Consolidated Statements of Operations
(In Thousands, Except Per Share Amounts)
(Unaudited)
| Three Months Ended March 31, | ||||||||
| 2014 | 2013 | |||||||
| Revenues |
||||||||
| ETF advisory fees |
$ | 42,609 | $ | 29,153 | ||||
| Other income |
311 | 188 | ||||||
|
|
|
|
|
|||||
| Total revenues |
42,920 | 29,341 | ||||||
| Expenses |
||||||||
| Compensation and benefits |
9,355 | 7,482 | ||||||
| Fund management and administration |
9,168 | 8,223 | ||||||
| Marketing and advertising |
2,578 | 1,937 | ||||||
| Sales and business development |
1,301 | 1,801 | ||||||
| Professional and consulting fees |
1,795 | 613 | ||||||
| Occupancy, communications, and equipment |
900 | 377 | ||||||
| Depreciation and amortization |
192 | 82 | ||||||
| Third-party sharing arrangements |
10 | 111 | ||||||
| Other |
1,142 | 861 | ||||||
|
|
|
|
|
|||||
| Total expenses |
26,441 | 21,487 | ||||||
|
|
|
|
|
|||||
| Income before taxes |
16,479 | 7,854 | ||||||
| Income tax benefit |
(13,725 | ) | — | |||||
|
|
|
|
|
|||||
| Net income |
$ | 30,204 | $ | 7,854 | ||||
|
|
|
|
|
|||||
| Net income per share—basic |
$ | 0.23 | $ | 0.06 | ||||
|
|
|
|
|
|||||
| Net income per share—diluted |
$ | 0.22 | $ | 0.06 | ||||
|
|
|
|
|
|||||
| Weighted-average common shares—basic |
130,934 | 125,436 | ||||||
|
|
|
|
|
|||||
| Weighted-average common shares—diluted |
138,667 | 139,650 | ||||||
|
|
|
|
|
|||||
The accompanying notes are an integral part of these consolidated financial statements
5
Table of Contents
WisdomTree Investments, Inc. and Subsidiaries
Consolidated Statements of Cash Flows
(In Thousands)
(Unaudited)
| Three Months Ended March 31, | ||||||||
| 2014 | 2013 | |||||||
| Cash flows from operating activities: |
||||||||
| Net income |
$ | 30,204 | $ | 7,854 | ||||
| Non-cash items included in net income: |
||||||||
| Income tax benefit |
(13,725 | ) | — | |||||
| Depreciation and amortization and other |
192 | 82 | ||||||
| Stock-based compensation |
2,015 | 1,714 | ||||||
| Deferred rent |
643 | (34 | ) | |||||
| Accretion to interest income and other |
(111 | ) | 39 | |||||
| Changes in operating assets and liabilities: |
||||||||
| Accounts receivable |
285 | (1,750 | ) | |||||
| Other assets |
(491 | ) | (256 | ) | ||||
| Fund management and administration payable |
1,358 | 2,589 | ||||||
| Compensation and benefits payable |
(11,473 | ) | 457 | |||||
| Accounts payable and other liabilities |
537 | (451 | ) | |||||
|
|
|
|
|
|||||
| Net cash provided by operating activities |
9,434 | 10,244 | ||||||
| Cash flows from investing activities: |
||||||||
| Purchase of fixed assets |
(3,527 | ) | (10 | ) | ||||
| Purchase of investments |
(154 | ) | (1,314 | ) | ||||
| Proceeds from the redemption of investments |
61 | 1,633 | ||||||
|
|
|
|
|
|||||
| Net cash (used in)/provided by investing activities |
(3,620 | ) | 309 | |||||
| Cash flows from financing activities: |
||||||||
| Shares repurchased |
(5,426 | ) | (249 | ) | ||||
| Proceeds from exercise of stock options |
76 | 747 | ||||||
|
|
|
|
|
|||||
| Net cash (used in)/provided by financing activities |
(5,350 | ) | 498 | |||||
|
|
|
|
|
|||||
| Net increase in cash and cash equivalents |
464 | 11,051 | ||||||
| Cash and cash equivalents—beginning of period |
104,316 | 41,246 | ||||||
|
|
|
|
|
|||||
| Cash and cash equivalents—end of period |
$ | 104,780 | $ | 52,297 | ||||
|
|
|
|
|
|||||
| Supplemental disclosure of cash flow information: |
||||||||
| Cash paid for taxes |
$ | 14 | $ | 34 | ||||
|
|
|
|
|
|||||
The accompanying notes are an integral part of these consolidated financial statements
6
Table of Contents
WisdomTree Investments, Inc. and Subsidiaries
Notes to Consolidated Financial Statements
(In Thousands, Except Per Share Amounts)
1. Organization and Description of Business
WisdomTree Investments, Inc. (“WisdomTree” or the “Company”) is a New York-based exchange-traded fund (“ETF”) sponsor and asset manager. WisdomTree Asset Management, Inc. (“WTAM”), the Company’s wholly owned operating subsidiary, is an investment adviser registered with the Securities and Exchange Commission (“SEC”) providing investment advisory and other management services to WisdomTree Trust (“WTT”) and WisdomTree ETFs. In exchange for providing these services, the Company receives advisory fee revenues based on a percentage of the ETFs average daily net assets under management (“AUM”). At March 31, 2014, WTAM, formed in February 2005, was the Company’s only subsidiary.
WisdomTree Retirement Services, Inc. (“WTRS”), a former wholly owned subsidiary of WisdomTree, was organized in August 2007 to market with selected third parties the use of WisdomTree ETFs in 401(k) plans. WTRS was dissolved on September 27, 2013.
The WisdomTree ETFs are issued by WTT. WTT, a non-consolidated third party, is a Delaware statutory trust registered with the SEC as an open-end management investment company. WTT offers ETFs across international and domestic equities, fixed income, currency, and alternative asset classes. The Company has licensed the use of certain of its own indexes on an exclusive basis to WTT for the WisdomTree ETFs. The Board of WTT, or the Trustees, is separate from the Board of the Company. The Trustees are primarily responsible for overseeing the management and affairs of the WisdomTree ETFs and WTT for the benefit of the WisdomTree ETF shareholders and has contracted with the Company to provide for general management and administration services of WTT and the WisdomTree ETFs. The Company, in turn, has contracted with third parties to provide the majority of these administration services. In addition, certain officers of the Company provide general management services for WTT.
2. Significant Accounting Policies
Basis of Presentation
These consolidated financial statements have been prepared in conformity with U.S. generally accepted accounting principles (“GAAP”) and in the opinion of management reflect all adjustments, consisting of only normal recurring adjustments, necessary for a fair statement of financial condition, results of operations, and cash flows for the periods presented. The consolidated financial statements include the accounts of the Company’s wholly owned subsidiaries WTAM and WTRS. WTRS was dissolved on September 27, 2013.
All intercompany accounts and transactions have been eliminated in consolidation. Certain accounts in the prior years’ consolidated financial statements have been reclassified to conform to the current year’s consolidated financial statements presentation. These reclassifications had no effect on the previously reported operating results.
Use of Estimates
The preparation of the Company’s consolidated financial statements in conformity with GAAP requires management to make estimates and assumptions that affect the reported amounts of assets and liabilities as of the balance sheet dates and the reported amounts of revenues and expenses for the periods presented. Actual results could differ materially from those estimates.
Revenue Recognition
The Company earns investment advisory fees for ETFs as well as licensing fees from third parties. ETF advisory fees are based on a percentage of the ETFs average daily net assets and recognized over the period the related service is provided. Licensing fees are based on a percentage of the average monthly net assets and recognized over the period the related service is provided.
7
Table of Contents
Depreciation and Amortization
Depreciation is provided for using the straight-line method over the estimated useful lives of the related assets as follows:
| Equipment |
5 years | |||
| Furniture and fixtures |
15 years |
Leasehold improvements are amortized over the term of their respective leases or service lives of the improvements, whichever is shorter. Fixed assets are stated at cost less accumulated depreciation and amortization.
Marketing and Advertising
Advertising costs, including media advertising and production costs are expensed when incurred.
Cash and Cash Equivalents
The Company considers all highly liquid investments with an original maturity of 90 days or less at the time of purchase to be classified as cash equivalents. Cash and cash equivalents are held with one large financial institution. At December 31, 2013, the Company held in its cash balance British pounds equivalent to $8,057 USD which was subject to changes in the exchange rate. In January 2014, additional cash balances of British pounds equivalent to $8,000 USD were held. In February 2014 all British pounds were converted to USD. The Company recorded a realized gain of $116 to other income on the Company’s Consolidated Statement of Operations for the three months ended March 31, 2014 related to this conversion.
Accounts Receivable and Allowance for Doubtful Accounts
Accounts receivable are customer and other obligations due under normal trade terms. An allowance for doubtful accounts is not provided since, in the opinion of management, all accounts receivable recorded are deemed collectible.
Impairment of Long-Lived Assets
On a periodic basis, the Company performs a review for the impairment of long-lived assets when events or changes in circumstances indicate that the estimated undiscounted future cash flows expected to be generated by the assets are less than their carrying amounts or when other events occur which may indicate that the carrying amount of an asset may not be recoverable.
Earnings per Share
Basic earnings per share is computed by dividing net income available to common stockholders by the weighted-average number of common shares outstanding for the period. Diluted earnings per share reflects the reduction in earnings per share assuming options or other contracts to issue common stock were exercised or converted into common stock. Options to purchase shares of common stock and restricted shares were included in the calculation of diluted earnings per share in the quarters ended March 31, 2014 and 2013.
Investments
The Company accounts for all of its investments as held-to-maturity, which are recorded at amortized cost. For held-to-maturity investments, the Company has the intent and ability to hold investments to maturity and it is not more-likely-than-not that the Company will be required to sell the investments before recovery of their amortized cost bases, which may be maturity.
On a periodic basis, the Company reviews its portfolio of investments for impairment. If a decline in fair value is deemed to be other-than-temporary, the security is written down to its fair value through earnings.
8
Table of Contents
Subsequent Events
The Company has evaluated subsequent events after the date of the consolidated financial statements to consider whether or not the impact of such events needed to be reflected or disclosed in the consolidated financial statements. Such evaluation was performed through the issuance date of the consolidated financial statements.
Stock-Based Awards
Accounting for stock-based compensation requires the measurement and recognition of compensation expense for all equity awards based on estimated fair values. The Company accounts for stock-based compensation for its employees based on the cost of employee services received in exchange for a stock-based award. Stock-based compensation is measured based on the grant-date fair value of the award and are amortized over the relevant service period.
Stock-based awards granted to non-employees for goods or services are valued at the fair value of the equity instruments issued or the fair value of consideration received, whichever is a more reliable measure of the fair value of the transaction, and recognized when performance obligations are complete.
Income Taxes
The Company accounts for income taxes using the liability method, which requires the determination of deferred tax assets and liabilities based on the differences between the financial and tax basis of assets and liabilities using the enacted tax rates in effect for the year in which differences are expected to reverse. Deferred tax assets are adjusted by a valuation allowance if, based on the weight of available evidence, it is more-likely-than-not that some portion or all of the deferred tax assets will not be realized.
In order to recognize and measure any unrecognized tax benefits, management evaluates and determines whether any of its tax positions are more-likely-than-not to be sustained upon examination, including resolution of any related appeals or litigation processes, based on the technical merits of the position. Once it is determined that a position meets this recognition threshold, the position is measured to determine the amount of benefit to be recognized in the consolidated financial statements.
The Company records interest expense and penalties related to tax expenses as income tax expense.
Related Party Transactions
The Company’s revenues are derived primarily from investment advisory agreements with WTT and WisdomTree ETFs. During the term of these agreements, the Company has granted WTT an exclusive license to certain of its indexes for operation of the WisdomTree ETFs. The Trustees are primarily responsible for overseeing the management and affairs of the WisdomTree ETFs and WTT for the benefit of the WisdomTree ETF shareholders and WTT has contracted with the Company to provide for general management and administration of WTT and the WisdomTree ETFs. The Company is also responsible for certain expenses of WTT, including the cost of transfer agency, custody, fund administration and accounting, legal, audit, and other non-distribution services, excluding extraordinary expenses, taxes and certain other expenses. In exchange, the Company receives fees based on a percentage of the ETF average daily net assets. The advisory agreements may be terminated by WTT upon notice. Certain officers of the Company also provide general management oversight of WTT; however, these officers have no material decision making responsibilities and primarily implement the decisions of the Trustees. At March 31, 2014 and December 31, 2013, the balance of accounts receivable from WTT was approximately $14,526 and $14,791, respectively, which are included as a component of accounts receivable on the Company’s Consolidated Balance Sheet. Revenue from advisory services provided to WTT for the three months ended March 31, 2014 and 2013 was approximately $42,609 and $29,153, respectively.
Third Party Sharing Arrangements
Third party sharing arrangements expense consists of payments for marketing agreements with third parties.
In 2010, the Company entered into agreements with certain firms to serve as the external marketing agents for the WisdomTree ETFs. Under these agreements, the Company will pay a percentage of their advisory fee revenue, subject to caps, to the marketing agents based on applicable AUM. The Company incurred marketing fees of $10 and $111 for the three months ended March 31, 2014 and 2013, respectively.
9
Table of Contents
Segment, Geographic and Customer Information
The Company operates as one business segment, as an ETF sponsor and asset manager providing investment advisory services. Revenues are derived in the U.S. and all of the Company’s assets are located in the U.S.
3. Investments and Fair Value Measurements
The following table is a summary of the Company’s held-to-maturity investments:
| March 31, 2014 | December 31, 2013 | |||||||
| Federal agency debt instruments |
$ | 11,835 | $ | 11,748 | ||||
|
|
|
|
|
|||||
The following table summarizes unrealized gains, losses, and fair value of held-to-maturity investments:
| March 31, 2014 | December 31, 2013 | |||||||
| Cost/amortized cost |
$ | 11,835 | $ | 11,748 | ||||
| Gross unrealized gains |
69 | 20 | ||||||
| Gross unrealized losses |
(1,140 | ) | (1,459 | ) | ||||
|
|
|
|
|
|||||
| Fair value |
$ | 10,764 | $ | 10,309 | ||||
|
|
|
|
|
|||||
The following table sets forth the maturity profile of held-to-maturity investments; however, these investments may be called prior to their stated maturity date:
| March 31, 2014 | December 31, 2013 | |||||||
| Due within one year |
$ | — | $ | — | ||||
| Due one year through five years |
— | — | ||||||
| Due five years through ten years |
679 | 686 | ||||||
| Due over ten years |
11,156 | 11,062 | ||||||
|
|
|
|
|
|||||
| Total |
$ | 11,835 | $ | 11,748 | ||||
|
|
|
|
|
|||||
Fair Value Measurement
Under the accounting for fair value measurements and disclosures, fair value is defined as the price that would be received to sell an asset or paid to transfer a liability, or the exit price, in an orderly transaction between market participants at the measurement date. The accounting guidance establishes a hierarchy of valuation techniques based on whether the inputs to those valuation techniques are observable or unobservable. Observable inputs reflect market data obtained from independent sources, while unobservable inputs reflect the Company’s market assumptions.
These three types of inputs create the following fair value hierarchy:
Level 1—Quoted prices for identical instruments in active markets.
Level 2—Quoted prices for similar instruments in active markets; quoted prices for identical or similar instruments in markets that are not active; and model-derived valuations whose inputs are observable or whose significant value drivers are observable.
Level 3—Instruments whose significant value drivers are unobservable.
This hierarchy requires the use of observable market data when available. The Company’s held-to-maturity securities are categorized as Level 1. The Company does not intend to sell its investments held-to-maturity before the recovery of their amortized cost bases which may be at maturity. Some of our financial instruments are not measured at fair value on a recurring basis but are recorded at amounts that approximate fair value due to their liquid or short-term nature. Such financial assets and financial liabilities are categorized as Level 3.
10
Table of Contents
4. Fixed Assets
In 2014, the Company purchased $3,527 of fixed assets in addition to approximately $6,000 purchased in 2013 for its new office space. The Company started to depreciate these assets in January of 2014 when its new office space was ready for use.
The following table summarizes fixed assets:
| March 31, 2014 | December 31, 2013 | |||||||
| Equipment |
$ | 653 | $ | 518 | ||||
| Furniture and fixtures |
1,579 | 1,005 | ||||||
| Leasehold improvements |
7,698 | 4,880 | ||||||
| Less accumulated depreciation and amortization |
(343 | ) | (151 | ) | ||||
|
|
|
|
|
|||||
| Total |
$ | 9,587 | $ | 6,252 | ||||
|
|
|
|
|
|||||
5. Commitments and Contingencies
Contractual Obligations
The Company has entered into obligations under operating leases with initial non-cancelable terms in excess of one year for office space, telephone, and data services. Expenses recorded under these agreements for the three months ended March 31, 2014 and 2013 were approximately $826, and $362, respectively.
Future minimum lease payments with respect to non-cancelable operating leases at March 31, 2014 are approximately as follows:
| Remainder of 2014 |
$ | 2,326 | ||
| 2015 |
2,963 | |||
| 2016 |
2,783 | |||
| 2017 and thereafter |
35,126 | |||
|
|
|
|||
| Total |
$ | 43,198 | ||
|
|
|
The Company’s prior office lease expired in January 2014. In August 2013, the Company entered into a new 16 year lease agreement. Pursuant to the new lease agreement, the Company received lease incentives which include a deferred rent period and a leasehold improvement allowance equal to $3,223. The Company recorded a receivable of $3,223 due from the lessor of its new office space related to its leasehold improvement allowance, which is included in accounts receivable on the Company’s Consolidated Balance Sheet at March 31, 2014 and at December 31, 2013.
Letter of Credit
In August 2013, the Company collateralized its office lease for new space at 245 Park Avenue, New York, NY through an additional standby letter of credit of $1,384 held as an investment in debt securities, which is included in investments on the Company’s Consolidated Balance Sheet at March 31, 2014 and at December 31, 2013. The Company had collateralized its office lease at 380 Madison Avenue, New York, NY through a standby letter of credit of $419 as of December 31, 2013. This lease terminated in January 2014 and this letter of credit expired at termination.
Contingencies
The Company is subject to various routine regulatory reviews and inspections by the SEC as well as legal proceedings arising in the ordinary course of business. The Company is not currently party to any litigation or other legal proceedings that are expected to have a material impact on our business, financial position or results of operations.
11
Table of Contents
6. Stock-Based Awards
The Company grants equity awards to employees and directors and has in the past granted such awards to special advisors for services:
| • | Options are issued generally for terms of ten years and vest between two to four years. Options are issued with an exercise price equal to the fair value of the Company on the date of grant. The Company estimated the fair value for options using the Black-Scholes Option Pricing Model. |
| • | All restricted stock and option awards require future service as a condition of vesting with certain awards subject to acceleration under certain conditions. Awards generally vest over one to four years. |
| • | Stock awards granted to advisors vested over the contractual period of the consulting arrangement. The fair value of these awards was measured at the grant dated fair value and re-measured at each reporting period. Fair value was initially determined as the closing price of the Company’s common stock on the date of grant. |
A summary of options and restricted stock activity is as follows:
| Options | Weighted Average Exercise Price of Options |
Restricted Stock Awards |
||||||||||
| Balance at January 1, 2014 |
7,844,691 | $ | 1.29 | 1,896,877 | ||||||||
| Granted |
— | $ | — | 545,093 | ||||||||
| Exercised/vested |
(786,000 | ) | $ | 0.10 | (701,429 | ) | ||||||
| Forfeitures |
— | $ | — | (119 | ) | |||||||
|
|
|
|
|
|
|
|||||||
| Balance at March 31, 2014 |
7,058,691 | $ | 1.42 | 1,740,422 | ||||||||
|
|
|
|
|
|
|
|||||||
Stock-based compensation expense for the three months ended March 31, 2014 and 2013 was approximately $2,015 and, $1,714, respectively.
7. Employee Benefit Plans
The Company has a 401(k) savings plan covering all eligible employees in which the Company can make discretionary contributions from its profits. For the three months ended March 31, 2014 and 2013 the Company made discretionary contributions in the amount of $285 and $162, respectively.
8. Earnings Per Share
| Three Months Ended March 31, | ||||||||
| 2014 | 2013 | |||||||
| Net income |
$ | 30,204 | $ | 7,854 | ||||
|
|
|
|
|
|||||
| Shares of common stock and common stock equivalents: |
||||||||
| Weighted averages shares used in basic computation |
130,934 | 125,436 | ||||||
| Dilutive effect of stock options and unvested restricted stock |
7,733 | 14,214 | ||||||
|
|
|
|
|
|||||
| Weighted averages shares used in dilutive computation |
138,667 | 139,650 | ||||||
|
|
|
|
|
|||||
| Basic earnings per share |
$ | 0.23 | $ | 0.06 | ||||
| Dilutive earnings per share |
$ | 0.22 | $ | 0.06 | ||||
12
Table of Contents
Diluted earnings per share reflects the reduction in earnings per share assuming options or other contracts to issue common stock were exercised or converted into common stock under the treasury stock method. The dilutive effect of options to purchase shares of common stock and restricted shares were included in the diluted earnings per share in the quarters ended March 31, 2014 and 2013, respectively. 545 restricted shares determined to be anti-dilutive were not included in the calculation of diluted earnings per share.
9. Income Taxes
Net operating losses
The Company generated net operating losses (“NOLs”) during the three months ended March 31, 2014 and prior periods. The following table provides a summary of the NOL activity for the three months ended March 31, 2014:
| Beginning NOL |
$ | (140,959 | ) | |
| U.S. GAAP pretax income |
16,479 | |||
| Income tax differences: |
||||
| Temporary |
(2,603 | ) | ||
| Permanent |
(18,804 | ) | ||
|
|
|
|||
| Ending NOL |
$ | (145,887 | ) | |
|
|
|
Deferred tax asset
At March 31, 2014 and December 31, 2013, $130,460 and $111,635 of the NOLs were generated from stock-based compensation amounts recognized for tax purposes at the time options are exercised (at the intrinsic value) or restricted stock is vested (at fair value of the share price) in excess of amounts previously expensed at the date of grant for U.S. GAAP purposes. Since these amounts cannot be recognized as a deferred tax asset under U.S. GAAP, accordingly, a deferred tax asset related to this amount is not recorded. In addition, $3,487 of the NOLs are deemed worthless.
During the three months ended March 31, 2014, management determined that although realization is not assured, it believes that it is more likely than not the remaining gross deferred tax asset of $30,211 will be realized. Therefore, it released the valuation allowance previously recorded resulting in a tax benefit of $13,725 on the Company’s Consolidated Statement of Operations and net deferred tax asset on the Company’s Consolidated Balance Sheet.
A summary of the components of the deferred tax asset and tax affected benefit recorded is as follows:
| NOLs available for deferred tax asset |
$ | 11,940 | ||
| Stock-based compensation |
13,437 | |||
| Deferred rent liability |
4,726 | |||
| Other |
108 | |||
|
|
|
|||
| Gross deferred tax asset |
30,211 | |||
| Income tax rate |
45.43 | % | ||
|
|
|
|||
| Tax affected |
$ | 13,725 | ||
|
|
|
10. Shares Repurchased
During the three months ended March 31, 2014 and 2013, the Company repurchased 312 and 29 shares of its common stock for an aggregate cost of $5,426 and $249, respectively. The shares repurchased related to the vesting of restricted common stock granted to employees.
13
Table of Contents
11. Subsequent Events
In January 2014, the Company announced its plans to expand into Europe through a majority investment in U.K.-based exchange traded product (“ETP”) provider Boost ETP LLP (“Boost”). The Company expects to invest $20 million in working capital to fund the build-out of a local European fund platform and operations to be led by Boost’s management team. Through this platform the Company intends to launch a select range of Undertakings for Collective Investments in Transferable Securities (“UCITS”) ETFs under the WisdomTree brand and continue to manage and grow the Boost portfolio of short and leveraged fully collateralized ETPs under the Boost brand.
Under the terms of the Company’s agreement with Boost, the Company will own 75% of the new WisdomTree Europe entity and the existing Boost shareholders will own 25%. The Company will acquire the remaining 25% ownership from existing Boost shareholders at the end of four years. The payout formula will be based on European AUM at the end of the four year period and will be tied to WisdomTree’s enterprise value over global AUM at the time of payout, and affected by profitability of the European business.
On April 17, 2014, the Company completed the acquisition of Boost and invested the $20 million of working capital. Hector McNeil and Nik Bienkowski, founders of Boost will serve as Co-CEOs of WisdomTree Europe.
14
Table of Contents
| ITEM 2. | MANAGEMENT’S DISCUSSION AND ANALYSIS OF FINANCIAL CONDITION AND RESULTS OF OPERATIONS |
The following discussion and analysis of our financial condition and results of operations should be read together with our consolidated financial statements and the related notes and the other financial information included elsewhere in this Report. In addition to historical consolidated financial information, the following discussion contains forward-looking statements that reflect our plans, estimates and beliefs. Our actual results could differ materially from those discussed in the forward-looking statements. Factors that could cause or contribute to these differences include those discussed below. For a more complete description of the risks noted above and other risks that could cause our actual results to materially differ from our current expectations, please see Item 1A. “Risk Factors” of our Annual Report on Form 10-K for the fiscal year ended December 31, 2013. We assume no obligation to update or revise publicly any forward-looking statements, whether as a result of new information, future events or otherwise, unless required by law.
Executive Summary
We were the fifth largest sponsor of ETFs in the United States based on assets under management (“AUM”), with AUM of $33.9 billion as of March 31, 2014. An ETF is an investment fund that holds securities such as equities or bonds and/or other assets such as derivatives or commodities and that generally trades at approximately the same price as the net asset value of its underlying components over the course of the trading day. ETFs offer exposure to a wide variety of investment themes, including domestic, international and global equities, fixed income securities, currencies or commodities, as well as securities in specific industries and countries or alternative strategies. At March 31, 2014 we offered a comprehensive family of 62 ETFs, which includes 42 equity ETFs, 12 fixed income ETFs, six currency ETFs and two alternative strategy ETFs.
Through our operating subsidiary, we provide investment advisory and other management services to the WisdomTree ETFs. In exchange for providing these services, we receive advisory fee revenues based on a percentage of the ETFs’ average daily net AUM. Our expenses are predominantly related to selling, operating and marketing our ETFs. We have contracted with third parties to provide certain operational services for the ETFs.
We distribute our ETFs through all major channels within the asset management industry, including brokerage firms, registered investment advisers, institutional investors, private wealth managers and discount brokers. Our primary sales efforts are not directed towards the retail segment but rather are directed towards financial or investment advisers that act as intermediaries between the end-client and us.
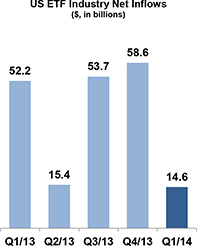
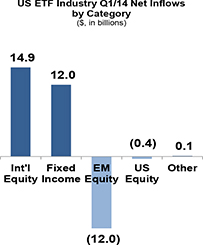
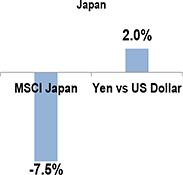
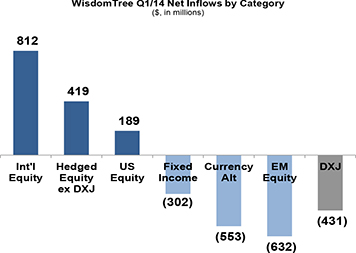
Market Environment
We continue to operate in an increasingly challenging and competitive operating environment. The following charts reflect the U.S. ETF industry flows, the U.S. ETF Industry flows for the first quarter of 2014 by category and equity market and currency returns for Japan:
|
|
|
15
Table of Contents
As the charts above reflect, industry flows significantly declined during the first quarter of 2014. Investors favored international equity ETFs, in particular European themed products, along with U.S. fixed income ETFs. Investors expressed negative sentiment towards emerging market themed products. In addition, Japan equities declined and the Yen strengthened against the U.S. dollar.
Our Results
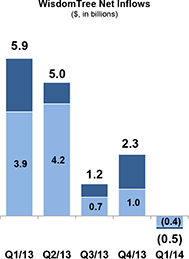
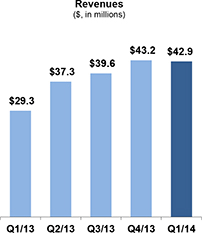
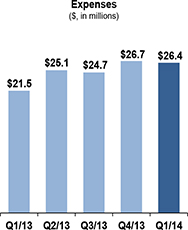
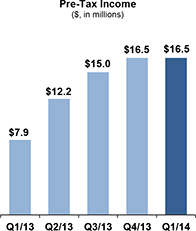
As the charts below reflect, our results followed a similar trend as the industry:
|
|
For the three months ended March 31, 2014, we experienced $0.5 billion of net outflows primarily due to $1.5 billion of outflows in our emerging markets themed ETFs offset by $1.4 billion of net inflows in our European themed ETFs.
Our AUM declined by 2.9% to $33.9 billion at March 31, 2014 compared to $34.9 million at December 31, 2013, primarily due to $0.5 billion of net outflows and $0.5 billion of negative market movement.
Despite the challenging operating environment, we achieved solid financial results. We recorded revenues of $42.9 million in the first quarter of 2014, up 46.3% from the first quarter of last year primarily due to higher average AUM. Our expenses increased 23.1% compared to the first quarter of last year due to higher compensation costs and fund related expenses. Included in the first quarter of 2014 were $1.3 million of expenses related to our acquisition of UK based ETP sponsor Boost and a non-recurring fee of $0.5 million to transition our fund accounting and administration services. Our pre-tax income reached $16.5 million in the first quarter of 2014 as compared to $7.9 million in the comparable period last year. In addition, we recorded an income tax benefit of $13.7 million related to the reversal of the valuation allowance against our deferred tax assets resulting in net income of $30.2 million for the first quarter of 2014.
16
Table of Contents
|
| |
|
||
Acquisition of Boost
On April 17, 2014, in a move that expands our footprint to Europe, we completed our acquisition of UK based ETP provider Boost and renamed it WisdomTree Europe. We will commence build-out of a local European platform to offer a select range of UCITS ETFs under the WisdomTree brand and continue to manage and grow the Boost lineup of short and leveraged fully collateralized ETPs under the Boost brand.
Under the terms of our agreement, we own 75% of WisdomTree Europe and existing Boost shareholders own 25%. We will acquire the remaining 25% ownership from the Boost shareholders at the end of four years. The payout formula is based on European AUM at the end of the four year period and is tied to our enterprise value over global AUM at the time of measurement, and affected by profitability of the European business. The payout will be in cash over two years. Beginning in the second quarter of 2014 and each quarter thereafter for the next four years, we will incur a charge to reflect this buyout. We invested $20 million of working capital into WisdomTree Europe.
Income Taxes
In the first quarter of 2014, we recorded a non-recurring income tax benefit of $13.7 million to recognize our deferred tax asset, which previously had been reserved with a 100% valuation allowance. We expect to record income taxes beginning in the second quarter at a rate of 45%; however, we do not expect to pay cash income taxes in 2014 and for some time thereafter due to our NOLs attributable to excess stock option and restricted stock deductions. Such amounts will be applied to reduce taxes payable with a corresponding increase to equity.
17
Table of Contents
Non-GAAP Financial Measurements
Gross margin is a non-GAAP financial measurement which we believe provides useful and meaningful information as it is a financial measurement management reviews when evaluating the Company’s operating results. We define gross margin as total revenues less fund management and administration expenses and third-party sharing arrangements. We believe this financial measurement provides investors with a consistent way to analyze the amount we retain after paying third party service providers to operate our ETFs and third party marketing agents whose fees are associated with our AUM level. The following table reflects the calculation of our gross margin and gross margin percentage:
| Three Months Ended March 31, | ||||||||
| (in thousands) | 2014 | 2013 | ||||||
| GAAP total revenue |
$ | 42,920 | $ | 29,341 | ||||
| Fund management and administration |
(9,168 | ) | (8,223 | ) | ||||
| Third party sharing arrangements |
(10 | ) | (111 | ) | ||||
|
|
|
|
|
|||||
| Gross margin |
$ | 33,742 | $ | 21,007 | ||||
|
|
|
|
|
|||||
| Gross margin percentage |
78.6 | % | 71.6 | % | ||||
|
|
|
|
|
|||||
18
Table of Contents
Key Operating Statistics
The following table presents key operating statistics that serve as indicators for the performance of our business:
| Three Months Ended March 31, |
||||||||
| 2014 | 2013 | |||||||
| Total ETFs (in millions) |
||||||||
| Beginning of period assets |
34,884 | 18,286 | ||||||
| Inflows/(outflows) |
-498 | 5,893 | ||||||
| Market appreciation/(depreciation) |
-502 | 924 | ||||||
| End of period assets |
33,884 | 25,103 | ||||||
| Average assets during the period |
33,859 | 21,934 | ||||||
| Revenue Days |
90 | 90 | ||||||
| ETF Industry and Market Share (in billions) |
||||||||
| ETF industry net inflows |
14.6 | 52.2 | ||||||
| WisdomTree market share of industry inflows |
— | 11.30 | % | |||||
| International Hedged Equity ETFs (in millions) |
||||||||
| Beginning of period assets |
13,348 | 1,258 | ||||||
| Inflows/(outflows) |
-12 | 4,071 | ||||||
| Market appreciation/(depreciation) |
-724 | 468 | ||||||
| End of period assets |
12,612 | 5,797 | ||||||
| Average assets during the period |
13,052 | 3,432 | ||||||
| US Equity ETFs (in millions) |
||||||||
| Beginning of period assets |
7,181 | 4,371 | ||||||
| Inflows/(outflows) |
189 | 291 | ||||||
| Market appreciation/(depreciation) |
135 | 499 | ||||||
| End of period assets |
7,505 | 5,161 | ||||||
| Average assets during the period |
7,176 | 4,749 | ||||||
| Emerging Markets Equity ETFs (in millions) |
||||||||
| Beginning of period assets |
7,448 | 7,332 | ||||||
| Inflows/(outflows) |
-632 | 876 | ||||||
| Market appreciation/(depreciation) |
-63 | -137 | ||||||
| End of period assets |
6,753 | 8,071 | ||||||
| Average assets during the period |
6,775 | 7,905 | ||||||
| International Developed Equity ETFs (in millions) |
||||||||
| Beginning of period assets |
3,864 | 2,474 | ||||||
| Inflows/(outflows) |
812 | 139 | ||||||
| Market appreciation/(depreciation) |
154 | 115 | ||||||
| End of period assets |
4,830 | 2,728 | ||||||
| Average assets during the period |
4,347 | 2,640 | ||||||
19
Table of Contents
| Three Months Ended March 31, |
||||||||
| 2014 | 2013 | |||||||
| Fixed Income ETFs (in millions) |
||||||||
| Beginning of period assets |
1,906 | 2,118 | ||||||
| Inflows/(outflows) |
-302 | 508 | ||||||
| Market appreciation/(depreciation) |
6 | -26 | ||||||
| End of period assets |
1,610 | 2,600 | ||||||
| Average assets during the period |
1,747 | 2,453 | ||||||
| Currency ETFs (in millions) |
||||||||
| Beginning of period assets |
979 | 611 | ||||||
| Inflows/(outflows) |
-549 | 12 | ||||||
| Market appreciation/(depreciation) |
-8 | 3 | ||||||
| End of period assets |
422 | 626 | ||||||
| Average assets during the period |
611 | 637 | ||||||
| Alternative Strategy ETFs (in millions) |
||||||||
| Beginning of period assets |
158 | 122 | ||||||
| Inflows/(outflows) |
-4 | -4 | ||||||
| Market appreciation/(depreciation) |
-2 | 2 | ||||||
| End of period assets |
152 | 120 | ||||||
| Average assets during the period |
151 | 118 | ||||||
| Average ETF assets during the period |
||||||||
| International hedged equity ETFs |
39 | % | 15 | % | ||||
| US equity ETFs |
21 | % | 22 | % | ||||
| Emerging markets equity ETFs |
20 | % | 36 | % | ||||
| International developed equity ETFs |
13 | % | 12 | % | ||||
| Fixed income ETFs |
5 | % | 11 | % | ||||
| Currency ETFs |
2 | % | 3 | % | ||||
| Alternative strategy ETFs |
0 | % | 1 | % | ||||
| Total |
100 | % | 100 | % | ||||
| Average ETF advisory fee during the period |
||||||||
| Alternative strategy ETFs |
0.94 | % | 0.94 | % | ||||
| Emerging markets equity ETFs |
0.66 | % | 0.67 | % | ||||
| International developed equity ETFs |
0.56 | % | 0.56 | % | ||||
| Fixed income ETFs |
0.55 | % | 0.55 | % | ||||
| International hedged equity ETFs |
0.49 | % | 0.49 | % | ||||
| Currency ETFs |
0.49 | % | 0.51 | % | ||||
| US equity ETFs |
0.35 | % | 0.35 | % | ||||
| Blended total |
0.51 | % | 0.54 | % | ||||
| Number of ETFs—end of the period |
||||||||
| International developed equity ETFs |
16 | 16 | ||||||
| US equity ETFs |
13 | 11 | ||||||
| Fixed income ETFs |
12 | 6 | ||||||
| Emerging markets equity ETFs |
7 | 5 | ||||||
| International hedged equity ETFs |
6 | 2 | ||||||
| Currency ETFs |
6 | 5 | ||||||
| Alternative strategy ETFs |
2 | 2 | ||||||
| Total |
62 | 47 | ||||||
| Headcount |
90 | 72 | ||||||
Note: Previously issued statistics may be restated due to trade adjustments
Source: Investment Company Institute, Bloomberg, WisdomTree
20
Table of Contents
Three Months Ended March 31, 2014 Compared to March 31, 2013
Revenues
ETF advisory fees
| Three Months Ended March 31, |
Change | Percent Change |
||||||||||||||
| 2014 | 2013 | |||||||||||||||
| Average assets under management (in millions) |
$ | 33,859 | $ | 21,934 | $ | 11,925 | 54.4 | % | ||||||||
| Average ETF advisory fee |
0.51 | % | 0.54 | % | (0.03 | ) | ||||||||||
| ETF advisory fees (in thousands) |
$ | 42,609 | $ | 29,153 | $ | 13,456 | 46.2 | % | ||||||||
| Other income (in thousands) |
311 | 188 | 123 | 65.4 | % | |||||||||||
|
|
|
|
|
|
|
|||||||||||
| Total revenues (in thousands) |
$ | 42,920 | $ | 29,341 | $ | 13,579 | 46.3 | % | ||||||||
|
|
|
|
|
|
|
|||||||||||
ETF advisory fees revenue increased 46.2% from $29.2 million in the three months ended March 31, 2013 to $42.6 million in the comparable period in 2014. This increase was primarily due to higher average AUM. Our average fee declined to 0.51% from 0.54% over the same period due to the change in mix of our AUM.
Other income
Other income increased 65.4% from $0.2 million in the three months ended March 31, 2013 to $0.3 million in the comparable period in 2014. This was due to an increase in the value of pounds sterling we held in connection with our acquisition of UK based ETP Sponsor Boost.
Expenses
| Three Months Ended March 31, |
Change | Percent Change |
||||||||||||||
| (in thousands) |
2014 | 2013 | ||||||||||||||
| Compensation and benefits |
$ | 9,355 | $ | 7,482 | $ | 1,873 | 25.0 | % | ||||||||
| Fund management and administration |
9,168 | 8,223 | 945 | 11.5 | % | |||||||||||
| Marketing and advertising |
2,578 | 1,937 | 641 | 33.1 | % | |||||||||||
| Sales and business development |
1,301 | 1,801 | (500 | ) | (27.8 | %) | ||||||||||
| Professional and consulting fees |
1,795 | 613 | 1,182 | 192.8 | % | |||||||||||
| Occupancy, communication and equipment |
900 | 377 | 523 | 138.7 | % | |||||||||||
| Depreciation and amortization |
192 | 82 | 110 | 134.1 | % | |||||||||||
| Third-party sharing arrangements |
10 | 111 | (101 | ) | (91.0 | %) | ||||||||||
| Other |
1,142 | 861 | 281 | 32.6 | % | |||||||||||
|
|
|
|
|
|
|
|
|
|||||||||
| Total expenses |
$ | 26,441 | $ | 21,487 | $ | 4,954 | 23.1 | % | ||||||||
|
|
|
|
|
|
|
|
|
|||||||||
21
Table of Contents
| Three Months Ended March 31, |
||||||||
| As a Percent of Revenues: |
2014 | 2013 | ||||||
| Compensation and benefits |
21.8 | % | 25.5 | % | ||||
| Fund management and administration |
21.4 | % | 28.0 | % | ||||
| Marketing and advertising |
6.0 | % | 6.6 | % | ||||
| Sales and business development |
3.0 | % | 6.1 | % | ||||
| Professional and consulting fees |
4.2 | % | 2.1 | % | ||||
| Occupancy, communication and equipment |
2.1 | % | 1.3 | % | ||||
| Depreciation and amortization |
0.4 | % | 0.3 | % | ||||
| Third-party sharing arrangements |
0.0 | % | 0.4 | % | ||||
| Other |
2.7 | % | 2.9 | % | ||||
|
|
|
|
|
|||||
| Total expenses |
61.6 | % | 73.2 | % | ||||
Compensation and benefits
Compensation and benefits expense increased 25.0% from $7.5 million in the three months ended March 31, 2013 to $9.4 million in the comparable period in 2014. This increase was primarily due to higher headcount related expenses to support our growth; payroll taxes due to bonus payments for 2013 compensation; and higher stock based compensation due to the recognition of expense for equity awards granted to our employees as part of 2013 year-end compensation. Our headcount at the end of the first quarter of 2013 was 72 compared to 90 at the end of the first quarter of 2014.
Fund management and administration
Fund management and administration expense increased 11.5% from $8.2 million in the three months ended March 31, 2013 to $9.2 million in the comparable period in 2014. Higher average AUM resulted in a $0.6 million increase in variable fees charged by our third party service providers associated with AUM. In addition, we incurred a non-recurring charge of $0.5 million for transitioning our fund accounting and administration services. We had 47 ETFs at March 31, 2013 compared to 62 at March 31, 2014.
Marketing and advertising
Marketing and advertising expense increased 33.1% from $1.9 million in the three months ended March 31, 2013 to $2.6 million in the comparable period in 2014 primarily due to higher levels of online, print and television advertising.
Sales and business development
Sales and business development expense decreased 27.8% from $1.8 million in the three months ended March 31, 2013 to $1.3 million in the comparable period in 2014 primarily due to a decrease in discretionary sales related activities as well as new product development costs.
Professional and consulting fees
Professional and consulting fees increased by $1.2 million from $0.6 million in the three months ended March 31, 2013 to $1.8 million in the comparable period in 2014. We incurred $0.8 million in costs related to our acquisition of UK based ETP sponsor Boost. In addition, corporate legal fees as well as technology consulting expenses associated with our office relocation increased.
Occupancy, communications and equipment
Occupancy, communications and equipment expense increased $0.5 million from $0.4 million in the three months ended March 31, 2013 to $0.9 million in the comparable period in 2014. This increase was primarily due to costs for new office space we began occupying in 2014.
Depreciation and amortization
Depreciation and amortization expense increased by $0.08 million from $0.1 million in the three months ended March 31, 2013 to $0.2 million in the comparable period in 2014 primarily due to amortization of leasehold improvements for our new office facility.
22
Table of Contents
Third-party sharing arrangements
Third-party sharing arrangements decreased 91.0% from $0.1 million in the three months ended March 31, 2013 to $0.01 million in the comparable period in 2014 primarily due to lower fees for our marketing agent in Latin America due to our inflow levels.
Other
Other expenses increased 32.6% from $0.9 million in the three months ended March 31, 2013 to $1.1 million in the comparable period in 2014 primarily due to higher general and administrative expenses.
Liquidity and Capital Resources
The following table summarizes key data regarding our liquidity, capital resources and use of capital to fund our operations:
| March 31, 2014 | December 31, 2013 | |||||||
| Balance Sheet Data (in thousands): |
||||||||
| Cash and cash equivalents |
$ | 104,780 | $ | 104,316 | ||||
| Investments |
11,835 | 11,748 | ||||||
| Accounts receivable |
17,815 | 18,100 | ||||||
| Total liabilities |
(23,827 | ) | (32,762 | ) | ||||
|
|
|
|
|
|||||
| $ | 110,603 | $ | 101,402 | |||||
|
|
|
|
|
|||||
| Three Months Ended March 31, |
||||||||
| 2014 | 2013 | |||||||
| Cash Flow Data (in thousands): |
||||||||
| Operating cash flows |
$ | 9,434 | $ | 10,244 | ||||
| Investing cash flows |
(3,620 | ) | 309 | |||||
| Financing cash flows |
(5,350 | ) | 498 | |||||
|
|
|
|
|
|||||
| Increase in cash and cash equivalents |
$ | 464 | $ | 11,051 | ||||
|
|
|
|
|
|||||
Liquidity
We consider our available liquidity to be our liquid assets less our liabilities. Liquid assets consist of cash and cash equivalents, current receivables and investments. We account for investments as held to maturity securities and have the intention and ability to hold to maturity. However, if needed, such investments could be redeemed for liquidity. Cash and cash equivalents include cash on hand and non-interest-bearing and interest-bearing deposits with financial institutions. Accounts receivable primarily represents advisory fees we earn from the WisdomTree ETFs which is collected by the fifth business day of the month following the month earned. Investments represent debt instruments of U.S. government and agency securities. Our liabilities consist primarily of payments owed to vendors and third parties in the normal course of business as well as accrued year end incentive compensation for employees.
Cash and cash equivalents increased by $0.5 million in the first three months of 2014 to $104.8 million at March 31, 2014 primarily due to $9.4 million of cash flow from operations due to our business results, partly offset by $5.4 million used to repurchase our common stock due to employees vesting in restricted stock awards and $3.5 million used to purchase leasehold improvements for our new office space.
Cash and cash equivalents increased by $11.1 million in the first three months of 2013 to $52.3 million at March 31, 2013 primarily due to $10.2 million of cash flow from operations due to our strong business results, $1.6 million of cash received from the redemption of investments, partly offset by $1.3 million used to purchase new investments.
23
Table of Contents
Capital Resources
Currently, our principal source of financing is our operating cash flows, though historically, our principal source of financing was through the private placement of our common stock. We believe that current cash flows generated by our operating activities should be sufficient for us to fund our operations for at least the next 12 months.
Use of Capital
Our business does not require us to maintain a significant cash position. We expect that our main uses of cash will be to fund the ongoing operations of our business, invest in strategic growth initiatives, re-acquire shares of our common stock issued to our employees as incentive compensation as discussed below or expand our business through strategic acquisitions. If our cash position continues to increase, we will explore other uses of cash, including adopting additional return of capital programs such as open market stock repurchases or paying cash dividends.
During the first three months of 2014, we repurchased 312,006 shares from our employees at then current market prices at a cost of $5.4 million in connection with tax withholding upon vesting of restricted stock. The amount repurchased represented the required amount of tax withholding. We expect to continue purchasing shares for similar reasons.
Contractual Obligations
The following table summarizes our future cash payments associated with contractual obligations as of March 31, 2014.
| Payments Due by Period | ||||||||||||||||||||
| (in thousands) | ||||||||||||||||||||
| Total | Less than 1 year |
1 to 3 years | 3 to 5 years | More than 5 years |
||||||||||||||||
| Operating leases |
$ | 43,198 | $ | 2,326 | $ | 5,746 | $ | 8,319 | $ | 26,807 | ||||||||||
Off-Balance Sheet Arrangements
Other than operating leases, which are included in the table above, we do not have any off-balance sheet financing or other arrangements. We have neither created nor are party to any special-purpose or off-balance sheet entities for the purpose of raising capital, incurring debt or operating our business.
Critical Accounting Policies
Stock-Based Compensation
Stock-based compensation expense reflects the fair value of stock-based awards measured at grant date and is recognized over the relevant service period. The fair value of each option award is estimated on the date of grant using the Black-Scholes option valuation model. The Black-Scholes option valuation model we use includes the input of certain variables that are dependent on future expectations, including the expected lives of our options from grant date to exercise date, the volatility of our underlying common shares in the market over that time period, the rate of dividends that we may pay during that time and an appropriate risk-free interest rate. Many of these assumptions require management’s judgment. If actual experience differs significantly from these estimates, stock-based compensation expense and our results of operations could be materially affected.
Income and Deferred Taxes
We recognize an asset or liability for the deferred tax consequences of temporary differences between the tax basis of assets and liabilities and their reported amounts in the financial statements. These temporary differences will result in taxable or deductible amounts in future years when the reported amounts of assets are recovered or liabilities are settled. A valuation allowance is recorded to reduce the carrying values of deferred tax assets and liabilities to the amount that is more likely than not to be realized.
24
Table of Contents
Revenue Recognition
The Company earns investment advisory fees for ETFs and separately managed accounts as well as licensing fees from third parties. ETF advisory fees are based on a percentage of the ETFs average daily net assets and recognized over the period the related service is provided. Fees for separately managed accounts and licensing are based on a percentage of the average monthly net assets and recognized over the period the related service is provided.
Recently Issued Accounting Pronouncements
None.
| ITEM 3. | QUANTITATIVE AND QUALITATIVE DISCLOSURES ABOUT MARKET RISK |
In the normal course of business, our financial results are subject to market risk. Market risk to us generally represents the risk of changes in the value of financial instruments held in the portfolios of the WisdomTree ETFs that generally results from fluctuations in equity prices, foreign currency exchange rates against the U.S. dollar, and interest rates. Nearly all of our revenue is derived from advisory agreements for the WisdomTree ETFs. Under these agreements, the advisory fee we receive is based on the market value of the assets in the WisdomTree ETF portfolios we manage.
Fluctuations in the value of these securities are common and are generated by numerous factors such as market volatility, the overall economy, inflation, changes in investor strategies, availability of alternative investment vehicles, government regulations and others. Accordingly changes in any one or a combination of these factors may reduce the value of investment securities and, in turn, the underlying assets under management on which our revenues are earned. These declines may cause investors to withdraw funds from our ETFs in favor of investments that they perceive as offering greater opportunity or lower risk, thereby compounding the impact on our revenues. We believe challenging and volatile market conditions will continue to be present in the foreseeable future.
In order to maximize yields, we invest our corporate cash in short-term interest earning assets, primarily money market instruments at a commercial bank and U.S. government and agency debt instruments which totaled $11.8 million and $11.7 million as of March 31, 2014 and December 31, 2013, respectively. We do not anticipate that changes in interest rates will have a material impact on our financial condition, operating results or cash flows.
| ITEM 4. | CONTROLS AND PROCEDURES |
Evaluation of Disclosure Controls and Procedures
As of March 31, 2014, our management, with the participation of our Chief Executive Officer and our Chief Financial Officer, evaluated the effectiveness of our disclosure controls and procedures pursuant to Rule 13a-15(b) promulgated under the Securities Exchange Act of 1934, as amended, or the “Exchange Act.” Based upon that evaluation, our Chief Executive Officer and our Chief Financial Officer concluded that, as of March 31, 2014, our disclosure controls and procedures were effective at a reasonable assurance level in ensuring that material information required to be disclosed by us in the reports that we file or submit under the Exchange Act is recorded, processed, summarized and reported within the time periods specified in the rules, regulations and forms of the Securities and Exchange Commission, or the SEC, including ensuring that such material information is accumulated by and communicated to our management, including our Chief Executive Officer and our Chief Financial Officer, as appropriate to allow timely decisions regarding required disclosure.
Changes in Internal Control over Financial Reporting
During the quarter ended March 31, 2014, there were no changes in our internal control over financial reporting that have materially affected, or are reasonably likely to materially affect, our internal control over financial reporting.
| ITEM 1. | LEGAL PROCEEDINGS |
None.
| ITEM 1A. | RISK FACTORS |
You should carefully consider the information set forth in this report, as well the information set forth in Part 1, Item 1A. “Risk Factors” in our Annual Report on Form 10-K for the fiscal year ended December 31, 2013.
25
Table of Contents
| ITEM 2. | UNREGISTERED SALES OF EQUITY SECURITIES AND USE OF PROCEEDS |
Recent sales of Unregistered Securities
None.
Use of Proceeds
Not applicable.
Purchase of Equity Securities by the Issuer and Affiliated Purchasers
The following table provides information with respect to purchases made by or on behalf of the Company or any “affiliated purchaser” of shares of the Company’s common stock.
| Period |
Total Number of Shares Purchased(1) |
Average Price Paid Per Share(1) |
Total Number of Shares Purchased as Part of Publicly Announced Plans or Programs |
Approximate Dollar Value of Shares that May Yet Be Purchased Under the Plans or Programs |
||||||||||||
| January 1, 2014 to January 31, 2014 |
312,006 | $ | 17.39 | — | $ | — | ||||||||||
| February 1, 2014 to February 28, 2014 |
— | $ | — | — | $ | — | ||||||||||
| March 1, 2014 to March 31, 2014 |
— | $ | — | — | $ | — | ||||||||||
|
|
|
|
|
|||||||||||||
| Total |
312,006 | $ | 17.39 | — | $ | — | ||||||||||
|
|
|
|
|
|||||||||||||
| (1) | The identified shares reflect restricted shares withheld pursuant to the terms of awards granted to employees to offset tax withholding obligations that occur upon vesting and release of the restricted share. The value of the shares withheld is based upon the volume weighted average price of the common stock on the date of vesting. During the three months ended March 31, 2014, the Company repurchased 312,006 restricted shares of Company stock withheld pursuant to the terms of awards granted to employees to offset tax withholding obligations for an aggregate price of $5,425,693 with an average price per share of $17.39. |
| ITEM 3. | DEFAULTS UPON SENIOR SECURITIES |
None.
| ITEM 4. | MINE SAFETY DISCLOSURES |
Not applicable.
26
Table of Contents
| ITEM 6. | EXHIBITS |
| Exhibit |
Description |
Reference Exhibit No. |
||||||
| 3.1 | (1) | Form of Amended and Restated Certificate of Incorporation. | 3.1 | |||||
| 3.2 | (1) | Amended and Restated Bylaws. | 3.2 | |||||
| 4.1 | (1) | Specimen Common Stock Certificate. | 4.1 | |||||
| 4.2 | (1) | Amended and Restated Stockholders Agreement among Registrant and certain investors dated December 21, 2006. | 4.2 | |||||
| 4.3 | (1) | Securities Purchase Agreement among Registrant and certain investors dated December 21, 2006. | 4.3 | |||||
| 4.4 | (1) | Securities Purchase Agreement among Registrant and certain investors dated October 15, 2009. | 4.4 | |||||
| 4.5 | (1) | Third Amended and Restated Registration Rights Agreement dated October 15, 2009. | 4.5 | |||||
| 31.1 | (2) | Certification of Chief Executive Officer and Principal Executive Officer pursuant to Rules 13a-14 of the Exchange Act. | ||||||
| 31.2 | (2) | Certification of Chief Financial Officer and Principal Accounting Officer pursuant to Rules 13a-14 of the Exchange Act. | ||||||
| 32 | (2) | Section 1350 Certification. | ||||||
| 101.INS | (2)* | XBRL Instance Document | ||||||
| 101.SCH | (2)* | XBRL Taxonomy Extension Schema Document | ||||||
| 101.CAL | (2)* | XBRL Taxonomy Extension Calculation Linkbase Document | ||||||
| 101.DEF | (2)* | XBRL Taxonomy Extension Definition Linkbase Document | ||||||
| 101.LAB | (2)* | XBRL Taxonomy Extension Labels Linkbase Document | ||||||
| 101.PRE | (2)* | XBRL Taxonomy Extension Presentation Linkbase Document | ||||||
| (1) | Incorporated by reference from the Registrant’s Registration Statement on Form 10, filed with the SEC on March 31, 2011. |
| (2) | Filed herewith |
| * | Pursuant to Rule 406T, the interactive data files in Exhibit 101 hereto are deemed not filed or a part of a registration statement or prospectus for purposes of Section 11 or 12 of the Securities Act of 1933, as amended, are deemed not filed for purposes of Section 18 of the Securities Exchange Act of 1934, as amended, and otherwise is not subject to liability under these sections and shall not be incorporated by reference into any registration statement or other document filed under the Securities Act of 1933, as amended, except as expressly set forth by specific reference in such filing. |
27
Table of Contents
SIGNATURE
Pursuant to the requirements of the Securities Exchange Act of 1934, the registrant has duly caused this Report to be signed on its behalf by the undersigned thereunto duly authorized on this 12th day of May, 2014.
| WISDOMTREE INVESTMENTS, INC. | ||
| By: | /s/ Jonathan Steinberg | |
| Jonathan Steinberg | ||
| Chief Executive Officer and President | ||
| (Authorized Officer and Principal Executive Officer) | ||
| WISDOMTREE INVESTMENTS, INC. | ||
| By: | /s/ Amit Muni | |
| Amit Muni | ||
| Executive Vice President—Finance and Chief Financial Officer (Authorized Officer and Principal Financial and Accounting Officer) | ||
28