Attached files
| file | filename |
|---|---|
| EX-31.1 - EXHIBIT 31.1 - OFS Capital Corp | v377307_ex31-1.htm |
| EX-32.1 - EXHIBIT 32.1 - OFS Capital Corp | v377307_ex32-1.htm |
| EX-32.2 - EXHIBIT 32.2 - OFS Capital Corp | v377307_ex32-2.htm |
| EX-31.2 - EXHIBIT 31.2 - OFS Capital Corp | v377307_ex31-2.htm |
UNITED STATES
SECURITIES AND EXCHANGE COMMISSION
WASHINGTON, D.C. 20549
FORM 10-Q
(Mark One)
| x | QUARTERLY REPORT PURSUANT TO SECTION 13 OR 15(d) OF THE SECURITIES EXCHANGE ACT OF 1934 |
For the quarterly period ended March 31, 2014
| ¨ | TRANSITION REPORT PURSUANT TO SECTION 13 OR 15(d) OF THE SECURITIES EXCHANGE ACT OF 1934 |
COMMISSION FILE NUMBER: 814-00813
OFS CAPITAL CORPORATION
(Exact name of registrant as specified in its charter)
| Delaware | 46-1339639 |
|
(State or other jurisdiction of incorporation or organization) |
(I.R.S. Employer Identification No.) |
10 S. Wacker Drive, Suite 2500
Chicago, Illinois 60606
(Address of principal executive office)
(847) 734-2060
(Registrant’s telephone number, including area code)
Indicate by check mark whether the registrant (1) has filed all reports required to be filed by Section 13 or 15(d) of the Securities Exchange Act of 1934 during the preceding 12 months (or for such shorter period that the registrant was required to file such reports), and (2) has been subject to such filing requirements for the past 90 days. Yes x No ¨
Indicate by check mark whether the registrant has submitted electronically and posted on its corporate Web site, if any, every Interactive Data File required to be submitted and posted pursuant to Rule 405 of Regulation S-T (§232.405 of this chapter) during the preceding 12 months (or for such shorter period that the registrant was required to submit and post such files). Yes ¨ No ¨
Indicate by check mark whether the registrant is a large accelerated filer, an accelerated filer, a non-accelerated filer, or a smaller reporting company. See definitions of “large accelerated filer,” “accelerated filer” and “smaller reporting company” in Rule 12b-2 of the Exchange Act.
| Large accelerated filer | ¨ | Accelerated filer | x |
| Non-accelerated filer | ¨ (do not check if a smaller reporting company) | Smaller reporting company | ¨ |
Indicate by check mark whether the registrant is a shell company (as defined in Rule 12b-2 of the Exchange Act). Yes ¨ No x
The number of shares of the issuer’s Common Stock, $0.01 par value, outstanding as of May 7, 2014 was 9,632,453.
OFS CAPITAL CORPORATION
TABLE OF CONTENTS
OFS Capital Corporation and Subsidiaries
Consolidated Balance Sheets
(Dollar amounts in thousands, except per share data)
| March 31, | December 31, | |||||||
| 2014 | 2013 | |||||||
| (unaudited) | ||||||||
| Assets | ||||||||
| Investments, at fair value | ||||||||
| Non-control/non-affiliate investments (cost of $191,188 and $201,209, respectively) | $ | 188,242 | $ | 197,338 | ||||
| Affiliate investments (cost of $32,677 and $32,618, respectively) | 33,314 | 32,735 | ||||||
| Control investment (cost of $8,990 and $9,596, respectively) | 6,446 | 7,846 | ||||||
| Total investments at fair value | 228,002 | 237,919 | ||||||
| Cash and cash equivalents | 36,999 | 28,569 | ||||||
| Restricted cash and cash equivalents | 450 | 450 | ||||||
| Interest receivable | 582 | 644 | ||||||
| Receivable from investment sold | - | 4,493 | ||||||
| Prepaid expenses and other assets | 166 | 174 | ||||||
| Intangible asset, net of accumulated amortization of $63 and $0, respectively | 2,437 | 2,500 | ||||||
| Goodwill | 1,077 | 1,077 | ||||||
| Due from affiliated entity | 1 | 218 | ||||||
| Deferred financing closing costs, net of accumulated amortization of $2,001 and $1,851, respectively | 2,893 | 3,043 | ||||||
| Total assets | $ | 272,607 | $ | 279,087 | ||||
| Liabilities | ||||||||
| Accrued professional fees | $ | 576 | $ | 613 | ||||
| Interest payable | 855 | 1,044 | ||||||
| Management fees payable | 1,347 | 1,168 | ||||||
| Administration fee payable | 475 | 280 | ||||||
| Other payables | 203 | 260 | ||||||
| Deferred loan fee revenue | 503 | 389 | ||||||
| SBA debentures payable | 26,000 | 26,000 | ||||||
| Revolving line of credit | 103,459 | 108,955 | ||||||
| Total liabilities | 133,418 | 138,709 | ||||||
| Net Assets | ||||||||
| Preferred stock, par value of $0.01 per share, 2,000,000 shares authorized, 0 shares issued and outstanding as of March 31, 2014 and December 31, 2013 | - | - | ||||||
| Common stock, par value of $0.01 per share, 100,000,000 shares authorized, 9,632,453 and 9,629,797 shares issued and outstanding as of March 31, 2014 and December 31, 2013, respectively | 96 | 96 | ||||||
| Paid-in capital in excess of par | 143,160 | 143,126 | ||||||
| Distributions in excess of net investment income | (5,977 | ) | (4,103 | ) | ||||
| Accumulated net realized gain | 2,742 | 2,742 | ||||||
| Net unrealized depreciation on investments | (832 | ) | (1,483 | ) | ||||
| Total net assets | 139,189 | 140,378 | ||||||
| Total liabilities and net assets | $ | 272,607 | $ | 279,087 | ||||
| Number of shares outstanding | 9,632,453 | 9,629,797 | ||||||
| Net asset value per share | $ | 14.45 | $ | 14.58 | ||||
See Notes to Unaudited Consolidated Financial Statements.
| 1 |
OFS Capital Corporation and Subsidiaries
Consolidated Statements of Operations (unaudited)
(Dollar amounts in thousands, except per share data)
| Three Months Ended March 31, | ||||||||
| 2014 | 2013 | |||||||
| Investment income | ||||||||
| Interest income | ||||||||
| Non-control/non-affiliate investments | $ | 3,786 | $ | 4,365 | ||||
| Affiliate investments | 827 | - | ||||||
| Control investment | 302 | - | ||||||
| Total interest income | 4,915 | 4,365 | ||||||
| Dividend and fee income | ||||||||
| Non-control/non-affiliate investments | 8 | - | ||||||
| Affiliate investments | 64 | - | ||||||
| Control investment | 25 | - | ||||||
| Total dividend and fee income | 97 | - | ||||||
| Total investment income | 5,012 | 4,365 | ||||||
| Expenses | ||||||||
| Interest expense | 991 | 847 | ||||||
| Amortization and write-off of deferred financing closing costs | 150 | 469 | ||||||
| Amortization of intangible asset | 63 | - | ||||||
| Management fees | 1,264 | 807 | ||||||
| Professional fees | 454 | 250 | ||||||
| Administrative fee | 475 | 280 | ||||||
| General and administrative expenses | 215 | 270 | ||||||
| Total expenses | 3,612 | 2,923 | ||||||
| Net investment income | 1,400 | 1,442 | ||||||
| Net realized and unrealized gain (loss) on investments | ||||||||
| Net realized gain on non-control/non-affiliate investments | - | 5 | ||||||
| Net change in unrealized depreciation on non-control/non-affiliate investments | 926 | 1,173 | ||||||
| Net change in unrealized appreciation/depreciation on affiliate investments | 519 | 251 | ||||||
| Net change in unrealized depreciation on control investment | (794 | ) | - | |||||
| Net realized and unrealized gain on investments | 651 | 1,429 | ||||||
| Net increase in net assets resulting from operations | $ | 2,051 | $ | 2,871 | ||||
| Net investment income per common share - basic and diluted | $ | 0.15 | $ | 0.15 | ||||
| Net increase in net assets resulting from operations per common share - basic and diluted | $ | 0.21 | $ | 0.30 | ||||
| Dividends and distributions declared per common share - basic and diluted | $ | 0.34 | $ | 0.34 | ||||
| Basic and diluted weighted average shares outstanding | 9,631,155 | 9,601,952 | ||||||
See Notes to Unaudited Consolidated Financial Statements.
| 2 |
OFS Capital Corporation and Subsidiaries
Consolidated Statements of Changes in Net Assets (unaudited)
(Dollar amounts in thousands, except per share data)
| Distributions | Net | |||||||||||||||||||||||||||
| Paid-in | in Excess of | Unrealized | ||||||||||||||||||||||||||
| Capital in | Net | Accumulated | Depreciation | |||||||||||||||||||||||||
| Common Stock | Excess | Investment | Net Realized | on | Total Net | |||||||||||||||||||||||
| Shares | Par | of Par | Income | Gain | Investments | Assets | ||||||||||||||||||||||
| Balance at January 1, 2013 | 9,578,691 | $ | 96 | $ | 142,408 | $ | (94 | ) | $ | - | $ | (611 | ) | $ | 141,799 | |||||||||||||
| Net increase in net assets resulting from operations | - | - | - | 1,442 | 5 | 1,424 | 2,871 | |||||||||||||||||||||
| Stock issued in connection with dividend reinvestment plan | 34,891 | - | 501 | - | - | - | 501 | |||||||||||||||||||||
| Dividends and distributions | - | - | - | (3,264 | ) | (5 | ) | - | (3,269 | ) | ||||||||||||||||||
| Balance at March 31, 2013 | 9,613,582 | $ | 96 | $ | 142,909 | $ | (1,916 | ) | $ | - | $ | 813 | $ | 141,902 | ||||||||||||||
| Balance at January 1, 2014 | 9,629,797 | $ | 96 | $ | 143,126 | $ | (4,103 | ) | $ | 2,742 | $ | (1,483 | ) | $ | 140,378 | |||||||||||||
| Net increase in net assets resulting from operations | - | - | - | 1,400 | - | 651 | 2,051 | |||||||||||||||||||||
| Stock issued in connection with dividend reinvestment plan | 2,656 | - | 34 | - | - | - | 34 | |||||||||||||||||||||
| Dividends and distributions | - | - | - | (3,274 | ) | - | - | (3,274 | ) | |||||||||||||||||||
| Balance at March 31, 2014 | 9,632,453 | $ | 96 | $ | 143,160 | $ | (5,977 | ) | $ | 2,742 | $ | (832 | ) | $ | 139,189 | |||||||||||||
See Notes to Unaudited Consolidated Financial Statements.
| 3 |
OFS Capital Corporation and Subsidiaries
Consolidated Statements of Cash Flows (unaudited)
(Dollar amounts in thousands)
| Three Months Ended March 31, | ||||||||
| 2014 | 2013 | |||||||
| Cash Flows From Operating Activities | ||||||||
| Net increase in net assets resulting from operations | $ | 2,051 | $ | 2,871 | ||||
| Adjustments to reconcile net increase in net assets resulting from operations to net cash provided by operating activities: | ||||||||
| Amortization and write-off of deferred financing closing costs | 150 | 469 | ||||||
| Amortization of discounts and premiums | (304 | ) | (329 | ) | ||||
| Amortization of deferred fee revenue | (37 | ) | (38 | ) | ||||
| Amortization of intangible asset | 63 | - | ||||||
| Cash collection of deferred loan fee revenue | 151 | 77 | ||||||
| Payment-in-kind interest income | (126 | ) | - | |||||
| Net realized gain on non-control/non-affiliate investments | - | (5 | ) | |||||
| Net change in unrealized depreciation on non-control/non-affiliate investments | (926 | ) | (1,173 | ) | ||||
| Net change in unrealized appreciation/depreciation on affiliate investments | (519 | ) | (251 | ) | ||||
| Net change in unrealized depreciation on control investment | 794 | - | ||||||
| Purchase of portfolio investments | (8,901 | ) | (7,507 | ) | ||||
| Additional equity investment in SBIC I LP | - | (2,618 | ) | |||||
| Proceeds from principal payments on portfolio investments | 19,899 | 10,596 | ||||||
| Proceeds from sale of portfolio investments | 4,493 | 4,713 | ||||||
| Changes in operating assets and liabilities: | ||||||||
| Interest receivable | 62 | 397 | ||||||
| Prepaid expenses and other assets | 8 | 63 | ||||||
| Accrued professional fees | (37 | ) | (110 | ) | ||||
| Due to/from affiliated entities, net | 217 | (9 | ) | |||||
| Interest payable | (189 | ) | (400 | ) | ||||
| Management fees payable | 179 | 203 | ||||||
| Administration fee payable | 195 | 170 | ||||||
| Other payables | (43 | ) | (61 | ) | ||||
| Net cash provided by operating activities | 17,180 | 7,058 | ||||||
| Cash Flows From Financing Activities | ||||||||
| Net repayments of advances from affiliated entities | (14 | ) | - | |||||
| Cash dividends and distributions paid | (3,240 | ) | (1,127 | ) | ||||
| Net repayments under revolving lines of credit | (5,496 | ) | (2,033 | ) | ||||
| Net cash used in financing activities | (8,750 | ) | (3,160 | ) | ||||
| Net increase increase in cash and cash equivalents | 8,430 | 3,898 | ||||||
| Cash and cash equivalents — beginning of period | 28,569 | 8,270 | ||||||
| Cash and cash equivalents — end of period | $ | 36,999 | $ | 12,168 | ||||
| Supplemental Disclosure of Cash Flow Information: | ||||||||
| Cash paid during the period for interest | $ | 1,180 | $ | 1,247 | ||||
| Supplemental Disclosure of Noncash Financing and Investing Activities: | ||||||||
| Dividends and distributions paid by issuance of common stock | $ | 34 | $ | 501 | ||||
| Dividends and distributions payable | - | 3,269 | ||||||
See Notes to Unaudited Consolidated Financial Statements.
| 4 |
OFS Capital Corporation and Subsidiaries
Consolidated Schedule of Investments (unaudited)
March 31, 2014
(Dollar amounts in thousands)
| Spread | Percent | |||||||||||||||||||||||||
| Industry | Interest | Above | Principal | of Net | ||||||||||||||||||||||
| Name of Portfolio Company | Investment Type | Rate (1) | Index (1) | Maturity | Amount | Cost | Fair Value | Assets | ||||||||||||||||||
| Non-control/Non-affiliate Investments | ||||||||||||||||||||||||||
| Aerospace & Defense | ||||||||||||||||||||||||||
| Aero-Metric, Inc. | Senior Secured Term Loan | 6.75 | % | (L +5.50%) | 8/27/17 | $ | 2,696 | $ | 2,668 | $ | 2,690 | 1.9 | % | |||||||||||||
| Whitcraft LLC | Senior Secured Term Loan | 6.75 | % | (L +5.25%) | 12/16/15 | 4,097 | 4,070 | 3,867 | 2.8 | |||||||||||||||||
| 6,793 | 6,738 | 6,557 | 4.7 | |||||||||||||||||||||||
| Automotive | ||||||||||||||||||||||||||
| Tectum Holdings Inc | Senior Secured Term Loan A | 5.25 | % | (L +4.25%) | 9/12/18 | 3,014 | 3,006 | 3,006 | 2.2 | |||||||||||||||||
| Trico Products Corporation | Senior Secured Term Loan | 6.25 | % | (L +4.75%) | 7/22/16 | 4,138 | 4,108 | 4,103 | 2.9 | |||||||||||||||||
| 7,152 | 7,114 | 7,109 | 5.1 | |||||||||||||||||||||||
| Banking, Finance, Insurance & Real Estate | ||||||||||||||||||||||||||
| AssuredPartners Capital, Inc. | Senior Secured Term Loan A | 6.75 | % | (L +4.50%) | 12/14/18 | 4,828 | 4,828 | 4,828 | 3.5 | |||||||||||||||||
| Captive Resources Midco LLC | Senior Secured Term Loan | 6.50 | % | (L +5.00%) | 1/2/19 | 4,925 | 4,868 | 4,812 | 3.5 | |||||||||||||||||
| CSI Financial Services, LLC (6) | Senior Secured Term Loan | 7.00 | % | (L +5.75%) | 12/12/18 | 3,334 | 3,291 | 3,334 | 2.4 | |||||||||||||||||
| MCMC LLC | Senior Secured Term Loan A | 7.50 | % | (L +6.00%) | 9/30/16 | 3,783 | 3,754 | 3,784 | 2.7 | |||||||||||||||||
| MYI Acquiror Limited (6) | Senior Secured Term Loan A | 6.25 | % | (L +4.75%) | 9/13/16 | 4,899 | 4,861 | 4,848 | 3.5 | |||||||||||||||||
| Personable Holdings, Inc. | Senior Secured Term Loan | 6.25 | % | (L +5.00%) | 5/16/18 | 2,850 | 2,828 | 2,850 | 2.0 | |||||||||||||||||
| Townsend Acquisition LLC | Senior Secured Term Loan | 6.25 | % | (L +4.75%) | 5/18/16 | 4,352 | 4,299 | 4,321 | 3.1 | |||||||||||||||||
| 28,971 | 28,729 | 28,777 | 20.7 | |||||||||||||||||||||||
| Capital Equipment | ||||||||||||||||||||||||||
| Dorner MFG, Corp. | Senior Secured Term Loan | 6.00 | % | (L +4.75%) | 6/15/17 | 3,187 | 3,146 | 3,107 | 2.2 | |||||||||||||||||
| Elgin Fasteners Group | Senior Secured Term Loan | 6.00 | % | (L +4.75%) | 8/26/16 | 4,812 | 4,742 | 4,744 | 3.4 | |||||||||||||||||
| 7,999 | 7,888 | 7,851 | 5.6 | |||||||||||||||||||||||
| Chemicals, Plastics & Rubber | ||||||||||||||||||||||||||
| Actagro, LLC | Senior Secured Term Loan | 5.55 | % | (L +4.25%) | 12/30/16 | 3,380 | 3,352 | 3,285 | 2.4 | |||||||||||||||||
| Dash Materials LLC | Senior Secured Term Loan | 8.75 | % | (L +7.50%) | 12/26/17 | 4,747 | 4,729 | 4,748 | 3.4 | |||||||||||||||||
| ICM Products Inc | Senior Secured Term Loan | 5.50 | % | (L +4.50%) | 3/31/19 | 2,149 | 2,121 | 2,149 | 1.5 | |||||||||||||||||
| Inhance Technologies Holdings LLC | Senior Secured Term Loan A | 5.50 | % | (L +4.50%) | 2/7/18 | 2,542 | 2,522 | 2,522 | 1.8 | |||||||||||||||||
| KODA Distribution Group, Inc. | Senior Secured Term Loan A | 6.00 | % | (L +5.00%) | 4/9/18 | 3,911 | 3,895 | 3,903 | 2.8 | |||||||||||||||||
| VanDeMark Chemical Inc. | Senior Secured Term Loan | 6.50 | % | (L +5.25%) | 11/30/17 | 2,826 | 2,784 | 2,797 | 2.0 | |||||||||||||||||
| 19,555 | 19,403 | 19,404 | 13.9 | |||||||||||||||||||||||
| Construction & Building | ||||||||||||||||||||||||||
| Jameson LLC | Senior Secured Term Loan | 7.50 | % | (L +5.50%) | 10/1/15 | 1,799 | 1,788 | 1,799 | 1.3 | |||||||||||||||||
| 1,799 | 1,788 | 1,799 | 1.3 | |||||||||||||||||||||||
| Consumer goods: Non-durable | ||||||||||||||||||||||||||
| Pacific World | Senior Secured Term Loan | 5.75 | % | (L +4.75%) | 10/31/16 | 4,670 | 4,626 | 4,575 | 3.3 | |||||||||||||||||
| Phoenix Brands LLC | Senior Secured Term Loan A | 9.30 | % | (L +7.75%) | 1/31/16 | 3,031 | 3,011 | 2,899 | 2.1 | |||||||||||||||||
| 7,701 | 7,637 | 7,474 | 5.4 | |||||||||||||||||||||||
| Containers, Packaging & Glass | ||||||||||||||||||||||||||
| Mold-Rite Plastics, LLC | Senior Secured Term Loan | 5.50 | % | (L +4.25%) | 6/30/16 | 4,204 | 4,174 | 4,174 | 3.0 | |||||||||||||||||
| 4,204 | 4,174 | 4,174 | 3.0 | |||||||||||||||||||||||
| Energy: Oil & Gas | ||||||||||||||||||||||||||
| ANS Distributing, INC. | Senior Secured Term Loan | 8.00 | % | (L +6.50%) | 11/1/17 | 2,927 | 2,885 | 2,927 | 2.1 | |||||||||||||||||
| Charter Brokerage LLC | Senior Secured Term Loan A | 8.00 | % | (L +6.50%) | 10/10/16 | 4,212 | 4,175 | 4,212 | 3.0 | |||||||||||||||||
| 7,139 | 7,060 | 7,139 | 5.1 | |||||||||||||||||||||||
| Environmental Industries | ||||||||||||||||||||||||||
| Apex Companies, LLC. | Senior Secured Term Loan | 5.50 | % | (L +4.50%) | 3/28/19 | 3,859 | 3,832 | 3,832 | 2.8 | |||||||||||||||||
| JWC Environmental, LLC. | Senior Secured Term Loan | 6.00 | % | (L +4.50%) | 8/3/16 | 3,999 | 3,979 | 3,939 | 2.8 | |||||||||||||||||
| 7,858 | 7,811 | 7,771 | 5.6 | |||||||||||||||||||||||
| 5 |
OFS Capital Corporation and Subsidiaries
Consolidated Schedule of Investments - Continued
March 31, 2014
(Dollar amounts in thousands)
| Spread | Percent | |||||||||||||||||||||||||
| Industry | Interest | Above | Principal | of Net | ||||||||||||||||||||||
| Name of Portfolio Company | Investment Type | Rate (1) | Index (1) | Maturity | Amount | Cost | Fair Value | Assets | ||||||||||||||||||
| Non-control/Non-affiliate Investments - Continued | ||||||||||||||||||||||||||
| Healthcare & Pharmaceuticals | ||||||||||||||||||||||||||
| Accelerated Health Systems LLC | Senior Secured Term Loan | 5.75 | % | (L +4.50%) | 7/22/17 | 4,875 | 4,847 | 4,793 | 3.4 | |||||||||||||||||
| Behavioral Health Group | Senior Secured Term Loan A | 5.75 | % | (L +4.50%) | 8/18/16 | 4,587 | 4,564 | 4,496 | 3.2 | |||||||||||||||||
| Elements Behavioral Health, Inc. | Senior Secured Term Loan A | 5.25 | % | (L +4.25%) | 2/12/19 | 4,754 | 4,706 | 4,707 | 3.4 | |||||||||||||||||
| HealthFusion, Inc. (5) | Senior Secured Loan | 13.00 | % | N/A | 10/7/18 | 5,750 | 5,672 | 5,810 | 4.2 | |||||||||||||||||
| Common Stock Warrants (1,910,302 shares) | - | 352 | 0.2 | |||||||||||||||||||||||
| 5,750 | 5,672 | 6,162 | 4.4 | |||||||||||||||||||||||
| Hygenic Corporation | Senior Secured Term Loan | 6.00 | % | (L +4.75%) | 10/11/18 | 4,719 | 4,666 | 4,666 | 3.4 | |||||||||||||||||
| Vention Medical, Inc. (f/k/a MedTech Group, Inc.) | Senior Secured Term Loan | 6.50 | % | (L +5.25%) | 9/7/16 | 4,636 | 4,602 | 4,618 | 3.3 | |||||||||||||||||
| NeuroTherm, Inc | Senior Secured Term Loan | 5.75 | % | (L +4.50%) | 2/1/16 | 3,696 | 3,672 | 3,693 | 2.7 | |||||||||||||||||
| Strata Pathology Services, Inc. (7) | Senior Secured Term Loan | 11.00 | % | (L +9.50%) | 6/30/16 | 4,037 | 3,988 | 1,049 | 0.8 | |||||||||||||||||
| Studer Group LLC | Senior Secured Term Loan | 6.00 | % | (L +4.75%) | 7/31/18 | 3,690 | 3,662 | 3,575 | 2.6 | |||||||||||||||||
| The Ritedose Corporation | Senior Secured Term Loan | 6.75 | % | (L +5.00%) | 11/10/16 | 3,054 | 3,027 | 3,045 | 2.2 | |||||||||||||||||
| 12.0% cash | ||||||||||||||||||||||||||
| United Biologics Holdings, LLC (5) | Senior Secured Loan | / 2.0% PIK | N/A | 3/5/17 | 4,120 | 4,042 | 4,052 | 2.9 | ||||||||||||||||||
| Class A-1 Units (2,686 units) and Kicker Units (2,015 units) | 9 | 15 | - | |||||||||||||||||||||||
| Class A-1 Warrants (2,272 units) and Kicker Warrants (1,704 units) | 8 | 12 | - | |||||||||||||||||||||||
| Class A Warrants (10,160 units) | 67 | 87 | 0.1 | |||||||||||||||||||||||
| Class B Warrants (15,238 units) | 7 | 24 | - | |||||||||||||||||||||||
| 4,120 | 4,133 | 4,190 | 3.0 | |||||||||||||||||||||||
| 47,918 | 47,539 | 44,994 | 32.4 | |||||||||||||||||||||||
| High Tech Industries | ||||||||||||||||||||||||||
| Anaren, Inc. (5) | Senior Secured Term Loan | 5.50 | % | (L +4.50%) | 2/18/21 | 2,993 | 2,963 | 2,963 | 2.1 | |||||||||||||||||
| B&B Electronics Manufacturing Company | Senior Secured Term Loan A | 6.55 | % | (L +5.00%) | 4/4/15 | 2,668 | 2,654 | 2,569 | 1.8 | |||||||||||||||||
| OnePath Systems, LLC | Senior Secured Term Loan | 7.50 | % | (L +6.00%) | 6/6/17 | 2,313 | 2,284 | 2,313 | 1.7 | |||||||||||||||||
| 7,974 | 7,901 | 7,845 | 5.6 | |||||||||||||||||||||||
| Media: Advertising, Printing & Publishing | ||||||||||||||||||||||||||
| Content Marketing, LLC | Senior Secured Term Loan | 7.50 | % | (L +6.25%) | 12/21/17 | 3,343 | 3,306 | 3,343 | 2.4 | |||||||||||||||||
| Media Source | Senior Secured Term Loan B | 7.50 | % | (L +6.00%) | 11/7/16 | 3,451 | 3,414 | 3,451 | 2.5 | |||||||||||||||||
| Media Source | Senior Secured Term Loan A | 6.75 | % | (L +5.25%) | 11/7/16 | 1,201 | 1,188 | 1,201 | 0.9 | |||||||||||||||||
| Pamarco Technologies, Inc. | Senior Secured Revolver | N/A | (L +3.75%) | 12/31/14 | - | (3 | ) | (4 | )(2) | - | ||||||||||||||||
| Pamarco Technologies, Inc. | Senior Secured Term Loan A | 6.00 | % | (L +3.75%) | 12/31/14 | 1,206 | 1,203 | 1,203 | 0.9 | |||||||||||||||||
| 9,201 | 9,108 | 9,194 | 6.7 | |||||||||||||||||||||||
| Media: Broadcasting & Subscription | ||||||||||||||||||||||||||
| Campus Televideo, Inc. | Senior Secured Term Loan | 7.25 | % | (L +5.75%) | 10/23/17 | 4,216 | 4,141 | 4,216 | 3.0 | |||||||||||||||||
| 4,216 | 4,141 | 4,216 | 3.0 | |||||||||||||||||||||||
| Retail | ||||||||||||||||||||||||||
| Tharpe Company, Inc. | Senior Secured Term Loan | 6.75 | % | (L +5.50%) | 10/19/17 | 4,019 | 3,977 | 3,987 | 2.9 | |||||||||||||||||
| 4,019 | 3,977 | 3,987 | 2.9 | |||||||||||||||||||||||
| Services: Business | ||||||||||||||||||||||||||
| Revspring Inc. (f/k/a Dantom Systems, Inc.) | Senior Secured Term Loan | 5.50 | % | (L +4.25%) | 8/3/17 | 4,691 | 4,663 | 4,519 | 3.2 | |||||||||||||||||
| Young Innovations, Inc. | Senior Secured Term Loan A | 5.75 | % | (L +4.50%) | 1/30/19 | 2,683 | 2,651 | 2,556 | 1.8 | |||||||||||||||||
| 7,374 | 7,314 | 7,075 | 5.0 | |||||||||||||||||||||||
| 6 |
OFS Capital Corporation and Subsidiaries
Consolidated Schedule of Investments - Continued
March 31, 2014
(Dollar amounts in thousands)
| Spread | Percent | |||||||||||||||||||||||||
| Industry | Interest | Above | Principal | of Net | ||||||||||||||||||||||
| Name of Portfolio Company | Investment Type | Rate (1) | Index (1) | Maturity | Amount | Cost | Fair Value | Assets | ||||||||||||||||||
| Non-control/Non-affiliate Investments - Continued | ||||||||||||||||||||||||||
| Services: Consumer | ||||||||||||||||||||||||||
| 10.0% cash | ||||||||||||||||||||||||||
| smarTours, LLC (5) | Senior Secured Loan | / 0.5% PIK | N/A | 10/11/18 | 5,012 | 4,915 | 5,050 | 3.6 | ||||||||||||||||||
| Preferred Equity A (500,000 units) | 500 | 542 | 0.4 | |||||||||||||||||||||||
| 5,012 | 5,415 | 5,592 | 4.0 | |||||||||||||||||||||||
| Telecommunications | ||||||||||||||||||||||||||
| Barcodes LLC | Senior Secured Term Loan | 7.25 | % | (L +6.00%) | 11/2/17 | 2,960 | 2,928 | 2,960 | 2.1 | |||||||||||||||||
| NHR Holdings, LLC | Senior Secured Term Loan A | 5.55 | % | (L +4.25%) | 11/30/18 | 2,272 | 2,246 | 2,147 | 1.5 | |||||||||||||||||
| NHR Holdings, LLC | Senior Secured Term Loan B | 5.55 | % | (L +4.25%) | 11/30/18 | 2,303 | 2,277 | 2,177 | 1.6 | |||||||||||||||||
| 7,535 | 7,451 | 7,284 | 5.2 | |||||||||||||||||||||||
| Total Non-control/Non-affiliate Investments | 192,420 | 191,188 | 188,242 | 135.2 | ||||||||||||||||||||||
| Affiliate Investments | ||||||||||||||||||||||||||
| Aerospace & Defense | ||||||||||||||||||||||||||
| 12.5% cash | ||||||||||||||||||||||||||
| Malabar International (5) | Subordinated Loan | / 2.5% PIK | N/A | 5/21/17 | 5,148 | 5,243 | 5,246 | 3.8 | ||||||||||||||||||
| Preferred Stock (1,494 shares) | 3,933 | 4,039 | 2.9 | |||||||||||||||||||||||
| 5,148 | 9,176 | 9,285 | 6.7 | |||||||||||||||||||||||
| Healthcare & Pharmaceuticals | ||||||||||||||||||||||||||
| 12.0% cash | ||||||||||||||||||||||||||
| Pfanstiehl Holdings, Inc (5) | Subordinated Loan | / 4.0% PIK | N/A | 9/29/18 | 3,711 | 3,814 | 3,786 | 2.7 | ||||||||||||||||||
| Class A Common Equity (400 shares) | 217 | 589 | 0.4 | |||||||||||||||||||||||
| 3,711 | 4,031 | 4,375 | 3.1 | |||||||||||||||||||||||
| Services: Business | ||||||||||||||||||||||||||
| Contract Datascan Holdings, Inc. (5) | Senior Secured Term Loan B | 10.50 | % | (L +9.50%) | 12/17/18 | 12,265 | 12,150 | 12,280 | 8.8 | |||||||||||||||||
| Preferred Equity A (2,463 shares) | 2,011 | 2,011 | 1.5 | |||||||||||||||||||||||
| Preferred Equity B (382 shares) | 437 | 437 | 0.3 | |||||||||||||||||||||||
| Common Equity (9,069 shares) | - | - | - | |||||||||||||||||||||||
| 12,265 | 14,598 | 14,728 | 10.6 | |||||||||||||||||||||||
| Sentry Centers Holdings, LLC (5) | Senior Secured Loan | 14.00 | % | N/A | 6/28/18 | 5,000 | 4,872 | 4,926 | 3.6 | |||||||||||||||||
| Preferred Equity A (82.5 units) | - | - | - | |||||||||||||||||||||||
| 5,000 | 4,872 | 4,926 | 3.6 | |||||||||||||||||||||||
| 17,265 | 19,470 | 19,654 | 14.2 | |||||||||||||||||||||||
| Total Affiliate Investments | 26,124 | 32,677 | 33,314 | 24.0 | ||||||||||||||||||||||
| Control Investment | ||||||||||||||||||||||||||
| Services: Business | ||||||||||||||||||||||||||
| 12.5% cash | ||||||||||||||||||||||||||
| Tangible Software, Inc. (5) | Senior Secured Loan | / 1.5% PIK | N/A | 9/28/16 | 8,323 | 8,318 | 6,446 | 4.6 | ||||||||||||||||||
| Common Equity B (1,485,000 units) | 518 | - | - | |||||||||||||||||||||||
| Common Equity B-1 (1,022,562 units) | 77 | - | - | |||||||||||||||||||||||
| Common Equity B-2 (615,080 units) | 77 | - | - | |||||||||||||||||||||||
| 8,323 | 8,990 | 6,446 | 4.6 | |||||||||||||||||||||||
| Total Control Investment | 8,323 | 8,990 | 6,446 | 4.6 | ||||||||||||||||||||||
| Total Investments | 226,867 | 232,855 | 228,002 | 163.8 | ||||||||||||||||||||||
| 7 |
OFS Capital Corporation and Subsidiaries
Consolidated Schedule of Investments - Continued
March 31, 2014
(Dollar amounts in thousands)
| Percent | ||||||||||||||||||
| Principal | of Net | |||||||||||||||||
| Name of Portfolio Company | Investment Type | Amount | Cost | Fair Value | Assets | |||||||||||||
| Money Market | ||||||||||||||||||
| WF Prime INVT MM #1752 (8) | Money Market | N/A | 1,719 | (3) | 1,719 | (3) | 1.2 | |||||||||||
| WFB Secured Institutional MM (8) | Money Market | N/A | 450 | (4) | 450 | (4) | 0.3 | |||||||||||
| US Bank Money Market Deposit Account | Money Market | N/A | 30,310 | (3) | 30,310 | (3) | 21.8 | |||||||||||
| Total Money Market | 32,479 | 32,479 | 23.3 | |||||||||||||||
| Total Investments and Money Market (United States) | $ | 226,867 | $ | 265,334 | $ | 260,481 | 187.1 | % | ||||||||||
| (1) | The majority of the investments bear interest at a rate that may be determined by reference to LIBOR (L) or Prime (P) and which is reset daily, quarterly or semi- annually. For each investment, we have provided the spread over LIBOR and current interest rate in effect at March 31, 2014. Certain investments are subject to a LIBOR or Prime interest rate floor. |
| (2) | The negative fair value is the result of the unfunded commitment being valued below par. |
| (3) | Included in cash and cash equivalents on the consolidated balance sheets. |
| (4) | Included in restricted cash and cash equivalents on the consolidated balance sheets. |
| (5) | Investments held by SBIC I LP. All other investments are held by OFS Capital WM, and are pledged as collateral under the OFS Capital WM credit facility. |
| (6) | Indicates assets that the Company deems not "qualifying assets" under Section 55(a) of the Investment Company Act of 1940, as amended. Qualifying assets must represent at least 70% of the Company's total assets at the time of acquisition of any additional non-qualifying assets. |
| (7) | Non-accrual loan. |
| (8) | Money market accounts held by OFS Capital WM, and pledged as collateral under the OFS Capital WM credit facility. |
See Notes to Unaudited Consolidated Financial Statements.
| 8 |
OFS Capital Corporation and Subsidiaries
Consolidated Schedule of Investments (unaudited)
December 31, 2013
(Dollar amounts in thousands)
| Spread | Percent | |||||||||||||||||||||||||
| Industry | Interest | Above | Principal | of Net | ||||||||||||||||||||||
| Name of Portfolio Company | Investment Type | Rate (1) | Index (1) | Maturity | Amount | Cost | Fair Value | Assets | ||||||||||||||||||
| Non-control/Non-affiliate Investments | ||||||||||||||||||||||||||
| Aerospace & Defense | ||||||||||||||||||||||||||
| Aero-Metric, Inc. | Senior Secured Term Loan | 6.75 | % | (L +5.50%) | 8/27/17 | $ | 2,713 | $ | 2,683 | $ | 2,705 | 1.9 | % | |||||||||||||
| Whitcraft LLC | Senior Secured Term Loan | 6.50 | % | (L +5.00%) | 12/16/15 | 4,188 | 4,157 | 3,882 | 2.8 | |||||||||||||||||
| 6,901 | 6,840 | 6,587 | 4.7 | |||||||||||||||||||||||
| Automotive | ||||||||||||||||||||||||||
| Tectum Holdings Inc | Senior Secured Term Loan A | 6.50 | % | (L +5.25%) | 12/3/15 | 3,013 | 2,999 | 3,005 | 2.1 | |||||||||||||||||
| Trico Products Corporation | Senior Secured Term Loan | 6.25 | % | (L +4.75%) | 7/22/16 | 4,196 | 4,162 | 4,156 | 3.0 | |||||||||||||||||
| 7,209 | 7,161 | 7,161 | 5.1 | |||||||||||||||||||||||
| Banking, Finance, Insurance & Real Estate | ||||||||||||||||||||||||||
| AssuredPartners Capital, Inc. | Senior Secured Term Loan A | 5.75 | % | (L +4.50%) | 12/14/18 | 4,840 | 4,840 | 4,840 | 3.4 | |||||||||||||||||
| Captive Resources Midco LLC | Senior Secured Term Loan | 7.75 | % | (P +4.50%) | 10/31/18 | 4,938 | 4,878 | 4,878 | 3.5 | |||||||||||||||||
| CSI Financial Services, LLC (6) | Senior Secured Term Loan | 7.00 | % | (L +5.75%) | 12/12/18 | 3,379 | 3,332 | 3,332 | 2.4 | |||||||||||||||||
| MCMC LLC | Senior Secured Term Loan A | 7.50 | % | (L +6.00%) | 9/30/16 | 3,946 | 3,912 | 3,946 | 2.8 | |||||||||||||||||
| MYI Acquiror Limited (6) | Senior Secured Term Loan A | 6.25 | % | (L +4.75%) | 9/13/16 | 4,899 | 4,857 | 4,842 | 3.4 | |||||||||||||||||
| Personable Holdings, Inc. | Senior Secured Term Loan | 8.25 | % | (P +5.00%) | 5/16/18 | 2,887 | 2,863 | 2,887 | 2.1 | |||||||||||||||||
| Townsend Acquisition LLC | Senior Secured Term Loan | 6.25 | % | (L +4.75%) | 5/18/16 | 4,413 | 4,353 | 4,377 | 3.1 | |||||||||||||||||
| 29,302 | 29,035 | 29,102 | 20.7 | |||||||||||||||||||||||
| Beverage, Food & Tobacco | ||||||||||||||||||||||||||
| Columbus Manufacturing, Inc. | Senior Secured Term Loan B | 6.50 | % | (L +5.25%) | 4/17/18 | 3,960 | 3,914 | 3,915 | 2.8 | |||||||||||||||||
| Phillips Feed & Pet Supply | Senior Secured Term Loan | 6.05 | % | (L +4.25%) | 10/13/17 | 3,184 | 3,158 | 3,184 | 2.3 | |||||||||||||||||
| 7,144 | 7,072 | 7,099 | 5.1 | |||||||||||||||||||||||
| Capital Equipment | ||||||||||||||||||||||||||
| Dorner MFG, Corp. | Senior Secured Term Loan | 6.00 | % | (L +4.75%) | 6/15/17 | 3,228 | 3,184 | 3,142 | 2.2 | |||||||||||||||||
| Elgin Fasteners Group | Senior Secured Term Loan | 6.00 | % | (L +4.75%) | 8/26/16 | 4,844 | 4,766 | 4,766 | 3.4 | |||||||||||||||||
| 8,072 | 7,950 | 7,908 | 5.6 | |||||||||||||||||||||||
| Chemicals, Plastics & Rubber | ||||||||||||||||||||||||||
| Actagro, LLC | Senior Secured Term Loan | 5.76 | % | (L +4.50%) | 12/30/16 | 3,423 | 3,394 | 3,339 | 2.4 | |||||||||||||||||
| Dash Materials LLC | Senior Secured Term Loan | 8.75 | % | (L +7.50%) | 12/26/17 | 4,811 | 4,790 | 4,811 | 3.4 | |||||||||||||||||
| ICM Products Inc | Senior Secured Term Loan | 7.50 | % | (L +6.00%) | 2/1/17 | 2,149 | 2,123 | 2,149 | 1.5 | |||||||||||||||||
| Inhance Technologies Holdings LLC | Senior Secured Term Loan A | 9.00 | % | (L +7.50%) | 1/4/17 | 2,574 | 2,551 | 2,574 | 1.8 | |||||||||||||||||
| KODA Distribution Group, Inc. | Senior Secured Term Loan A | 6.00 | % | (L +5.00%) | 4/9/18 | 3,936 | 3,919 | 3,826 | 2.7 | |||||||||||||||||
| VanDeMark Chemical Inc. | Senior Secured Term Loan | 6.50 | % | (L +5.25%) | 11/30/17 | 2,864 | 2,819 | 2,827 | 2.0 | |||||||||||||||||
| 19,757 | 19,596 | 19,526 | 13.8 | |||||||||||||||||||||||
| Construction & Building | ||||||||||||||||||||||||||
| Jameson LLC | Senior Secured Term Loan | 7.50 | % | (L +5.50%) | 10/1/15 | 1,888 | 1,874 | 1,888 | 1.3 | |||||||||||||||||
| 1,888 | 1,874 | 1,888 | 1.3 | |||||||||||||||||||||||
| Consumer goods: Non-durable | ||||||||||||||||||||||||||
| Pacific World | Senior Secured Term Loan | 5.75 | % | (L +4.75%) | 10/31/16 | 4,682 | 4,634 | 4,574 | 3.3 | |||||||||||||||||
| Phoenix Brands LLC | Senior Secured Term Loan A | 9.25 | % | (L +7.75%) | 1/31/16 | 3,031 | 3,008 | 2,854 | 2.0 | |||||||||||||||||
| 7,713 | 7,642 | 7,428 | 5.3 | |||||||||||||||||||||||
| Containers, Packaging & Glass | ||||||||||||||||||||||||||
| Mold-Rite Plastics, LLC | Senior Secured Term Loan | 6.25 | % | (L +4.50%) | 6/30/16 | 4,268 | 4,235 | 4,231 | 3.0 | |||||||||||||||||
| 4,268 | 4,235 | 4,231 | 3.0 | |||||||||||||||||||||||
| Energy: Oil & Gas | ||||||||||||||||||||||||||
| ANS Distributing, INC. | Senior Secured Term Loan | 8.00 | % | (L +6.50%) | 11/1/17 | 2,966 | 2,920 | 2,966 | 2.1 | |||||||||||||||||
| Charter Brokerage LLC | Senior Secured Term Loan A | 8.00 | % | (L +6.50%) | 10/10/16 | 4,269 | 4,228 | 4,269 | 3.0 | |||||||||||||||||
| 7,235 | 7,148 | 7,235 | 5.1 | |||||||||||||||||||||||
| Environmental Industries | ||||||||||||||||||||||||||
| Apex Companies, LLC. | Senior Secured Term Loan | 6.75 | % | (L +5.50%) | 12/10/18 | 3,859 | 3,829 | 3,811 | 2.7 | |||||||||||||||||
| JWC Environmental, LLC. | Senior Secured Term Loan | 6.00 | % | (L +4.50%) | 8/3/16 | 4,010 | 3,989 | 3,943 | 2.8 | |||||||||||||||||
| 7,869 | 7,818 | 7,754 | 5.5 | |||||||||||||||||||||||
| 9 |
OFS Capital Corporation and Subsidiaries
Consolidated Schedule of Investments - Continued
December 31, 2013
(Dollar amounts in thousands)
| Spread | Percent | |||||||||||||||||||||||||
| Industry | Interest | Above | Principal | of Net | ||||||||||||||||||||||
| Name of Portfolio Company | Investment Type | Rate (1) | Index (1) | Maturity | Amount | Cost | Fair Value | Assets | ||||||||||||||||||
| Non-control/Non-affiliate Investments - Continued | ||||||||||||||||||||||||||
| Healthcare & Pharmaceuticals | ||||||||||||||||||||||||||
| Accelerated Health Systems LLC | Senior Secured Term Loan | 5.75 | % | (L +4.50%) | 7/22/17 | 4,888 | 4,857 | 4,727 | 3.4 | |||||||||||||||||
| Aegis Sciences Corporation | Senior Secured Term Loan A | 6.50 | % | (L +5.25%) | 10/21/16 | 4,700 | 4,651 | 4,675 | 3.3 | |||||||||||||||||
| Behavioral Health Group | Senior Secured Term Loan A | 5.75 | % | (L +4.50%) | 8/18/16 | 4,604 | 4,578 | 4,501 | 3.3 | |||||||||||||||||
| Elements Behavioral Health, Inc. | Senior Secured Term Loan A | 7.50 | % | (L +6.00%) | 8/14/17 | 4,754 | 4,703 | 4,753 | 3.4 | |||||||||||||||||
| HealthFusion, Inc. (5) | Senior Secured Loan | 13.00 | % | N/A | 10/7/18 | 5,750 | 5,668 | 5,668 | 4.0 | |||||||||||||||||
| Common Stock Warrants (1,910,302 shares) | - | - | - | |||||||||||||||||||||||
| 5,750 | 5,668 | 5,668 | 4.0 | |||||||||||||||||||||||
| Hygenic Corporation | Senior Secured Term Loan | 5.75 | % | (L +4.50%) | 10/11/18 | 4,731 | 4,675 | 4,508 | 3.2 | |||||||||||||||||
| Vention Medical, Inc. | ||||||||||||||||||||||||||
| (f/k/a MedTech Group, Inc.) | Senior Secured Term Loan | 6.50 | % | (L +5.25%) | 9/7/16 | 4,667 | 4,629 | 4,644 | 3.3 | |||||||||||||||||
| NeuroTherm, Inc | Senior Secured Term Loan | 6.50 | % | (L +5.00%) | 2/1/16 | 3,696 | 3,668 | 3,690 | 2.6 | |||||||||||||||||
| Strata Pathology Services, Inc. (7) | Senior Secured Term Loan | 11.00 | % | (L +9.50%) | 6/30/16 | 4,037 | 3,988 | 1,051 | 0.7 | |||||||||||||||||
| Studer Group LLC | Senior Secured Term Loan | 6.00 | % | (L +4.75%) | 7/31/18 | 3,738 | 3,706 | 3,614 | 2.6 | |||||||||||||||||
| The Ritedose Corporation | Senior Secured Term Loan | 6.75 | % | (L +5.00%) | 11/10/16 | 3,182 | 3,151 | 3,172 | 2.3 | |||||||||||||||||
| United Biologics Holdings, LLC (5) | Senior Secured Loan | 12.0% cash / 2.0% PIK | N/A | 3/5/17 | 3,290 | 3,217 | 3,218 | 2.3 | ||||||||||||||||||
| Class A-1 Units (2,686 units) and Kicker Units (2,015 units) | 9 | 15 | - | |||||||||||||||||||||||
| Class A-1 Warrants (2,272 units) and Kicker Warrants (1,704 units) | 8 | 12 | - | |||||||||||||||||||||||
| Class A Warrants (10,160 units) | 67 | 83 | 0.1 | |||||||||||||||||||||||
| Class B Warrants (15,238 units) | 7 | 25 | - | |||||||||||||||||||||||
| 3,290 | 3,308 | 3,353 | 2.4 | |||||||||||||||||||||||
| 52,037 | 51,582 | 48,356 | 34.5 | |||||||||||||||||||||||
| High Tech Industries | ||||||||||||||||||||||||||
| B&B Electronics Manufacturing | ||||||||||||||||||||||||||
| Company | Senior Secured Term Loan A | 6.50 | % | (L +5.00%) | 4/4/15 | 2,715 | 2,697 | 2,577 | 1.8 | |||||||||||||||||
| OnePath Systems, LLC | Senior Secured Term Loan | 7.50 | % | (L +6.00%) | 6/6/17 | 2,344 | 2,312 | 2,344 | 1.7 | |||||||||||||||||
| 5,059 | 5,009 | 4,921 | 3.5 | |||||||||||||||||||||||
| Media: Advertising, Printing & Publishing | ||||||||||||||||||||||||||
| Content Marketing, LLC | Senior Secured Term Loan | 7.50 | % | (L +6.25%) | 12/21/17 | 3,508 | 3,466 | 3,508 | 2.5 | |||||||||||||||||
| Media Source | Senior Secured Term Loan B | 7.50 | % | (L +6.00%) | 11/7/16 | 3,460 | 3,420 | 3,460 | 2.5 | |||||||||||||||||
| Media Source | Senior Secured Term Loan A | 6.75 | % | (L +5.25%) | 11/7/16 | 1,223 | 1,209 | 1,223 | 0.9 | |||||||||||||||||
| Pamarco Technologies, Inc. | Senior Secured Revolver | N/A | (L +3.75%) | 12/31/14 | - | (4 | ) | (6 | )(2) | - | ||||||||||||||||
| Pamarco Technologies, Inc. | Senior Secured Term Loan A | 6.00 | % | (L +3.75%) | 12/31/14 | 1,522 | 1,518 | 1,516 | 1.1 | |||||||||||||||||
| 9,713 | 9,609 | 9,701 | 7.0 | |||||||||||||||||||||||
| Media: Broadcasting & Subscription | ||||||||||||||||||||||||||
| Campus Televideo, Inc. | Senior Secured Term Loan | 7.25 | % | (L +5.75%) | 10/23/17 | 4,305 | 4,223 | 4,305 | 3.1 | |||||||||||||||||
| 4,305 | 4,223 | 4,305 | 3.1 | |||||||||||||||||||||||
| Retail | ||||||||||||||||||||||||||
| Tharpe Company, Inc. | Senior Secured Term Loan | 6.50 | % | (L +5.25%) | 10/19/17 | 4,138 | 4,091 | 4,092 | 2.9 | |||||||||||||||||
| 4,138 | 4,091 | 4,092 | 2.9 | |||||||||||||||||||||||
| Services: Business | ||||||||||||||||||||||||||
| Revspring Inc. (f/k/a Dantom Systems, Inc.) | Senior Secured Term Loan | 5.50 | % | (L +4.25%) | 8/3/17 | 4,752 | 4,723 | 4,723 | 3.4 | |||||||||||||||||
| Young Innovations, Inc. | Senior Secured Term Loan A | 5.75 | % | (L +4.50%) | 1/30/19 | 2,762 | 2,727 | 2,623 | 1.9 | |||||||||||||||||
| 7,514 | 7,450 | 7,346 | 5.3 | |||||||||||||||||||||||
| 10 |
OFS Capital Corporation and Subsidiaries
Consolidated Schedule of Investments - Continued
December 31, 2013
(Dollar amounts in thousands)
| Spread | Percent | |||||||||||||||||||||||||
| Industry | Interest | Above | Principal | of Net | ||||||||||||||||||||||
| Name of Portfolio Company | Investment Type | Rate (1) | Index (1) | Maturity | Amount | Cost | Fair Value | Assets | ||||||||||||||||||
| Non-control/Non-affiliate Investments - Continued | ||||||||||||||||||||||||||
| Services: Consumer | ||||||||||||||||||||||||||
| 10.0% cash | ||||||||||||||||||||||||||
| smarTours, LLC (5) | Senior Secured Loan | / 0.5% PIK | N/A | 10/11/18 | 5,006 | 4,903 | 4,903 | 3.5 | ||||||||||||||||||
| Preferred Equity A (500,000 units) | 500 | 500 | 0.4 | |||||||||||||||||||||||
| 5,006 | 5,403 | 5,403 | 3.9 | |||||||||||||||||||||||
| Telecommunications | ||||||||||||||||||||||||||
| Barcodes LLC | Senior Secured Term Loan | 7.25 | % | (L +6.00%) | 11/2/17 | 2,986 | 2,952 | 2,986 | 2.1 | |||||||||||||||||
| NHR Holdings, LLC | Senior Secured Term Loan A | 5.75 | % | (L +4.50%) | 11/30/18 | 2,272 | 2,244 | 2,140 | 1.5 | |||||||||||||||||
| NHR Holdings, LLC | Senior Secured Term Loan B | 5.75 | % | (L +4.50%) | 11/30/18 | 2,303 | 2,275 | 2,169 | 1.6 | |||||||||||||||||
| 7,561 | 7,471 | 7,295 | 5.2 | |||||||||||||||||||||||
| Total Non-control/Non-affiliate Investments | 202,691 | 201,209 | 197,338 | 140.6 | ||||||||||||||||||||||
| Affiliate Investments | ||||||||||||||||||||||||||
| Aerospace & Defense | ||||||||||||||||||||||||||
| 12.5% cash | ||||||||||||||||||||||||||
| Malabar International (5) | Subordinated Loan | / 2.5% PIK | N/A | 5/21/17 | 5,116 | 5,223 | 5,223 | 3.7 | ||||||||||||||||||
| Preferred Stock (1,494 shares) | 3,933 | 3,911 | 2.8 | |||||||||||||||||||||||
| 5,116 | 9,156 | 9,134 | 6.5 | |||||||||||||||||||||||
| Healthcare & Pharmaceuticals | ||||||||||||||||||||||||||
| 12.0% cash | ||||||||||||||||||||||||||
| Pfanstiehl Holdings, Inc (5) | Subordinated Loan | / 4.0% PIK | N/A | 9/29/18 | 3,674 | 3,786 | 3,785 | 2.7 | ||||||||||||||||||
| Class A Common Equity (400 shares) | 217 | 371 | 0.3 | |||||||||||||||||||||||
| 3,674 | 4,003 | 4,156 | 3.0 | |||||||||||||||||||||||
| Services: Business | ||||||||||||||||||||||||||
| Contract Datascan Holdings, Inc. (5) | Senior Secured Term Loan B | 10.50 | % | (L +9.50%) | 12/17/18 | 12,265 | 12,144 | 12,144 | 8.7 | |||||||||||||||||
| Preferred Equity A (2,463 shares) | 2,011 | 2,011 | 1.4 | |||||||||||||||||||||||
| Preferred Equity B (382 shares) | 437 | 437 | 0.3 | |||||||||||||||||||||||
| Common Equity (9,069 shares) | - | - | - | |||||||||||||||||||||||
| 12,265 | 14,592 | 14,592 | 10.4 | |||||||||||||||||||||||
| Sentry Centers Holdings, LLC (5) | Senior Secured Loan | 14.00 | % | N/A | 6/28/18 | 5,000 | 4,867 | 4,853 | 3.4 | |||||||||||||||||
| Preferred Equity A (60 units) | - | - | - | |||||||||||||||||||||||
| 5,000 | 4,867 | 4,853 | 3.4 | |||||||||||||||||||||||
| 17,265 | 19,459 | 19,445 | 13.8 | |||||||||||||||||||||||
| Total Affiliate Investments | 26,055 | 32,618 | 32,735 | 23.3 | ||||||||||||||||||||||
| Control Investment | ||||||||||||||||||||||||||
| Services: Business | ||||||||||||||||||||||||||
| 12.5% cash | ||||||||||||||||||||||||||
| Tangible Software, Inc. (5) | Senior Secured Loan | / 1.5% PIK | N/A | 9/28/16 | 8,920 | 8,924 | 7,846 | 5.6 | ||||||||||||||||||
| Common Equity B (1,485,000 units) | 518 | - | - | |||||||||||||||||||||||
| Common Equity B-1 (1,022,562 units) | 77 | - | - | |||||||||||||||||||||||
| Common Equity B-2 (615,080 units) | 77 | - | - | |||||||||||||||||||||||
| 8,920 | 9,596 | 7,846 | 5.6 | |||||||||||||||||||||||
| Total Control Investment | 8,920 | 9,596 | 7,846 | 5.6 | ||||||||||||||||||||||
| Total Investments | 237,666 | 243,423 | 237,919 | 169.5 | ||||||||||||||||||||||
| 11 |
OFS Capital Corporation and Subsidiaries
Consolidated Schedule of Investments - Continued
December 31, 2013
(Dollar amounts in thousands)
| Percent | ||||||||||||||||||
| Principal | of Net | |||||||||||||||||
| Name of Portfolio Company | Investment Type | Amount | Cost | Fair Value | Assets | |||||||||||||
| Money Market | ||||||||||||||||||
| WF Prime INVT MM #1752 (8) | Money Market | N/A | 3,829 | (3) | 3,829 | (3) | 2.7 | |||||||||||
| WFB Secured Institutional MM (8) | Money Market | N/A | 450 | (4) | 450 | (4) | 0.3 | |||||||||||
| US Bank Money Market Deposit Account | Money Market | N/A | 20,590 | (3) | 20,590 | (3) | 14.7 | |||||||||||
| Total Money Market | 24,869 | 24,869 | 17.7 | |||||||||||||||
| Total Investments and Money Market (United States) | $ | 237,666 | $ | 268,292 | $ | 262,788 | 187.2 | % | ||||||||||
| (1) | The majority of the investments bear interest at a rate that may be determined by reference to LIBOR (L) or Prime (P) and which is reset daily, quarterly or semiannually. For each investment, we have provided the spread over LIBOR or Prime and current interest rate in effect at December 31, 2013. Certain investments are subject to a LIBOR or Prime interest rate floor. |
| (2) | The negative fair value is the result of the unfunded commitment being valued below par. |
| (3) | Included in cash and cash equivalents on the consolidated balance sheets. |
| (4) | Included in restricted cash and cash equivalents on the consolidated balance sheets. |
| (5) | Investments held by SBIC I LP investments. All other investments were held by OFS Capital WM, and were pledged as collateral under the OFS Capital WM credit facility. |
| (6) | Indicates assets that the Company deems not "qualifying assets" under Section 55(a) of the Investment Company Act of 1940, as amended. Qualifying assets must represent at least 70% of the Company's total assets at the time of acquisition of any additional non-qualifying assets. |
| (7) | Non-accrual loan. |
| (8) | Money market accounts held by OFS Capital WM, and pledged as collateral under the OFS Capital WM credit facility. |
See Notes to Unaudited Consolidated Financial Statements.
| 12 |
OFS Capital Corporation and Subsidiaries
Notes to Unaudited Consolidated Financial Statements
(Dollar amounts in thousands, except per share data)
| Note 1. | Organization |
OFS Capital Corporation (“OFS Capital”, the “Company”, or “we”) is a Delaware corporation formed on November 7, 2012 and is an externally managed, closed-end, non-diversified management investment company. The Company has elected to be treated as a business development company (“BDC”) under the Investment Company Act of 1940, as amended (the “1940 Act”). In addition, for tax purposes, the Company has elected to be treated as a regulated investment company (“RIC”) under Subchapter M of the Internal Revenue Code of 1986, as amended (the “Code”).
From time to time, the term OFS Capital, the Company, or we may be used herein to refer to OFS Capital Corporation, individually, or OFS Capital Corporation and/or its subsidiaries either collectively or individually, as well as, with respect to all periods prior to the initial public offering (“IPO”) date of November 7, 2012, OFS Capital, LLC.
On November 7, 2012, the Company priced its IPO, selling 6,666,667 shares of its common stock at a public offering price of $15 per share and raising $100 million in gross proceeds. Immediately prior to the IPO, on November 7, 2012, OFS Capital, LLC converted from a limited liability company to a corporation, as a result of which the sole membership interest held in OFS Capital, LLC by Orchard First Source Asset Management, LLC (“OFSAM”) prior to the conversion was exchanged for 2,912,024 shares of common stock in the Company.
On September 28, 2010, OFS Capital, LLC became the 100% equity owner of OFS Capital WM, LLC (“OFS Capital WM”). On September 29, 2011, OFS Capital, LLC became the primary beneficiary in OFS SBIC I, LP (formerly known as Tamarix Capital Partners, L.P.; “SBIC I LP”), a variable interest entity (“VIE”) under the applicable provisions of Financial Accounting Standards Board (“FASB”) Accounting Standards Codification Topic 810, “Consolidation” (“ASC Topic 810”). On May 10, 2012, upon SBIC I LP’s receipt of a Small Business Investment Company (“SBIC”) license, OFS Capital, LLC became an approximately 68% limited partner in SBIC I LP. On December 4, 2013, the Company acquired the remaining limited partnership interests in SBIC I LP (the “Tamarix LP Acquisition”), as well as the remaining membership interests in OFS SBIC I GP, LLC (formerly known as Tamarix Capital G.P. LLC, “SBIC I GP”), the general partner of SBIC I LP that holds 1% limited partnership interest in SBIC I LP (the “Tamarix GP Acquisition”) (Tamarix LP Acquisition and Tamarix GP Acquisition are collectively referred to as the “Tamarix Acquisitions”). As a result of the Tamarix Acquisitions, SBIC I LP and SBIC I GP became wholly owned subsidiaries of the Company effective December 4, 2013 (see Note 3 for more details).
The Company’s investment strategy is to invest primarily in senior secured debt investments to middle market companies and, to a lesser extent, junior capital, including mezzanine debt and preferred and common equity and warrants. The Company has entered into an investment advisory and management agreement with OFS Capital Management, LLC (“OFS Capital Management”, or the “Investment Advisor”), under which the Investment Advisor manages the day-to-day operations of, and provides investment advisory services to, the Company (see Note 4 for more detail).
| Note 2. | Summary of Significant Accounting Policies |
Basis of presentation: The accompanying interim consolidated financial statements of the Company and related financial information have been prepared in accordance with generally accepted accounting principles in the United States of America (“GAAP”) for interim financial information and pursuant to the requirements for reporting on Form 10-Q and Article 6 or 10 of Regulation S-X. Accordingly, they do not include all of the information and notes required by GAAP for annual financial statements. In the opinion of management, the consolidated financial statements reflect all adjustments consisting only of normal recurring accruals and adjustments. All intercompany balances and transactions have been eliminated. Certain prior period amounts have been reclassified to conform to the current period presentation. The December 31, 2013 consolidated balance sheet was derived from the audited balance sheet included in the Company’s annual report on Form 10-K for the year ended December 31, 2013.
Principles of consolidation: The Company’s March 31, 2014 consolidated financial statements include the accounts of the Company and its wholly owned subsidiaries, OFS Capital WM, OFS Funding, LLC, SBIC I LP and SBIC I GP. The Company consolidates an affiliated subsidiary if it owns more than 50 percent of the subsidiary’s equity and holds the controlling financial interest in such subsidiary. The Company also consolidates a VIE if it is the primary beneficiary in the VIE. Effective July 27, 2012, the Company deconsolidated the financial statements of SBIC I LP from its own (see Note 3). Effective December 4, 2013, the Company consolidated the financial statements of SBIC I LP and SBIC I GP into its own (see Note 3).
| 13 |
OFS Capital Corporation and Subsidiaries
Notes to Unaudited Consolidated Financial Statements
(Dollar amounts in thousands, except per share data)
| Note 2. | Summary of Significant Accounting Policies (Continued) |
Fair value of financial instruments: The Company applies fair value to substantially all of its financial instruments in accordance with Accounting Standards Codification Topic 820, “Fair Value Measurements and Disclosures” (“ASC Topic 820”). ASC Topic 820 defines fair value, establishes a framework used to measure fair value and requires disclosures for fair value measurements. In accordance with ASC Topic 820, the Company has categorized its financial instruments carried at fair value, based on the priority of the valuation technique, into a three level fair value hierarchy. Fair value is a market-based measure considered from the perspective of the market participant that holds the financial instrument rather than an entity specific measure. Therefore, when market assumptions are not readily available, the Company’s own assumptions reflect those that management believes market participants would use in pricing the financial instrument at the measurement date.
The availability of observable inputs can vary depending on the financial instrument and is affected by a wide variety of factors, including, for example, the type of product, whether the product is new, whether the product is traded on an active exchange or in the secondary market, and the current market conditions. To the extent that the valuation is based on models or inputs that are less observable or unobservable in the market, the determination of fair value requires more judgment. Accordingly, the degree of judgment exercised by the Company in determining fair value is greatest for financial instruments classified as Level 3 (i.e., those instruments valued using non-observable inputs).
Changes to the valuation policy are reviewed by management and the Company’s board of directors (the “Board”) to confirm that the changes are justified. As markets change, new products develop and the pricing for products becomes more or less transparent, the Company will continue to refine its valuation methodologies.
See Note 6 for more detailed disclosures of the Company’s fair value measurements of its financial instruments.
Investment classification: The Company classifies its investments in accordance with the requirements of the 1940 Act. Under the 1940 Act, “Control Investments” are defined as investments in those companies where the Company owns more than 25% of the voting securities of such company or has rights to maintain greater than 50% of the board representation. Under the 1940 Act, “Affiliate Investments” are defined as investments in those companies where the Company owns between 5% and 25% of the voting securities of such company. “Non-Control/Non-Affiliate Investments” are those that neither qualify as Control Investments nor Affiliate Investments.
Use of estimates: The preparation of the consolidated financial statements in conformity with GAAP requires management to make estimates and assumptions that affect the reported amounts of assets and liabilities and disclosure of contingent assets and liabilities at the date of the consolidated financial statements and the reported amounts of revenues and expenses during the reporting period. Actual results could differ from those estimates.
Reportable segments: In accordance with segment guidance set by Accounting Standards Codification 280, “Segment Reporting” (“ASC Topic 280”), the Company has determined that it has a single reportable segment and operating segment structure.
Cash and cash equivalents: Cash and cash equivalents consist of cash and highly liquid investments not held for resale with original maturities at the time of acquisition of three months or less. The Company places its cash in financial institutions and at times, such balances may be in excess of the Federal Deposit Insurance Corporation insurance limits.
Restricted cash and cash equivalents: Restricted cash and cash equivalents represent amounts maintained in the Unfunded Exposure Account of OFS Capital WM as defined by the Loan Sale Agreement and other applicable transaction documents and are subject to the lien of the trustee for the benefit of the secured parties of OFS Capital WM. Proceeds in the Unfunded Exposure Account, along with advances under the OFS Capital WM Credit Facility (see Note 8), are utilized to fund an eligible loan owned by OFS Capital WM that has an unfunded revolving commitment.
| 14 |
OFS Capital Corporation and Subsidiaries
Notes to Unaudited Consolidated Financial Statements
(Dollar amounts in thousands, except per share data)
| Note 2. | Summary of Significant Accounting Policies (Continued) |
Revenue recognition:
Investments and related investment income: Investments are recorded at fair value. The Company’s Board determines the fair value of its portfolio investments. Interest income is accrued based upon the outstanding principal amount and contractual interest terms of debt investments. The Company accrues interest income until certain events take place, which may place a loan into a non-accrual status. In addition, the Company may generate revenue in the form of commitment, origination, amendment, structuring or due diligence fees, fees for providing managerial assistance and consulting fees. Loan origination fees, original issue discount (“OID”), market discount or premium, and loan amendment fees (collectively, “net loan origination fee income”) are capitalized, and the Company accretes or amortizes such amounts over the life of the loan as interest income. When the Company receives a loan principal payment, the OID related to the paid principal is accelerated and recognized in interest income. All other income is recorded into income when earned. Further, in connection with the Company’s debt investments, the Company will sometimes receive warrants or similar no cost equity-related securities (“Warrants”). The Company determines the cost basis of Warrants based upon their respective fair values on the date of receipt in proportion to the total fair value of the debt and Warrants received. Any resulting difference between the face amount of the debt and its recorded fair value resulting from the assignment of value to the Warrants is treated as OID, and accreted into interest income over the life of the debt security. Dividend income is recorded at the time dividends are declared or at the point an obligation exists for the portfolio company to make a distribution. Distribution of earnings from portfolio companies are evaluated to determine if the distribution is income or return of capital.
As of March 31, 2014 and December 31, 2013, unamortized discounts and origination fees on debt investments amounted to $1,874 and $2,105, respectively. For the three months ended March 31, 2014 and 2013, the Company recognized net loan origination fee income of $342 and $366, respectively.
For investments with contractual payment-in-kind interest (“PIK”), which represents contractual interest accrued and added to the principal balance that generally becomes due at maturity (or at some other stipulated date), the Company will not accrue PIK interest if the portfolio company valuation indicates that the PIK interest is not collectible. For the three months ended March 31, 2014 and 2013, the Company recognized PIK interest in the amount of $126 and $0, respectively.
Investment transactions are accounted for on a trade-date basis. Realized gains or losses on investments are measured by the difference between the net proceeds from the disposition and the cost basis of investment, without regard to unrealized gains or losses previously recognized. The Company reports changes in fair value of investments that are measured at fair value as a component of the net changes in unrealized appreciation (depreciation) on investments in the consolidated statements of operations.
Non-accrual loans: Loans on which the accrual of interest income has been discontinued are designated as non-accrual loans, and non-accrual loans are further designated to be accounted for under either a non-accrual cash method or a non-accrual cost recovery method. Loans are generally placed on non-accrual when a loan either: (i) is delinquent for 90 days or more on principal or interest based on contractual terms of the loan (unless well secured and in the process of collection), or (ii) in the opinion of the Company’s management, there is reasonable doubt about the collectability. When loans are placed on non-accrual status, all interest previously accrued but not collected is reversed against current period interest income. Interest payments received on non-accrual loans may be recognized as income or applied to principal depending upon management’s judgment. Interest accruals are resumed on non-accrual loans only when they are brought current with respect to interest and principal and when, in the judgment of management, the loans are estimated to be fully collectible as to all principal and interest. The Company had one non-accrual loan at March 31, 2014 and December 31, 2013. This loan had a fair value of $1,049 and $1,051 at March 31, 2014 and December 31, 2013, respectively.
Income taxes: The Company has elected to be treated as a RIC under Subchapter M of the Code and operates in a manner so as to qualify for the tax treatment applicable to RICs. In order to qualify as a RIC, among other things, the Company is required to meet certain source of income and asset diversification requirements and timely distribute to its shareholders at least 90% of investment company taxable income, as defined by the Code, for each year. The Company has made, and intends to continue to make, the requisite distributions to its shareholders, which will generally relieve the Company from U.S. federal income taxes with respect to all income distributed to its shareholders.
| 15 |
OFS Capital Corporation and Subsidiaries
Notes to Unaudited Consolidated Financial Statements
(Dollar amounts in thousands, except per share data)
| Note 2. | Summary of Significant Accounting Policies (Continued) |
Depending on the level of taxable income earned in a tax year, the Company may choose to retain taxable income in excess of current year dividend distributions into the next tax year in an amount less than what would trigger payments of federal income tax under subchapter M of the Code. The Company would then pay a 4% excise tax on such income, as required. To the extent that the Company determines its estimated current year annual taxable income may exceed estimated current year dividend distributions, the Company accrues excise tax on estimated excess taxable income as taxable income is earned. At March 31, 2014 and December 31, 2013, no U.S. federal excise tax was accrued.
The Company accounts for income taxes in conformity with Accounting Standards Codification 740, “Income Taxes” (“ASC Topic 740”). ASC Topic 740 provides guidelines for how uncertain tax positions should be recognized, measured, presented and disclosed in financial statements. ASC Topic 740 requires the evaluation of tax positions taken in the course of preparing the Company’s tax returns to determine whether the tax positions are “more-likely-than-not” to be sustained by the applicable tax authority. Tax benefits of positions not deemed to meet the more-likely-than-not threshold would be recorded as a tax expense in the current year. It is the Company’s policy to recognize accrued interest and penalties related to uncertain tax benefits in income tax expense. There were no material uncertain income tax positions at March 31, 2014 and December 31, 2013. The current and prior three tax years remain subject to examination by U.S. federal and most state tax authorities.
Dividends and distributions: Dividends and distributions to common shareholders are recorded on the declaration date. The timing of dividends and distributions as well as the amount to be paid out as a dividend or distribution is determined by the Board each quarter and is generally based upon the earnings estimated by management. Net realized capital gains, if any, are distributed at least annually, although the Company may decide to retain such capital gains for investment. Dividends and distributions paid in excess of net investment income and realized gains are considered returns of capital to shareholders.
The Company has adopted a dividend reinvestment plan (“DRIP”) that provides for reinvestment of any distributions the Company declares in cash on behalf of its shareholders, unless a shareholder elects to receive cash. As a result, if the Board authorizes and the Company declares a cash distribution, then shareholders who have not “opted out” of the DRIP will have their cash distribution automatically reinvested in additional shares of the Company’s common stock, rather than receiving the cash dividend or distribution.
The Company may use newly issued shares under the guidelines of the DRIP, or the Company may purchase shares in the open market in connection with its obligations under the plan.
Deferred offering costs: The Company defers costs related to its public offerings until completion of the offerings. These costs include professional fees, registration costs, printing, and other miscellaneous offering costs. Deferred offering costs are charged against the proceeds from equity offerings when received.
Deferred financing closing costs: Deferred financing closing costs represent fees and other direct incremental costs incurred in connection with the Company’s borrowings. These amounts are amortized over the life of the borrowings. As of March 31, 2014 and December 31, 2013, unamortized deferred financing closing costs recorded by the Company amounted to $2,893 and $3,043, respectively. For the three months ended March 31, 2014 and 2013, the Company recorded amortization expense of $150 and $469, respectively, on its deferred financing closing costs.
Goodwill and intangible asset: On December 4, 2013, in connection with the Tamarix Acquisitions, the Company recorded goodwill in the amount of $1,077 (see Note 3), which will be tested for impairment in accordance with Accounting Standards Codification 350, “Intangibles-Goodwill and Other” (“ASC Topic 350”).
Also, on December 4, 2013, in connection with the Tamarix Acquisitions, the Company recorded an intangible asset attributable to the SBIC license SBIC I LP holds in the amount of $2,500. The Company amortizes this intangible asset over its estimated useful life, which was determined to be approximately 13 years.
The following table reflects the Company’s estimated amortization expense of its intangible asset for the remainder of 2014 and the years thereafter:
| 16 |
OFS Capital Corporation and Subsidiaries
Notes to Unaudited Consolidated Financial Statements
(Dollar amounts in thousands, except per share data)
| Note 2. | Summary of Significant Accounting Policies (Continued) |
| Remaining nine months of 2014 | $ | 146 | ||
| For year ended December 31, 2015 | 195 | |||
| For year ended December 31, 2016 | 195 | |||
| For year ended December 31, 2017 | 195 | |||
| For year ended December 31, 2018 | 195 | |||
| Thereafter | 1,511 | |||
| Total amortization expense | $ | 2,437 |
Interest expense: Interest expense is recognized on the accrual basis.
Concentration of credit risk: Financial instruments that potentially subject the Company to concentrations of credit risk consist principally of cash deposits at financial institutions. At various times during the year, the Company may exceed the federally insured limits. To mitigate this risk, the Company places cash deposits only with high credit quality institutions. Management believes the risk of loss is minimal.
Recent accounting pronouncements: In June 2013, the FASB issued ASU 2013-08, Financial Services – Investment Companies (Topic 946): Amendments to the Scope, Measurement, and Disclosure Requirements (“ASU 2013-08”), which amends the criteria that define an investment company, clarifies the measurement guidance and requires new disclosures for investment companies. ASU 2013-08 is effective for interim and annual reporting periods in fiscal years that begin after December 15, 2013. The adoption of this guidance did not have a material effect on the Company’s consolidated financial condition.
Note 3. SBIC I LP and SBIC I GP
SBIC I LP is a Delaware limited partnership formed in January 2010, which commenced operations in September 2011. SBIC I LP applied for an SBIC license from the Small Business Administration (“SBA”) in order to become an SBIC regulated fund under the Small Business Investment Company Act of 1958 (the “SBIC Act”). On May 10, 2012, SBIC I LP received the SBIC license.
The objective of SBIC I LP is to generate attractive returns for investors by making investments in United States-based, middle market companies. These investments typically will be comprised of debt-related securities, potentially with warrant coverage. The term of SBIC I LP runs through the later of March 2022 or two years after all of SBIC I LP’s Outstanding Leverage (as defined in the limited partnership agreement of SBIC I LP) has matured. Pursuant to the limited partnership agreement of SBIC I LP and the SBIC Act, a limited partner may not sell, transfer, assign, pledge, subdivide for resale or otherwise dispose of all or any part of its interest in SBIC I LP without the prior written consent of SBIC I GP, the granting or denying of which consent will be in SBIC I GP’s sole and absolute discretion. In addition, a limited partner may not transfer any interest of ten percent or more in the capital of SBIC I LP without the prior approval of the SBA.
In September and November 2011, OFS Capital lent an aggregate of $16,750 to SBIC I LP, which SBIC I LP utilized to originate loans and acquire equity interests in its underlying portfolio companies. From September 2011 through May 10, 2012, SBIC I LP was deemed to be a VIE of OFS Capital under ASC Topic 810, in which OFS Capital was deemed to be the primary beneficiary. Accordingly, SBIC I LP’s financial statements were consolidated into OFS Capital’s during such period. Effective May 10, 2012, upon its licensure as an SBIC fund, SBIC I LP was no longer a VIE, but instead a limited partnership guided under ASC Topic 810. Since OFS Capital continued to hold the controlling interest in SBIC I LP, it continued to consolidate the financial statements of SBIC I LP until July 2012.
| 17 |
OFS Capital Corporation and Subsidiaries
Notes to Unaudited Consolidated Financial Statements
(Dollar amounts in thousands, except per share data)
Note 3. SBIC I LP and SBIC I GP (Continued)
On July 27, 2012, SBIC I LP repaid its loans due to OFS Capital, utilizing the leverage draw from the SBA. Also effective July 27, 2012, the employees directing activities of SBIC I LP (“SBIC Individuals”) resigned as employees from an affiliated entity of OFS Capital. As a result, OFS Capital was no longer deemed to hold the controlling interest in SBIC I LP. Instead, SBIC I GP, as the general partner of SBIC I LP controlled by the SBIC Individuals, obtained the controlling interest in SBIC I LP from OFS Capital. Since OFS Capital no longer held the controlling interest in SBIC I LP, effective July 27, 2012, OFS Capital deconsolidated SBIC I LP’s financial statements from its own and adopted the equity method of accounting to record its equity investment in SBIC I LP. From November 8, 2012, as a result of the Company’s election to become a BDC, through the Tamarix Acquisitions date of December 4, 2013, the Company accounted for its equity investment in SBIC I LP at fair value.
Tamarix Acquisitions
On December 4, 2013, the Company acquired all of the limited partnership interests in SBIC I LP, as well as all of the membership interest in SBIC I GP, that it did not already own, which resulted in SBIC I LP becoming a wholly owned subsidiary of the Company. The Company paid cash of $8,110 for the Tamarix Acquisitions, consisting of $7,951 for the Tamarix LP Acquisition and $159 for the Tamarix GP Acquisition. In connection with the Tamarix Acquisitions, on December 5, 2013, the SBIC Individuals were reemployed by the affiliated entity of OFS Capital, and Tamarix Associates, LLC (“Tamarix Associates”) was terminated as the investment manager of SBIC I LP. Upon the closing of the Tamarix Acquisitions, the Company increased its capital commitment to SBIC I LP, both directly and through SBIC I GP, to $75,000.
The Tamarix Acquisitions were accounted for as a step acquisition in accordance with the Accounting Standards Codification 805, “Business Combinations” (“ASC Topic 805”), under which the Company first remeasured its previously held equity interest in SBIC I LP and SBIC I GP at fair value at December 4, 2013 and recognized the resulting $2,742 gain in earnings. The Company secondly accounted for the excess of the fair value of its previously held equity interest plus acquisition price over the fair value of the total net assets of SBIC I LP and SBIC I GP, totaling $1,077 as goodwill.
In connection with the Tamarix Acquisitions, the Company identified an intangible asset attributable to SBIC I LP’s SBIC license with a fair value of $2,500. In addition, the goodwill recognized on this transaction was attributable to the control OFS Capital obtained upon the Tamarix Acquisitions, which also enabled the Company to consolidate the financial statements of SBIC I LP and SBIC I GP into its own effective December 4, 2013. For tax purposes, OFS Capital amortizes the goodwill over a period of 15 years.
The following table reflects (1) the fair value of the net identifiable assets of SBIC I LP and SBIC I GP on the December 4, 2013 Tamarix Acquisitions date; (2) remeasurement of the Company’s equity interests in SBIC I LP and SBIC I GP at the Tamarix Acquisitions date fair value and recognition of a realized gain, and (3) recording of the excess of the fair value of the previously held equity interest of SBIC I LP and SBIC I GP plus the acquisition price over the fair value of the total net assets of SBIC LP and SBIC I GP as goodwill.
| 18 |
| OFS Capital Corporation and Subsidiaries |
| Notes to Unaudited Consolidated Financial Statements |
| (Dollar amounts in thousands, except per share data) |
Note 3. SBIC I LP and SBIC I GP (Continued)
| Fair value of net identifiable assets on the Tamarix Acquisitions date: | ||||
| Investments | $ | 41,887 | ||
| Cash and cash equivalents | 1,216 | |||
| Interest receivable and other assets | 647 | |||
| Intangible asset | 2,500 | |||
| Total assets | 46,250 | |||
| SBA debentures | (26,000 | ) | ||
| Other liabilities | (251 | ) | ||
| Net assets | $ | 19,999 | ||
| Remeasurement of the Company's equity investments in step acquisition: | ||||
| Fair value of the Company's equity interests on the Tamarix Acquisitions date | $ | 12,966 | ||
| Cost of the Company's equity interest immediately prior to the Tamarix Acquisitions | 10,224 | |||
| Realized gain from step acquisitions | $ | 2,742 | ||
| Goodwill: | ||||
| Acquisition price | $ | 8,110 | ||
| Fair value of the Company's equity interests on Tamarix Acquisitions date | 12,966 | |||
| Less: total net identifiable assets acquired | (19,999 | ) | ||
| Goodwill | $ | 1,077 |
The following unaudited pro forma presentation for the three months ended March 31, 2013 assumes the Tamarix Acquisitions took place on January 1, 2013.
| Historical | Pro Forma | |||||||
| Total investment income | $ | 4,365 | $ | 5,136 | ||||
| Total expenses | 2,923 | 3,126 | ||||||
| Net investment income | 1,442 | 2,010 | ||||||
| Net realized and unrealized gain on investments | 1,429 | 1,445 | ||||||
| Net increase in net assets resulting from operations | $ | 2,871 | $ | 3,455 | ||||
| Net increase in net assets resulting from operations per common share - basic and diluted | $ | 0.30 | $ | 0.36 | ||||
| 19 |
| OFS Capital Corporation and Subsidiaries |
| Notes to Unaudited Consolidated Financial Statements |
| (Dollar amounts in thousands, except per share data) |
Note 4. Related Party Transactions and Subsequent Events
Investment Advisory and Management Agreement: On November 7, 2012, OFS Capital entered into an Investment Advisory and Management Agreement (“Advisory Agreement”) with OFS Capital Management, the Company’s Investment Advisor, under which the Investment Advisor manages the day-to-day operations of, and provides investment advisory services to, OFS Capital. Under the terms of the Advisory Agreement and subject to the overall supervision of our Board, the Investment Advisor is responsible for sourcing potential investments, conducting research and diligence on potential investments and equity sponsors, analyzing investment opportunities, structuring investments and monitoring investments and portfolio companies on an ongoing basis. The Investment Advisor is a subsidiary of OFSAM and a registered investment advisor under the Investment Advisers Act of 1940, as amended.
The Investment Advisor’s services under the Advisory Agreement are not exclusive to the Company and the Investment Advisor is free to furnish similar services to other entities so long as its services to the Company are not impaired. The Investment Advisor receives fees for providing services, consisting of two components—a base management fee and an incentive fee. From the completion of the Company’s IPO through October 31, 2013, the base management fee was calculated at an annual rate of 0.875% based on the average value of the Company’s total assets (other than cash and cash equivalents but including assets purchased with borrowed amounts and including assets owned by any consolidated entity) at the end of the two most recently completed calendar quarters, adjusted for any share issuances or repurchases during the quarter. Beginning on November 1, 2013 and through March 31, 2014, pursuant to the Advisory Agreement, the base management fee was calculated at an annual rate of 1.75% based on the average value of the Company’s total assets (other than cash and cash equivalents but including assets purchased with borrowed amounts and including assets owned by any consolidated entity) at the end of the two most recently completed calendar quarters. The Investment Advisor has elected to exclude from the base management fee calculation any base management fee that would be owed in respect of the intangible asset and goodwill resulting from the Tamarix Acquisitions. The base management fee is payable quarterly in arrears. The base management fee was $1,039 and $512 for the three months ended March 31, 2014 and 2013, respectively.
On May 5, 2014, the Investment Advisor agreed to reduce its base management fee by two-thirds for the nine months commencing April 1, 2014 and ending December 31, 2014. Specifically, for the second, third, and fourth quarters of fiscal 2014, the Investment Advisor has reduced its base management fee from 0.4375% per quarter to 0.145833% per quarter of the average value of the Company’s total assets (other than cash, cash equivalents, and the intangible asset and goodwill resulting from the Tamarix Acquisitions, but including assets purchased with borrowed amounts and including assets owned by any consolidated entity) at the end of the two most recently completed calendar quarters. The purpose of this is to reduce the effective annual base management fee payable to the Investment Advisor pursuant to the terms of the Advisory Agreement by 50% for the 2014 fiscal year. Accordingly, the effective annual base management fee for the 2014 fiscal year will be equal to or less than 50% of the 1.75% required by the Advisory Agreement with the Investment Advisor, or not greater than 0.875%. The Investment Advisor informed the Company that this reduction was being made for the benefit of the Company’s shareholders to take into account unforeseen delays in completing the Tamarix Acquisitions.
The incentive fee has two parts. The first part is calculated and payable quarterly in arrears based on the Company’s pre-incentive fee net investment income for the immediately preceding calendar quarter. For this purpose, pre-incentive fee net investment income means interest income, dividend income and any other income (including any other fees (other than fees for providing managerial assistance), such as commitment, origination, structuring, diligence and consulting fees or other fees received from portfolio companies) accrued during the calendar quarter, minus operating expenses for the quarter (including the base management fee, expenses payable under the Administration Agreement (as defined below), and any interest expense and any dividends paid on any issued and outstanding preferred stock, but excluding the incentive fee).
Pre-incentive fee net investment income includes, in the case of investments with a deferred interest feature (such as OID, debt instruments with payment-in-kind interest and zero coupon securities), accrued income that the Company has not yet received in cash. Pre-incentive fee net investment income is expressed as a rate of return on the value of the Company’s net assets (defined as total assets less indebtedness and before taking into account any incentive fees payable during the period) at the end of the immediately preceding calendar quarter. The incentive fee with respect to the pre-incentive fee net income is 20.00% of the amount, if any, by which the pre-incentive fee net investment income for the immediately preceding calendar quarter exceeds a 2.00% (which is 8.00% annualized) hurdle rate and a “catch-up” provision measured as of the end of each calendar quarter. Under this provision, in any calendar quarter, the Investment Advisor receives no incentive fee until the net investment income equals the hurdle rate of 2.00%, but then receives, as a “catch-up,” 100.00% of the pre-incentive fee net investment income with respect to that portion of such pre-incentive fee net investment income, if any, that exceeds the hurdle rate but is less than 2.5%. The effect of this provision is that, if pre-incentive fee net investment income exceeds 2.5% in any calendar quarter, the Investment Advisor will receive 20.00% of the pre-incentive fee net investment income.
| 20 |
| OFS Capital Corporation and Subsidiaries |
| Notes to Unaudited Consolidated Financial Statements |
| (Dollar amounts in thousands, except per share data) |
Note 4. Related Party Transactions and Subsequent Events (Continued)
Pre-incentive fee net investment income does not include any realized capital gains, realized capital losses or unrealized capital appreciation or depreciation. Because of the structure of the incentive fee, it is possible that the Company may pay an incentive fee in a quarter in which the Company incurs a loss. For example, if the Company receives pre-incentive fee net investment income in excess of the quarterly minimum hurdle rate, the Company will pay the applicable incentive fee even if the Company has incurred a loss in that quarter due to realized and unrealized capital losses. The Company’s net investment income used to calculate this part of the incentive fee is also included in the amount of the Company’s gross assets used to calculate the base management fee. These calculations are appropriately prorated for any period of less than three months and adjusted for any share issuances or repurchases during the current quarter.
The second part of the incentive fee (the “Capital Gain Fee”) is determined and payable in arrears as of the end of each calendar year (or upon termination of the Advisory Agreement, as of the termination date), commencing on December 31, 2012, and equals 20% of the Company’s aggregate realized capital gains, if any, on a cumulative basis from the date of the election to be a BDC through the end of each calendar year, computed net of all realized capital losses and unrealized capital depreciation through the end of such year, less all previous amounts paid in respect of the capital gain incentive fee; provided that the incentive fee determined as of December 31, 2012 was calculated for a period of shorter than twelve calendar months to take into account any realized capital gains computed net of all realized capital losses and unrealized capital depreciation for the period beginning on the date of the Company’s election to be a BDC and ending December 31, 2012.
The Company accrues the Capital Gain Fee if, on a cumulative basis, the sum of net realized capital gains and (losses) plus net unrealized appreciation and (depreciation) is positive. The Investment Advisor has elected to exclude from the Capital Gain Fee calculation any incentive fee that would be owed in respect of the realized gain on step acquisitions resulting from the Tamarix Acquisitions.
The Company did not incur any incentive fee expense for the three months ended March 31, 2014 and 2013.
Administration Agreement: On November 7, 2012, OFS Capital entered into an administration agreement (“Administration Agreement”) with OFS Capital Services, LLC (“OFS Capital Services” or the “Administrator”), a wholly-owned subsidiary of OFSAM. Pursuant to the Administration Agreement, the Administrator furnishes the Company with office facilities and equipment, necessary software licenses and subscriptions and clerical, bookkeeping and record keeping services at such facilities. Under the Administration Agreement, the Administrator performs, or oversees the performance of, the Company’s required administrative services, which include being responsible for the financial records that the Company is required to maintain and preparing reports to its shareholders and all other reports and materials required to be filed with the SEC or any other regulatory authority. In addition, the Administrator assists the Company in determining and publishing its net asset value, oversees the preparation and filing of its tax returns and the printing and dissemination of reports to its shareholders, and generally oversees the payment of the Company’s expenses and the performance of administrative and professional services rendered to the Company by others. Under the Administration Agreement, the Administrator would provide managerial assistance on the Company’s behalf to those portfolio companies that have accepted the Company’s offer to provide such assistance. Payment under the Administration Agreement is equal to an amount based upon the Company’s allocable portion of the Administrator’s overhead in performing its obligations under the Administration Agreement, including rent and the Company’s allocable portion of the cost of its officers, including its chief executive officer, chief financial officer, chief compliance officer, chief accounting officer, and their respective staffs. The administrative fee is payable quarterly in arrears. For the three months ended March 31, 2014 and 2013, the Company incurred an administration fee expense of $475 and $280, respectively.
Other Related Party Transactions:
Due from OFS Capital Management
As of December 31, 2013, OFS Capital Management owed $218 to the Company, as a result of allocation by the Company of a portion of the D&O/E&O insurance expenses to the Investment Advisor under certain joint insurance policies between the two entities. In January 2014, the Investment Advisor paid the $218 owed to the Company.
| 21 |
| OFS Capital Corporation and Subsidiaries |
| Notes to Unaudited Consolidated Financial Statements |
| (Dollar amounts in thousands, except per share data) |
Note 5. Investments
At March 31, 2014, investments consisted of the following:
| Principal | Cost | Fair Value | ||||||||||
| Senior secured debt investments | $ | 218,008 | $ | 215,936 | $ | 210,862 | ||||||
| Subordinated debt investments | 8,859 | 9,057 | 9,032 | |||||||||
| Equity investments | N/A | 7,862 | 8,108 | |||||||||
| Total | $ | 226,867 | $ | 232,855 | $ | 228,002 | ||||||
At March 31, 2014, the Company’s investments were all domiciled in the United States and the industry compositions of the Company’s portfolio were as follows:
| Cost | Fair Value | |||||||||||||||
| Aerospace & Defense | $ | 15,914 | 6.8 | % | $ | 15,842 | 7.0 | % | ||||||||
| Automotive | 7,114 | 3.1 | 7,109 | 3.1 | ||||||||||||
| Banking, Finance, Insurance & Real Estate | 28,729 | 12.3 | 28,777 | 12.6 | ||||||||||||
| Capital Equipment | 7,888 | 3.4 | 7,851 | 3.4 | ||||||||||||
| Chemicals, Plastics & Rubber | 19,403 | 8.3 | 19,404 | 8.5 | ||||||||||||
| Construction & Building | 1,788 | 0.8 | 1,799 | 0.8 | ||||||||||||
| Consumer goods: Non-durable | 7,637 | 3.3 | 7,474 | 3.3 | ||||||||||||
| Containers, Packaging & Glass | 4,174 | 1.8 | 4,174 | 1.8 | ||||||||||||
| Energy: Oil & Gas | 7,060 | 3.0 | 7,139 | 3.1 | ||||||||||||
| Environmental Industries | 7,811 | 3.4 | 7,771 | 3.4 | ||||||||||||
| Healthcare & Pharmaceuticals | 51,570 | 22.1 | 49,369 | 21.7 | ||||||||||||
| High Tech Industries | 7,901 | 3.4 | 7,845 | 3.4 | ||||||||||||
| Media: Advertising, Printing & Publishing | 9,108 | 3.9 | 9,194 | 4.0 | ||||||||||||
| Media: Broadcasting & Subscription | 4,141 | 1.8 | 4,216 | 1.8 | ||||||||||||
| Retail | 3,977 | 1.7 | 3,987 | 1.7 | ||||||||||||
| Services: Business | 35,774 | 15.4 | 33,175 | 14.6 | ||||||||||||
| Services: Consumer | 5,415 | 2.3 | 5,592 | 2.6 | ||||||||||||
| Telecommunications | 7,451 | 3.2 | 7,284 | 3.2 | ||||||||||||
| $ | 232,855 | 100.0 | % | $ | 228,002 | 100.0 | % | |||||||||
| 22 |
| OFS Capital Corporation and Subsidiaries |
| Notes to Unaudited Consolidated Financial Statements |
| (Dollar amounts in thousands, except per share data) |
Note 5. Investments (Continued)
At December 31, 2013, investments consisted of the following:
| Principal | Cost | Fair Value | ||||||||||
| Senior secured debt investments | $ | 228,876 | $ | 226,552 | $ | 221,546 | ||||||
| Subordinated debt investments | 8,790 | 9,009 | 9,008 | |||||||||
| Equity investments | N/A | 7,862 | 7,365 | |||||||||
| Total | $ | 237,666 | $ | 243,423 | $ | 237,919 | ||||||
At December 31, 2013, the Company’s investments were all domiciled in the United States and the industry compositions of the Company’s portfolio were as follows:
| Cost | Fair Value | |||||||||||||||
| Aerospace & Defense | $ | 15,996 | 6.6 | % | $ | 15,721 | 6.6 | % | ||||||||
| Automotive | 7,161 | 2.9 | 7,161 | 3.0 | ||||||||||||
| Banking, Finance, Insurance & Real Estate | 29,035 | 11.9 | 29,102 | 12.2 | ||||||||||||
| Beverage, Food & Tobacco | 7,072 | 2.9 | 7,099 | 3.0 | ||||||||||||
| Capital Equipment | 7,950 | 3.3 | 7,908 | 3.3 | ||||||||||||
| Chemicals, Plastics & Rubber | 19,596 | 8.1 | 19,526 | 8.2 | ||||||||||||
| Construction & Building | 1,874 | 0.8 | 1,888 | 0.8 | ||||||||||||
| Consumer goods: Non-durable | 7,642 | 3.1 | 7,428 | 3.1 | ||||||||||||
| Containers, Packaging & Glass | 4,235 | 1.7 | 4,231 | 1.8 | ||||||||||||
| Energy: Oil & Gas | 7,148 | 2.9 | 7,235 | 3.0 | ||||||||||||
| Environmental Industries | 7,818 | 3.2 | 7,754 | 3.3 | ||||||||||||
| Healthcare & Pharmaceuticals | 55,585 | 22.8 | 52,512 | 22.1 | ||||||||||||
| High Tech Industries | 5,009 | 2.1 | 4,921 | 2.1 | ||||||||||||
| Media: Advertising, Printing & Publishing | 9,609 | 4.0 | 9,701 | 4.1 | ||||||||||||
| Media: Broadcasting & Subscription | 4,223 | 1.7 | 4,305 | 1.8 | ||||||||||||
| Retail | 4,091 | 1.7 | 4,092 | 1.7 | ||||||||||||
| Services: Business | 36,505 | 15.0 | 34,637 | 14.5 | ||||||||||||
| Services: Consumer | 5,403 | 2.2 | 5,403 | 2.3 | ||||||||||||
| Telecommunications | 7,471 | 3.1 | 7,295 | 3.1 | ||||||||||||
| $ | 243,423 | 100.0 | % | $ | 237,919 | 100.0 | % | |||||||||
| 23 |
| OFS Capital Corporation and Subsidiaries |
| Notes to Unaudited Consolidated Financial Statements |
| (Dollar amounts in thousands, except per share data) |
Note 6. Fair Value of Financial Instruments
The Company follows ASC Topic 820 for measuring fair value. Fair value is the price that would be received to sell an asset or paid to transfer a liability in an orderly transaction between market participants at the measurement date and sets out a fair value hierarchy. The fair value hierarchy gives the highest priority to quoted prices in active markets for identical assets or liabilities (Level 1) and the lowest priority to unobservable inputs (Level 3). Inputs are broadly defined under ASC Topic 820 as assumptions market participants would use in pricing an asset or liability. The three levels of the fair value hierarchy under ASC Topic 820 are described below:
Level 1: Unadjusted quoted prices in active markets for identical assets or liabilities that the reporting entity has the ability to access at the measurement date.
Level 2: Inputs other than quoted prices within Level 1 that are observable for the asset or liability, either directly or indirectly; and fair value is determined through the use of models or other valuation methodologies.
Level 3: Inputs are unobservable for the asset or liability and include situations where there is little, if any, market activity for the asset or liability. The inputs into the determination of fair value are based upon the best information under the circumstances and may require significant management judgment or estimation.
In certain cases, the inputs used to measure fair value may fall into different levels of the fair value hierarchy. In such cases, an investment’s level within the fair value hierarchy is based on the lowest level of input that is significant to the fair value measurement. The Company’s assessment of the significance of a particular input to the fair value measurement in its entirety requires judgment, and considers factors specific to the investment.
The Company assesses the levels of the investments at each measurement date, and transfers between levels are recognized on the subsequent measurement date closest in time to the actual date of the event or change in circumstances that caused the transfer. There were no transfers among Level 1, 2 and 3 for the three months ended March 31, 2014 or 2013. The following sections describe the valuation techniques used by the Company to measure different financial instruments at fair value and include the levels within the fair value hierarchy in which the financial instruments are categorized.
Investments for which prices are not observable by the Company are generally private investments in the equity and debt securities of operating companies. The primary analytical method used to estimate the fair value of these Level 3 investments is the discounted cash flow method (although a liquidation analysis, option theoretical, or other methodology may be used when more appropriate). The discounted cash flow approach to determine fair value (or a range of fair values) involves applying an appropriate discount rate(s) to the estimated future cash flows using various relevant factors depending on investment type, including assumed growth rate (in cash flows) and capitalization rates/multiples (for determining terminal values of underlying portfolio companies). The valuation based on the inputs determined to be the most reasonable and probable is used as the fair value of the investment. The determination of fair value using these methodologies may take into consideration a range of factors including, but not limited to, the price at which the investment was acquired, the nature of the investment, local market conditions, trading values on public exchanges for comparable securities, current and projected operating performance, and financing transactions subsequent to the acquisition of the investment. Application of these valuation methodologies involves a significant degree of judgment by management.
To assess the reasonableness of the discounted cash flow approach, the fair value of equity securities, including warrants, in portfolio companies may also consider the market approach—that is, through analyzing, and applying to the underlying portfolio companies, market valuation multiples of publicly-traded firms engaged in businesses similar to those of the portfolio companies. The market approach to determining the fair value of a portfolio company’s equity security (or securities) will typically involve: (1) applying to the portfolio company’s trailing twelve months (or current year projected) EBITDA a low to high range of enterprise value to EBITDA multiples that are derived from an analysis of publicly-traded comparable companies, in order to arrive at a range of enterprise values for the portfolio company; (2) subtracting from the range of calculated enterprise values the outstanding balances of any debt or equity securities that would be senior in right of payment to the equity securities held by the Company; and (3) multiplying the range of equity values derived therefrom by the Company’s ownership share of such equity tranche in order to arrive at a range of fair values for the Company’s equity security (or securities). Application of these valuation methodologies involves a significant degree of judgment by management.
| 24 |
| OFS Capital Corporation and Subsidiaries |
| Notes to Unaudited Consolidated Financial Statements |
| (Dollar amounts in thousands, except per share data) |
Note 6. Fair Value of Financial Instruments (Continued)
Equity in a portfolio company that invests in loans will typically be valued by arriving at a fair value of such vehicle’s loan assets (plus, when appropriate, the carrying value of certain other assets), and deducting the book value or fair value (as appropriate) of such vehicle’s liabilities to arrive at a fair value for the equity. When appropriate, in order to recognize value that would be created by growth opportunities of such portfolio company, equity in a portfolio company may also be valued by taking into consideration the magnitude, timing, and effective life of its expected future investments in loans.
Due to the inherent uncertainty of determining the fair value of Level 3 investments that do not have a readily available market value, the fair value of the investments may differ significantly from the values that would have been used had a ready market existed for such investments and may differ materially from the values that may ultimately be received or settled. Further, such investments are generally subject to legal and other restrictions or otherwise are less liquid than publicly traded instruments. If the Company were required to liquidate a portfolio investment in a forced or liquidation sale, the Company might realize significantly less than the value at which such investment had previously been recorded. With respect to Level 3 investments, where sufficient market quotations are not readily available or for which no or an insufficient number of indicative prices from pricing services or brokers or dealers have been received, the Company undertakes, on a quarterly basis, a valuation process as described below:
| • | For each debt investment, a basic credit rating review process is completed. The risk rating on every credit facility is reviewed and either reaffirmed or revised by the Investment Advisor’s investment committee. |
| • | Each portfolio company or investment is valued by an investment professional. |
| • | Preliminary valuation conclusions are then documented and discussed with individual members of the Investment Advisor’s investment committee. |
| • | The preliminary valuations are then submitted to the Investment Advisor’s investment committee for ratification. |
| • | Third party valuation firm(s) are engaged to provide valuation services as requested, by reviewing the investment committee’s preliminary valuations. The Investment Advisor’s investment committee’s preliminary fair value conclusions on each of the Company’s assets for which sufficient market quotations are not readily available are reviewed and assessed by a third-party valuation firm at least once in every 12-month period, and more often as determined by the Company’s Board or required by the Company’s valuation policy. Such valuation assessment may be in the form of positive assurance, range of values or other valuation method based on the discretion of the Company’s Board. |
| • | The Company’s Board discusses valuations and determines the fair value of each investment in the portfolio in good faith based on the input of OFS Capital Management and, where appropriate, the respective independent valuation firms. |
The Company’s investments are subject to market risk. Market risk is the potential for changes in the value of investments due to market changes. Market risk is directly impacted by the volatility and liquidity in the markets in which the investments are traded. The Company manages its exposure to market risk related to its investments through monitoring the financial condition of its investments, as well as the volatility and liquidity trends of the markets in which it trades.
The following tables present fair value measurements of the Company’s investments and indicate the fair value hierarchy of the valuation techniques utilized by the Company to determine such fair value:
| March 31, 2014 | ||||||||||||||||
| Fair Value Measurements Using | ||||||||||||||||
| Description | (Level I) | (Level II) | (Level III) | Total | ||||||||||||
| Assets: | ||||||||||||||||
| Senior secured debt investments | $ | - | $ | - | $ | 210,862 | $ | 210,862 | ||||||||
| Subordinated debt investments | - | - | 9,032 | 9,032 | ||||||||||||
| Equity investments | - | - | 8,108 | 8,108 | ||||||||||||
| Money market funds * | 32,479 | - | - | 32,479 | ||||||||||||
| Total | $ | 32,479 | $ | - | $ | 228,002 | $ | 260,481 | ||||||||
* included in cash and cash equivalents and restricted cash and cash equivalents on the consolidated balance sheet.
| 25 |
| OFS Capital Corporation and Subsidiaries |
| Notes to Unaudited Consolidated Financial Statements |
| (Dollar amounts in thousands, except per share data) |
Note 6. Fair Value of Financial Instruments (Continued)
| March 31, 2014 | ||||||||||||||||
| Fair Value Measurements Using | ||||||||||||||||
| Description | (Level I) | (Level II) | (Level III) | Total | ||||||||||||
| Assets: | ||||||||||||||||
| Non-control/non-affiliate investments | $ | - | $ | - | $ | 188,242 | $ | 188,242 | ||||||||
| Affiliate investments | - | - | 33,314 | 33,314 | ||||||||||||
| Control investment | - | - | 6,446 | 6,446 | ||||||||||||
| Money market funds * | 32,479 | - | - | 32,479 | ||||||||||||
| Total | $ | 32,479 | $ | - | $ | 228,002 | $ | 260,481 | ||||||||
* included in cash and cash equivalents and restricted cash and cash equivalents on the consolidated balance sheet.
As of March 31, 2014, the Company had 54 senior loans and two subordinated loans as well as equity investments in eight portfolio companies. The following table presents quantitative information about the significant unobservable inputs of the Company’s Level 3 debt and equity investments as of March 31, 2014:
| Fair Value at | Range | |||||||||
| March 31, 2014 | Valuation techniques | Unobservable input | (Weighted average) | |||||||
| Debt investments: | ||||||||||
| Senior secured | 210,862 | Discounted cash flow | Discount rates | 6.11% - 25.00% (9.06%) | ||||||
| EBITDA multiples | 4.00x - 10.00x (6.78x) | |||||||||
| Subordinated | 9,032 | Discounted cash flow | Discount rates | 13.15% - 15.00% (14.23%) | ||||||
| EBITDA multiples | 3.98x - 5.17x (4.67x) | |||||||||
| Equity investments: | 8,108 | Discounted cash flow | Discount rates | 12.50% - 40.00% | ||||||
| EBITDA multiples | 3.98x - 9.48x | |||||||||
| Market approach | EBITDA multiples | 3.96x - 12.61x | ||||||||
| December 31, 2013 | ||||||||||||||||
| Fair Value Measurements Using | ||||||||||||||||
| Description | (Level I) | (Level II) | (Level III) | Total | ||||||||||||
| Assets: | ||||||||||||||||
| Senior secured debt investments | $ | - | $ | - | $ | 221,546 | $ | 221,546 | ||||||||
| Subordinated debt investments | - | - | 9,008 | 9,008 | ||||||||||||
| Equity investments | - | - | 7,365 | 7,365 | ||||||||||||
| Money market funds * | 24,869 | - | 24,869 | |||||||||||||
| Total | $ | 24,869 | $ | - | $ | 237,919 | $ | 262,788 | ||||||||
* included in cash and cash equivalents and restricted cash and cash equivalents on the consolidated balance sheet.
| 26 |
| OFS Capital Corporation and Subsidiaries |
| Notes to Unaudited Consolidated Financial Statements |
| (Dollar amounts in thousands, except per share data) |
Note 6. Fair Value of Financial Instruments (Continued)
| December 31, 2013 | ||||||||||||||||
| Fair Value Measurements Using | ||||||||||||||||
| Description | (Level I) | (Level II) | (Level III) | Total | ||||||||||||
| Assets: | ||||||||||||||||
| Non-control/non-affiliate investments | $ | - | $ | - | $ | 197,338 | $ | 197,338 | ||||||||
| Affiliate investments | - | - | 32,735 | 32,735 | ||||||||||||
| Control investment | - | - | 7,846 | 7,846 | ||||||||||||
| Money market funds * | 24,869 | - | 24,869 | |||||||||||||
| Total | $ | 24,869 | $ | - | $ | 237,919 | $ | 262,788 | ||||||||
* included in cash and cash equivalents and restricted cash and cash equivalents on the consolidated balance sheet.
As of December 31, 2013, the Company had 56 senior loans and two subordinated loans as well as equity investments in eight portfolio companies. The following table presents quantitative information about the significant unobservable inputs of the Company’s Level 3 debt and equity investments as of December 31, 2013:
| Fair Value at | ||||||||||
| December 31, | Range | |||||||||
| 2013 | Valuation techniques | Unobservable input | (Weighted average) | |||||||
| Debt investments: | ||||||||||
| Senior secured | 221,546 | Discounted cash flow | Discount rates | 5.82% - 25.00% (8.92%) | ||||||
| EBITDA multiples | 4.00x - 10.10x (6.70x) | |||||||||
| Subordinated | 9,008 | Discounted cash flow | Discount rates | 13.13% - 15.00% (14.21%) | ||||||
| EBITDA multiples | 3.98x - 5.17x (4.67x) | |||||||||
| Equity investments: | 7,365 | Discounted cash flow | Discount rates | 20.00% - 40.00% | ||||||
| EBITDA multiples | 3.98x - 9.48x | |||||||||
| Market approach | EBITDA multiples | 3.47x - 11.86x | ||||||||
Changes in credit quality (which would impact the discount rate), as well as changes in EBITDA multiples, could have a significant impact on fair values, with the fair value of a particular debt investment susceptible to change in inverse relation to the changes in the discount rate. Changes in EBITDA multiples, as well as changes in the discount rate, could have a significant impact on fair values, with the fair value of an equity investment susceptible to change in tandem with the changes in EBITDA multiples, and in inverse relation to changes in the discount rate.
The following tables presents changes in investments measured at fair value using Level 3 inputs for the three months ended March 31, 2014 and 2013.
| 27 |
| OFS Capital Corporation and Subsidiaries |
| Notes to Unaudited Consolidated Financial Statements |
| (Dollar amounts in thousands, except per share data) |
Note 6. Fair Value of Financial Instruments (Continued)
| For the Three Months Ended | ||||||||||||||||
| March 31, 2014 | ||||||||||||||||
| Senior | Subordinated | |||||||||||||||
| Secured Debt | Debt | Equity | ||||||||||||||
| Investments | Investments | Investments | Total | |||||||||||||
| Level 3 assets, beginning of period | $ | 221,546 | $ | 9,008 | $ | 7,365 | $ | 237,919 | ||||||||
| Net change in unrealized depreciation on non-control/non-affiliate investments | 529 | - | 397 | 926 | ||||||||||||
| Net change in unrealized appreciation on affiliate investments | 199 | (26 | ) | 346 | 519 | |||||||||||
| Net change in unrealized depreciation on control investment | (794 | ) | - | - | (794 | ) | ||||||||||
| Purchase of portfolio investments | 8,901 | - | - | 8,901 | ||||||||||||
| Capitalized PIK interest | 57 | 69 | - | 126 | ||||||||||||
| Proceeds from principal payments on portfolio investments | (19,899 | ) | - | - | (19,899 | ) | ||||||||||
| Amortization of discounts and premium | 323 | (19 | ) | - | 304 | |||||||||||
| Level 3 assets, end of period | $ | 210,862 | $ | 9,032 | $ | 8,108 | $ | 228,002 | ||||||||
| For the Three Months Ended | ||||||||||||
| March 31, 2013 | ||||||||||||
| Senior | ||||||||||||
| Secured Debt | Equity | |||||||||||
| Investments | Investments | Total | ||||||||||
| Level 3 assets, beginning of period | $ | 227,542 | $ | 4,657 | $ | 232,199 | ||||||
| Net change in unrealized depreciation on non-control/non-affiliate investments | 1,173 | - | 1,173 | |||||||||
| Net change in unrealized depreciation on affiliate investments | - | 251 | 251 | |||||||||
| Additional equity investments in SBIC I LP | - | 2,618 | 2,618 | |||||||||
| Purchase of portfolio investments | 7,507 | - | 7,507 | |||||||||
| Proceeds from principal payments on portfolio investments | (10,596 | ) | - | (10,596 | ) | |||||||
| Sale of portfolio investments | (4,708 | ) | - | (4,708 | ) | |||||||
| Amortization of discounts and premium | 329 | - | 329 | |||||||||
| Level 3 assets, end of period | $ | 221,247 | $ | 7,526 | $ | 228,773 | ||||||
The net change in unrealized appreciation (depreciation) for the three months ended March 31, 2014 and 2013 reported within the net change in unrealized appreciation (depreciation) on investments in the Company’s consolidated statements of operations attributable to the Company’s Level 3 assets held at March 31, 2014 and 2013 was $702 and $1,081, respectively.
The Company discloses fair value information about financial instruments, whether or not recognized in the balance sheet at fair value, for which it is practicable to estimate that value. Certain financial instruments are excluded from the disclosure requirements. Accordingly, the aggregate fair value amounts presented do not represent the underlying value of the Company.
The information presented should not be interpreted as an estimate of the fair value of the entire company since a fair value calculation is only required for a limited portion of the Company’s assets and liabilities. Due to the wide range of valuation techniques and the degree of subjectivity used in making the estimates, comparisons between the Company’s disclosures and those of other companies may not be meaningful.
As of March 31, 2014 and December 31, 2013, the carrying value of the Company’s financial instruments, including its debt obligations under the revolving line of credit, as well as its SBA debentures payable, approximated their estimated fair value.
| 28 |
| OFS Capital Corporation and Subsidiaries |
| Notes to Unaudited Consolidated Financial Statements |
| (Dollar amounts in thousands, except per share data) |
Note 7. Commitments and Contingencies
At March 31, 2014 and December 31, 2013, the Company had $4,750 of total unfunded commitments for three portfolio companies.
On December 4, 2013, upon completion of the Tamarix Acquisitions, the Company’s committed investment in SBIC I LP, directly and indirectly via its investment in SBIC I GP, was increased to $75,000. As of March 31, 2014, the Company’s unfunded commitment to SBIC I LP was $13,562.
From time to time, the Company is involved in legal proceedings in the normal course of its business. Although the outcome of such litigation cannot be predicted with any certainty, management is of the opinion, based on the advice of legal counsel, that final disposition of any litigation should not have a material adverse effect on the financial position of the Company.
In the normal course of business, the Company enters into contracts and agreements that contain a variety of representations and warranties that provide general indemnifications. The Company’s maximum exposure under these arrangements is unknown, as this would involve future claims that may be made against the Company that have not occurred. The Company believes the risk of any material obligation under these indemnifications to be low.
Note 8. Revolving Line of Credit
On September 28, 2010, OFS Capital WM entered into a $180,000 secured revolving credit facility (as amended from time to time, the “OFS Capital WM Credit Facility”) with Wells Fargo Bank, N.A. (“Wells Fargo”) and Madison Capital Funding, LLC (“Madison Capital”), with the Class A lenders (initially Wells Fargo) providing up to $135,000 in Class A loans (“Class A Facility”) and the Class B lenders (initially Madison Capital) providing up to $45,000 in Class B loans (“Class B Facility”). The OFS Capital WM Credit Facility is secured by all current and future eligible loans acquired by OFS Capital WM. The loan facilities with Wells Fargo and Madison Capital had five- and six-year terms, respectively, and both facilities provided a one-year option for extension upon the approval of the Class A and Class B lenders. The loan facilities had a reinvestment period of two years after the closing date of the OFS Capital WM Credit Facility, which could be extended by one year with the consent of each lender. Outstanding borrowings on the loan facilities were limited to the lesser of (1) $180,000 and (2) the borrowing base as defined by the OFS Capital WM Credit Facility loan documents. OFS Capital WM is obligated to pay interest on the outstanding Class A loans (and on the Class B loans until the termination of the Class B Facility in January 2013) on each quarterly payment date. In connection with the closing of the OFS Capital WM Credit Facility, OFS Capital WM incurred financing costs of $3,501, which were deferred and amortized over the term of OFS Capital WM Credit Facility.
Under the OFS Capital WM Credit Facility, MCF Capital Management LLC, which is the loan manager and also an affiliated entity of Madison Capital (“Loan Manager”), charges both a senior and subordinated management fee to OFS Capital WM for its services, each at 0.25% per annum of the assigned value of the underlying portfolio investments, which value is determined by the Controlling Lender (as defined in the OFS Capital WM loan documents), plus an accrued fee that is deferred until after the end of the investment period of the portfolio investments. For the three months ended March 31, 2014 and 2013, the Company incurred management fee expense of $225 and $295, respectively, to the Loan Manager.
On September 28, 2012, the OFS Capital WM Credit Facility was amended, in connection with which OFS Capital WM incurred financing costs of $675. The deferred financing closing costs under the amended OFS Capital WM Credit Facility, together with the original unamortized deferred financing closing costs of $2,350 at September 28, 2012, are being amortized over the term of the OFS Capital WM Credit Facility.
On January 22, 2013, the OFS Capital WM Credit Facility was further amended, pursuant to which the Class B Facility, on which there was no outstanding balance, was terminated. As a result, the OFS Capital WM Credit Facility commitment was reduced from $180,000 to $135,000. In connection with the termination of the Class B Facility, OFS Capital WM wrote off unamortized deferred financing closing costs attributable to the Class B loan in the amount of $299.
On November 22, 2013, the OFS Capital WM Credit Facility was further amended. Pursuant to the amendment, (1) the loan with Wells Fargo was extended to December 31, 2018; (2) the reinvestment period for the Wells Fargo loan was extended to December 31, 2015; (3) the accrued interest rate on outstanding Class A loans was amended to LIBOR plus 2.50% per annum, and (4) the advance rate on borrowing was increased from 65% to 70%. In connection with the amendment, OFS Capital WM incurred financing costs of $1,168. The deferred financing closing costs, together with the unamortized deferred financing closing costs of $1,940 at November 22, 2013, are being amortized over the amended term of the OFS Capital WM Credit Facility.
| 29 |
| OFS Capital Corporation and Subsidiaries |
| Notes to Unaudited Consolidated Financial Statements |
| (Dollar amounts in thousands, except per share data) |
Note 8. Revolving Line of Credit (Continued)
The interest rates on the revolving line of credit borrowings at March 31, 2014 and December 31, 2013 were 2.73% and 2.75%, respectively. For the three months ended March 31, 2014 and 2013, interest expense on the revolving line of credit totaled $789 and $847, respectively.
On January 17, 2014, the OFS Capital WM Credit Facility was amended again, pursuant to which the calculation of the borrowing base was adjusted and the minimum equity requirement was lowered from $65,000 to $50,000, resulting in additional liquidity for the Company. No financing costs were incurred in connection with this amendment. Availability under the OFS Capital WM Credit Facility as of March 31, 2014 was $14,684.
Deferred financing closing costs, net of accumulated amortization, on the OFS Capital WM Credit Facility as of March 31, 2014 and December 31, 2013 were $2,893 and $3,043, respectively. For the three months ended March 31, 2014 and 2013, amortization of deferred financing closing costs on the revolving line of credit totaled $150 and $170, respectively.
Note 9. SBA Debentures Payable
Upon the completion of the Tamarix Acquisitions, effective December 4, 2013, the Company consolidated the financial statements of SBIC I LP into its own and SBIC I LP’s SBA debentures payable are reflected on the Company’s consolidated balance sheet.
The SBIC license allows SBIC I LP to obtain leverage by issuing SBA-guaranteed debentures, subject to issuance of a capital commitment by the SBA and customary procedures. These debentures are non-recourse to the Company, have interest payable semi-annually and a ten-year maturity. The interest rate is fixed at the time of issuance at a market-driven spread over U.S. Treasury Notes with ten-year maturities.
Under present SBIC regulations, the maximum amount of SBA-guaranteed debt that may be issued by a single SBIC licensee is $150,000. An SBIC fund may borrow up to two times the amount of its regulatory capital, subject to customary regulatory requirements. In connection with the Tamarix Acquisitions, the Company increased to $75,000 its total commitments to SBIC I LP, which became a drop down SBIC fund of the Company on December 4, 2013. As of March 31, 2014, the Company had funded $61,438 of the $75,000 commitment. As of March 31, 2014, SBIC I LP had leverage commitments of $61,438 from the SBA, and $26,000 of outstanding SBA-guaranteed debentures, leaving incremental borrowing capacity of $35,438, under present SBIC regulations. As of December 31, 2013, SBIC I LP had leverage commitments of $49,438 from the SBA, and $26,000 of outstanding SBA-guaranteed debentures, leaving incremental borrowing capacity of $23,438. In order to access the full $150,000 in SBA-guaranteed debentures potentially available to it under the SBIC license held by SBIC I LP, OFS Capital will need to fund an additional $13,562 into SBIC I LP. There can be no assurance as to when, or whether, OFS Capital will be able to invest the additional $13,562 into SBIC I LP.
The following table shows the Company’s outstanding SBA debentures payable as of March 31, 2014 and December 31, 2013:
| Fixed | March 31, | December 31, | ||||||||||||
| Pooling Date | Maturity Date | Interest Rate | 2014 | 2013 | ||||||||||
| September 19, 2012 | September 1, 2022 | 3.049 | % | $ | 14,000 | $ | 14,000 | |||||||
| September 25, 2013 | September 1, 2023 | 4.448 | 7,000 | 7,000 | ||||||||||
| March 26, 2014 * | March 1, 2024 | 3.995 | 5,000 | 5,000 | ||||||||||
| Total SBA debentures outstanding | $ | 26,000 | $ | 26,000 | ||||||||||
| * | The SBA has scheduled pooling dates in March and September of each year. SBA debentures issued between pooling dates use an interim rate and will be fixed at the next pooling date. At December 31, 2013, the interim interest rate on the $5,000 debenture was 1.450%. |
The Company received exemptive relief from the Securities and Exchange Commission (“SEC”) effective November 26, 2013. The exemptive relief allows OFS Capital to exclude SBA-guaranteed debentures from the definition of senior securities in the statutory 200% asset coverage ratio.
| 30 |
| OFS Capital Corporation and Subsidiaries |
| Notes to Unaudited Consolidated Financial Statements |
| (Dollar amounts in thousands, except per share data) |
Note 9. SBA Debentures Payable (Continued)
The weighted average interest rate on the SBA debentures as of March 31, 2014 and December 31, 2013 was 3.61% and 3.12%, respectively. For the three months ended March 31, 2014, interest expense on the SBA debentures was $202.
Note 10. Financial Highlights
The financial highlights for the Company are as follows:
| Three Months Ended March 31, | ||||||||
| 2014 | 2013 | |||||||
| Per share data: | ||||||||
| Net asset value at beginning of period | $ | 14.58 | $ | 14.80 | ||||
| Dividends and distributions | (0.34 | )(5) | (0.34 | )(5) | ||||
| Net investment income | 0.15 | 0.15 | ||||||
| Net realized gain on non/control/non-affiliate investments | - | - | ||||||
| Net change in unrealized depreciation on non-control/ non-affiliate investments | 0.09 | 0.12 | ||||||
| Net change in unrealized appreciation/depreciation on affiliate investments | 0.05 | 0.03 | ||||||
| Net change in unrealized depreciation on control investment | (0.08 | ) | - | |||||
| Net asset value at end of period | $ | 14.45 | $ | 14.76 | ||||
| Per share market value, end of period | $ | 12.51 | $ | 14.00 | ||||
| Total return based on market value | 0.2 | %(1) | 4.7 | %(1) | ||||
| Shares outstanding at end of period | 9,632,453 | 9,613,582 | ||||||
| Ratios to average net assets: | ||||||||
| Expense without incentive fees | 10.5 | %(2) | 8.4 | %(2) | ||||
| Incentive fees | - | (2) | - | (2) | ||||
| Total expenses | 10.5 | %(2) | 8.4 | %(2) | ||||
| Net investment income without incentive fees | 4.1 | %(2) | 4.1 | %(2) | ||||
| Average net asset value | $ | 139,784 | (3) | $ | 141,851 | (4) | ||
| (1) | Calculation is ending market value less beginning market value, adjusting for dividends and distributions. |
| (2) | Annualized. |
| (3) | Based on the average net asset values at December 31, 2013 and March 31, 2014. |
| (4) | Based on the average net asset values at December 31, 2012 and March 31, 2013. |
| (5) | Of the $0.34 per share dividend and distributions, approximately $0.19 per share and $0.18 per share represented a tax return of capital to the Company’s shareholders as of March 31, 2014 and 2013, respectively, if the characteristics of such distributions were determined at March 31, 2014 and 2013, respectively. |
Note 11. Dividends and Distributions
The Company records dividends and distributions on the declaration date. The Company determines if a portion of its distributions may be deemed a tax return of capital to its shareholders at the end of each fiscal year. However, if the characteristics of such distributions were determined as of March 31, 2014, the Company estimates that approximately $0.19 per share would have been characterized as a tax return of capital to its shareholders.
The following table summarizes dividends and distributions declared and paid from inception to March 31, 2014:
| 31 |
| OFS Capital Corporation and Subsidiaries |
| Notes to Unaudited Consolidated Financial Statements |
| (Dollar amounts in thousands, except per share data) |
Note 11. Dividends and Distributions (Continued)
| Amount | ||||||||||||
| Date Declared | Record Date | Payment Date | Per Share | Total Amount | ||||||||
| Period November 8, 2012 to December 31, 2012 | ||||||||||||
| November 26, 2012 (1) | January 17, 2013 | January 31, 2013 | $ | 0.17 | $ | 1,628 | ||||||
| Year ended December 31, 2013 | ||||||||||||
| March 26, 2013 | April 17, 2013 | April 30, 2013 | 0.34 | 3,269 | ||||||||
| June 25, 2013 | July 17, 2013 | July 31, 2013 | 0.34 | 3,272 | ||||||||
| September 25, 2013 | October 17, 2013 | October 31, 2013 | 0.34 | 3,273 | ||||||||
| Total declared for the year ended December 31, 2013 | $ | 1.02 | $ | 9,814 | ||||||||
| Year ended December 31, 2014 | ||||||||||||
| January 21, 2014 | January 31, 2014 | February 14, 2014 | $ | 0.34 | $ | 3,274 | ||||||
(1) - Represented the dividend declared in the specified quarter, which, if prorated for the number of days remaining in the fourth quarter after the IPO in November 2012, would be $0.34 per share.
The Company has adopted a DRIP that provides for reinvestment of any distributions the Company declares in cash on behalf of its shareholders, unless a shareholder elects to receive cash. The following table summarizes dividend reinvestment plan activity for the three months ended March 31, 2014 and 2013.
| Three Months Ended March 31, | ||||||||
| 2014 | 2013 | |||||||
| Shares issued | 2,656 | 34,891 | ||||||
| Average price per share | $ | 12.85 | $ | 14.37 | ||||
Note 12. Earnings per Share
The following table summarizes the calculations for basic and diluted net increase in net assets resulting from operations per common share for the three months ended March 31, 2014 and 2013.
| Three Months Ended March 31, | ||||||||
| 2014 | 2013 | |||||||
| Net increase in net assets resulting from operations | $ | 2,051 | $ | 2,871 | ||||
| Basic and diluted weighted average shares outstanding | 9,631,155 | 9,601,952 | ||||||
| Net increase in net assets resulting from operations per common share - basic and diluted | $ | 0.21 | $ | 0.30 | ||||
Note 13. Subsequent Events Not Disclosed Elsewhere
On May 7, 2014, the Company’s Board declared a distribution of $0.34 per share for the 2014 second quarter, payable on June 30, 2014 to shareholders of record as of June 16, 2014.
| 32 |
Item 2. Management’s Discussion and Analysis of Financial Condition and Results of Operations
Forward-Looking Statements
This quarterly report on Form 10-Q contains forward-looking statements that involve substantial risks and uncertainties. These forward-looking statements are not historical facts, but rather are based on current expectations, estimates and projections about us, our current and prospective portfolio investments, our industry, our beliefs, and our assumptions. Words such as “anticipates,” “expects,” “intends,” “plans,” “believes,” “seeks,” “estimates,” “would,” “should,” “targets,” “projects,” and variations of these words and similar expressions are intended to identify forward-looking statements. These statements are not guarantees of future performance and are subject to risks, uncertainties, and other factors, some of which are beyond our control and difficult to predict and could cause actual results to differ materially from those expressed or forecasted in the forward-looking statements, including without limitation:
| • | our limited experience operating a business development company, or BDC or a small business investment company, or SBIC, or maintaining our status as a regulated investment company, or RIC, under Subchapter M of the Code; |
| • | our dependence on key personnel; |
| • | our ability to maintain or develop referral relationships; |
| • | the administration of OFS Capital WM, LLC’s, or OFS Capital WM, portfolio by an unaffiliated loan manager; |
| • | our ability to replicate historical results; |
| • | the ability of OFS Capital Management, LLC, or OFS Advisor, to identify, invest in and monitor companies that meet our investment criteria; |
| • | actual and potential conflicts of interest with OFS Advisor and other affiliates of Orchard First Source Asset Management, LLC, or OFSAM, which is the holding company of OFS Advisor and OFS Services and owns approximately 30% of our outstanding shares of common stock; |
| • | constraint on investment due to access to material nonpublic information; |
| • | restrictions on our ability to enter into transactions with our affiliates; |
| • | limitations on the amount of debentures guaranteed by the Small Business Administration, or SBA, that may be issued by an SBIC; |
| • | Our ability to comply with SBA regulations and requirements; |
| • | the use of borrowed money to finance a portion of our investments; |
| • | competition for investment opportunities; |
| • | our ability to qualify and maintain our qualification as a RIC and as a BDC; |
| • | the ability of OFS SBIC I LP, or SBIC I LP, OFS Capital WM and any other portfolio companies to make distributions enabling us to meet RIC requirements; |
| • | our ability to raise capital as a BDC; |
| • | the timing, form and amount of any distributions from our portfolio companies; |
| • | the impact of a protracted decline in the liquidity of credit markets on our business; |
| • | the general economy and its impact on the industries in which we invest; |
| • | uncertain valuations of our portfolio investments; and |
| • | the effect of new or modified laws or regulations governing our operations. |
| 33 |
Although we believe that the assumptions on which these forward-looking statements are based are reasonable, any of those assumptions could prove to be inaccurate, and as a result, the forward-looking statements based on those assumptions also could be inaccurate. In light of these and other uncertainties, the inclusion of a projection or forward-looking statement in this quarterly report on Form 10-Q should not be regarded as a representation by us that our plans and objectives will be achieved. These risks and uncertainties include, among others, those described or identified in “Item 1A. Risk Factors” in our annual report on Form 10-K for our year ended December 31, 2013. You should not place undue reliance on these forward-looking statements, which apply only as of the date of this quarterly report on Form 10-Q.
We have based the forward-looking statements on information available to us on the date of this quarterly report on Form 10-Q. Except as required by the federal securities laws, we undertake no obligation to revise or update any forward-looking statements, whether as a result of new information, future events or otherwise. You are advised to consult any additional disclosures that we may make directly to you or through reports that we may file with the SEC in the future, including annual reports on Form 10-K, quarterly reports on Form 10-Q and current reports on Form 8-K. The forward-looking statements and projections contained in this quarterly report on Form 10-Q are excluded from the safe harbor protection provided by Section 27A of the Securities Act of 1933, as amended, and Section 21E of the Securities Exchange Act of 1934, as amended.
The following analysis of our financial condition and results of operations should be read in conjunction with our consolidated financial statements and the related notes thereto contained elsewhere in this quarterly report on Form 10-Q.
Overview
We are an externally managed, closed-end, non-diversified management investment company. Our investment objective is to provide our shareholders with both current income and capital appreciation primarily through debt investments and, to a lesser extent, equity investments. Our investment strategy focuses primarily on investments in middle-market companies in the United States. We use the term “middle-market” to refer to companies that may exhibit one or more of the following characteristics: number of employees between 150 and 2,000; revenues between $15 million and $300 million; annual earnings before interest, taxes, depreciation and amortization, or EBITDA, between $3 million and $50 million; generally, private companies owned by private equity firms or owners/operators; and enterprise value between $10 million and $500 million.
As of March 31, 2014, our investment portfolio consisted of outstanding loans of approximately $226.9 million in aggregate principal amount in 56 portfolio companies, of which $52.3 million in aggregate principal amount was held by SBIC I LP, our wholly-owned SBIC subsidiary, in nine portfolio companies. As of March 31, 2014, 92% of our investment portfolio was comprised of senior secured loans, 4% of subordinated loans and 4% of equity investments, at fair value.
Our investment strategy focuses primarily on middle-market companies in the United States, including senior secured loans, which includes first-lien, second line and unitranche loans, as well as subordinated loans, and, to a lesser extent, warrants and other minority equity securities. We also may invest up to 30% of our portfolio in opportunistic investments of non-eligible portfolio companies. Specifically, as part of this 30% basket, we may consider investments in investment funds that are operating pursuant to certain exceptions to the Investment Company Act of 1940, as amended, or the 1940 Act, and in advisers to similar investment funds, as well as in debt of middle-market companies located outside of the United States and debt and equity of public companies that do not meet the definition of eligible portfolio companies because their market capitalization of publicly traded equity securities exceeds the levels provided for in the 1940 Act.
Our investment strategy includes SBIC I LP, which received an SBIC license from the SBA in May 2012. On December 4, 2013, we received approval from the SBA to acquire all of the limited partnership interests in SBIC I LP and all of the ownership interests of its general partner, OFS SBIC I GP, LLC, or SBIC I GP, that were owned or subscribed for by other persons. We acquired the interests on December 4, 2013, which resulted in SBIC I LP becoming a wholly-owned subsidiary. The transaction was finalized in January 2014. The SBIC license allows SBIC I LP to receive SBA-guaranteed debenture funding, subject to the issuance of a leverage commitment by the SBA and other customary procedures. SBA leverage funding is subject to SBIC I LP’s payment of certain fees to the SBA, and the ability of SBIC I LP to draw on the commitment is subject to its compliance with SBA regulations and policies, including an audit by the SBA.
On November 26, 2013, we received an exemptive order from the SEC to permit us to exclude the debt of SBIC I LP guaranteed by the SBA from the definition of senior securities in the statutory 200% asset coverage ratio under the 1940 Act, allowing for greater capital deployment.
| 34 |
Our investment activities are managed by OFS Advisor, and supervised by our board of directors, a majority of whom are independent of us, OFS Advisor and its affiliates. Under the Investment Advisory Agreement between us and OFS Advisor, or the Advisory Agreement, we have agreed to pay OFS Advisor an annual base management fee based on the average value of our total assets (other than cash and cash equivalents but including assets purchased with borrowed amounts and including assets owned by any consolidated entity), adjusted for any share issuances or repurchases during the quarter, as well as an incentive fee based on our investment performance. We have also entered into an administration agreement, or the Administration Agreement, with OFS Capital Services, LLC, or OFS Services, our Administrator. Under our Administration Agreement, we have agreed to reimburse OFS Services for our allocable portion (subject to the review and approval of our independent directors) of overhead and other expenses incurred by OFS Services in performing its obligations under the Administration Agreement.
As a BDC, we must not acquire any assets other than “qualifying assets” specified in the 1940 Act unless, at the time the acquisition is made, at least 70% of our total assets are qualifying assets (with certain limited exceptions). Qualifying assets include investments in “eligible portfolio companies.” Under the relevant SEC rules, the term “eligible portfolio company” includes all private companies, companies whose securities are not listed on a national securities exchange, and certain public companies that have listed their securities on a national securities exchange and have a market capitalization of less than $250 million, in each case organized in the United States.
We are permitted to borrow money from time to time within the levels permitted by the 1940 Act (which generally allows us to incur leverage for up to 50% of our asset base). We may borrow money when the terms and conditions available are favorable to do so and are aligned with our investment strategy and portfolio composition. The use of borrowed funds or the proceeds of preferred stock to make investments would have its own specific benefits and risks, and all of the costs of borrowing funds or issuing preferred stock would be borne by holders of our common stock.
We have elected to be treated for tax purposes as a regulated investment company, or RIC, under Subchapter M of the Internal Revenue Code of 1986, or the Code. To qualify as a RIC, we must, among other things, meet certain source-of-income and assets diversification requirements. Pursuant to these elections, we generally will not have to pay corporate-level taxes on any income we distribute to our shareholders.
Recent Developments and Other Factors Affecting Comparability
Transactions with SBIC I LP prior to our Initial Public Offering (“IPO”). Prior to May 10, 2012, we were deemed to be the primary beneficiary of SBIC I LP (formerly Tamarix Capital Partners, L.P.) and, therefore, in accordance with Accounting Standards Codification Topic 810, or ASC Topic 810, the financial statements of SBIC I LP were consolidated with ours. On May 10, 2012, as a result of SBIC I LP’s receipt of an SBIC license, we became a 68.4% limited partner in SBIC I LP and were deemed, under the applicable accounting literature, to continue to hold a controlling financial interest in SBIC I LP, as described more fully in our consolidated financial statements. Accordingly, we continued to consolidate the financial statements of SBIC I LP with ours at June 30, 2012. On July 27, 2012, however, SBIC I LP repaid its loans together with accrued interest due to us in an aggregate amount of approximately $16.6 million, and the three investment professionals of OFS SBIC I GP, LLC, or SBIC I GP, (formerly Tamarix Capital G.P. LLC) resigned from our affiliated entity. As a result, effective as of July 27, 2012, we deconsolidated SBIC I LP’s financial statements from our own, and accounted for our investment in SBIC I LP under the equity method of accounting (“Tamarix Deconsolidation”). From November 8, 2012, upon the completion of our IPO, until our acquisitions of the remaining ownership interests in SBIC I LP and SBIC I GP on December 4, 2013, we accounted for our equity investment in SBIC I LP at fair value.
Acquisition of SBIC I LP & SBIC I GP Interests. On December 4, 2013, we purchased the remaining limited partnership interests in SBIC I LP (the “Tamarix LP Acquisition”), making SBIC I LP a wholly owned subsidiary of OFS Capital. On December 4, 2013, OFS Capital also acquired all of the remaining membership interests in SBIC I GP (the “Tamarix GP Acquisition”). The Tamarix LP Acquisition and Tamarix GP Acquisition are referred to collectively as the “Tamarix Acquisitions” (see Note 3 of our March 31, 2014 unaudited consolidated financial statements for more details). The transaction was finalized in January 2014. Upon the Tamarix Acquisitions, on December 4, 2013, we again consolidated the financial statements of both SBIC I LP and SBIC I GP into our financial statements.
2013 and 2014 OFS Capital WM Credit Facility Amendments. On January 22, 2013, the OFS Capital WM Credit Facility, which is defined under the Financial Condition, Liquidity and Capital Resources section below, was amended, pursuant to which the Class B Facility, which had no outstanding borrowings, was terminated. As a result, the OFS Capital WM Credit Facility commitment was reduced from $180 million to $135 million.
On November 22, 2013, the OFS Capital WM Credit Facility was further amended. Pursuant to the amendment, (1) the Class A loans with Wells Fargo Bank, N.A., or Wells Fargo, were extended to December 31, 2018; (2) the reinvestment period for the Wells Fargo loan was extended to December 31, 2015; (3) the accrued interest rate on outstanding Class A loans was amended to LIBOR plus 2.50% per annum, and (4) the advance rate on borrowing was increased from 65% to 70%. In connection with the amendment, OFS Capital WM incurred financing costs of approximately $1.2 million.
| 35 |
On January 17, 2014, the OFS Capital WM Credit Facility was amended again, pursuant to which the calculation of the borrowing base was adjusted and the minimum equity requirement was lowered from $65 million to $50 million, resulting in additional liquidity for the Company. No financing costs were incurred in connection with this amendment.
Critical Accounting Policies
The preparation of financial statements and related disclosures in conformity with generally accepted accounting principles in the United States requires management to make estimates and assumptions that affect the reported amounts of assets and liabilities, disclosure of contingent assets and liabilities at the date of the financial statements, and disclosure of revenues and expenses during the periods reported. Actual results could materially differ from those estimates. We have identified the following items as critical accounting policies:
Valuation of Portfolio Investments.
The most significant estimate inherent in the preparation of our consolidated financial statements is the valuation of investments and the related amounts of unrealized appreciation and depreciation of investments recorded.
Our investments are carried at fair value in accordance with the 1940 Act and ASC Topic 820. At March 31, 2014, approximately 84% of our total assets represented investments in portfolio companies that are valued at fair value by our board of directors. Value, as defined in Section 2(a)(41) of the 1940 Act, is (i) the market price for those securities for which a market quotation is readily available and (ii) for all other securities and assets, fair value is as determined in good faith by the board of directors. Our debt and equity securities are primarily comprised of investments in middle market companies whose securities are not publicly traded. Our investments in these portfolio companies are generally considered Level 3 assets under ASC Topic 820 because the inputs used to value the investments are generally unobservable. As such, we value substantially all of our investments at fair value as determined in good faith by our board of directors pursuant to a consistent valuation policy in accordance with the provisions of ASC Topic 820 and the 1940 Act. Due to the inherent uncertainty in determining the fair value of investments that do not have a readily available market value, the fair value of our investments determined in good faith by our board of directors may differ significantly from the value that would have been used had a readily available market existed for such investments, and the differences could be material.
Our policies relating to the valuation of our portfolio investments are as follows:
Investments for which sufficient market quotations are readily available are valued at such market quotations. We may also obtain indicative prices with respect to certain of our investments from pricing services or brokers or dealers in order to value such investments. There is not a readily available market value for many of our investments; those debt and equity securities that are not publicly traded or whose market prices are not readily available are valued at fair value as determined in good faith by the board of directors. We value such investments at fair value as determined in good faith by our board of directors using a documented valuation policy and a consistently applied valuation process. Our valuation of each of our assets for which sufficient market quotations are not readily available is reviewed by one or more independent third-party valuation firms at least once every 12 months.
Our board of directors is ultimately and solely responsible for determining the fair value of the portfolio investments that are not publicly traded, whose market prices are not readily available on a quarterly basis or in any other situation where portfolio investments require a fair value determination.
With respect to investments for which sufficient market quotations are not readily available or for which no or an insufficient number of indicative prices from pricing services or brokers or dealers have been received, our board of directors undertakes, on a quarterly basis, unless otherwise noted, a multi-step valuation process, as described below:
| • | For each debt investment, a basic credit rating review process is completed. The risk rating on every credit facility is reviewed and either reaffirmed or revised by the Investment Committee of OFS Advisor, or the Advisor Investment Committee. This process establishes base information for the quarterly valuation process. |
| • | Each portfolio company or investment is valued by an investment professional. |
| • | Preliminary valuation conclusions are then documented and discussed with individual members of the Advisor Investment Committee. |
| • | The preliminary valuations are then submitted to the Advisor Investment Committee for ratification. |
| 36 |
| • | Third-party valuation firm(s) are engaged to provide valuation services as requested, by reviewing the preliminary valuations of the Advisor Investment Committee. The Advisor Investment Committee’s preliminary fair value conclusions on each of our assets for which sufficient market quotations are not readily available are reviewed and assessed by a third-party valuation firm at least once in every 12-month period, and more often as determined by our board of directors or required by our valuation policy. Such valuation assessment may be in the form of positive assurance, range of values or other valuation methods based on the discretion of our board of directors. |
| • | Our board of directors will discuss valuations and determine the fair value of each investment in the portfolio in good faith based on the input of OFS Advisor and, where appropriate, the respective independent valuation firms. |
The types of factors that we may take into account in fair value pricing our investments include, as relevant, the nature and realizable value of any collateral, the portfolio company’s ability to make payments and its earnings and cash flows, the markets in which the portfolio company does business, comparison to publicly traded securities and other relevant factors.
Determination of fair value involves subjective judgments and estimates. Accordingly, the notes to our financial statements will express the uncertainty with respect to the possible effect of such valuations, and any change in such valuations, on our financial statements.
Revenue Recognition. Our revenue recognition policies are as follows:
Investments and Related Investment Income: Investments are recorded at fair value. Our board of directors determines the fair value of its portfolio investments. Interest income is accrued based upon the outstanding principal amount and contractual interest terms of debt investments. We accrue interest income until certain events take place that may place a loan into a non-accrual status. In addition, we may generate revenue in the form of commitment, origination, amendment, structuring or due diligence fees, fees for providing managerial assistance and consulting fees. Loan origination fees, original issue discount, or OID, market discount or premium, and loan amendment fees (collectively, “net loan origination fee income”) are capitalized, and we accrete or amortize such amounts over the life of the loan as interest income. All other income is recorded into income when earned. Further, in connection with our debt investments, we will sometimes receive warrants or similar no-cost equity-related securities (“Warrants”). We determine the cost basis of Warrants based upon their respective fair values on the date of receipt in proportion to the total fair value of the debt and Warrants received. Any resulting difference between the face amount of the debt and its recorded fair value resulting from the assignment of value to the Warrants is treated as OID, and accreted into interest income over the life of the debt security. Dividend income is recorded at the time dividends are declared or at the point an obligation exists for the portfolio company to make a distribution. Distribution of earnings from portfolio companies are evaluated to determine if the distribution is income or return of capital.
For investments with contractual paid-in-kind, or PIK interest which represents contractual interest accrued and added to the principal balance that generally becomes due at maturity (or at some other stipulated date), we will not accrue PIK interest if the portfolio company valuation indicates that the PIK interest is not collectible.
Investment transactions are accounted for on a trade-date basis. Realized gains or losses on investments are measured by the difference between the net proceeds from the disposition and the cost basis of investment, without regard to unrealized gains or losses previously recognized. The Company reports changes in fair value of investments that are measured at fair value as a component of the net changes in unrealized appreciation (depreciation) on investments in the consolidated statement of operations.
Non-accrual. Loans on which the accrual of interest income has been discontinued are designated as non-accrual loans, and non-accrual loans are further designated to be accounted for under either a non-accrual cash method or a non-accrual cost recovery method. Loans are generally placed on non-accrual when a loan either: (i) is delinquent for 90 days or more on principal or interest based on contractual terms of the loan (unless well secured and in the process of collection), or (ii) in the opinion of our management, there is reasonable doubt about the collectability. When loans are placed on non-accrual status, all interest previously accrued but not collected is reversed against current period interest income. Interest payments received on non-accrual loans may be recognized as income or applied to principal, depending upon management’s judgment. Interest accruals are resumed on non-accrual loans only when they are brought current with respect to interest and principal and when, in the judgment of management, the loans are estimated to be fully collectible as to all principal and interest.
Principles of consolidation.
Our March 31, 2014 consolidated financial statements include the accounts of OFS Capital Corporation, or OFS Capital, and our wholly owned subsidiaries, OFS Capital WM, OFS Funding, LLC, SBIC I LP and SBIC I GP. We consolidate an affiliated subsidiary if we own more than 50 percent of the subsidiary’s equity and hold the controlling financial interest in such subsidiary. We also consolidate a variable interest entity (“VIE”) if we are the primary beneficiary in the VIE. Effective July 27, 2012, we deconsolidated the financial statements of SBIC I LP from our own. Effective December 4, 2013, we consolidated the financial statements of SBIC I LP and SBIC I GP into our own. See “Financial Statements – Note 3” for more detailed information.
| 37 |
Portfolio Composition and Investment Activity
Portfolio Composition
The total fair value of our investments was approximately $228.0 million at March 31, 2014 and approximately $237.9 million at December 31, 2013. Our investment portfolio consisted of outstanding loans to 56 portfolio companies, totaling approximately $226.9 million in aggregate principal amount (including SBIC I LP’s $52.3 million in loans to nine portfolio companies), of which 96% were senior secured loans and 4% were subordinated loans, as well as SBIC I LP’s approximately $8.1 million in equity investments, at fair value, in eight portfolio companies in which it also holds debt investments. Our investment portfolio encompassed a broad range of geographical regions and industries. As of March 31, 2014, we had unfunded commitments of $4.8 million for three portfolio companies, including $3.3 million for two portfolio companies of SBIC I LP. Set forth in the tables and charts below is selected information with respect to our portfolio as of March 31, 2014.
The following table summarizes the composition of our investment portfolio.
| As of March 31, 2014 | ||||||||
| Commitment | Outstanding | |||||||
| (Dollar amounts in thousands) | ||||||||
| Senior secured term loan | $ | 221,258 | $ | 218,008 | ||||
| Subordinated term loan | 8,859 | 8,859 | ||||||
| Senior secured revolver | 1,500 | - | ||||||
| Equity investments (at fair value) | 8,108 | 8,108 | ||||||
| $ | 239,725 | $ | 234,975 | |||||
| Total # of Obligors | 56 | 56 | ||||||
The following chart provides a regional breakdown of our investment portfolio as of March 31, 2014.
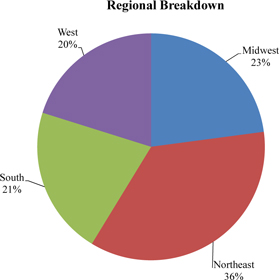
| 38 |
Our investment portfolio’s three largest industries are Healthcare & Pharmaceuticals, Services: Business, and Banking, Finance, Insurance & Real Estate, totaling approximately 50% of the investment portfolio. The following table summarizes our investment portfolio by industry as of March 31, 2014.
| As of March 31, 2014 | ||||||||
| Industry | Commitment | Percent | ||||||
| (Dollar amounts in thousands) | ||||||||
| Aerospace & Defense | $ | 15,979 | 6.7 | % | ||||
| Automotive | 7,152 | 3.0 | ||||||
| Banking, Finance, Insurance & Real Estate | 28,971 | 12.1 | ||||||
| Capital Equipment | 7,998 | 3.3 | ||||||
| Chemicals, Plastics & Rubber | 19,556 | 8.1 | ||||||
| Construction & Building | 1,799 | 0.8 | ||||||
| Consumer goods: Non-durable | 7,701 | 3.2 | ||||||
| Containers, Packaging & Glass | 4,204 | 1.7 | ||||||
| Energy: Oil & Gas | 7,139 | 3.0 | ||||||
| Environmental Industries | 7,858 | 3.3 | ||||||
| Healthcare & Pharmaceuticals | 55,208 | 23.0 | ||||||
| High Tech Industries | 7,973 | 3.3 | ||||||
| Media: Advertising, Printing & Publishing | 10,701 | 4.5 | ||||||
| Media: Broadcasting & Subscription | 4,216 | 1.8 | ||||||
| Retail | 4,019 | 1.7 | ||||||
| Services: Business | 35,411 | 14.8 | ||||||
| Services: Consumer | 6,304 | 2.6 | ||||||
| Telecommunications | 7,536 | 3.1 | ||||||
| $ | 239,725 | 100.0 | % | |||||
The following table summarizes our debt investment portfolio by size of exposure.
| As of March 31, 2014 | ||||||||||
| Debt Investment Size (in millions) | Commitment | Number | ||||||||
| (Dollar amounts in thousands) | ||||||||||
| $0 - $3 | $ | 34,111 | 13 | |||||||
| $3 - $4 | 48,993 | 14 | ||||||||
| $4 - $5 | 108,765 | 24 | ||||||||
| $5 - $10 | 27,483 | 4 | ||||||||
| > $10 | 12,265 | 1 | ||||||||
| $ | 231,617 | 56 | ||||||||
| 39 |
The following chart provides a breakdown of our debt investment portfolio by investment size as of March 31, 2014.
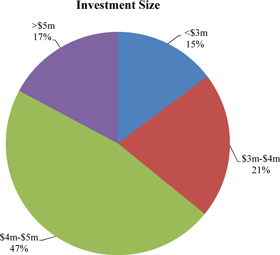
The following chart provides a breakdown of our debt investment portfolio by yield as of March 31, 2014.

Investment Activity
For the three months ended March 31, 2014, we closed one new debt investment with a face value of $3.0 million and made an add-on investment of approximately $0.8 million in an existing portfolio company. In addition, for the three months ended March 31, 2014, we participated in refinancing transactions with two existing portfolio companies totaling approximately $5.1 million. For the three months ended March 31, 2014, we received approximately $19.9 million in proceeds from principal payments on debt investments, and approximately $4.5 million in proceeds from a debt investment we sold in December 2013.
For the year ended December 31, 2013, we closed debt investments with eight companies with an aggregate face value of approximately $41.2 million and made equity investments totaling approximately $2.5 million in one portfolio company. Prior to the December 4, 2013 Tamarix Acquisitions, SBIC I LP closed nine investments with five portfolio companies during the period January 1, 2013 through December 4, 2013. SBIC I LP’s nine new investments during that period consisted of four debt investments with total principal balance of $19.4 million and unfunded commitments of $3.3 million as well as five equity investments purchased for a total of $0.9 million. For the year ended December 31, 2013, we received approximately $63.1 million in proceeds from principal payments on debt investments and sold three debt investments for approximately $13.9 million, of which approximately $4.5 million was settled in January 2014.
| 40 |
Portfolio Credit Ratings
We categorize debt investments into seven risk categories based on relevant information about the ability of borrowers to service their debt.
1 (Low Risk) – A risk rated 1, or Low Risk, credit is a credit that has most satisfactory asset quality and liquidity, as well as good leverage capacity. It maintains predictable and strong cash flows from operations. The trends and outlook for the credit’s operations, balance sheet, and industry are neutral to favorable. Collateral, if appropriate, has maintained value and would be capable of being liquidated on a timely basis. Overall, a 1 rated credit would be considered to be of investment grade quality.
2 (Below Average Risk) – A risk rated 2, or Below Average Risk, credit is a credit that has acceptable asset quality, moderate excess liquidity, and modest leverage capacity. It could have some financial/non-financial weaknesses that are offset by strengths; however, the credit demonstrates an ample current cash flow from operations. The trends and outlook for the credit’s operations, balance sheet, and industry are generally positive or neutral to somewhat negative. Collateral, if appropriate, has maintained value and would be capable of being liquidated successfully on a timely basis.
3 (Average) – A risk rated 3, or Average, credit is a credit that has acceptable asset quality, somewhat strained liquidity, and minimal leverage capacity. It is at times characterized by just acceptable cash flows from operations. Under adverse market conditions, carrying the current debt service could pose difficulties for the borrower. The trends and conditions of the credit’s operations and balance sheet are neutral to slightly negative.
4 (Special Mention) – A risk rated 4, or Special Mention, credit is a credit with no apparent loss of principal or interest envisioned. Nonetheless, it possesses credit deficiencies or potential weaknesses that deserve management’s close and continued attention. The credit’s operations and/or balance sheet have demonstrated an adverse trend or deterioration that, while serious, has not reached the point where the liquidation of debt is jeopardized. These weaknesses are generally considered correctable by the borrower in the normal course of business but may, if not checked or corrected, weaken the asset or inadequately protect our credit position.
5 (Substandard) – A risk rated 5, or Substandard, credit is a credit inadequately protected by the current enterprise value or paying capacity of the obligor or of the collateral, if any. These credits have well-defined weaknesses based upon objective evidence, such as recurring or significant decreases in revenues and cash flows. These assets are characterized by the possibility that we may sustain loss if the deficiencies are not corrected. The possibility that liquidation would not be timely (e.g. bankruptcy or foreclosure) requires a Substandard classification even if there is little likelihood of loss.
6 (Doubtful) – A risk rated 6, or Doubtful, credit is a credit with all the weaknesses inherent in those classified as Substandard, with the additional factor that the weaknesses are pronounced to the point that collection or liquidation in full, on the basis of currently existing facts, conditions and values is deemed uncertain. The possibility of loss on a Doubtful asset is high but, because of certain important and reasonably specific pending factors that may strengthen the asset, its classification as an estimated loss is deferred until its more exact status can be determined.
7 (Loss) – A risk rated 7, or Loss, credit is a credit considered almost fully uncollectible and of such little value that its continuance as an asset is not warranted. It is generally a credit that is no longer supported by an operating company, a credit where the majority of our assets have been liquidated or sold and a few assets remain to be sold over many months or even years, or a credit where the remaining collections are expected to be minimal.
| 41 |
The following table shows the classification of our debt investments portfolio by credit rating as of March 31, 2014 and December 31, 2013:
| March 31, 2014 | December 31, 2013 | |||||||||||||||
| Debt | Debt | |||||||||||||||
| Investments, | % of Debt | Investments, | % of Debt | |||||||||||||
| at Fair Value | Investments | at Fair Value | Investments | |||||||||||||
| Credit Rating | (Dollor amounts in thousands) | |||||||||||||||
| 1 | $ | - | 0.0 | % | $ | - | 0.0 | % | ||||||||
| 2 | - | 0.0 | % | - | 0.0 | % | ||||||||||
| 3 | 194,085 | 88.3 | % | 204,273 | 88.6 | % | ||||||||||
| 4 | 18,314 | 8.3 | % | 17,384 | 7.5 | % | ||||||||||
| 5 | 6,446 | 2.9 | % | 7,846 | 3.4 | % | ||||||||||
| 6 | 1,049 | 0.5 | % | 1,051 | 0.5 | % | ||||||||||
| 7 | - | 0.0 | % | - | 0.0 | % | ||||||||||
| $ | 219,894 | 100.0 | % | $ | 230,554 | 100.0 | % | |||||||||
The following table shows the cost and fair value of our portfolio of investments by asset class as of March 31, 2014 and December 31, 2013.
| As of March 31, | As of December 31, | |||||||||||||||
| 2014 | 2013 | |||||||||||||||
| Cost | Fair Value | Cost | Fair Value | |||||||||||||
| (Dollar amounts in thousands) | ||||||||||||||||
| Senior Secured | ||||||||||||||||
| Performing | $ | 211,948 | $ | 209,813 | $ | 222,564 | $ | 220,495 | ||||||||
| Non-Accrual | 3,988 | 1,049 | 3,988 | 1,051 | ||||||||||||
| Subordinated | ||||||||||||||||
| Performing | 9,057 | 9,032 | 9,009 | 9,008 | ||||||||||||
| Non-Accrual | - | - | - | - | ||||||||||||
| Equity Investments | 7,862 | 8,108 | 7,862 | 7,365 | ||||||||||||
| Total | $ | 232,855 | $ | 228,002 | $ | 243,423 | $ | 237,919 | ||||||||
As of March 31, 2014, the weighted average yield to fair value of our debt investments was approximately 8.35%. Throughout this document, the weighted average yield on debt investments at fair value is computed as (a) total annual stated interest on accruing loans plus the annualized amortization of deferred loan origination fees and accretion of OID divided by (b) total debt investments at fair value. The weighted average yield on debt investments at fair value is computed as of the balance sheet date and excludes assets on non-accrual status as of such date.
As of March 31, 2014, floating rate loans comprised 84% of our debt investment portfolio and fixed rate loans comprised 16% of our debt investment portfolio, as a percent of fair value.
Our level of investment activity may vary substantially from period to period depending on various factors, including, but not limited to, the amount of debt and equity capital available to middle market companies, the level of merger and acquisition activity, the general economic environment and the competitive environment for the types of investments we make.
| 42 |
Results of Operations
Key Financial Measures
The following is a discussion of the key financial measures that management employs in reviewing the performance of our operations.
Revenues. We generate revenue in the form of interest income on debt investments and capital gains and distributions, if any, from our investment securities in portfolio companies. Our debt investments typically have a term of three to eight years and bear interest at fixed and floating rates. As of March 31, 2014, floating rate and fixed rate loans comprised 84% and 16%, respectively, of our current debt investment portfolio; however, in accordance with our investment strategy, we expect that over time the proportion of fixed rate loans will increase. In some instances, we receive payments on our debt investments based on scheduled amortization of the outstanding balances. In addition, we anticipate receiving repayments of some of our debt investments prior to their scheduled maturity date. The frequency or volume of these repayments may fluctuate significantly from period to period. On occasion, our portfolio activity may also reflect the proceeds of sales of securities. In some cases, our investments will provide for deferred interest payments or PIK interest (meaning interest paid in the form of additional principal amount of the loan instead of in cash). In addition, we may generate revenue in the form of commitment, origination and sourcing, structuring or due diligence fees, fees for providing managerial assistance and consulting fees. Loan origination fees, OID, market discount or premium, and loan amendment fees are capitalized, and the Company accretes or amortizes such amounts over the life of the loan as interest income. When we receive principal payments on a loan in an amount that exceeds its carrying value, we will also record the excess principal payment as income. Dividend income, if any, will be recognized on an accrual basis to the extent that we expect to collect such amounts.
Expenses. Our primary operating expenses include interest expense due under our outstanding borrowings (both the OFS Capital WM Facility and the SBA debentures), the payment of fees to OFS Advisor under the Advisory Agreement, our allocable portion of overhead expenses under the Administration Agreement and other operating costs described below. Additionally, we will pay interest expense on any outstanding debt under any new credit facility or other debt instrument we may enter into. We will bear all other out-of-pocket costs and expenses of our operations and transactions, whether incurred by us directly or on our behalf by a third party, including:
| • | the cost of calculating our net asset value, including the cost of any third-party valuation services; |
| • | the cost of effecting sales and repurchases of shares of our common stock and other securities; |
| • | fees payable to third parties relating to making investments, including out-of-pocket fees and expenses associated with performing due diligence and reviews of prospective investments; |
| • | transfer agent and custodial fees; |
| • | out-of-pocket fees and expenses associated with marketing efforts; |
| • | federal and state registration fees and any stock exchange listing fees; |
| • | U.S. federal, state and local taxes; |
| • | independent directors’ fees and expenses; |
| • | brokerage commissions; |
| • | fidelity bond, directors’ and officers’ liability insurance and other insurance premiums; |
| • | direct costs, such as printing, mailing and long-distance telephone; |
| • | fees and expenses associated with independent audits and outside legal costs; |
| • | costs associated with our reporting and compliance obligations under the 1940 Act and other applicable U.S. federal and state securities laws; and |
| • | other expenses incurred by either OFS Services or us in connection with administering our business, including payments under the Administration Agreement that will be based upon our allocable portion (subject to the review and approval of our board of directors) of overhead. |
| 43 |
We do not believe that our historical operating performance is necessarily indicative of our future results of operations that we expect to report in future periods. We are primarily focused on investments in middle-market companies in the United States, including investments in senior secured and subordinated loans and, to a lesser extent, warrants and other minority equity securities, which differs to some degree from our historical investment concentration, in senior secured loans to middle-market companies in the United States. Moreover, as a BDC and a RIC, we will also be subject to certain constraints on our operations, including, but not limited to, limitations imposed by the 1940 Act and the Code. In addition, SBIC I LP is subject to regulation and oversight by the SBA. For the reasons described above, the results of operations described below may not necessarily be indicative of the results we expect to report in future periods.
Comparison of the three month periods ended March 31, 2014 (unaudited) and March 31, 2013 (unaudited)
Consolidated operating results for the three month periods ended March 31, 2014 and March 31, 2013, are as follows:
| Three Months Ended | ||||||||
| March 31 | ||||||||
| 2014 | 2013 | |||||||
| (Amounts in thousands) | ||||||||
| Total investment income | $ | 5,012 | $ | 4,365 | ||||
| Total expenses | 3,612 | 2,923 | ||||||
| Net investment income | 1,400 | 1,442 | ||||||
| Net realized and unrealized gain on investments | 651 | 1,429 | ||||||
| Net increase in net assets resulting from operations | $ | 2,051 | $ | 2,871 | ||||
Net income can vary substantially from period to period for various reasons, including the recognition of realized gains and losses and unrealized appreciation and depreciation. As a result, comparisons of net income may not be meaningful.
Investment Income
| Three Months Ended | ||||||||
| March 31 | ||||||||
| 2014 | 2013 | |||||||
| (Amounts in thousands) | ||||||||
| Interest income | ||||||||
| Non-control/non-affiliate investments | $ | 3,786 | $ | 4,365 | ||||
| Affiliate investments | 827 | - | ||||||
| Control investment | 302 | - | ||||||
| Total interest income | 4,915 | 4,365 | ||||||
| Dividend and fee income | ||||||||
| Non-control/non-affiliate investments | 8 | - | ||||||
| Affiliate investments | 64 | - | ||||||
| Control investment | 25 | - | ||||||
| Total dividend and fee income | 97 | - | ||||||
| Total investment income | $ | 5,012 | $ | 4,365 | ||||
Total investment income increased by approximately $0.6 million, or 15%, for the three months ended March 31, 2014 as compared to the three months ended March 31, 2013. The $0.6 million increase in total investment income was primarily due to the increase in interest income, which was attributable to the higher yielding debt investments held by SBIC I LP, as a result of our consolidation of SBIC I LP upon closing of the Tamarix Acquisitions on December 4, 2013. SBIC I LP holds all of our affiliate investments and our only control investment. In addition, during the three months ended March 31, 2014, SBIC I LP generated dividend and fee income of approximately $0.1 million. While not consolidated with us during the quarter ended March 31, 2013, SBIC I LP had interest income and dividend income of approximately $0.7 million and $30 thousand, respectively, during the quarter.
| 44 |
Expenses
| Three Months Ended | ||||||||
| March 31 | ||||||||
| 2014 | 2013 | |||||||
| (Amounts in thousands) | ||||||||
| Interest expense | $ | 991 | $ | 847 | ||||
| Amortization and write-off of deferred financing closing costs | 150 | 469 | ||||||
| Amortization of intangible asset | 63 | - | ||||||
| Management fees | 1,264 | 807 | ||||||
| Professional fees | 454 | 250 | ||||||
| Administrative fee | 475 | 280 | ||||||
| General and administrative expenses | 215 | 270 | ||||||
| Total expenses | $ | 3,612 | $ | 2,923 | ||||
Total expenses increased by approximately $0.7 million, or 24%, for the three months ended March 31, 2014 as compared to the three months ended March 31, 2013. Interest expense increased by approximately $0.1 million for the three months ended March 31, 2014, compared to the three months ended March 31, 2013, primarily due to $0.2 million of interest expense incurred on our SBA debentures (which we assumed in the December 2013 Tamarix Acquisitions) for the three months ended March 31, 2014, offset by a decrease of approximately $0.1 million in interest expense on the OFS Capital WM Credit Facility for the three months ended March 31, 2014 as compared to the three months ended March 31, 2013, due to reduction in the interest rate on the facility pursuant to the November 2013 amendment to the OFS Capital WM Credit Facility). Amortization and write-off of deferred financing closing costs decreased by $0.3 million for the three months ended March 31, 2014 compared to the three months ended March 31, 2013, primarily due to the write-off of $0.3 million of deferred financing closing costs as a result of the termination of the Class B Facility in January 2013. For the three months ended March 31, 2014, we recorded $63 thousand of amortization expense of intangible asset related to the SBIC license, which intangible asset was recognized by SBIC I LP upon closing of the Tamarix Acquisitions.
Management fees expense increased by approximately $0.5 million for the three months ended March 31, 2014 compared to the three months ended March 31, 2013, which was primarily attributable to a scheduled increase in OFS Advisor’s base management fee rate from 0.875% to 1.75% per annum beginning November 1, 2013 and through March 31, 2014. On May 5, 2014, we were notified by OFS Advisor that, effective as of April 1, 2014, it would reduce its base management fee by two-thirds for the balance of the 2014 fiscal year. Specifically, OFS Advisor agreed to reduce its base management fee from 0.4375% per quarter to 0.145833% per quarter for the second, third, and fourth quarters of 2014. Accordingly, the effective annual base management fee for the 2014 fiscal year will be equal to or less than 50% of the 1.75% required by our Advisory Agreement with OFS Advisor, or not greater than 0.875%. OFS Advisor informed us that this reduction was being made for the benefit of our shareholders to take into account unforeseen delays in completing the Tamarix Acquisitions.
Professional fees increased by approximately $0.2 million for the three month period ended March 31, 2014 compared to the three month period ended March 31, 2013, largely due to increased accounting and legal fees incurred in connection with the Tamarix Acquisitions.
Administrative fee expense increased by approximately $0.2 million for the three months ended March 31, 2014 compared to the three months ended March 31, 2013, primarily due to an increase in the allocable amount of the salary and bonus of our officers and their respective staffs, which OFS Advisor passed along to us during the three months ended March 31, 2014 and 2013, respectively.
Net Realized and Unrealized Gain (Loss) on Investments
| Three Months Ended | ||||||||
| March 31 | ||||||||
| 2014 | 2013 | |||||||
| (Amounts in thousands) | ||||||||
| Net realized gain on non-affiliate investments | $ | - | $ | 5 | ||||
| Net change in unrealized depreciation on non-control/non-affiliate investments | 926 | 1,173 | ||||||
| Net change in unrealized appreciation/depreciation on affiliate investments | 519 | 251 | ||||||
| Net change in unrealized depreciation on control investment | (794 | ) | - | |||||
| Net realized and unrealized gain on investments | $ | 651 | $ | 1,429 | ||||
For the three months ended March 31, 2014, we recorded approximately $0.9 million of net change in unrealized depreciation on non-control/non-affiliate investments, consisting of approximately $0.2 million of net change in unrealized depreciation on non-control/non-affiliate investments held by OFS Capital WM, and approximately $0.7 million of net change in unrealized depreciation on non-control/non-affiliate investments held by SBIC I LP. In addition, for the three months ended March 31, 2014, we recorded approximately $0.5 million of net change in unrealized appreciation on affiliate investments held by SBIC I LP, as well as approximately $(0.8) million of net change in unrealized depreciation on a control investment held by SBIC I LP (Tangible Software, Inc). For the three months ended March 31, 2013, we recorded approximately $1.2 million of net change in unrealized depreciation on non-control/non-affiliate investments held by OFS Capital WM, as well as approximately $0.3 million of net change in unrealized depreciation on affiliate investment, consisting solely of our equity investment in SBIC I LP, which we accounted for at fair value at March 31, 2013.
| 45 |
Financial Condition, Liquidity and Capital Resources
Cash and Cash Equivalents
At March 31, 2014 and December 31, 2013, we had cash and cash equivalents of $37.0 million and $28.6 million, respectively. As of March 31, 2014 and December 31, 2013, $31.5 million and $21.5 million of cash and cash equivalents, respectively, were capital commitments funded by OFS Capital into SBIC I LP. During the three months ended March 31, 2014, we had net cash provided by operating activities of $17.2 million, primarily due to our $2.1 million net increase in net assets resulting from operations, net proceeds of $19.9 million we received from principal payments on our portfolio investments, as well as cash collection in January 2014 of $4.5 million from our December 2013 sale of a portfolio investment, partially offset by $8.9 million of cash we used to purchase portfolio investments.
Net cash used in financing activities was $8.8 million for the three months ended March 31, 2014, primarily attributable to the $5.5 million of net repayments on the OFS Capital WM Credit Facility as well as $3.2 million of cash we paid in dividends and distributions.
We intend to generate additional cash flows from our operations, distributions from equity investments, future borrowings, including borrowings by OFS Capital WM pursuant to the OFS Capital WM Credit Facility as well as by SBIC I LP under the SBA debentures, and through any future offerings of securities. Our primary uses of funds are investments in debt and equity investments, interest payments on indebtedness, payment of other expenses, and cash distributions to our shareholders.
The OFS Capital WM Credit Facility
On September 28, 2010, OFS Capital WM entered into a $180 million secured revolving credit facility (as amended from time to time, the “OFS Capital WM Credit Facility”) with Wells Fargo and Madison Capital Funding, LLC (“Madison Capital”), with the Class A lenders (initially Wells Fargo) providing up to $135 million in Class A loans (“Class A Facility”) and the Class B lenders (initially Madison Capital) providing up to $45 million in Class B loans (“Class B Facility”). The OFS Capital WM Credit Facility is secured by all current and future eligible loans acquired by OFS Capital WM. The loan facilities with Wells Fargo and Madison Capital had five- and six-year terms, respectively, and both facilities provided a one-year option for extension upon the approval of the Class A and Class B lenders. The loan facilities had a reinvestment period of two years after the closing date of the OFS Capital WM Credit Facility, which could be extended by one year with the consent of each lender. Outstanding borrowings on the loan facilities were limited to the lesser of (1) $180 million and (2) the borrowing base as defined by the OFS Capital WM Credit Facility loan documents. OFS Capital WM is obligated to pay interest on outstanding Class A loans (and on the Class B loans until the termination of the Class B Facility in January 2013) on each quarterly payment date.
As of March 31, 2014 and December 31, 2013, we had $103.5 million and $109.0 million, respectively, in indebtedness outstanding under the OFS Capital WM Credit Facility.
If at any time the amount of Class A loans outstanding exceeds the borrowing base, a borrowing base deficiency will exist. In that event, OFS Capital WM will have three business days to eliminate the deficiency by, among other things, (a) depositing additional cash into the relevant collection account, (b) repaying Class A loans, or (c) pledging additional eligible loan assets. In the case of such a deficiency, we may determine it is in our best interests to make additional capital contributions to OFS Capital WM in the form of cash or additional eligible loan assets to protect the value of our equity investment in OFS Capital WM, and our additional contributions could be material.
Under the OFS Capital WM Credit Facility, MCF Capital Management, LLC, which is the loan manager and an affiliated entity of Madison Capital, or the Loan Manager, charges both a senior and subordinated management fee to OFS Capital WM for its services, each at 0.25% per annum of the assigned value of the underlying portfolio investments, plus an accrued fee that is deferred until after the end of the investment period of the portfolio investments. For the three months ended March 31, 2014 and 2013, we incurred management fee expense of approximately $225 thousand and $295 thousand, respectively, to the Loan Manager.
SBA Debentures
As a result of the Tamarix Acquisitions, SBIC I LP became our wholly-owned subsidiary effective December 4, 2013. SBIC I LP has an SBIC license that allows it to obtain leverage by issuing SBA-guaranteed debentures, subject to issuance of a capital commitment by the SBA and customary procedures. These debentures are non-recourse to OFS Capital, and bear interest payable semi-annually, and each debenture has a maturity date that is ten years following issuance. The interest rate is fixed at the time of issuance at a market-driven spread over U.S. Treasury Notes with ten-year maturities.
| 46 |
Under present SBIC regulations, the maximum amount of SBA-guaranteed debt that may be issued by a single SBIC licensee is $150.0 million. An SBIC fund may borrow up to two times the amount of its regulatory capital, subject to customary regulatory requirements. In connection with the Tamarix Acquisitions, SBIC I LP became our wholly-owned subsidiary on December 4, 2013 and OFS Capital increased its commitments to SBIC I LP to $75.0 million. As of March 31, 2014, OFS Capital had funded $61.4 million of the $75.0 million commitment. As of March 31, 2014, SBIC I LP had leverage commitments of $61.4 million from the SBA and $26.0 million of outstanding SBA-guaranteed debentures, leaving incremental borrowing capacity of $35.4 million under present SBIC regulations. As of December 31, 2013, SBIC I LP had leverage commitments of $49.4 million from the SBA and $26.0 million of outstanding SBA-guaranteed debentures, leaving incremental borrowing capacity of $23.4 million.
SBICs are designed to stimulate the flow of private equity capital to eligible small businesses. Under present SBA regulations, eligible small businesses include businesses that have a tangible net worth not exceeding $18.0 million and have average annual fully taxed net income not exceeding $6.0 million for the two most recent fiscal years. In addition, an SBIC must devote 25.0% of its investment activity to “smaller” enterprises as defined by the SBA. A smaller enterprise is one that has a tangible net worth not exceeding $6.0 million and has average annual fully taxed net income not exceeding $2.0 million for the two most recent fiscal years. SBA regulations also provide alternative criteria to determine eligibility, which may include, among other things, the industry in which the business is engaged, the number of employees of the business, its gross sales, and the extent to which the SBIC is proposing to participate in a change of ownership of the business. According to SBA regulations, SBICs may make long-term loans to small businesses, invest in the equity securities of such businesses and provide them with consulting and advisory services.
SBIC I LP is periodically examined and audited by the SBA’s staff to determine its compliance with SBA regulations. If SBIC I LP fails to comply with applicable SBA regulations, the SBA could, depending on the severity of the violation, limit or prohibit SBIC I LP’s use of debentures, declare outstanding debentures immediately due and payable, and/or limit SBIC I LP from making new investments. In addition, SBIC I LP may also be limited in its ability to make distributions to OFS Capital if it does not have sufficient capital in accordance with SBA regulations. Such actions by the SBA would in turn, negatively affect OFS Capital.
In order to access the full $150 million in SBA-guaranteed debentures potentially available to it under the SBIC license held by SBIC I LP, OFS Capital will need to fund an additional $13.6 million into SBIC I LP. There can be no assurance as to when, or whether, OFS Capital will be able to invest the additional $13.6 million into SBIC I LP.
Other Liquidity Matters
We expect to fund the growth of our investment portfolio utilizing borrowings under the OFS Capital WM Credit Facility, SBA debentures, future equity offerings, including our dividend reinvestment plan, and issuances of senior securities or future borrowings, to the extent permitted by the 1940 Act. We cannot assure shareholders that our plans to raise capital will be successful. In addition, we intend to distribute to our shareholders substantially all of our taxable income in order to satisfy the requirements applicable to RICs under Subchapter M of the Code. Consequently, we may not have the funds or the ability to fund new investments or make additional investments in our portfolio companies to fund our unfunded commitments to portfolio companies. The illiquidity of our portfolio investments may make it difficult for us to sell these investments when desired and, if we are required to sell these investments, we may realize significantly less than their recorded value.
In addition, as a BDC, we generally will be required to meet a coverage ratio of total assets, less liabilities and indebtedness not represented by senior securities (including SBIC I LP’s SBA-guaranteed debt), to total senior securities, which include all of our borrowings (excluding SBA-guaranteed debt) and any outstanding preferred stock (of which we had none at March 31, 2014), of at least 200%. This requirement limits the amount that we may borrow. To fund growth in our investment portfolio in the future, we anticipate needing to raise additional capital from various sources, including the equity markets and the securitization or other debt-related markets, which may or may not be available on favorable terms, if at all.
Off-Balance Sheet Arrangements
We may be a party to financial instruments with off-balance sheet risk in the normal course of our business to meet the financial needs of our portfolio companies. As of March 31, 2014, we had $4.8 million of total unfunded commitments to three portfolio companies. Unfunded commitments involve, to varying degrees, elements of credit risk in excess of the amount recognized in the balance sheet and are not reflected on our balance sheet. In addition, as of March 31, 2014, OFS Capital had approximately $13.6 million of unfunded commitments to SBIC I LP.
| 47 |
Contractual Obligations
The following table shows our contractual obligations as of March 31, 2014:
| Payments due by period | ||||||||||||||||||||
| Less than 1 | After 5 | |||||||||||||||||||
| Contractual Obligations (1) | Total | year | 1-3 years | 3-5 years (2) | years (2) | |||||||||||||||
| (Amounts in thousands) | ||||||||||||||||||||
| OFS Capital WM Credit Facility | $ | 103,459 | $ | - | $ | - | $ | 103,459 | $ | - | ||||||||||
| SBA Debentures | 26,000 | - | - | - | 26,000 | |||||||||||||||
| Total | $ | 129,459 | $ | - | $ | - | $ | 103,459 | $ | 26,000 | ||||||||||
(1) Excludes commitments to extend credit to our portfolio companies.
(2) The OFS Capital WM Facility is scheduled to mature on December 31, 2018. The SBA debentures are scheduled to mature between September 2022 and March 2024.
We have entered into contracts with third parties under which we have material future commitments—the Advisory Agreement, pursuant to which OFS Advisor has agreed to serve as our investment adviser, and the Administration Agreement, pursuant to which OFS Services has agreed to furnish us with the facilities and administrative services necessary to conduct our day-to-day operations.
We have subscribed for $75.0 million of total capital commitments to SBIC I LP, of which $61.4 million was funded as of March 31, 2014.
Commitments and Contingencies
At both March 31, 2014 and December 31, 2013, we had $4.8 million of total unfunded commitments to three portfolio companies. Upon completion of the Tamarix Acquisitions on December 4, 2013, OFS Capital increased its commitment to SBIC I LP to $75.0 million. As of March 31, 2014, OFS Capital had funded $61.4 million of the $75.0 million commitment.
From time to time, we are involved in legal proceedings in the normal course of its business. Although the outcome of such litigation cannot be predicted with any certainty, management is of the opinion, based on the advice of legal counsel, that final disposition of any litigation should not have a material adverse effect on our financial position.
In the normal course of business, we enter into contracts and agreements that contain a variety of representations and warranties that provide general indemnifications. Our maximum exposure under these arrangements is unknown, as this would involve future claims that may be made against us that have not occurred. We believe the risk of any material obligation under these indemnifications to be low.
Distributions
We are taxed as a RIC under the Code. Generally, a RIC is entitled to deduct dividends it pays to its shareholders from its income to determine “taxable income.” Taxable income includes our taxable interest, dividend and fee income, and taxable net capital gains. Taxable income generally differs from net income for financial reporting purposes due to temporary and permanent differences in the recognition of income and expenses, and generally excludes net unrealized appreciation or depreciation, as gains or losses are not included in taxable income until they are realized. In addition, gains realized for financial reporting purposes may differ from gains included in taxable income as a result of our election to recognize gains using installment sale treatment, which generally results in the deferment of gains for tax purposes until notes or other amounts, including amounts held in escrow, received as consideration from the sale of investments are collected in cash. Taxable income includes non-cash income, such as changes in accrued and reinvested interest and dividends, which includes contractual PIK interest, and the amortization of discounts and fees. Cash collections of income resulting from contractual PIK interest or the amortization of discounts and fees generally occur upon the repayment of the loans or debt securities that include such items. Non-cash taxable income is reduced by non-cash expenses, such as realized losses and depreciation, and amortization expense.
Our board of directors maintains a variable dividend policy with the objective of distributing four quarterly distributions in an amount not less than 90-100% of our taxable quarterly income or potential annual income for a particular year. In addition, at the end of the year, we may also pay an additional special dividend, or fifth dividend, such that we may distribute approximately all of our annual taxable income in the year it was earned, while maintaining the option to spill over our excess taxable income to a following year.
| 48 |
The following table summarizes our distributions declared and paid to date on all shares subsequent to our IPO (dollar amounts in thousands except per share data):
| Amount | ||||||||||||
| Date Declared | Record Date | Payment Date | Per Share | Total Amount | ||||||||
| Fiscal 2014 | ||||||||||||
| January 21, 2014 | January 31, 2014 | February 14, 2014 | $ | 0.34 | $ | 3,274 | ||||||
| Fiscal 2013 | ||||||||||||
| September 25, 2013 | October 17, 2013 | October 31, 2013 | $ | 0.34 | $ | 3,273 | ||||||
| June 25, 2013 | July 17, 2013 | July 31, 2013 | 0.34 | 3,272 | ||||||||
| March 26, 2013 | April 17, 2013 | April 30, 2013 | 0.34 | 3,269 | ||||||||
| Fiscal 2012 | ||||||||||||
| November 26, 2012 (1) | January 17, 2013 | January 31, 2013 | $ | 0.17 | $ | 1,628 | ||||||
| (1) | Represents the distribution declared in the specified period, which, if prorated for the number of days remaining in the fourth quarter after our IPO in November 2012, would be $0.34 per share. |
We may not be able to achieve operating results that will allow us to make distributions at a specific level or to increase the amount of these distributions from time to time. If we do not distribute a certain percentage of our income annually, we will suffer adverse tax consequences, including possible loss of our status as a regulated investment company. We cannot assure shareholders that they will receive any distributions at a particular level.
Distributions in excess of our current and accumulated earnings and profits generally are treated first as a return of capital to the extent of the shareholder’s tax basis, and any remaining distributions are treated as a capital gain. The determination of the tax attributes of our distributions is made annually as of the end of our fiscal year based upon our taxable income for the full year and distributions paid for the full year; therefore, a determination made on a quarterly basis may not be representative of the tax attributes of our annual distributions to shareholders. For the distribution paid during the three months ended March 31, 2014, out of the approximately $3.3 million distribution, approximately 56% represented a return of capital and 44% represented ordinary income.
Each year a statement on Form 1099-DIV identifying the source of the distribution (i.e., paid from ordinary income, paid from net capital gains on the sale of securities, and/or a return of paid-in-capital surplus, which is a nontaxable distribution) is mailed to our U.S. shareholders. To the extent our taxable earnings fall below the total amount of our distributions for that fiscal year, a portion of those distributions may be deemed a taxable return of capital to our shareholders.
We maintain an “opt-out” dividend reinvestment plan for our common shareholders. As a result, if we declare a dividend, cash dividends are automatically reinvested in additional shares of our common stock unless the shareholder specifically “opts out” of the dividend reinvestment plan and chooses to receive cash dividends.
Related Party Transactions
Investment Advisory Agreement
We have entered into the Advisory Agreement with OFS Advisor and will pay OFS Advisor a management fee and incentive fee. Pursuant to the Advisory Agreement with OFS Advisor and subject to the overall supervision of our board of directors and in accordance with the 1940 Act, OFS Advisor provides investment advisory services to us. For providing these services, OFS Advisor receives a fee from us consisting of two components—a base management fee and an incentive fee. From the completion of our IPO through October 31, 2013, the base management fee was calculated at an annual rate of 0.875% based on the average value of our total assets (other than cash and cash equivalents but including assets purchased with borrowed amounts and including assets owned by any consolidated entity at the end of the two most recently completed calendar quarters, adjusted for any share issuances or repurchases during the quarter. Beginning on November 1, 2013 and through March 31, 2014, pursuant to the Advisory Agreement, the base management fee was calculated at an annual rate of 1.75% based on the average value of our total assets (other than cash and cash equivalents but including assets purchased with borrowed amounts and including assets owned by any consolidated entity) at the end of the two most recently completed calendar quarters. OFS Advisor has elected to exclude from the base management fee calculation any base management fee that would be owed in respect of the intangible asset and goodwill resulting from our acquisitions of the remaining ownership interests in SBIC I LP and SBIC I GP on December 4, 2013. The base management fee is payable quarterly in arrears.
| 49 |
On May 5, 2014, we were notified by OFS Advisor that, effective as of April 1, 2014, it would reduce its base management fee by two-thirds for the balance of the 2014 fiscal year. Specifically, OFS Advisor agreed to reduce its base management fee from 0.4375% per quarter to 0.145833% per quarter for the second, third, and fourth quarters of 2014. Accordingly, the effective annual base management fee for the 2014 fiscal year will be equal to or less than 50% of the 1.75% required by our Advisory Agreement with OFS Advisor, or not greater than 0.875%. OFS Advisor informed us that this reduction was being made for the benefit of our shareholders to take into account unforeseen delays in completing the Tamarix Acquisitions.
The incentive fee has two parts. One part is calculated and payable quarterly in arrears based on our pre-incentive fee net investment income for the quarter. “Pre-incentive fee net investment income” means interest income, dividend income and any other income (including any other fees such as commitment, origination and sourcing, structuring, diligence and consulting fees or other fees that we receive from portfolio companies but excluding fees for providing managerial assistance) accrued during the calendar quarter, minus operating expenses for the quarter (including the base management fee, any expenses payable under the Administration Agreement and any interest expense and dividends paid on any outstanding preferred stock, but excluding the incentive fee). Pre-incentive fee net investment income includes, in the case of investments with a deferred interest feature (such as OID, debt instruments with PIK interest and zero coupon securities), accrued income that we have not yet received in cash.
Pre-incentive fee net investment income does not include any realized gains, realized losses, unrealized capital appreciation or unrealized capital depreciation. Because of the structure of the incentive fee, it is possible that we may pay an incentive fee in a quarter where we incur a loss. For example, if we receive pre-incentive fee net investment income in excess of the hurdle rate (as defined below) for a quarter, we will pay the applicable incentive fee even if we have incurred a loss in that quarter due to realized capital losses and unrealized capital depreciation.
Pre-incentive fee net investment income, expressed as a rate of return on the value of our net assets (defined as total assets less indebtedness and before taking into account any incentive fees payable during the period) at the end of the immediately preceding calendar quarter, is compared to a fixed “hurdle rate” of 2.0% per quarter. If market interest rates rise, we may be able to invest our funds in debt instruments that provide for a higher return, which would increase our pre-incentive fee net investment income and make it easier for OFS Advisor to surpass the fixed hurdle rate and receive an incentive fee based on such net investment income. There is no accumulation of amounts on the hurdle rate from quarter to quarter and accordingly there is no clawback of amounts previously paid if subsequent quarters are below the quarterly hurdle rate, and there is no delay of payment if prior quarters are below the quarterly hurdle rate.
We pay OFS Advisor an incentive fee with respect to our pre-incentive fee net investment income in each calendar quarter as follows:
| • | no incentive fee in any calendar quarter in which the pre-incentive fee net investment income does not exceed the hurdle rate; |
| • | 100% of our pre-incentive fee net investment income with respect to that portion of such pre-incentive fee net investment income, if any, that exceeds the hurdle rate but is less than 2.5% in any calendar quarter. We refer to this portion of our pre-incentive fee net investment income (which exceeds the hurdle rate but is less than 2.5%) as the “catch-up” provision. The catch-up is meant to provide OFS Advisor with 20.0% of the pre-incentive fee net investment income as if a hurdle rate did not apply if this pre-incentive fee net investment income exceeds 2.5% in any calendar quarter; and |
| • | 20.0% of the amount of our pre-incentive fee net investment income, if any, that exceeds 2.5% in any calendar quarter. |
The second part of the incentive fee (the “Capital Gains Fee”) is determined and payable in arrears as of the end of each calendar year (or upon termination of the Advisory Agreement, as of the termination date) and is calculated at the end of each applicable year by subtracting (a) the sum of our cumulative aggregate realized capital losses and our aggregate unrealized capital depreciation from (b) our cumulative aggregate realized capital gains. If such amount is positive at the end of such year, then the Capital Gains Fee for such year is equal to 20.0% of such amount, less the aggregate amount of Capital Gains Fees paid in all prior years. If such amount is negative, then there is no Capital Gains Fee for such year.
The cumulative aggregate realized capital gains are calculated as the sum of the differences, if positive, between (a) the net sales price of each investment in our portfolio when sold and (b) the accreted or amortized cost basis of such investment.
The cumulative aggregate realized capital losses are calculated as the sum of the amounts by which (a) the net sales price of each investment in our portfolio when sold is less than (b) the accreted or amortized cost basis of such investment.
| 50 |
The aggregate unrealized capital depreciation is calculated as the sum of the differences, if negative, between (a) the valuation of each investment in our portfolio as of the applicable Capital Gains Fee calculation date and (b) the accreted or amortized cost basis of such investment. Unrealized capital appreciation is accrued, but not paid until said appreciation is realized.
We accrue the Capital Gains Fee if, on a cumulative basis, the sum of net realized capital gains and (losses) plus net unrealized appreciation and (depreciation) is positive. OFS Advisor has elected to exclude from the Capital Gains Fee calculation any incentive fee that would be owed in respect of the realized gain on step acquisition resulting from the Tamarix Acquisitions.
We did not incur any incentive fee expenses for the three months ended March 31, 2014 and 2013.
License Agreement
We have entered into a license agreement with OFSAM under which OFSAM has agreed to grant us a non-exclusive, royalty-free license to use the name “OFS.”
Administration Agreement
Pursuant to an Administration Agreement, OFS Services furnishes us with office facilities and equipment, necessary software licenses and subscriptions and clerical, bookkeeping and record keeping services at such facilities. Under the Administration Agreement, OFS Services performs, or oversees the performance of, our required administrative services, which include being responsible for the financial records that we are required to maintain and preparing reports to our shareholders and all other reports and materials required to be filed with the SEC or any other regulatory authority. In addition, OFS Services assists us in determining and publishing our net asset value, oversees the preparation and filing of our tax returns and the printing and dissemination of reports to our shareholders, and generally oversees the payment of our expenses and the performance of administrative and professional services rendered to us by others. Under the Administration Agreement, OFS Services would provide managerial assistance on our behalf to certain portfolio companies that accept our offer to provide such assistance. Payments under the Administration Agreement are equal to an amount based upon our allocable portion (subject to the review and approval of our board of directors) of OFS Services’ overhead in performing its obligations under the Administration Agreement, including rent and our allocable portion of the cost of our officers, including our chief executive officer, chief financial officer, chief compliance officer, chief accounting officer, and corporate secretary, and their respective staffs. The administrative fee is payable quarterly in arrears. For the three months ended March 31, 2014 and 2013, we incurred $475 thousand and $280 thousand, respectively, of administrative fees.
Staffing Agreement
OFS Advisor has entered into a Staffing Agreement with Orchard First Source Capital, Inc., or OFSC, which is a wholly owned subsidiary of OFSAM. Under this agreement, OFSC makes available to OFS Advisor experienced investment professionals and access to the senior investment personnel and other resources of OFSC and its affiliates. The Staffing Agreement provides OFS Advisor with access to deal flow generated by the professionals of OFSC and its affiliates and commits the members of the Advisor Investment Committee to serve in that capacity. OFS Advisor capitalizes on the significant deal origination and sourcing, credit underwriting, due diligence, investment structuring, execution, portfolio management and monitoring experience of OFSC’s investment professionals.
OFSC also has entered into a staffing and corporate services agreement with OFS Services. Under this agreement, OFSC makes available to OFS Services experienced investment professionals and access to the administrative resources of OFSC.
Recent Developments
On April 8, 2014, our board of directors dismissed McGladrey LLP (“McGladrey”) as our independent registered public accounting firm. The decision of our board of directors to dismiss McGladrey was recommended by our audit committee. In March and April 2014, the audit committee of our board of directors conducted a review of the selection of our independent registered public accounting firm. As part of this process, we contacted four other independent registered public accounting firms and solicited input from them on their ability to provide the audit services that we require. Among other considerations, we sought detailed information about their experience auditing other business development companies that have elected to be taxed as regulated investment companies. We contacted these four other independent registered public accounting firms for the audit of our annual consolidated financial statements for the fiscal year ending December 31, 2014. As a result of this review, on April 11, 2014, we engaged BDO USA, LLP (“BDO”) to serve as our new independent registered public accounting firm to audit our consolidated financial statements for the fiscal year ending December 31, 2014.
On May 5, 2014, we were notified by OFS Advisor that, effective as of April 1, 2014, it would reduce its base management fee by two-thirds for the balance of the 2014 fiscal year. Specifically, OFS Advisor agreed to reduce its base management fee from 0.4375% per quarter to 0.145833% per quarter for the second, third, and fourth quarters of 2014. Accordingly, the effective annual base management fee for the 2014 fiscal year will be equal to or less than 50% of the 1.75% required by our Advisory Agreement with OFS Advisor, or not greater than 0.875%. OFS Advisor informed us that this reduction was being made for the benefit of our shareholders to take into account unforeseen delays in completing the Tamarix Acquisitions.
| 51 |
Had the 0.875% effective annual base management fee been in place as of January 1, 2014, we would have been charged a quarterly base management fee of 0.21875%, and as such, would have recorded a base management fee expense of $519 thousand during the three months ended March 31, 2014, which is $520 thousand lower than the base management fee expense of approximately $1.04 million that we actually recognized during the three months ended March 31, 2014.
For 2014, the effective annual base management fee to OFS Advisor will be 0.875% based on the average value of our total assets (other than cash, cash equivalents, and the intangible asset and goodwill resulting from the Tamarix Acquisitions, but including assets purchased with borrowed amounts and including assets owned by any consolidated entity) at the end of the two most recently completed calendar quarters.
On May 7, 2014, our board of directors declared a distribution of $0.34 per share for the 2014 second quarter, payable on June 30, 2014 to shareholders of record as of June 16, 2014.
| Item 3. | Quantitative and Qualitative Disclosures About Market Risk |
We are subject to financial market risks, including changes in interest rates. At March 31, 2014, 84% of our debt investments bore interest at floating interest rates and 16% of our debt investments bore fixed interest rates. The interest rates on our debt investments bearing floating interest rates are usually based on a floating LIBOR, and the debt investments typically contain interest rate re-set provisions that adjust applicable interest rates to current rates on a periodic basis. All of the debt investments bearing floating interest rates in our portfolio as of March 31, 2014 had interest rate floors, which have effectively converted those debt investments to fixed rate debt investments in the current interest rate environment.
In addition, the OFS Capital WM Facility has a floating interest rate provision, and we expect that other credit facilities into which we may enter in the future may have floating interest rate provisions.
Assuming that our consolidated balance sheet as of March 31, 2014 was to remain constant, and that we took no actions to alter our existing interest rate sensitivity, the following table shows the annualized impact of hypothetical base rate changes in interest rates.
| Interest | Interest | Net increase | ||||||||||
| Basis point increase(1) | income | expense | (decrease) | |||||||||
| (Amounts in thousands) | ||||||||||||
| 100 | $ | 169 | $ | (1,049 | ) | $ | (880 | ) | ||||
| 200 | 1,841 | (2,098 | ) | (257 | ) | |||||||
| 300 | 3,724 | (3,147 | ) | 577 | ||||||||
| 400 | 5,607 | (4,196 | ) | 1,411 | ||||||||
| 500 | 7,490 | (5,245 | ) | 2,245 | ||||||||
| (1) | A decline in interest rates would not have a material impact on our consolidated financial statements. |
Although we believe that the foregoing analysis is indicative of our sensitivity to interest rate changes, it does not adjust for potential changes in the credit market, credit quality, size and composition of the assets in our portfolio, and other business developments, including borrowings under our credit facility, that could affect net increase in net assets resulting from operations, or net income. Accordingly, no assurances can be given that actual results would not differ materially from the statement above.
We are subject to financial market risks, including changes in interest rates. Changes in interest rates affect both our cost of funding and the valuation of our investment portfolio. Our risk management systems and procedures are designed to identify and analyze our risk, to set appropriate policies and limits and to continually monitor these risks and limits by means of reliable administrative and information systems and other policies and programs. Our investment portfolio and investment income may be affected by changes in various interest rates, including LIBOR and prime rates.
| 52 |
| Item 4. | Controls and Procedures |
Disclosure Controls and Procedures
Our Chief Executive Officer and Chief Financial Officer, under the supervision and with the participation of our management, conducted an evaluation of our disclosure controls and procedures, as defined in Rule 13a-15(e) and 15d-15(e) of the Securities Exchange Act of 1934, as amended (the “Exchange Act”). As of the end of the period covered by this quarterly report on Form 10-Q, our Chief Executive Officer and Chief Financial Officer have concluded that our disclosure controls and procedures were effective to ensure that information required to be disclosed by us in reports that we file or submit under the Exchange Act is recorded, processed, summarized, and reported within the time periods specified in the SEC’s rules and forms, and that information required to be disclosed by us in the reports that we file or submit under the Exchange Act is accumulated and communicated to our management, including our Chief Executive Officer and Chief Financial Officer, as appropriate, to allow timely decisions regarding required disclosure.
Changes in Internal Control Over Financial Reporting
As described in Item 9A of our Annual Report on Form 10-K for the year ended December 31, 2013, management identified a material weakness related to management’s analysis regarding the appropriate accounting treatment for the Tamarix Acquisitions and implemented remediation steps in early 2014 to address the material weakness by providing that all future business combination transactions will be accounted for in accordance with Accounting Standards Codification Topic 805, or ASC Topic 805. The Tamarix Acquisitions was a complex, non-routine transaction. We performed extensive accounting research and analysis regarding the appropriate accounting treatment for the Tamarix Acquisitions, because ASC Topic 805 does not include a scope-out for investment company combinations. Based on our research and analysis, we initially considered treating the Tamarix Acquisitions as a business combination governed by ASC Topic 805, albeit reflecting as a day one loss, rather than recording as goodwill or other intangibles, the excess purchase price over the fair value of the net identifiable assets. We believed that approach, which would constitute a departure from GAAP, might be appropriate, because the traditional business combination treatment (including recognition of goodwill) under ASC Topic 805 did not appear to appropriately reflect a business combination between two investment companies, especially in our situation, where the acquirer (OFS Capital) had already been fair valuing the underlying assets of the acquiree (Tamarix LP) for a number of quarters. We ultimately decided that any departure from ASC Topic 805 was not warranted.
Other than as described above, there have been no changes in our internal control over financial reporting (as defined in Rule 13a-15(f) under the Securities Exchange Act of 1934, as amended) that occurred during the quarter ended March 31, 2014 that have materially affected, or are reasonably likely to materially affect, our internal control over financial reporting.
PART II—OTHER INFORMATION
| Item 1. | Legal Proceedings |
We, OFS Advisor and OFS Services, are not currently subject to any material pending or threatened legal proceedings against us as of March 31, 2014. From time to time, we may be a party to certain legal proceedings incidental to the normal course of our business, including the enforcement of our rights under contracts with our portfolio companies. While the outcome of these legal proceedings cannot be predicted with certainty, we do not expect that these proceedings will have a material effect upon our business, financial condition or results of operations.
| Item 1A. | Risk Factors |
Investing in our common stock may be speculative and involves a high degree of risk. In addition to the other information contained in this Quarterly Report on Form 10-Q, including our financial statements, and the related notes, schedules and exhibits, you should carefully consider the risk factors described in Part I, “Item 1A. Risk Factors” in our Annual Report on Form 10-K for the fiscal year ended December 31, 2013, which could materially affect our business, financial condition and/or operating results. The risks described in our Annual Report on Form 10-K are not the only risks facing our Company. Additional risks and uncertainties not currently known to us or that we currently deem to be immaterial also may materially and adversely affect our business, financial condition and/or operating results.
There have been no material changes from the risk factors previously disclosed in Part I, “Item 1A. Risk Factors” in our Annual Report on Form 10-K for the year ended December 31, 2013, which should be read together with the other risk factors and information disclosed elsewhere in this Quarterly Report on Form 10-Q and our other reports filed with the SEC.
| Item 2. | Unregistered Sales of Equity Securities and Use of Proceeds |
During the three month period ended March 31, 2014, we issued 2,656 shares of common stock to shareholders in connection with our dividend reinvestment plan. These issuances were not subject to the registration requirements of the Securities Act of 1933, as amended. The aggregate value of the shares of our common stock issued under our dividend reinvestment plan was approximately $34,000.
| 53 |
| Item 3. | Defaults Upon Senior Securities |
Not applicable.
| Item 4. | Mine Safety Disclosures |
Not applicable.
| Item 5. | Other Information |
Not applicable.
| Item 6. | Exhibits |
Listed below are the exhibits that are filed as part of this report (according to the number assigned to them in Item 601 of Regulation S-K):
| Exhibit Number |
Description | |
| 31.1 | Certification of Chief Executive Officer pursuant to Rule 13a-14 of the Securities Exchange Act of 1934, as amended* | |
| 31.2 | Certification of Chief Financial Officer pursuant to Rule 13a-14 of the Securities Exchange Act of 1934, as amended* | |
| 32.1 | Certification of Chief Executive Officer pursuant to Section 906 of the Sarbanes-Oxley Act of 2002* | |
| 32.2 | Certificate of Chief Financial Officer pursuant to Section 906 of the Sarbanes-Oxley Act of 2002* |
| * | Filed herewith. |
Pursuant to the requirements of Section 13 or 15(d) of the Securities Exchange Act of 1934, the registrant has duly caused this report to be signed on its behalf by the undersigned, thereunto duly authorized.
| Dated: May 9, 2014 | OFS CAPITAL CORPORATION | |
| By: | /s/ GLENN R. PITTSON | |
| Name: | Glenn R. Pittson | |
| Title: | Chief Executive Officer | |
| By: | /s/ ROBERT S. PALMER | |
| Robert S. Palmer | ||
| Chief Financial Officer | ||
| 54 |
EXHIBIT INDEX
Description
| Exhibit Number |
||
| 31.1 | Chief Executive Officer Certification Pursuant to Exchange Act Rule 13a-14 (a), as adopted pursuant to Section 302 of the Sarbanes-Oxley Act of 2002* | |
| 31.2 | Chief Financial Officer Certification Pursuant to Exchange Act Rule 13a-14 (a), as adopted pursuant to Section 302 of the Sarbanes-Oxley Act of 2002* | |
| 32.1 | Chief Executive Officer Certification pursuant to 18 U.S.C. Section 1350, as adopted pursuant to Section 906 of the Sarbanes-Oxley Act of 2002* | |
| 32.2 | Chief Financial Officer Certification pursuant to 18 U.S.C. Section 1350, as adopted pursuant to Section 906 of the Sarbanes-Oxley Act of 2002* |
| * | Filed herewith. |
| 55 |