Attached files
| file | filename |
|---|---|
| 8-K - FORM 8-K - BROADRIDGE FINANCIAL SOLUTIONS, INC. | d722415d8k.htm |
| EX-99.1 - EX-99.1 - BROADRIDGE FINANCIAL SOLUTIONS, INC. | d722415dex991.htm |
 ©
2014 Broadridge Financial Solutions, Inc.
Broadridge and the Broadridge logo are registered trademarks of Broadridge
Financial Solutions, Inc. May 9, 2014
Earnings Webcast & Conference Call
Third Quarter 2014
Exhibit 99.2 |
 1
Forward-Looking Statements This presentation and other written or oral statements made from time to time by representatives of
Broadridge may contain “forward-looking statements” within the meaning of the
Private Securities Litigation Reform Act of 1995. Statements that are not historical in nature,
and which may be identified by the use of words such as “expects,” “assumes,” “projects,” “anticipates,”
“estimates,” “we believe,” “could be” and other words of similar
meaning, are forward-looking statements. In particular, information appearing in the
“Fiscal Year 2014 Financial Guidance” section are forward-looking statements. These statements are based on
management’s expectations and assumptions and are subject to risks and uncertainties that may
cause actual results to differ materially from those expressed. These risks and uncertainties
include those risk factors discussed in Part I, “Item 1A. Risk Factors” of our Annual
Report on Form 10-K for the fiscal year ended June 30, 2013 (the “2013 Annual Report”), as they may be
updated in any future reports filed with the Securities and Exchange Commission. All
forward-looking statements speak only as of the date of this presentation and are expressly
qualified in their entirety by reference to the factors discussed in the 2013 Annual Report.
These risks include: the success of Broadridge in retaining and selling additional services to its existing clients and in
obtaining new clients; Broadridge’s reliance on a relatively small number of clients, the
continued financial health of those clients, and the continued use by such clients of
Broadridge’s services with favorable pricing terms; changes in laws and regulations
affecting Broadridge’s clients or the investor communication services provided by Broadridge;
declines in participation and activity in the securities markets; any material breach of
Broadridge security affecting its clients’ customer information; the failure of
Broadridge’s outsourced data center services provider to provide the anticipated levels of
service; a disaster or other significant slowdown or failure of Broadridge’s systems or
error in the performance of Broadridge’s services; overall market and economic conditions
and their impact on the securities markets; Broadridge’s failure to keep pace with changes in technology and demands
of its clients; Broadridge’s ability to attract and retain key personnel; the impact of new
acquisitions and divestitures; and competitive conditions. Broadridge disclaims any obligation
to update or revise forward-looking statements that may be made to reflect events or
circumstances that arise after the date made or to reflect the occurrence of unanticipated events, other than as
required by law.
Explanation of the Company’s Use of Non-GAAP Financial Measures In certain circumstances, results have been presented that are not generally accepted accounting
principles measures (“Non- GAAP”) and should be viewed in addition to, and not as
a substitute for, the Company’s reported results. These Non-GAAP measures are
indicators that management uses to provide additional meaningful comparisons between current results and prior
reported results, and as a basis for planning and forecasting for future periods. In addition,
Broadridge believes this Non-GAAP information helps investors understand the effect of
these items on reported results and provides a better representation of the Company’s
performance. Accompanying this presentation is a reconciliation of these Non-GAAP measures to the comparable
GAAP measures.
Use of Material Contained Herein The information contained in this presentation is being provided for your convenience and information
only. This information is accurate as of the date of its initial presentation. If
you plan to use this information for any purpose, verification of its continued accuracy is
your responsibility. Broadridge assumes no duty to update or revise the information contained in this presentation.
You may reproduce information contained in this presentation provided you do not alter, edit, or
delete any of the content and provided you identify the source of the information as Broadridge
Financial Solutions, Inc., which owns the copyright. Broadridge and the Broadridge logo are registered trademarks of Broadridge Financial Solutions, Inc.
|
 2
Today’s Agenda
Opening Remarks
Rich Daly, President and CEO
Third Quarter and YTD 2014
Michael Liberatore,
Highlights and Segment Results
Acting Principal Financial Officer
Summary
Rich Daly, President and CEO
Q&A
Rich Daly, President and CEO
Michael Liberatore,
Acting Principal Financial Officer
Closing Remarks
Rich Daly, President and CEO |
 3
Key Messages
Record results combined with strategic momentum
Strong
results
led
by
Net
New
Business
(recurring
revenue
closed
sales
less
client
losses)
Market conditions remain favorable
Executing on our growth strategy including investing in our future growth
Reaffirming FY14 guidance; anticipating the upper half of
revenue and EPS guidance ranges
Momentum
in
both
businesses
and
record
results
enable
us
to
have
increased
confidence as we begin to set targets for FY15
Growing confidence in delivering sustainable top quartile
stockholder returns
Solid execution in both segments, Emerging and Acquired (E&A) product
solutions growth, and record financial results
Expecting current favorable market-based activities to continue
Growing and robust recurring revenue sales pipeline
Increasing investments aligned with the three macro trends
Strong
free
cash
flow
generation
providing
for
effective
capital
stewardship |
 4
Financial Highlights
Strong Revenue Growth
Q3 recurring revenues were up 9% (YTD up 9%) and total revenues were up 5% (YTD up
7%) Primarily due to Net New Business and internal growth
Record Q3 and YTD EPS
Q3 Non-GAAP diluted Earnings Per Share (EPS) of $0.44 was up 13% (YTD $1.08 up
46%) Q3 GAAP diluted EPS of $0.41 was up 17% (YTD $0.99 up 60%)
Primarily due to increased revenues and operating leverage coupled with improved
productivity Completed the acquisition of Emerald Connect
Will be integrated with Broadridge’s Forefield solutions to create
industry’s leading financial advisor client communication
solutions Emerald Connect acquisition expected to be accretive in FY15
Reaffirming FY14 guidance. Revenue and EPS expected to be in the
upper half of guidance ranges
7-8% recurring revenue growth (4-5% total revenue growth)
$2.15-2.25 Non-GAAP diluted EPS ($2.03-2.13 GAAP diluted EPS)
•
Mid-point of expected EPS ranges suggests Non-GAAP diluted EPS growth of
17% and GAAP diluted EPS growth of 23%
Free cash flow of $300M (at mid-point of range)
Increasing investments in solutions aligned with three macro trends to $33M from
$28M |
 Closed Sales
Performance YTD recurring revenue closed sales up 5%
Recurring revenue closed sales were $62M compared to $58M in
the prior year (Q3 sales were flat year over year ~$24M)
No large transactions of $5M or greater
Sales pipeline remains robust and is growing
Building momentum across both segments and progress on
pending large transactions
Reaffirming FY14 recurring revenue closed sales guidance
of $110-150M
Achievement of this range requires closing $20-40M of large
transactions of $5M or greater
Expecting to close at least one large transaction and would be
disappointed if this did not occur by year end
5 |
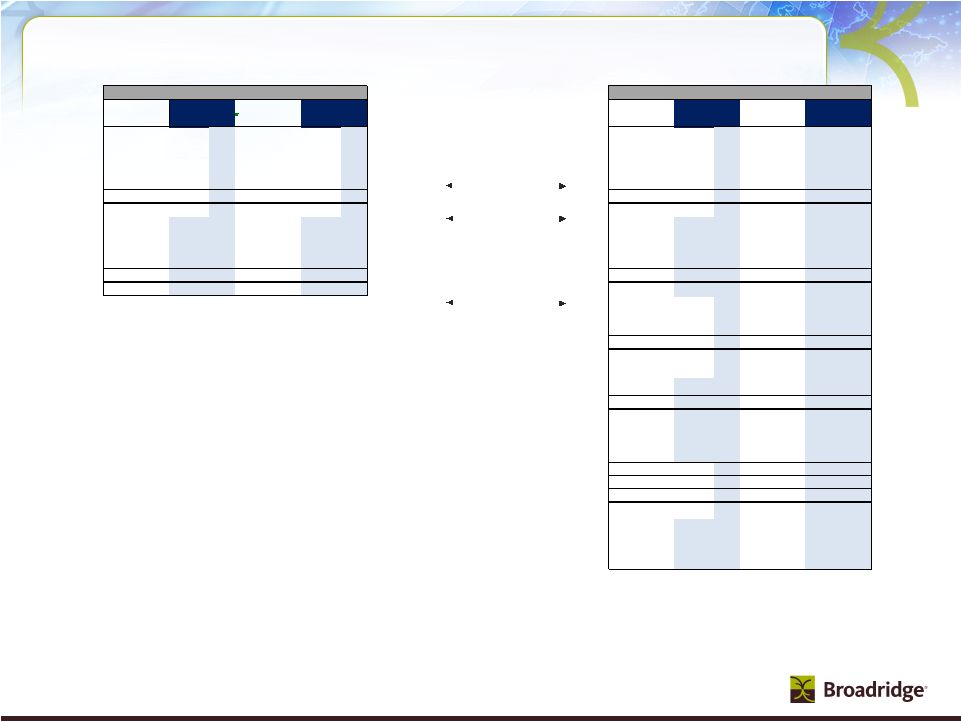
 6
Key Financial Drivers
3Q
3Q YTD
Actual
FY14
FY14
FY14
FY13
Range
Growth Drivers as a % of Recurring Revenue
Closed Sales
7%
7%
6%
7%
Client Losses
(3%)
(3%)
(1%)
(3%)
Net New Business
4%
4%
5%
4%
Internal Growth
(a)
4%
4%
(1%)
2-3%
Organic Growth
8%
8%
4%
6-7%
Acquisitions
1%
1%
0%
1%
Total Recurring Revenue Growth
9%
9%
4%
7-8%
Growth Drivers as a % of Total Revenue
Recurring Revenue
6%
6%
3%
4-5%
Event-Driven
(b)
0%
1%
1%
0%
Distribution
(c)
0%
1%
2%
0%
FX/Other
(1%)
(1%)
0%
0%
Total Revenue Growth
5%
7%
6%
4-5%
EBIT Margin
13.7%
12.4%
14.8%
16.5-17.1%
EPS
$0.44
$1.08
$1.88
$2.15-2.25
(a) Internal Growth includes SPS Equity & Fixed Income Trades, ICS Equity & Mutual Fund Stock
Record Growth, Transaction Reporting, Fulfillment, and Time & Materials (b) Event-Driven includes ICS Proxy Contest/Specials, Mutual Fund Proxy and Interim Communications
(c) Distribution includes pass-through fees from Matrix
(Recurring)
(Non-GAAP)
(Non-GAAP) |
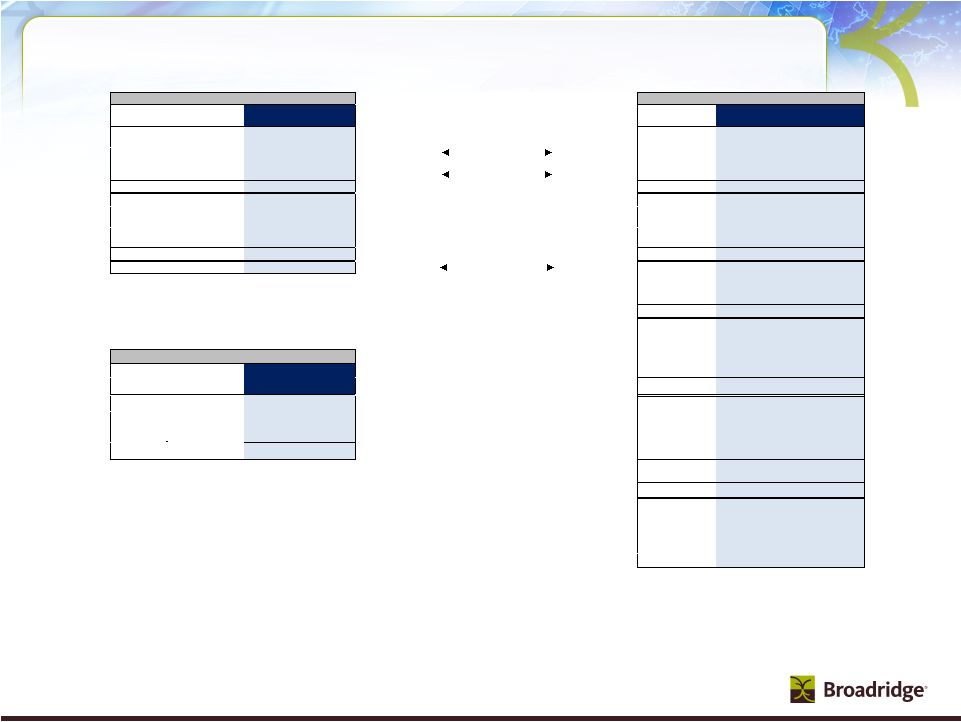
 7
Segment Results & Forecast –
Investor Communication Solutions
Recurring/Growth
Revenue/Growth
EBIT/Growth
Margin/Growth
Q3:
$209M /13%
$430M / 6%
$56M / 9%
12.9% / 30 bps
YTD:
$555M / 12%
$1,152M / 8%
$117M / 24%
10.2% / 140 bps
FY14:
$923 to $931M / 8 to 9%
$1,832 to $1,848M / 4 to 5%
$335 to $344M / 11 to 14%
18.3% to 18.6% /110 - 140bps
Reaffirming FY14 recurring revenue growth guidance of 8 to 9%
Approaching upper half of recurring revenue range due to Net New Business
(led by E&A product solutions) and the inclusion of Emerald Connect
acquisition
•
Q3 and full year current market-based activity in line with expectations •
Recurring revenue closed sales on track and maintaining strong client revenue
retention rate of 99%
•
Emerald Connect to be Non-GAAP EPS neutral in FY14 and expected to be
accretive thereafter
Event-driven and distribution revenue in line with expectations
Expected margin contribution of 110-140bps is inclusive of $12M of
investments aligned with the three macro trends
(Non-GAAP)
(Non-GAAP)
(Non-GAAP) |
  8
Reaffirming full year revenue range of 4 to 5% growth approaching the
upper half of the range
Q3 and YTD revenues increased due to Net New Business and higher
trade activity
Strong margin expansion driven by operating leverage and expected
productivity improvements
Recurring revenue closed sales of $10M for Q3 ($22M YTD) and
reaffirming guidance of $30-40M for FY14
Revenue/Growth
EBIT/Growth
Margin/Growth
Q3:
$178M / 5%
$38M / 32%
21.2% / 430 bps
Q3 YTD:
$521M / 7%
$104M / 79%
20.0% / 810 bps
FY14:
$687 to 695M / 4 to 5%
$117 to 125M / 38 to 47%
17.0% to 18.0% / 410 to 510 bps
Segment Results & Forecast –
Securities Processing Solutions
(Non-GAAP)
(Non-GAAP) |
 9
Closing Summary
Record YTD revenue and EPS results. FY14 revenue and
EPS expected to be in the upper half of the guidance
ranges
Confidence in our business is higher than it has ever been
Building momentum from sales pipeline growth, E&A product solutions, and
favorable market-based activities
Continued strong client revenue retention rate
Broadridge value creation plan expected to generate top
quartile stockholder returns for years to come
Top and bottom line contribution from both business segments
Ability to increase investments aligned with the three macro trends
Strong free cash flow generation providing for effective capital
stewardship |
 10
Q&A
There are no slides during this portion of the presentation
|
 11
Closing Comments
There are no slides during this portion of the presentation
|
 12
Appendix |
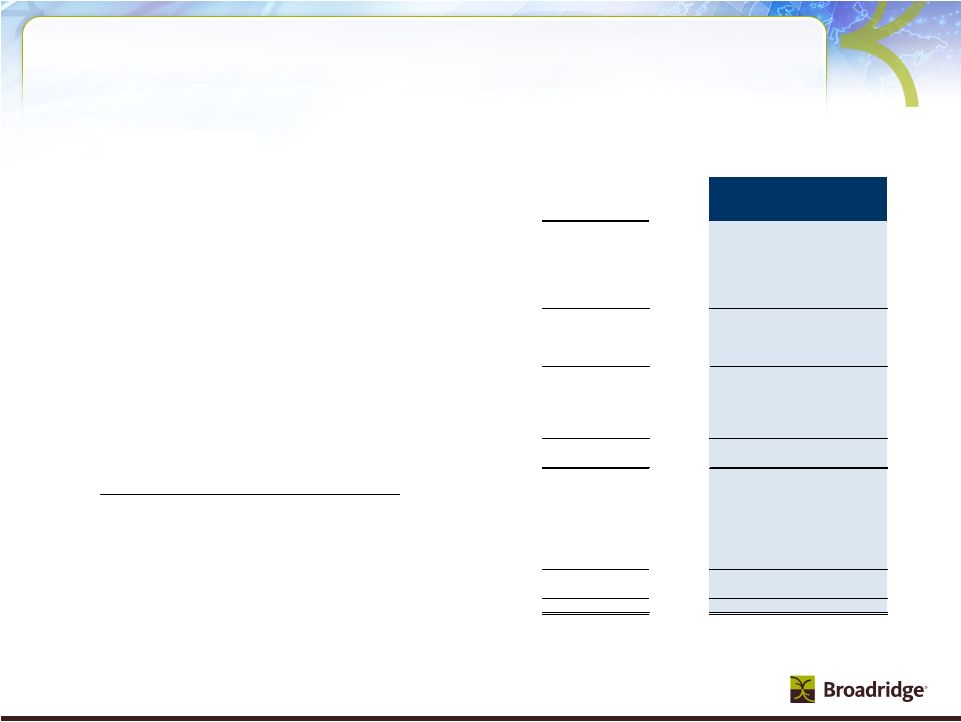
  Segment Results
& Forecast – Other & Foreign Exchange (FX)
Corporate
Expenses:
YTD
results
are
in
line
with
full
year
guidance
range and include executive separation agreement expenses and
strategic investments
Interest
Expense,
net:
Reflects
higher
interest
rate
from
previous
year
due to refinancing of term loan with senior fixed-rate notes
YTD
3Q14
3Q14
Low
High
Corporate Expenses
$(14)M
$(28)M
$(51)M
$(49)M
Interest Expense, net
$(6)M
$(18)M
$(25)M
$(25)M
FX - P&L - Revenue
$(2)M
$(1)M
$10M
$10M
- EBIT $4M
$13M
$16M
$16M
- Transaction Activity $0M
$1M
$1M
$1M
FY14 Range
13 |
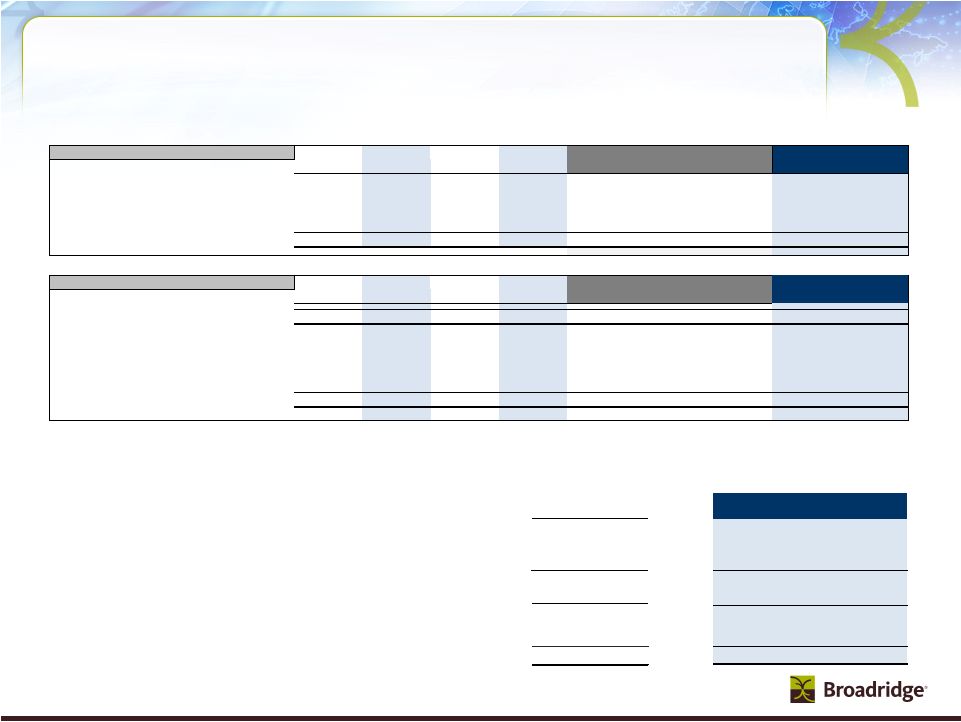
      14
Broadridge Q3 and YTD FY14
Revenue
FY13
FY14
FY13
FY14
FY13
FY14
FY13
FY14
Q3
Q3
Q3 YTD
Q3 YTD
Q3
Q3
Q3 YTD
Q3 YTD
$404
$430
$1,071
$1,152
$51
$56
$95
$117
8%
6%
7%
8%
12.6%
12.9%
8.8%
10.2%
$170
$178
$487
$521
$29
$38
$58
$104
0%
5%
0%
7%
16.9%
21.2%
11.9%
20.0%
$574
$608
$1,558
$1,673
$80
$93
$153
$221
6%
6%
4%
7%
13.9%
15.4%
9.8%
13.2%
$0
($0)
$0
($0)
($8)
($14)
($23)
($28)
$3
($2)
$8
($1)
$4
$4
$10
$14
$577
$606
$1,566
$1,672
$75
$83
$140
$207
5%
5%
4%
7%
13.0%
13.7%
8.9%
12.4%
($4)
($6)
($11)
($18)
$6
$6
$17
$18
$77
$83
$146
$207
13.4%
13.7%
9.3%
12.4%
($28)
($28)
($53)
($72)
35.9%
33.9%
36.0%
35.0%
$50
$55
$94
$134
8.6%
9.1%
6.0%
8.0%
($4)
($4)
($11)
($12)
($2)
$0
($5)
$0
($6)
($4)
($16)
($12)
$43
$51
$78
$123
7.5%
8.4%
5.0%
7.3%
125.0
124.8
125.9
124.0
$0.39
$0.44
$0.74
$1.08
$0.35
$0.41
$0.62
$0.99
(a) FY13 Q3 excludes Restructuring Charges of $4M (after tax $2M, or $0.02 EPS impact). FY13 Q3 YTD
excludes Restructuring Charges of $8M (after tax $5M, or $0.04 EPS impact). (b) Includes
impacts of FX P&L and FX transaction activity. (c) Represents amortization charges
associated with intangible asset values as well as other deal costs associated with the Company’s acquisitions.
(d) FY13 Q3 excludes Restructuring Charges of $4M (after tax $2M, or $0.02 EPS impact) and Acquisition
Amortization and Other Costs of $6M (after tax $4M, or $0.02 EPS impact).
FY13 Q3 YTD excludes Restructuring Charges of $8M (after tax $5M, or $0.04
EPS impact) and Acquisition Amortization and Other Costs of $17M (after tax $11M, or $0.08 EPS impact).
FY14 Q3 excludes Acquisition Amortization and Other Costs of $6M (after tax
$4M, or $0.03 EPS impact) and FY14 Q3 YTD excludes Acquisition Amortization and Other Costs of $18M (after tax $12M, or $0.09 EPS impact)
(e) FY13 represents transition costs related to termination of the Penson agreement including shutdown
costs. Earnings
ICS
Growth % / Margin %
SPS
Growth % / Margin %
Total Segments
Margin %
Other
(a)
FX
Total Broadridge (Non-GAAP)
(a)
Growth % / Margin %
Interest & Other
Acquisition Amortization and Other Costs
(c)
Total EBT (Non-GAAP)
(d)
Margin %
Income taxes
Tax Rate
Total Net Earnings (Non-GAAP)
(d)
Margin %
Acquisition Amortization and Other Costs
(c)
Restructuring Charges
(e)
Non-GAAP Items (Net of Taxes)
Total Net Earnings (GAAP)
Margin %
Diluted Shares
Diluted EPS (Non-GAAP)
(d)
Diluted EPS (GAAP)
(b) |
 15
Revenue
Earnings
FY13
FY14 Range
FY13
FY14 Range
Actual
Low
High
($ in millions)
Actual
Low
High
$1,760
$1,832
$1,848
ICS
$302
$335
$344
8%
4%
5%
Growth % / Margin %
17.2%
18.3%
18.6%
$661
$687
$695
SPS
$85
$117
$125
1%
4%
5%
Growth % / Margin %
12.9%
17.0%
18.0%
$2,421
$2,519
$2,544
Total Segments
$387
$452
$470
6%
4%
5%
Margin %
16.0%
17.9%
18.5%
$0
$0
$0
Other
(a)
($44)
($51)
($49)
$10
$10
$10
FX
(b)
$15
$17
$17
$2,431
$2,529
$2,554
Total Broadridge (Non-GAAP)
(a)
$359
$417
$437
6%
4%
5%
Growth % / Margin %
14.8%
16.5%
17.1%
Interest & Other
($15)
($25)
($25)
Acquisition Amortization and Other Costs
(c )
$24
$23
$23
Total EBT (Non-GAAP)
(d)
$367
$414
$434
Margin %
15.1%
16.4%
17.0%
Income taxes
($131)
($148)
($155)
Recurring Closed Sales
Tax Rate
35.7%
35.7%
35.7%
FY14 Range
Segments
Low
High
Total Net Earnings (Non-GAAP)
(d)
$236
$266
$279
ICS (<$5M)
$60
$70
Margin %
9.7%
10.5%
10.9%
SPS (<$5M)
$30
$40
Large Deals ( >$5M)
$20
$40
Acquisition Amortization and Other Costs
(c )
($15)
($15)
($15)
Total
$110
$150
Restructuring Charges
(e)
($9)
$0
$0
Non-GAAP Items (Net of Taxes)
($24)
($15)
($15)
Total Net Earnings (GAAP)
$212
$252
$265
Margin %
8.7%
10.0%
10.4%
Diluted Shares
125
124
124
Diluted EPS (Non-GAAP)
(d)
$1.88
$2.15
$2.25
Diluted EPS (GAAP)
$1.69
$2.03
$2.13
Broadridge FY14 Guidance
(a) FY13 excludes Restructuring and Impairment Charges, net of $20M (after tax $13M,
or $0.10 EPS impact). (b) Includes impacts of FX P&L and FX Transaction
Activity. (c) Represents amortization charges associated with intangible asset
values as well as other deal costs associated with the Company’s acquisitions.
(d) FY13 excludes Acquisition Amortization and Other Costs of $24M (after tax $15M
or $0.12 EPS impact), Restructuring Charges of $20M (after tax $13M, or $0.10 EPS
impact) and a one time tax credit of $4M (or $0.03 EPS impact). FY14 guidance
excludes Acquisition Amortization and Other Costs of $23M (after tax $15M or $0.12 EPS
impact).
(e) FY13 represents transition costs related to termination of the Penson agreement
including shutdown costs, a one-time cost to restructure and outsource certain processing
related to our decktop applications and one-time tax credit.
* Guidance does not take into consideration the effect of any future acquisitions,
additional debt and/or share repurchases. |
 16
Cash Flow –YTD FY14 Results and FY14 Forecast
Nine Months
Ending
Round
March 2014
Low
High
Free Cash Flow
(Non-GAAP)
:
Round
Net earnings from operations (GAAP)
122.8
$
123
$
252
$
265
$
Depreciation and amortization (includes other LT assets)
71.8
72
100
110
Stock-based compensation expense
25.0
25
33
35
Other
(16.4)
(17)
(5)
5
Subtotal
203.2
203
380
415
Working capital changes
(5.4)
(6)
(5)
5
Long-term assets & liabilities changes
(10.4)
(10)
(35)
(35)
Net cash flow (used in) provided by operating activities
187.4
187
340
385
Cash Flows From Investing Activities
Capital expenditures and software purchases
(43.7)
(44)
(65)
(60)
Free cash flow (Non-GAAP)
143.7
$
143
$
275
$
325
$
Cash Flows From Other Investing and Financing Activities
Acquisitions
(97.1)
(97)
(97)
(97)
Stock repurchases net of options proceeds
(0.8)
(1)
(2)
(2)
Proceeds from borrowing net of debt repayments
(0.5)
(1)
(1)
(1)
Dividends paid
(71.5)
(72)
(96)
(96)
Other
4.6
5
(5)
5
Net change in cash and cash equivalents
(21.6)
(22)
74
134
Cash and cash equivalents, at the beginning of year
266.0
266
266
266
Cash and cash equivalents, at the end of period
244.4
$
244
$
340
$
400
$
(a) Guidance does not take into consideration the effect of any future acquisitions, additional debt
and/or share repurchases. Free Cash Flow - Non-GAAP
FY14 Range
(a)
($ millions)
Unaudited |
 17
Recurring Revenue Closed Sales to Revenue
Contribution
($ in millions)
Closed Sales
Revenue Contribution
(a)
Backlog
(b)
Forecast
Forecast
Forecast
FY14
FY14
FY14
ICS (less than $5M deals)
$60-70
~$45-55
~$60-70
~Contribution to recurring revenue growth
~6%
SPS (less than $5M deals)
$30-40
~$50-55
~$70-90
~Contribution to recurring revenue growth
~8%
Total deals (less than $5M)
$90-110
~$95-110
~$130-160
~Contribution to recurring revenue growth
7-8%
Large Deals ($5M or greater)
$20-40
$0
~$20-40
~Contribution to recurring revenue growth
Total Recurring Revenue Closed Sales
$110-150
~$95-110
~$150-200
~Contribution to recurring revenue growth
7-8%
(a)
Revenue from current year and prior year Closed Sales.
(b)
Closed Sales expected to convert to revenue in future years. |
 18
Revenues and Closed Sales FY08-FY13
(a) Includes reclassification of Pre-sale Fulfillment from event-driven revenues to recurring
revenues. (b) Includes reclassification of Pre-sale
Fulfillment related distribution revenues from event-driven distribution to recurring distribution and Matrix pass-through administrative services revenues from recurring
fee to recurring distribution.
($ in millions)
CAGR
Forecast
Recurring Fee Revenues
FY08
FY09
FY10
FY11
FY12
FY13
FY08-FY13
FY14
ICS
$ 567
$ 594
$ 632
$ 720
$ 798
$ 850
8%
$923-931
Growth
7%
5%
6%
14%
11%
7%
8-9%
SPS
$ 534
$ 559
$ 536
$ 594
$ 655
$ 661
4%
$687-695
Growth
1%
5%
-4%
11%
10%
1%
4-5%
Total Recurring Fee Revenues
$ 1,101
$ 1,153
$ 1,168
$ 1,313
$ 1,453
$ 1,511
7%
$1,609-1,626
Growth
4%
5%
1%
12%
11%
4%
7-8%
Event-Driven
$ 200
$ 180
$ 257
$ 135
$ 132
$ 156
-5%
$154-157
Growth
-1%
-10%
43%
-47%
-2%
18%
(1)-1%
Distribution
$ 808
$ 757
$ 781
$ 704
$ 704
$ 755
-1%
$755-760
Growth
-2%
-6%
3%
-10%
0%
7%
0-1%
Other/FX
$ 22
$ (17)
$ 4
$ 14
$ 14
$ 10
~$10
Total Revenues
$ 2,131
$ 2,072
$ 2,209
$ 2,167
$ 2,304
$ 2,431
3%
$2,529-2,554
Growth
3%
-3%
7%
-2%
6%
6%
4-5%
Small (<$5M)
$ 65
$ 80
$ 66
$ 66
$ 108
$ 103
10%
$90-110
Large (=>$5M)
$ 17
$ 15
$ 53
$ 47
$ 12
$ 18
$20-40
Recurring Closed Sales
$ 82
$ 95
$ 119
$ 113
$ 120
$ 121
8%
$110-150
Growth
30%
16%
25%
-5%
6%
0%
-9-+24%
($ in millions)
CAGR
Forecast
Event-Driven Fee Revenues
FY08
FY09
FY10
FY11
FY12
FY13
FY08-FY13
FY14
Mutual Fund Proxy
$ 92
$ 55
$ 150
$ 39
$ 28
$ 43
-14%
$50-53
Mutual Fund Supplemental
$ 49
$ 58
$ 48
$ 44
$ 47
$ 58
3%
$49
Contest/ Specials/ Other
Communications
$ 59
$ 67
$ 59
$ 52
$ 57
$ 54
-2%
$55
Total Event-Driven Fee Revenues
$ 200
$ 180
$ 257
$ 135
$ 132
$ 156
-5%
$154-157
Growth
-1%
-10%
43%
-47%
-2%
18%
1%
Recurring Distribution Revenues
$ 580
$ 567
$ 564
$ 573
$ 597
$ 629
2%
$639-645
Growth
-2%
-2%
-1%
2%
4%
5%
2-3%
ED Distribution Revenues
$ 228
$ 190
$ 217
$ 131
$ 107
$ 126
-11%
~$115
Growth
0%
-17%
14%
-39%
-18%
17%
(8)%
Total Distribution Revenues
$ 808
$ 757
$ 781
$ 704
$ 704
$ 755
-1%
~$755-760
Growth
-2%
-6%
3%
-10%
0%
7%
0 -1%
(a)
(b)
(b) |
 Reconciliation
of Non-GAAP to GAAP Measures Reconciliation of EPS Guidance
3Q13
3Q14
YTD13
YTD14
FY11
FY12
FY13
FY14 Range
Actual
Actual
Actual
Actual
Actual
Actual
Actual
Low
High
Diluted EPS (Non-GAAP)
$0.39
$0.44
$0.74
$1.08
$1.47
$1.67
$1.88
$2.15
$2.25
Acquisition Amortization and Other Costs
($0.02)
($0.03)
($0.08)
($0.09)
($0.10)
($0.12)
($0.12)
($0.12)
($0.12)
Restructuring and Impairment Charges, net
($0.02)
$0.00
($0.04)
$0.00
$0.00
($0.45)
($0.07)
$0.00
$0.00
IBM Migration costs
$0.00
$0.00
$0.00
$0.00
($0.03)
($0.12)
$0.00
$0.00
$0.00
Diluted EPS (GAAP)
$0.35
$0.41
$0.62
$0.99
$1.34
$0.98
$1.69
$2.03
$2.13
Reconciliation of EBT Guidance (a)
3Q13
3Q14
YTD13
YTD14
FY11
FY12
FY13
FY14 Range
($ in millions)
Actual
Actual
Actual
Actual
Actual
Actual
Actual
Low
High
Total EBT (Non-GAAP)
$77
$83
$146
$207
$295
$331
$367
$414
$434
Margin %
13.4%
13.7%
9.3%
12.4%
13.6%
14.4%
15.1%
16.4%
17.0%
Acquisition Amortization and Other Costs
($6)
($6)
($17)
($18)
($19)
($25)
($24)
($23)
($23)
Restructuring and Impairment Charges, net
($4)
$0
($8)
$0
$0
($81)
($20)
$0
$0
IBM Migration costs
$0
$0
$0
$0
($6)
($25)
$0
$0
$0
Total EBT (GAAP)
$68
$77
$121
$189
$270
$201
$323
$392
$412
Margin %
11.7%
12.7%
7.7%
11.3%
12.4%
8.7%
13.3%
15.5%
16.1%
(a) Details may not sum to totals due to rounding
Nine Months
Ending
Round
March 2014
Low
High
Free Cash Flow
Round
Net earnings from operations (GAAP)
122.8
$
123
$
252
$
265
$
Depreciation and amortization (includes other LT assets)
71.8
72
100
110
Stock-based compensation expense
25.0
25
33
35
Other
(16.4)
(17)
(5)
5
Subtotal
203.2
203
380
415
Working capital changes
(5.4)
(6)
(5)
5
Long-term assets & liabilities changes
(10.4)
(10)
(35)
(35)
Net cash flow (used in) provided by operating activities
187.4
187
340
385
Cash Flows From Investing Activities
Capital expenditures and software purchases
(43.7)
(44)
(65)
(60)
Free cash flow (Non-GAAP)
143.7
$
143
$
275
$
325
$
(b) Guidance does not take into consideration the effect of any future acquisitions,
additional debt and/or share repurchases. Free Cash Flow
-Non-GAAP FY14 Range
(b)
($ millions)
Unaudited
19
(Non-GAAP): |
 ICS Key Segment
Revenue Stats RC= Recurring
ED= Event-Driven
In millions
Fee Revenues
3Q13
3Q14
YTD FY13
YTD FY14
Type
Proxy
Equities
34.0
$
37.9
$
84.8
$
88.3
$
RC
Stock Record Position Growth
7%
7%
3%
3%
Pieces
27.1
68.1
72.1
0.6
Mutual Funds
7.1
$
9.5
$
22.7
$
36.0
$
ED
Pieces
13.0
12.1
36.7
48.0
0.6
Contests/Specials
2.3
$
4.3
$
7.3
$
10.9
$
ED
Pieces
2.2
5.4
6.7
12.2
Total Proxy
43.4
$
51.7
$
114.8
$
135.2
$
Total Pieces
42.3
48.1
111.5
132.3
Notice and Access Opt-in %
70%
75%
64%
70%
Suppression %
59%
60%
60%
59%
Interims
Mutual Funds (Annual/Semi-Annual Reports/Annual Prospectuses)
36.6
$
48.9
$
99.9
$
126.7
$
RC
Position Growth
9%
10%
10%
12%
Pieces
166.9
225.2
470.8
586.2
Mutual Funds (Supplemental Prospectuses) & Other
20.2
$
12.8
$
44.0
$
32.8
$
ED
Pieces
107.0
66.2
228.6
173.7
Total Interims
56.8
$
61.7
$
143.9
$
159.5
$
Total Pieces
273.9
291.4
699.4
759.9
Transaction
Transaction Reporting/Customer Communications
50.8
$
47.6
$
129.4
$
119.5
$
RC
Reporting
Fulfillment
Fulfillment
36.0
$
32.9
$
101.1
$
109.0
$
RC
Emerging, Acquired
Emerging/Acquired (a)
28.5
$
42.0
$
80.8
$
111.1
$
RC
and Other
Other (b)
8.1
$
11.6
$
23.6
$
27.1
$
ED
Total Emerging. Acquired and Other
36.6
$
53.6
$
104.4
$
138.2
$
Total Fee Revenues
223.6
$
247.5
$
593.6
$
661.4
$
Total Distribution Revenues (c)
180.6
$
182.8
$
476.9
$
491.0
$
Total Revenues as reported -GAAP
404.2
$
430.3
$
1,070.5
$
1,152.4
$
FY14 Ranges
Low
High
Total RC Fees
185.9
$
209.3
$
496.0
$
554.6
$
923
$
931
$
% RC Growth
9%
13%
8%
12%
8%
9%
Total ED Fees
37.7
$
38.2
$
97.6
$
106.8
$
~
$ 156
Low
High
Sales
12%
7%
8%
6%
6%
6%
Key
Losses
-1%
-1%
-1%
-2%
-2%
-2%
Revenue
Net New Business
11%
6%
7%
4%
4%
4%
Drivers
Internal growth
-2%
5%
1%
6%
3%
4%
(Recurring)
Recurring (Excluding Acquisitions)
9%
11%
8%
10%
7%
8%
Acquisitions
0%
2%
0%
2%
1%
1%
Total Recurring
9%
13%
8%
12%
8%
9%
Low
High
Key
Recurring, Net (d)
4%
6%
4%
6%
4%
5%
Revenue
Event-Driven
1%
0%
0%
1%
0%
0%
Drivers
Distribution
3%
0%
3%
1%
0%
0%
(Total)
TOTAL
8%
6%
7%
8%
4%
5%
(a) Emerging and Acquired includes fee revenues from acquisitions (i.e. Access
Data, NewRiver, Matrix, Transfer Agency, Forefield, Bonaire and Emerald Connect) and the portfolio of emerging products
(i.e. Tax Managed Services, Vote Recommendations, and Class Actions).
(b) Other includes other event-driven fee revenues such as corporate actions and
development. (c) Total Distribution Revenues primarily include
pass-through revenues related to the physical mailing of Proxy, Interims, Transaction Reporting, and Fulfillment as well as Matrix administrative services.
(d) Recurring, Net includes contribution from Net New Business, Internal Growth, and
Acquisitions 30.6
20 |
  21
SPS Key Segment Revenue Stats
RC= Recurring
ED= Event-Driven
In millions
Note: Outsourcing is now included in Other Equity Services
3Q13
3Q14
YTD FY13
YTD FY14
Type
Equity
Transaction-Based
Equity Trades
33.8
$
35.5
$
94.9
$
101.4
$
RC
Internal Trade Volume
917
1,053
828
959
Internal Trade Growth
-2%
15%
-9%
16%
Trade Volume (Average Trades per Day in '000)
979
1,076
888
978
Non-Transaction
Other Equity Services
109.6
114.4
315.2
$
333.8
$
RC
Total Equity
143.4
$
149.9
$
410.1
$
435.2
$
Fixed Income
Transaction-Based
Fixed Income Trades (a)
14.0
$
14.0
$
41.5
$
43.3
$
RC
Internal Trade Volume
307
301
298
298
Internal Trade Growth
0%
-2%
0%
0%
Trade Volume (Average Trades per Day in '000)
308
298
299
299
Non-Transaction
Other Fixed Income Services
12.3
$
14.0
$
35.8
$
42.3
$
RC
Total Fixed Income
26.2
$
28.0
$
77.2
$
85.5
$
Total Net Revenue as reported - GAAP
169.6
$
177.9
$
487.3
$
520.7
$
FY14 Ranges
Low
High
Sales
7%
8%
5%
9%
8%
8%
Losses
-2%
-4%
-2%
-3%
-4%
-3%
Key
Net New Business
5%
4%
3%
6%
4%
5%
Revenue
Internal growth
-5%
1%
-4%
1%
0%
0%
Drivers
Acquisitions
0%
0%
1%
0%
0%
0%
TOTAL
0%
5%
0%
7%
4%
5% |
 22
Broadridge ICS Definitions
Proxy
Equities
-
Refers
to
the
proxy
services
we
provide
in
connection
with
annual
stockholder
meetings
for
publicly
traded
corporate
issuers.
Annual
meetings
of
public
companies
include
shares
held
in
"street
name"
(meaning
that
they
are
held
of
record
by
brokers
or
banks,
which
in
turn
hold
the
shares
on
behalf
of
their
clients,
the
ultimate
beneficial
owners)
and
shares
held
in
"registered
name"
(shares
registered
directly
in
the
names
of
their
owners).
Mutual
Funds
-
Refers
to
the
proxy
serviceswe
provide
for
funds,
classes
or
trusts
of
an
investment
company.
Open-ended
mutual
funds
are
not
required
to
have
annual
meetings.
As
a
result,
mutual
fund
proxy
services
provided
to
open-ended
mutual
funds
are
driven
by
a
"triggering
event."
These
triggering
events
can
be
a
change
in
directors,
fee
structures,
investment
restrictions,
or
mergers
of
funds.
Contests
-
Refers
to
the
proxy
services
we
provide
when
a
separate
agenda
is
put
forth
by
one
or
more
stockholders
that
is
in
opposition
to
the
proposals
presented
by
management
of
the
company
which
is
separately
distributed
and
tabulated
from
the
company’s
proxy
materials.
Specials
-
Refers
to
the
proxy
services
we
provide
in
connection
with
stockholder
meetings
held
outside
of
the
normal
annual
meeting
cycle
and
are
primarily
driven
by
special
events
(e.g.,
business
combinations
in
which
the
company
being
acquired
is
a
public
company
and
needs
to
solicit
the
approval
of
its stockholders).
Interims
Mutual
Funds
(Annual/Semi-Annual
Reports/Annual
Prospectuses)
–
Refers
to
the
services
we
provide
investment
companies
in
connection
with
information
they
are
required
by
regulation
to
distribute
periodically
to
their
investors.
These
reports
contain
pertinent
information
such
as
holdings,
fund
performance,
and
other
required
disclosure.
Mutual
Funds
(Supplemental
Prospectuses)
–
Refers
primarily
to
information
required
to
be
provided
by
mutual
funds
to
supplement
information
previously
provided
in
an
annual
mutual
fund
prospectus
(e.g.,
change
in
portfolio
managers,
closing
funds
or
class
of
shares
to
investors,
or
restating
or
clarifying
items
in
the
original
prospectus).
The
events
could
occur
at
any
time
throughout
the
year.
Other
–
Refers
to
communications
provided
by
corporate
issuers
and
investment
companies
to
investors
including
newsletters,
notices,
tax
information,
marketing
materials
and
other
information
not
required
to
be
distributed
by
regulation.
Transaction
Reporting
Transaction
Reporting–
Refers
primarily
to
the
printing
and
distribution
of
account
statements,
trade
confirmations
and
tax
reporting
documents
to
account
holders,
including
electronic
delivery
and
archival
services.
Fulfillment
Post-Sale
Fulfillment
–
Refers
primarily
to
the
distribution
of
prospectuses,
offering
documents,
and
required
regulatory
disclosure
information
to
investors
in
connection
with
purchases
of
securities.
Pre-Sale
Fulfillment
–
Refers
to
the
distribution
of
marketing
literature,
welcome
kits,
enrollment
kits,
and
investor
information
to
prospective
investors,
existing
stockholders
and
other
targeted
recipients
on
behalf
of
broker-dealers,
mutual
fund
companies
and
401(k)
administrators.
Emerging,
Acquired
and
Other
Communications
Emerging
–
Refers
to
the
services
provided
by
our
emerging
products
portfolio
(e.g.
Tax
Services,
Vote
Recommendations,
and
Class
Actions).
Acquired
–
Refers
to
the
services
provided
by
our
acquisitions
portfolio
(e.g.
Access
Data,
NewRiver,
Matrix,
Transfer
Agency,
Forefield,
Bonaire
and
Emerald
Connect).
Other
–
Refers
primarily
to
the
services
we
provide
in
connection
with
the
distribution
of
communications
material
not
included
in
the
above
definitions
such
as non-
objecting
beneficial
owner
(NOBO)
lists,
and
corporate
actions
such
as
tender
offer
transactions. |