Attached files
| file | filename |
|---|---|
| 8-K - 8-K - WCI Communities, Inc. | a14-11595_18k.htm |
| EX-99.1 - EX-99.1 - WCI Communities, Inc. | a14-11595_1ex99d1.htm |
Exhibit 99.2
|
|
WCI Communities First Quarter 2014 - Earnings Conference Call May 6, 2014 |

|
|
1 Disclosure Statement This presentation contains forward-looking statements. All statements that are not statements of historical fact, including -looking statements within the meaning of the federal securities laws, and should be evaluated as such. Forward-looking statements include information concerning the results of operations, including descriptions of its business plan and strategies. These forward-looking statements may be identified by the use of such forward- ld, For more information concerning factors that could cause actual results to differ materially from those contained in the forward--K filed by the Company with the Securities and Exchange Commission on February 27, 2014 and subsequent filings by the Company. The Company bases these forward-looking statements or projections on its current expectations, plans and assumptions that it has made in light of its experience in the industry, as well as its perceptions of historical trends, current conditions, expected future developments and other factors it believes are appropriate under the circumstances and at such time. As you read and consider this presentation, you should understand that these statements are not guarantees of performance or results. The forward-looking statements and projections are subject to and involve risks, uncertainties and assumptions and you should not place undue reliance on these forward-looking statements or projections. Although the Company believes that these forward-looking statements and projections are based on reasonable assumptions at the time they are and could cause actual results to differ materially from those expressed in the forward-looking statements and projections. The Company undertakes no obligation to update or revise any forward-looking statements, whether as a result of new information, future events or otherwise. If the Company does update one or more forward-looking statements, there should be no inference that it will make additional updates with respect to those or other forward-looking statements. this presentation contains the non-GAAP financial measures Adjusted EBITDA and Adjusted gross margin from homes delivered. The reasons for the use of these measures, a reconciliation of these measures to the most directly comparable GAAP measures and other information relating to these measures are included below in the appendix to this presentation. |
|
|
2 WCI Communities at a Glance Lifestyle community developer and luxury homebuilder throughout Florida Target move-up, second-home and active adult customers High proportion of cash buyers - 64% in 1Q14 High average selling prices - $410k on 1Q14 deliveries Approximately 8,700 home sites owned and controlled as of March 31, 2014 Majority with attractive cost basis due in large part to fresh start accounting in 2009 Conservative balance sheet - $195 million cash Significant year-over-year Homebuilding growth Complementary and value-add Real Estate Services & Amenities businesses Geographic Footprint Cash 64.1% LTV 1% - 64% 14.5% LTV 65% - 80% 17.1% LTV > 81% 4.3% Loan to Value Percentage 1Q14 Deliveries Buyer Profile with Low Reliance on Financing |

|
|
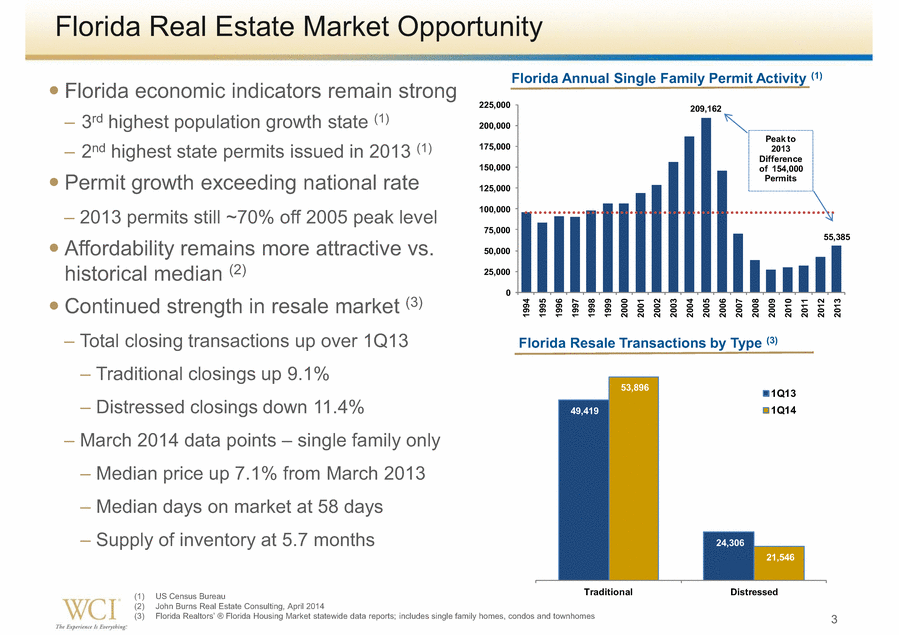
3 (1) US Census Bureau (2) John Burns Real Estate Consulting, April 2014 (3) Florida Florida Housing Market statewide data reports; includes single family homes, condos and townhomes Florida Real Estate Market Opportunity Florida economic indicators remain strong 3rd highest population growth state (1) 2nd highest state permits issued in 2013 (1) Permit growth exceeding national rate 2013 permits still ~70% off 2005 peak level Affordability remains more attractive vs. historical median (2) Continued strength in resale market (3) Total closing transactions up over 1Q13 Traditional closings up 9.1% Distressed closings down 11.4% March 2014 data points single family only Median price up 7.1% from March 2013 Median days on market at 58 days Supply of inventory at 5.7 months Florida Annual Single Family Permit Activity (1) Florida Resale Transactions by Type (3) 209,162 55,385 0 25,000 50,000 75,000 100,000 125,000 150,000 175,000 200,000 225,000 1994 1995 1996 1997 1998 1999 2000 2001 2002 2003 2004 2005 2006 2007 2008 2009 2010 2011 2012 2013 Peak to 2013 Difference of 154,000 Permits 49,419 24,306 53,896 21,546 Traditional Distressed 1Q13 1Q14 |
|
|
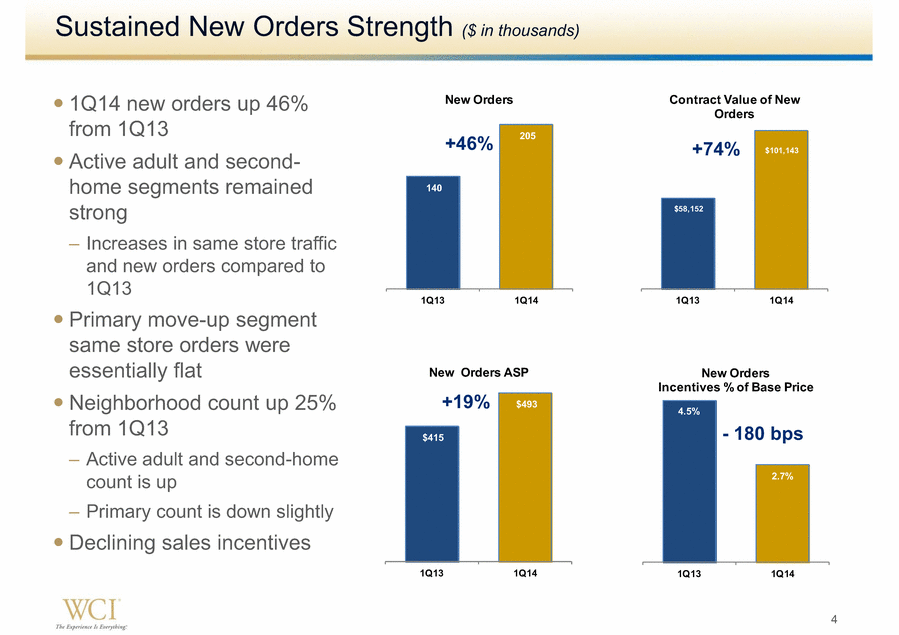
4 4.5% 2.7% 1Q13 1Q14 New Orders Incentives % of Base Price $58,152 $101,143 1Q13 1Q14 Contract Value of New Orders 140 205 1Q13 1Q14 New Orders $415 $493 1Q13 1Q14 New Orders ASP Sustained New Orders Strength ($ in thousands) 1Q14 new orders up 46% from 1Q13 Active adult and second-home segments remained strong Increases in same store traffic and new orders compared to 1Q13 Primary move-up segment same store orders were essentially flat Neighborhood count up 25% from 1Q13 Active adult and second-home count is up Primary count is down slightly Declining sales incentives +19% +74% - 180 bps +46% |
|
|
5 $144,249 $196,664 1Q13 1Q14 Contract Value of Backlog 316 381 1Q13 1Q14 Backlog Units 79 117 1Q13 1Q14 Deliveries $383 $410 1Q13 1Q14 Average Selling Price per Delivered Home Deliveries and Backlog Growth ($ in thousands) +7% +21% +36% +48% 1Q14 deliveries up 48% from 1Q13 Product mix impacted average selling price per delivered home Active adult neighborhoods accounted for 50% of 1Q14 deliveries Backlog turnover improved to 39.9% in 1Q14 compared to 31.0% in 1Q13 Average selling price in backlog of $516,000 Up 13% from 1Q13 |

|
|
6 Improving SG&A Leverage Driving Adjusted EBITDA Expansion Continued gross margin strength Product delivery mix a key factor Broader range of neighborhoods delivering homes Rapidly improving SG&A leverage Delivering Adjusted EBITDA growth (1) Represents Adjusted gross margin from homes delivered (2) Measured as a percentage of total homebuilding revenues (3) Measured as a percentage of total revenues 22.0% 31.9% 37.4% 32.6% 33.9% 33.3% 31.3% 30.7% 30.1% 1Q12 2Q12 3Q12 4Q12 1Q13 2Q13 3Q13 4Q13 1Q14 Adjusted Gross Margin Percentage (1) HB $30.5 HB $48.0 RES $16.4 RES $18.5 AM $6.8 AM $7.3 $53.7 $73.8 1Q13 1Q14 Revenues ($ in millions) 33.9% 30.1% 1Q13 1Q14 Adjusted GM % (1) 24.9% 19.8% 5.2% 1.7% 30.1% 21.5% 1Q13 1Q14 SG&A % (2) Long Term Incentive Comp 6.9% 7.7% 1Q13 1Q14 Adjusted EBITDA % (3) |

|
|
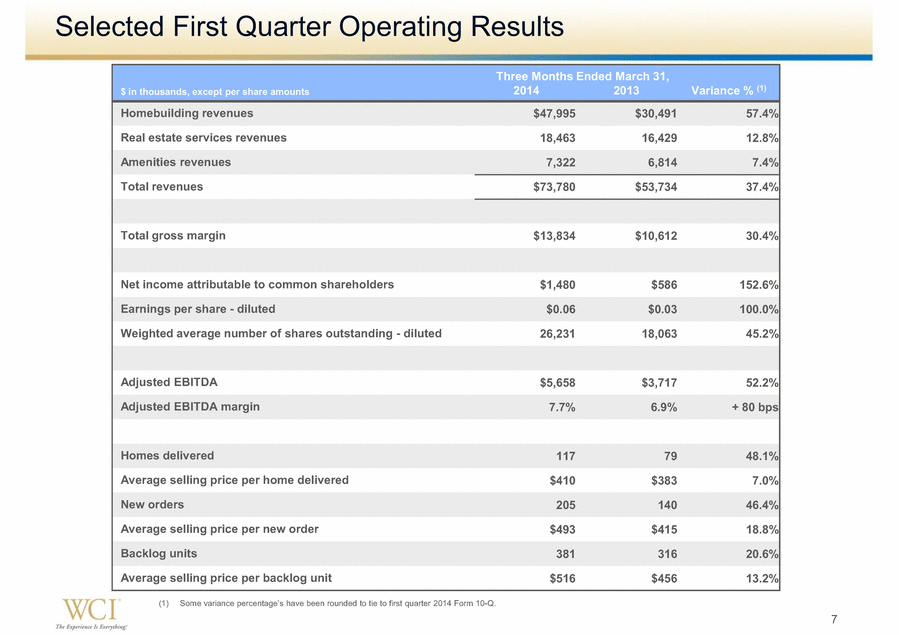
7 $ in thousands, except per share amounts Three Months Ended March 31, 2014 2013 Variance % (1) Homebuilding revenues $47,995 $30,491 57.4% Real estate services revenues 18,463 16,429 12.8% Amenities revenues 7,322 6,814 7.4% Total revenues $73,780 $53,734 37.4% Total gross margin $13,834 $10,612 30.4% Net income attributable to common shareholders $1,480 $586 152.6% Earnings per share - diluted $0.06 $0.03 100.0% Weighted average number of shares outstanding - diluted 26,231 18,063 45.2% Adjusted EBITDA $5,658 $3,717 52.2% Adjusted EBITDA margin 7.7% 6.9% + 80 bps Homes delivered 117 79 48.1% Average selling price per home delivered $410 $383 7.0% New orders 205 140 46.4% Average selling price per new order $493 $415 18.8% Backlog units 381 316 20.6% Average selling price per backlog unit $516 $456 13.2% Selected First Quarter Operating Results (1) first quarter 2014 Form 10-Q. |
|
|
8 Strong Balance Sheet with Ample Liquidity Conservative balance sheet Undrawn $75 million revolving credit facility Majority of land basis written down in 2009 Invested $10.6 million in land and land development in 1Q14 April 2014 Sold CDD Bonds Net proceeds of $22.7 million Acquired from Sarasota National community purchase in April 2013 (1) Available liquidity includes the $75 million of borrowing capacity under a four-year revolving credit facility and $8 million of borrowing capacity available under a revolving credit facility with Stonegate Bank. (2) Net Debt represents total debt less cash and cash equivalents; capital represents net debt plus total equity. $ in thousands March 31, 2014 December 31, 2013 Cash & Cash Equivalents $194,662 $213,352 Real Estate Inventory 296,829 280,293 Senior Notes Due 2021 200,000 200,000 Total Equity 412,255 409,864 Total Capitalization 612,255 609,864 Available Liquidity (1) 277,662 296,352 Debt to Capitalization 32.7% 32.8% Net Debt to Capital (2) 1.3% NM (Cash + Inventory) / Debt 2.46 2.47 |

|
|
9 Key Takeaways Fully integrated luxury homebuilder and community developer Complementary and strategic Amenities and Real Estate Services businesses Florida real estate market remains strong Continued growth Neighborhood counts Orders & deliveries Revenues & Adjusted EBITDA Actively pursuing land acquisition opportunities Focus on move-up, second-home and active adult buyers Leverage the scalable operating platform |

|
|
Appendix |

|
|
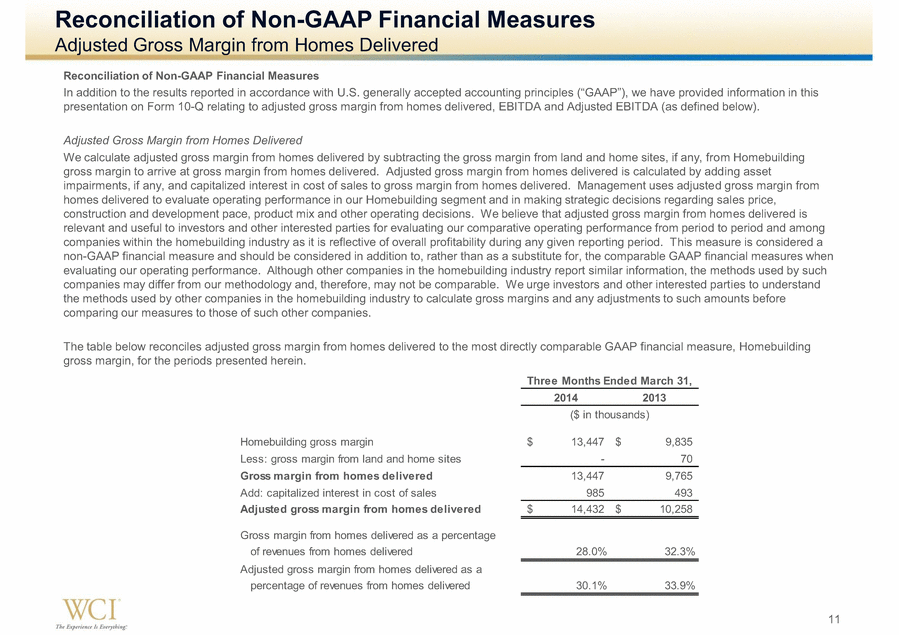
11 Reconciliation of Non-GAAP Financial Measures Adjusted Gross Margin from Homes Delivered Reconciliation of Non-GAAP Financial Measuresed information in this presentation on Form 10-Q relating to adjusted gross margin from homes delivered, EBITDA and Adjusted EBITDA (as defined below). Adjusted Gross Margin from Homes Delivered We calculate adjusted gross margin from homes delivered by subtracting the gross margin from land and home sites, if any, from Homebuilding gross margin to arrive at gross margin from homes delivered. Adjusted gross margin from homes delivered is calculated by adding asset impairments, if any, and capitalized interest in cost of sales to gross margin from homes delivered. Management uses adjusted gross margin from homes delivered to evaluate operating performance in our Homebuilding segment and in making strategic decisions regarding sales price, construction and development pace, product mix and other operating decisions. We believe that adjusted gross margin from homes delivered is relevant and useful to investors and other interested parties for evaluating our comparative operating performance from period to period and among companies within the homebuilding industry as it is reflective of overall profitability during any given reporting period. This measure is considered a non-GAAP financial measure and should be considered in addition to, rather than as a substitute for, the comparable GAAP financial measures when evaluating our operating performance. Although other companies in the homebuilding industry report similar information, the methods used by such companies may differ from our methodology and, therefore, may not be comparable. We urge investors and other interested parties to understand the methods used by other companies in the homebuilding industry to calculate gross margins and any adjustments to such amounts before comparing our measures to those of such other companies. The table below reconciles adjusted gross margin from homes delivered to the most directly comparable GAAP financial measure, Homebuilding gross margin, for the periods presented herein. 2014 2013 Homebuilding gross margin 13,447 $ 9,835 $ Less: gross margin from land and home sites - 70 Gross margin from homes delivered 13,447 9,765 Add: capitalized interest in cost of sales 985 493 Adjusted gross margin from homes delivered 14,432 $ 10,258 $ Gross margin from homes delivered as a percentage of revenues from homes delivered 28.0% 32.3% Adjusted gross margin from homes delivered as a percentage of revenues from homes delivered 30.1% 33.9% Three Months Ended March 31, ($ in thousands) |
|
|
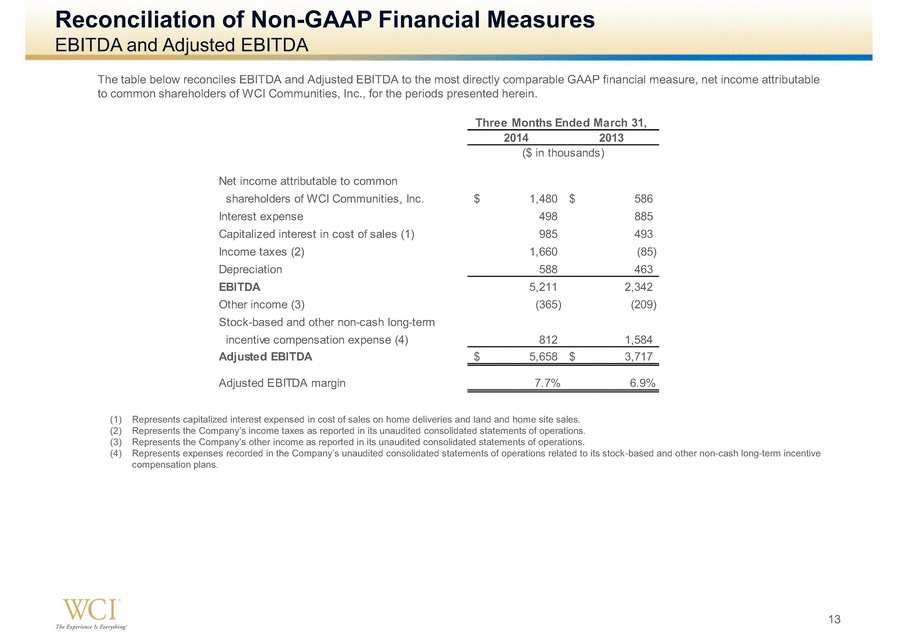
12 Reconciliation of Non-GAAP Financial Measures EBITDA and Adjusted EBITDA Adjusted EBITDA measures performance by adjusting net income (loss) attributable to common shareholders of WCI Communities, Inc. to stock dividends, income from discontinued operations, other income, stock-based and other non-cash long-term incentive compensation expense, asset impairments and expenses related to early repayment of debt. We believe that the presentation of Adjusted EBITDA provides useful information to investors and other interested parties regarding our results of operations because it assists those parties and us when analyzing and benchmarking the performance and value of our business. We also believe that Adjusted EBITDA is useful as a measure of comparative operating performance from period to period and among companies in the homebuilding industry as it is reflective of changes in pricing decisions, cost controls and other factors that affect operating performance, and it removes the effect of our capital structure (such as preferred stock dividends and interest expense), asset base (primarily depreciation), items outside of our control (primarily income taxes) and the volatility related to the timing and extent of non-operating activities (such as discontinued operations and asset impairments). Accordingly, we believe that this measure is useful for comparing general operating performance from period to period. Other companies may define Adjusted EBITDA differently and, as a result, our measure of Adjusted EBITDA may not be directly comparable to Adjusted EBITDA of other companies. Although we use Adjusted EBITDA as a financial measure to assess the performance of our business, the use of Adjusted EBITDA is limited because it does not include certain material costs, such as interest and income taxes, necessary to operate our business. Adjusted EBITDA and EBITDA should be considered in addition to, and not as substitutes for, net income (loss) in accordance with GAAP as a measure of performance. Our presentation of EBITDA and Adjusted EBITDA should not be construed as an indication that our future results will be unaffected by unusual or nonrecurring items. Our EBITDA-based measures have limitations as analytical tools and, therefore, investors and other interested parties should not consider them in isolation or as substitutes for analyses of our results as reported under GAAP. Some such limitations are: they do not reflect the impact of earnings or charges resulting from matters that we consider not to be indicative of our ongoing operations; they are not adjusted for all non-cash income or expense items that are reflected in our consolidated statements of cash flows; they do not reflect the interest expense necessary to service our debt; and other companies in our industry may calculate these measures differently than we do, thereby limiting their usefulness as comparative measures. Because of these limitations, our EBITDA-based measures are not intended to be alternatives to net income (loss), indicators of our operating performance, alternatives to any other measure of performance in conformity with GAAP or alternatives to cash flow provided by operating activities as measures of liquidity. Investors and other interested parties should therefore not place undue reliance on our EBITDA-based measures or ratios calculated using those measures. Our GAAP-based measures can be found in our unaudited consolidated financial statements in Item 1 of the Quarterly Report on Form 10-Q. |

|
|
13 Reconciliation of Non-GAAP Financial Measures EBITDA and Adjusted EBITDA (1) Represents capitalized interest expensed in cost of sales on home deliveries and land and home site sales. (2) Represents taxes as reported in its unaudited consolidated statements of operations. (3) Represents (4) Represents -based and other non-cash long-term incentive compensation plans. The table below reconciles EBITDA and Adjusted EBITDA to the most directly comparable GAAP financial measure, net income attributable to common shareholders of WCI Communities, Inc., for the periods presented herein. 2014 2013 Net income attributable to common shareholders of WCI Communities, Inc. 1,480 $ 586 $ Interest expense 498 885 Capitalized interest in cost of sales (1) 985 493 Income taxes (2) 1,660 (85) Depreciation 588 463 EBITDA 5,211 2,342 Other income (3) (365) (209) Stock-based and other non-cash long-term incentive compensation expense (4) 812 1,584 Adjusted EBITDA 5,658 $ 3,717 $ Adjusted EBITDA margin 7.7% 6.9% Three Months Ended March 31, ($ in thousands) |