Attached files
| file | filename |
|---|---|
| EX-1.1 - EX-1.1 - Pattern Energy Group Inc. | d715360dex11.htm |
| EX-23.2 - EX-23.2 - Pattern Energy Group Inc. | d715360dex232.htm |
| EX-23.3 - EX-23.3 - Pattern Energy Group Inc. | d715360dex233.htm |
| EX-5.1 - EX-5.1 - Pattern Energy Group Inc. | d715360dex51.htm |
Table of Contents
As filed with the Securities and Exchange Commission on May 5, 2014
Registration No. 333-195488
UNITED STATES
SECURITIES AND EXCHANGE COMMISSION
Washington, D.C. 20549
Amendment No. 1
to
FORM S-1
REGISTRATION STATEMENT
UNDER
THE SECURITIES ACT OF 1933
PATTERN ENERGY GROUP INC.
(Exact Name of Registrant as Specified in Its Charter)
| Delaware | 4911 | 90-0893251 | ||
| (State or Other Jurisdiction of Incorporation or Organization) |
(Primary Standard Industrial Classification Code Number) |
(I.R.S. Employer Identification Number) |
Pier 1, Bay 3
San Francisco, CA 94111
(415) 283-4000
(Address, Including Zip Code, and Telephone Number, Including Area Code, of Registrant’s Principal Executive Offices)
Daniel M. Elkort
General Counsel
Pattern Energy Group Inc.
Pier 1, Bay 3
San Francisco, CA 94111
(415) 283-4000
(Name, Address, Including Zip Code, and Telephone Number, Including Area Code, of Agent For Service)
Copies to:
| Richard D. Truesdell, Jr. Davis Polk & Wardwell LLP 450 Lexington Avenue New York, NY 10017 (212) 450-4000 |
Jeffrey R. Lloyd Brendan D. Reay Blake, Cassels & Graydon LLP Suite 4000 199 Bay Street Toronto, ON M5L 1A9 (416) 863-2400 |
Shelley A. Barber Brenda K. Lenahan Vinson & Elkins L.L.P. 666 Fifth Avenue New York, NY 10103 (212) 237-0000 |
Philip D.A. Symmonds Rima Ramchandani Torys LLP Suite 3000 79 Wellington Street West Toronto, ON M5K 1N2 |
Approximate date of commencement of proposed sale to the public: As soon as practicable after the effective date of this Registration Statement.
If any of the securities being registered on this form are to be offered on a delayed or continuous basis pursuant to Rule 415 under the Securities Act of 1933, check the following box. ¨
If this form is filed to register additional securities for an offering pursuant to Rule 462(b) under the Securities Act, check the following box and list the Securities Act registration statement number of the earlier effective registration statement for the same offering. ¨
If this form is a post-effective amendment filed pursuant to Rule 462(c) under the Securities Act, check the following box and list the Securities Act registration statement number of the earlier effective registration statement for the same offering. ¨
If this form is a post-effective amendment filed pursuant to Rule 462(d) under the Securities Act, check the following box and list the Securities Act registration statement number of the earlier effective registration statement for the same offering. ¨
Indicate by check mark whether the registrant is a large accelerated filer, an accelerated filer, a non-accelerated filer, or a smaller reporting company. See the definitions of “large accelerated filer,” “accelerated filer” and “smaller reporting company” in Rule 12b-2 of the Exchange Act.
| Large accelerated filer | ¨ | Accelerated filer | ¨ | |||
| Non-accelerated filer | x (Do not check if a smaller reporting company) | Smaller reporting company | ¨ | |||
CALCULATION OF REGISTRATION FEE1
|
| ||||||||
| Title Of Each Class Of Securities To Be Registered |
Amount To Be Registered(1)(2) |
Proposed Maximum Offering Price Per Unit(1)(2)(3) |
Proposed Maximum Offering Price(1)(2)(3) |
Amount Of Registration Fee(3)(4) | ||||
| Class A common stock, $0.01 par value per share |
17,801,857 | $25.84 | $459,999,985 | $59,248 | ||||
|
| ||||||||
|
| ||||||||
| (1) | Estimated solely for the purpose of computing the amount of the registration fee pursuant to Rule 457(a) under the Securities Act of 1933. |
| (2) | Includes 2,321,981 additional shares of Class A common stock that may be purchased by the underwriters. |
| (3) | Estimated solely for the purpose of calculating the registration fee in accordance with Rule 457(a) promulgated under the Securities Act of 1933, as amended and is based upon the average of the high and low sales prices of the Class A common stock as reported on the NASDAQ Global Market on May 2, 2014. |
| (4) | Previously paid. |
The Registrant hereby amends this Registration Statement on such date or dates as may be necessary to delay its effective date until the Registrant shall file a further amendment which specifically states that this Registration Statement shall thereafter become effective in accordance with Section 8(a) of the Securities Act of 1933 or until the Registration Statement shall become effective on such date as the Commission, acting pursuant to said Section 8(a), may determine.
Table of Contents
The information in this prospectus is not complete and may be changed. Neither we nor the selling shareholder may sell these securities until this registration statement filed with the Securities and Exchange Commission is effective. This prospectus is not an offer to sell these securities and neither we nor the selling shareholder are soliciting an offer to buy these securities in any jurisdiction where the offer or sale is not permitted.
SUBJECT TO COMPLETION, DATED MAY 5, 2014
PROSPECTUS
15,479,876 Shares

Pattern Energy Group Inc.
Class A Common Stock
Pattern Energy Group Inc. is offering 11,609,907 shares of its Class A common stock. Pattern Energy Group LP, the selling shareholder, is offering an additional 3,869,969 shares of Class A common stock. We will not receive any of the proceeds from the sale of the shares being sold by the selling shareholder.
Our Class A common stock is listed on the NASDAQ Global Market under the symbol “PEGI” and on the Toronto Stock Exchange under the symbol “PEG.” On May 2, 2014, the last reported sale price of our Class A common stock on the NASDAQ Global Market was $25.84 and on the Toronto Stock Exchange was C$28.23.
Investing in our Class A common stock involves a high degree of risk. See “Risk Factors” beginning on page 20 of this prospectus for a discussion of certain risks that you should consider before investing.
| Per Class A Share | Total | |||||||
| Public offering price |
$ | $ | ||||||
| Underwriters’ commissions |
$ | $ | ||||||
| Net proceeds to us, before expenses |
$ | $ | ||||||
| Net proceeds to the selling shareholder, before expenses |
$ | $ | ||||||
The underwriters may also purchase up to an additional 2,321,981 shares of our Class A common stock from the selling shareholder named herein at the public offering price, less the underwriters’ commissions, within 30 days from the closing date of this offering to cover overallotments, if any. We will not receive any proceeds from the exercise of the underwriters’ overallotment option.
The underwriters expect to deliver the shares of Class A common stock to purchasers on , 2014.
Neither the Securities and Exchange Commission nor any state securities commission has approved or disapproved of these securities or determined if this prospectus is truthful or complete. Any representation to the contrary is a criminal offense.
| BMO Capital Markets | Morgan Stanley | RBC Capital Markets | ||
| Scotiabank | BofA Merrill Lynch | Wells Fargo Securities | ||
| CIBC | KeyBanc Capital Markets | Raymond James | ||
The date of this prospectus is , 2014.
Table of Contents
| Page | ||||
| vi | ||||
| 1 | ||||
| 13 | ||||
| 16 | ||||
| 20 | ||||
| 30 | ||||
| 32 | ||||
| 33 | ||||
| 34 | ||||
| 35 | ||||
| Management’s Discussion and Analysis of Financial Condition and Results of Operations |
37 | |||
| 64 | ||||
| 80 | ||||
| 105 | ||||
| 108 | ||||
| 110 | ||||
| 115 | ||||
| Material U.S. Federal Income Tax Considerations for Non-U.S. Holders of Our Class A Common Shares |
117 | |||
| Material Canadian Federal Income Tax Considerations for Holders of Our Class A Common Shares |
120 | |||
| 125 | ||||
| 131 | ||||
| 131 | ||||
| 132 | ||||
Subscriptions will be received subject to rejection or allotment in whole or in part and the right is reserved to close the subscription books at any time without notice. We expect that delivery of our Class A shares will be made against payment therefor on or about the date specified on the cover page of this prospectus.
i
Table of Contents
NOTICE TO INVESTORS
We are a holding company with U.S. operating subsidiaries that are “public utilities” (as defined in the Federal Power Act, or “FPA”) and, therefore, subject to the jurisdiction of the U.S. Federal Energy Regulatory Commission, or “FERC,” under the FPA. As a result, the FPA places certain restrictions and requirements on the transfer of an amount of our voting securities sufficient to convey direct or indirect control over us. See “Risk Factors—Risks Related to this Offering and Ownership of our Class A Shares—As a result of the FPA and FERC’s regulations in respect of transfers of control, absent prior authorization by FERC, neither we nor Pattern Development can convey to an investor, nor will an investor in our company generally be permitted to obtain, a direct and/or indirect voting interest in 10% or more of our issued and outstanding voting securities, and a violation of this limitation could result in civil or criminal penalties under the FPA and possible further sanctions imposed by FERC under the FPA.”
MARKET AND INDUSTRY DATA
We obtained the industry, market and competitive position data used throughout this prospectus from our own internal estimates as well as from industry publications and research, surveys and studies conducted by third parties, including the Global Wind Energy Council, the World Meteorological Organization, North American Electric Reliability Corporation, National Energy Technology Laboratory, the U.S. Department of Energy, the U.S. Energy Information Administration, the Federal Energy Regulatory Commission, the Electric Reliability Council of Texas, the Public Utility Commission of Texas, the Centre for Energy, Natural Resources Canada, Ontario Power Generation, Ontario Power Authority, the Government of Manitoba, the Chilean Ministry of Energy and Puerto Rico Electric Power Authority. Industry publications, studies and surveys generally state that they have been obtained from sources believed to be reliable, although they do not guarantee the accuracy or completeness of such information. While we believe our internal company research is reliable and the market definitions are appropriate, neither such research nor these definitions have been verified by any independent source. Estimates of historical growth rates in the markets where we operate are not necessarily indicative of future growth rates in such markets.
TRADEMARKS
This prospectus includes trademarks, such as the Pattern name and the Pattern logo, which are protected under applicable intellectual property laws and are our property and/or the property of our subsidiaries. This prospectus also contains trademarks, service marks, copyrights and trade names of other companies, which are the property of their respective owners. We do not intend our use or display of other companies’ trademarks, service marks, copyrights or trade names to imply a relationship with, or endorsement or sponsorship of us by, any other companies. Solely for convenience, our trademarks and tradenames referred to in this prospectus may appear without the ® or ™ symbols, but such references are not intended to indicate, in any way, that we will not assert, to the fullest extent under applicable law, our rights or the right of the applicable licensor to these trademarks and tradenames. We have entered into an agreement with Pattern Development under which Pattern Development licenses us the name “Pattern” and the Pattern logo and also grants us a right to acquire the name and logo, subject to our granting Pattern Development a license to use the name “Pattern” and the Pattern logo after we acquire it.
CURRENCY AND EXCHANGE RATE INFORMATION
In this prospectus, references to “C$” and “Canadian dollars” are to the lawful currency of Canada and references to “$”, “US$” and “U.S. dollars” are to the lawful currency of the United States. All dollar amounts herein are in U.S. dollars, unless otherwise stated.
ii
Table of Contents
Our historical consolidated financial statements that are included elsewhere or incorporated by reference in this prospectus are presented in U.S. dollars. The following chart sets forth for each of 2011, 2012 and 2013, and each completed month to date during 2014, the high, low, period average and period end noon buying rates of Canadian dollars expressed as Canadian dollars per US$1.00.
| Canadian Dollars per US$ 1.00 | ||||||||||||||||
| High | Low | Period Average(1) |
Period End | |||||||||||||
| Year |
||||||||||||||||
| 2011 |
C$ | 1.0605 | C$ | 0.9448 | C$ | 0.9887 | C$ | 1.0168 | ||||||||
| 2012 |
1.0417 | 0.9710 | 0.9995 | 0.9958 | ||||||||||||
| 2013 |
1.0697 | 0.9839 | 1.0300 | 1.0637 | ||||||||||||
| Month |
||||||||||||||||
| January 2014 |
1.1171 | 1.0612 | 1.0940 | 1.1116 | ||||||||||||
| February 2014 |
1.1137 | 1.0952 | 1.1054 | 1.1075 | ||||||||||||
| March 2014 |
1.1251 | 1.0965 | 1.1107 | 1.1053 | ||||||||||||
| April 2014 (through April 25) |
1.1041 | 1.0902 | 1.0993 | 1.1041 | ||||||||||||
| (1) | The average of the noon buying rates on the last business day of each month during the relevant one-year period and, in respect of monthly information, the average of the noon buying rates on each business day for the relevant one-month period. |
The noon buying rate in Canadian dollars on April 25, 2014 was US$1.00 = C$1.1041.
The above rates differ from the actual rates used in our consolidated historical financial statements and the calculation of cash available for distribution and dividends we declared and paid, if any, described elsewhere or incorporated by reference in this prospectus. Our inclusion of these exchange rates is not meant to suggest that the U.S. dollar amounts actually represent such Canadian dollar amounts or that such amounts could have been converted into Canadian dollars at any particular rate or at all.
For information on the impact of fluctuations in exchange rates on our operations, see “Risk Factors—Risks Related to Our Projects—Currency exchange rate fluctuations may have an impact on our financial results and condition” in our 2013 Form 10-K and “Management’s Discussion and Analysis of Financial Condition and Results of Operations—Quantitative and Qualitative Disclosure About Market Risk—Foreign Currency Risk.”
CAUTIONARY STATEMENT REGARDING THE USE OF NON-GAAP MEASURES
This prospectus, including documents incorporated by reference, contains references to Adjusted EBITDA, cash available for distribution before principal payments and cash available for distribution, which are not measures under generally accepted accounting principles in the United States, or “U.S. GAAP,” and, therefore, may differ from definitions of these measures used by other companies in our industry. We disclose Adjusted EBITDA, cash available for distribution before principal payments and cash available for distribution because we believe that these measures may assist investors in assessing our financial performance and the anticipated cash flow from our projects. None of these measures should be considered the sole measure of our performance and should not be considered in isolation from, or as a substitute for, the financial statements included elsewhere or incorporated by reference in this prospectus prepared in accordance with U.S. GAAP. For further discussion of the limitations of these non-U.S. GAAP measures and the reconciliations of net income to Adjusted EBITDA and net cash provided by (used in) operating activities to each of cash available for distribution before principal payments and cash available for distribution, see footnotes 1 and 2 to the table under the heading “Summary Historical Consolidated Financial Data” elsewhere in this prospectus.
iii
Table of Contents
MEANING OF CERTAIN REFERENCES
Unless the context requires otherwise, any reference in this prospectus to:
| • | “Class A shares” refers to shares of our Class A common stock, par value $0.01 per share; |
| • | “Class B shares” refers to shares of our Class B common stock, par value $0.01 per share; |
| • | our “construction projects” refers to the Grand, Panhandle 1, Panhandle 2 and El Arrayán projects, where we, or Pattern Development in the case of Panhandle 1 and Panhandle 2, have commenced construction; |
| • | the “Conversion Event” refers to the later of December 31, 2014 and the date on which our South Kent project has achieved commercial operations; |
| • | “El Arrayán” or the “El Arrayán project” refers to the wind power project assets held by Parque Eólico El Arrayán SpA, a share company formed under the laws of Chile, which upon commencement of commercial operations will have an owned capacity of 36 MW; |
| • | “FIT” refers to feed-in-tariff regime; |
| • | “Grand” or the “Grand project” refers to the wind power project assets held by a 45/45/10 joint venture between us, Samsung and the Six Nations which has an owned capacity of 67 MW; |
| • | “Gulf Wind” or the “Gulf Wind project” refers to the wind power project assets held by Pattern Gulf Wind LLC, a limited liability company formed under the laws of the State of Delaware, which has an owned capacity of 113 MW; |
| • | “Hatchet Ridge” or the “Hatchet Ridge project” refers to the wind power project assets held by Hatchet Ridge Wind, LLC, a limited liability company formed under the laws of the State of Delaware, which has an owned capacity of 101 MW; |
| • | “IPPs” refers to independent power producers; |
| • | “ISOs” refers to independent system organizations, which are organizations that administer wholesale electricity markets; |
| • | “ITCs” refers to investment tax credits; |
| • | “MW” refers to megawatts; |
| • | “MWh” refers to megawatt hours; |
| • | “OCC” refers to our operations control center; |
| • | “Ocotillo” or the “Ocotillo project” refers to the wind power project assets held by Ocotillo Express LLC, a limited liability company formed under the laws of the State of Delaware, which has an owned capacity of 265 MW; |
| • | our “operating projects” refers to the Gulf Wind, Hatchet Ridge, St. Joseph, Spring Valley, Santa Isabel, Ocotillo and South Kent projects, where we have commenced commercial operations; |
| • | “owned capacity” of any particular project refers to the maximum, or rated, electricity generating capacity of the project in MW multiplied by our percentage ownership interest in the distributable cash flow of the project; |
| • | our “predecessor” refers to our accounting predecessor, which consists of a combination of entities and assets contributed to us by Pattern Development concurrently with the IPO; |
| • | our “projects,” “portfolio” or “project portfolio” in each case refers to our operating projects together with our construction projects; |
iv
Table of Contents
| • | “Panhandle” or “the “Panhandle project” refers to the Panhandle 1 and Panhandle 2 projects collectively. |
| • | “Panhandle 1” or the “Panhandle 1 project” refers to the wind power project assets held by Pattern Panhandle Wind LLC, a limited liability company formed under the laws of the State of Delaware, and a 100% owned subsidiary of Pattern Development, which we have agreed to acquire from Pattern Development shortly after its commencement of commercial operations, which we expect to occur in June 2014, and will, upon the completion of our acquisition, have an owned capacity of 179 MW; |
| • | “Panhandle 2” or the “Panhandle 2 project” refers to the wind power project assets held by Pattern Panhandle Wind 2 LLC, a limited liability company formed under the laws of the State of Delaware, which we have agreed to acquire from Pattern Development and will, upon the completion of our acquisition, which we expect to occur in the fourth quarter of 2014, have an owned capacity of 147 MW; |
| • | “Pattern Development” refers to Pattern Energy Group LP and, where the context so requires, its subsidiaries (excluding us); |
| • | “Pattern Development-owned capacity” of any particular project refers to the maximum, or rated, electricity generating capacity of the project in MW multiplied by Pattern Development’s percentage ownership interest in the distributable cash flow of the project; |
| • | “power sale agreements” refers to PPAs and/or hedging arrangements, as applicable; |
| • | “PPAs” refers to power purchase agreements; |
| • | “PTCs” refers to production tax credits; |
| • | “rated capacity” refers to maximum electricity generating capacity in MW; |
| • | “RECs” refers to renewable energy credits; |
| • | “RFP” refers to a request for procurement; |
| • | “RPS” refers to Renewable Portfolio Standards; |
| • | “Santa Isabel” or the “Santa Isabel project” refers to the wind power project assets held by Pattern Santa Isabel LLC, a limited liability company formed under the laws of the State of Delaware, which has an owned capacity of 101 MW; |
| • | “shares,” “common shares” or “common stock” collectively refers to our Class A shares and Class B shares; |
| • | “South Kent” or the “South Kent project” refers to the wind power project assets held by South Kent Wind LP, a limited partnership formed under the laws of the Province of Ontario, which has an owned capacity of 135 MW; |
| • | “Spring Valley” or the “Spring Valley project” refers to the wind power project assets held by Spring Valley Wind LLC, a limited liability company formed under the laws of the State of Nevada, which has an owned capacity of 152 MW; and |
| • | “St. Joseph” or the “St. Joseph project” refers to the wind power project assets held by St. Joseph Windfarm Inc., a corporation formed under the laws of Canada, which has an owned capacity of 138 MW. |
v
Table of Contents
DOCUMENTS INCORPORATED BY REFERENCE
Information has been incorporated by reference in this prospectus from documents filed with the Securities and Exchange Commission (“SEC”) or similar authorities in the provinces and territories of Canada. Copies of the documents incorporated in this prospectus by reference may be obtained on request without charge from the Corporate Secretary of Pattern Energy at Pier 1, Bay 3, San Francisco, CA, telephone 415-283-4000. In addition, copies of the documents incorporated by reference herein may be obtained from the SEC through EDGAR at www.sec.gov or similar authorities in Canada through SEDAR at www.sedar.com. The following documents, filed with the SEC or similar authorities in the provinces and territories of Canada, are specifically incorporated by reference into and form an integral part of this prospectus:
| • | Our Annual Report on Form 10-K for the fiscal year ended December 31, 2013 filed with the SEC on February 28, 2014 (“2013 Form 10-K”); |
| • | Amendment No. 1 to our 2013 Form 10-K filed with the SEC on May 5, 2014; |
| • | Our Quarterly Report on Form 10-Q filed with the SEC on May 2, 2014; |
| • | The information specifically incorporated by reference into the 2013 Form 10-K from our Definitive Proxy Statement on Schedule 14A filed with the SEC on April 23, 2014 (“2014 Proxy Statement”); |
| • | Our Current Report on Form 8-K filed with the SEC on May 5, 2014; |
| • | The description of our Class A common stock contained in our Registration Statement on Form 8-A, filed with the SEC on September 24, 2013; and |
| • | The description of our Class A common stock issued under our 2013 Equity Incentive Award Plan contained in our Registration Statement on Form S-8, filed with the SEC on October 9, 2013. |
Notwithstanding the foregoing, we are not incorporating by reference any documents, portions of documents, exhibits or other information that is deemed to have been furnished to, rather than filed with, the SEC.
vi
Table of Contents
This summary highlights information contained elsewhere in, or incorporated by reference into, this prospectus. It does not contain all the information you need to consider in making your investment decision. You should read this entire prospectus carefully and should consider, among other things, the matters set forth under “Risk Factors,” along with the financial data and related notes and the other documents that we incorporate by reference into this prospectus before making your investment decision. See “Documents Incorporated by Reference.” Unless the context provides otherwise, references herein to (i) “we,” “our,” “us,” “our company” and “Pattern Energy” refer to Pattern Energy Group Inc., a Delaware corporation, together with its consolidated subsidiaries and (ii) “Pattern Development” refers to Pattern Energy Group LP and, where the context so requires, its subsidiaries (excluding us). For an explanation of certain terms used in this prospectus see “Meaning of Certain References.” For recent and historical exchange rates between Canadian dollars and U.S. dollars, see “Currency and Exchange Rate Information.”
Our Business
We are an independent power company focused on owning and operating power projects with stable long-term cash flows in attractive markets with potential for continued growth of our business. Including the pending acquisitions of the Panhandle 1 and Panhandle 2 projects,1 which we have agreed to acquire from Pattern Development, we own interests in eleven wind power projects located in the United States, Canada and Chile that use proven, best-in-class technology and have a total owned capacity of 1,434 MW, consisting of seven operating projects and four construction projects. We expect our four construction projects will commence commercial operations prior to the end of 2014. Each of our projects has contracted to sell all or a majority of its output pursuant to a long-term, fixed-price power sale agreement with a creditworthy counterparty. Ninety-one percent of the electricity to be generated by our projects will be sold under these power sale agreements, which have a weighted average remaining contract life of approximately 17 years.
We have two classes of authorized common stock outstanding, Class A shares and Class B shares. The rights of the holders of our Class A and Class B shares are identical other than in respect of dividends and the conversion rights of our Class B shares. On December 31, 2014, which is the later of that date and the date on which our South Kent project achieved commercial operations (which occurred on March 28, 2014), and which we refer to as the “Conversion Event,” all of our outstanding Class B shares will automatically convert, on a one-for-one basis, into Class A shares. Our Class B shares, all of which are held by Pattern Development and members of management, have no rights to dividends. See “Description of Capital Stock.”
We intend to use a substantial portion of the cash available for distribution generated from our projects to pay regular quarterly dividends in U.S. dollars to holders of our Class A shares. On November 26, 2013, we announced the initiation of a quarterly common stock dividend and on each of January 30, 2014 and April 30, 2014, we paid a dividend to each of our Class A common shareholders of $0.3125 per Class A share, or $1.25 per Class A share on an annualized basis. We established our initial quarterly dividend level based on a target payout ratio of approximately 80% after considering our expected 2014 and subsequently sustainable cash available for distribution to be generated from our projects, together with the impact of the Class A shares to be issued upon the Conversion Event. We increased our quarterly dividend to $0.322 per Class A share, $1.288 per Class A
| 1 | We agreed in May 2014 to acquire Panhandle 1 from Pattern Development, subject to the satisfaction of customary closing conditions, shortly after its commencement of commercial operations, which we expect to occur in June 2014. We agreed in December 2013 to acquire Panhandle 2 from Pattern Development, subject to the satisfaction of customary closing conditions, following its commencement of commercial operations, which we expect to occur in the fourth quarter of 2014. See “Management’s Discussion & Analysis of Financial Condition and Results of Operations—Factors that Significantly Affect our Business—Recent Transactions—Project Acquisitions.” |
1
Table of Contents
share on an annualized basis, representing a 3% increase in our quarterly dividend, commencing with respect to dividends payable to shareholders of record on June 30, 2014. The declaration and amount of our future dividends, if any, will be subject to our actual earnings and capital requirements and the discretion of our Board of Directors, and will likely take into account any contribution to our expected sustainable cash available for distribution resulting from projects that we acquire from Pattern Development or third parties.
Pattern Development has granted us preferential rights to acquire projects that it owns and chooses to sell, including, among others, certain projects, or the “Initial ROFO Projects,” which are predominantly operational, in construction or construction ready and which we consider reasonably likely that we may have the opportunity to acquire at various times within the 18-month period following the completion of this offering. At the time of our initial public offering, or IPO, in October 2013, we identified six projects at Pattern Development with an aggregate owned capacity of 746 MW that comprised the Initial ROFO Projects, and we indicated we had initiated discussions with Pattern Development in connection with one of these originally identified Initial ROFO Projects, the Panhandle project, which we might acquire shortly after the closing of the IPO. Pattern Development subsequently increased the owned capacity of the Panhandle project by 78 MW, to a total of 326 MW, and split the project into the Panhandle 1 project, with a Pattern Development-owned capacity of 179 MW, and the Panhandle 2 project, with an owned capacity of 147 MW. Pattern Development also increased its estimated capacity of another of the originally identified Initial ROFO Projects, the Meikle project in British Columbia, by 10 MW, to 185 MW. In December 2013, we acquired one of the Initial ROFO Projects, the Grand project, with an owned capacity of 67 MW, and agreed to acquire the Panhandle 2 project, with such acquisition expected to be completed in the fourth quarter of 2014 at the time of that project’s commencement of commercial operations. In May 2014, we agreed to acquire the Panhandle 1 project from Pattern Development, with such acquisition to be completed shortly after its commencement of commercial operations, which we expect to occur in June 2014. After accounting for Pattern Development’s increase in the size of the Panhandle and Meikle projects, our acquisition of the Grand project and our agreements to acquire the Panhandle 1 and Panhandle 2 projects, the owned capacity of the remaining Initial ROFO Projects is 441 MW. See the table under “—Our Relationship with Pattern Development” for more information about the remaining Initial ROFO Projects.
Based on our anticipated cash available for distribution and our increased quarterly dividend level, we believe that we will generate excess cash flow that we can use, together with our cash on hand and the proceeds of any potential future debt or equity issuances, to invest in accretive project acquisition opportunities, including the remaining Initial ROFO Projects. Considering our preferential rights to acquire the Initial ROFO Projects, at the time of our IPO, we established a three-year targeted average annual growth rate in our cash available for distribution per Class A share of 8% to 10%. Taking into consideration our acquisition of the Grand project in December, our agreement to acquire the Panhandle 1 and Panhandle 2 projects later this year, Pattern Development’s increase in the size of the Panhandle and Meikle projects, and continued progress in the development of the remaining Initial ROFO Projects, we have increased our three-year targeted average annual growth rate in our cash available for distribution per Class A share to 10% to 12%.
Our Core Values and Financial Objectives
We intend to maximize long-term value for our shareholders in an environmentally responsible manner and with respect for the communities in which we operate. Our business is built around the core values of creating a safe, high-integrity and exciting work environment; applying rigorous analysis to all aspects of our business; and proactively working with our stakeholders to address environmental and community concerns.
Our financial objectives, which we believe will maximize long-term value for our shareholders, are to:
| • | produce stable and sustainable cash available for distribution; |
| • | selectively grow our project portfolio and our dividend; and |
2
Table of Contents
| • | maintain a strong balance sheet and flexible capital structure. |
Our Management Team
The executive officers who make up our management team have on average over 20 years of experience in all aspects of the independent power industry, including development, commercial contracting, finance, construction, operations and management, and are dedicated to protecting the long-term value of our projects. Almost all of the members of our and Pattern Development’s management teams have worked together since 2002 and have a proven track record of successfully identifying new opportunities, investing, constructing projects and operating energy assets during periods of both favorable and challenging economic conditions. While working together at Pattern Development and prior to its formation, members of our management team were responsible for, and successfully financed and managed, over $12 billion of infrastructure assets, including over 3,000 MW of wind power projects (representing a wind business compound annual growth rate, or “CAGR,” of 34% from 2003 to 2014, measured by cumulative wind MW installed), several independent transmission projects and other conventional power assets. Since the formation of Pattern Development in 2009, the Pattern Development management team has acquired and developed the operational and in-construction wind power projects that, including the Panhandle 1 and Panhandle 2 projects, comprise our owned capacity of 1,434 MW, representing a CAGR of 51%, and a more than 3,000 MW portfolio of development assets. We believe our management team, along with our talented staff, as well as the management team and staff at Pattern Development, provide our company with the depth of experience and breadth of skills to meet our financial objectives and successfully grow our business both domestically and internationally. In addition, we believe we are among the leaders in our industry in areas such as environmental mitigation, financing and commercial management, and we have built a team of highly skilled professionals dedicated to delivering high-quality, well-structured operating power projects.
3
Table of Contents
Our Projects
Including the pending acquisitions of the Panhandle 1 and Panhandle 2 projects, which we have agreed to acquire from Pattern Development, and which we expect to acquire at different times prior to the end of 2014, we own interests in eleven wind power projects, consisting of seven operating projects and four construction projects. The following table provides an overview of our projects:
| Location and Start-up | Capacity (MW) |
Power Sale Agreements | ||||||||||||||||||||||||||||||
| Projects |
Location | Construction Start(1) |
Commercial Operations (2) |
Rated (3) |
Owned (4) |
Type | Contracted Volume(5) |
Counterparty | Counter- party Credit Rating(6) |
Expiration | ||||||||||||||||||||||
| Operating Projects |
|
|||||||||||||||||||||||||||||||
| Gulf Wind |
Texas | Q1 2008 | Q3 2009 | 283 | 113 | Hedge(7) | ~58% | Credit Suisse Energy LLC |
A/A1 | 2019 | ||||||||||||||||||||||
| Hatchet Ridge |
California | Q4 2009 | Q4 2010 | 101 | 101 | PPA | 100% | Pacific Gas & Electric |
BBB/A3 | 2025 | ||||||||||||||||||||||
| St. Joseph |
Manitoba | Q1 2010 | Q2 2011 | 138 | 138 | PPA | 100% | Manitoba Hydro | AA/Aa1(8) | 2039 | ||||||||||||||||||||||
| Spring Valley |
Nevada | Q3 2011 | Q3 2012 | 152 | 152 | PPA | 100% | NV Energy | BBB+/Baa2 | 2032 | ||||||||||||||||||||||
| Santa Isabel |
Puerto Rico | Q4 2011 | Q4 2012 | 101 | 101 | PPA | 100% | Puerto Rico Electric Power Authority |
BBB/Ba2 | 2037 | ||||||||||||||||||||||
| Ocotillo(9) |
California | Q3 2012 | Q4 2012 | 223 | 223 | PPA | 100% | San Diego Gas & Electric |
A/A1 | 2033 | ||||||||||||||||||||||
| Q2 2013 | 42 | 42 | PPA | 100% | San Diego Gas & Electric |
A/A1 | 2033 | |||||||||||||||||||||||||
| South Kent |
Ontario | Q1 2013 | Q1 2014 | 270 | 135 | PPA | 100% | Ontario Power Authority |
AA-/Aa2(10) | 2034 | ||||||||||||||||||||||
|
|
|
|
|
|||||||||||||||||||||||||||||
| 1,310 | 1,005 | |||||||||||||||||||||||||||||||
|
|
|
|
|
|||||||||||||||||||||||||||||
| Construction Projects |
||||||||||||||||||||||||||||||||
| El Arrayán |
Chile | Q3 2012 | Q2 2014 | 115 | 36 | Hedge(11) | ~75% | Minera Los Pelambres |
NA | 2034 | ||||||||||||||||||||||
| Grand |
Ontario | Q3 2013 | Q4 2014 | 149 | 67 | PPA | 100% | Ontario Power Authority |
AA-/Aa2(10) | 2035 | ||||||||||||||||||||||
| Panhandle 1(12) |
Texas | Q4 2013 | Q2 2014 | 218 | 179 | Hedge(13) | ~77% | Citigroup Energy | A-/Baa2 | 2027 | ||||||||||||||||||||||
| Panhandle 2(12) |
Texas | Q4 2013 | Q4 2014 | 182 | 147 | Hedge(14) | ~80% | Morgan Stanley | A-/Baa2 | 2027 | ||||||||||||||||||||||
|
|
|
|
|
|||||||||||||||||||||||||||||
| 664 | 429 | |||||||||||||||||||||||||||||||
|
|
|
|
|
|||||||||||||||||||||||||||||
| 1,974 | 1,434 | |||||||||||||||||||||||||||||||
|
|
|
|
|
|||||||||||||||||||||||||||||
| (1) | Represents date of commencement of construction. |
| (2) | Represents date of actual or anticipated commencement of commercial operations. |
| (3) | Rated capacity represents the maximum electricity generating capacity of a project in MW. As a result of wind and other conditions, a project or a turbine will not operate at its rated capacity at all times and the amount of electricity generated will be less than its rated capacity. The amount of electricity generated may vary based on a variety of factors discussed elsewhere or incorporated by reference in this prospectus See “Risk Factors” in our 2013 Form 10-K. |
| (4) | Owned capacity represents the maximum, or rated, electricity generating capacity of the project in MW multiplied by our percentage ownership interest in the distributable cash flow of the project. |
| (5) | Represents the percentage of a project’s total estimated average annual MWh of electricity generation contracted under power sale agreements. |
| (6) | Reflects the counterparty’s corporate credit ratings issued by S&P/Moody’s as of April 23, 2014. |
| (7) | Represents a 10-year fixed-for-floating power price swap. See “Business—Operating Projects—Gulf Wind.” |
| (8) | Reflects the corporate credit ratings of the Province of Manitoba, which owns 100% of Manitoba Hydro-Electric. |
| (9) | We initially commenced commercial operations on 223 MW of electricity generating capacity in the fourth quarter of 2012 and commenced commercial operations on the remaining 42 MW of electricity generating capacity from Ocotillo’s additional 18 turbines in July 2013. |
| (10) | Reflects the corporate credit ratings of the Province of Ontario, which owns 100% of the Ontario Power Authority. |
| (11) | Represents a 20-year fixed-for-floating swap. See “Business—Construction Projects—El Arrayán.” |
| (12) | The Panhandle project was separated into a separate Panhandle 1 project, with a Pattern Development-owned capacity of 179 MW, and the Panhandle 2 project, with an owned capacity of 147 MW; acquisition of the Panhandle 1 and Panhandle 2 projects is pending, and scheduled to close at different times prior to the end of 2014. |
| (13) | Represents a 13-year fixed-for-floating swap. See “Business—Construction Projects—Panhandle 1 and Panhandle 2.” |
| (14) | Represents a 12.25-year fixed-for-floating swap. See “Business—Construction Projects—Panhandle 1 and Panhandle 2.” |
Each of our projects has gone through a rigorous vetting process in order to meet our investment and our lenders’ financing criteria. The development of each project was managed and overseen by our and Pattern Development’s management teams over a period of several years and each project was designed to meet or exceed industry,
4
Table of Contents
environmental, community and safety standards applicable for industrial-scale power projects. As a result, our projects generally have the following characteristics: multi-year on-site wind data analysis; long-term contracts for our power sale, interconnection and real estate rights; fixed-price construction contracts with guaranteed completion dates; all necessary construction and operating permits; a comprehensive operations and maintenance service program; and safety, environmental and community programs.
For additional information regarding each of our projects, see “Business—Our Projects.” Our ability to begin commercial operation of our construction projects and to achieve anticipated power output at our operating projects is subject to numerous risks and uncertainties as described under “Risk Factors” in our 2013 Form 10-K.
Our Strategy
We intend to make profitable investments in environmentally responsible power projects, while embracing a long-term commitment to the communities in which we operate. To achieve our financial objectives while adhering to our core values, we intend to execute the following business strategies:
| • | maintaining and increasing the value of our projects, by focusing on value-oriented project availability (by ensuring our projects are operational when the wind is strong and PPA prices are at their highest) and by regularly scheduled and preventative maintenance and by investing in our key personnel; |
| • | completing our construction projects on schedule and within budget, by having our highly experienced construction team closely overseeing construction-contractor and turbine-vendor activities, which are subject to fixed-price contracts with guaranteed completion dates; |
| • | maintaining a prudent capital structure and financial flexibility, by seeking to match our long-term assets with long-term liabilities, limiting exposure to commodity and interest rate risk and ensuring a prudent level of leverage in our business; |
| • | working closely with our stakeholders, including suppliers, power sale agreement counterparties and the local communities where we are located to best support our projects; and |
| • | selectively growing our business, by leveraging our management team’s extensive relationships, experience and highly disciplined approach to evaluating and facilitating new business opportunities, including through collaboration with Pattern Development and other developers to advance their development pipelines, and by focusing on projects and regions where we believe we can add value. |
For more information about our business strategy, see “Business—Our Strategy.”
Our Competitive Strengths
We believe our key competitive strengths include:
| • | our high-quality projects, which we believe provide the foundation for the stable long-term cash flows required to operate our business, service our debt and achieve our financial objectives; |
| • | our strong reputation in the industry, which we believe is derived from our integrity, expertise, solutions-oriented approach and record of success, which attracts talented people and opportunities; |
| • | our approach to project selection, which aims to deliver superior financial results and minimize long-term operating risks, by employing a highly disciplined, timely and comprehensive analysis of projects using our in-house experts; |
| • | our relationship with Pattern Development, which enhances our ability to operate our projects and provides us with access to a pipeline of acquisition opportunities, including the remaining Initial ROFO Projects (see “—Our Relationship with Pattern Development”); and |
5
Table of Contents
| • | our proven management team, which has extensive experience in all aspects of the independent power business, a demonstrated track record of successfully developing, constructing and operating wind power projects and a history of prudent financial and technological innovation in the power industry. |
For more information about our competitive strengths, see “Business—Competitive Strengths.”
Market Opportunity
Wind power has been one of the fastest growing sources of electricity generation in North America and globally over the past decade. According to the Global Wind Energy Council, or “GWEC,” from 2003 through 2013, total net electricity generation from wind power in the United States and Canada grew at a CAGR of 25% and 38%, respectively. The growth in the industry is largely attributable to renewable energy’s increasing cost competitiveness with other power generation technologies, the advantages of wind power over other renewable energy sources and growing public support for renewable energy driven by concerns regarding security of energy supply and the environment. As global demand for electricity generation from wind power has increased, technology enhancements—supported by U.S. government incentives – have reduced the cost of wind power by more than 90% over the last twenty years, according to the American Wind Energy Association, or “AWEA.”
The United States is the second largest market for wind power in the world by electricity generating capacity. According to the U.S. Department of Energy, or “DoE,” wind power was the second largest source of new electricity generating capacity in the United States after natural gas for six of the seven years between 2005 and 2011. According to AWEA, wind power became a leading source of new electricity generating capacity in the United States for the first time in 2012. The success of wind power in the United States is evidenced by over $90 billion in investments over the last five years, according to AWEA.
The Canadian wind power industry has also experienced dramatic growth in recent years. In 2013, Canada experienced approximately 1,600 MW of new installed wind power generating capacity, resulting in wind power generating capacity in Canada reaching approximately 7,800 MW as of January 2014. Ontario, one of our markets, is the national leader in installed capacity, with approximately 2.5 gigawatts, or “GW,” of wind power generating capacity, although recent changes to the Ontario government FIT regime may make future projects less attractive and PPAs more difficult to obtain. The EIA forecasts total wind power generating capacity in Canada to exceed 13 GW by 2020.
Chile, also one of our markets, has an abundant wind resource, which GWEC estimates could provide the potential for more than 40 GW of generating capacity. As of the end of 2013, Chile had approximately 355 MW of installed wind power generating capacity, representing approximately 2% of total electricity generating capacity and, according to GWEC, approximately 6,445 MW of wind projects under various stages of development, of which 450 MW of wind power projects were expected to come online in 2014 and a further 1,400 MW during 2015 to 2018.
Given supply diversity requirements, falling equipment costs, the inherent stability of the cost of wind power as an energy resource and an active market for the purchase and sale of power projects, we believe that our markets present a substantial opportunity for growth. We require a relatively small share of a very large market to meet our growth objectives and we believe we will achieve growth through the acquisition of operational and construction-ready projects from Pattern Development and other third parties.
While we currently operate solely in wind power markets, we expect to continue to evaluate other types of independent power projects for possible acquisition, including renewable energy projects other than wind power projects, non-renewable energy projects and transmission projects.
6
Table of Contents
Our Relationship with Pattern Development
We were incorporated as a Delaware corporation by Pattern Development in October 2012 with the intent that we would own, operate and construct power projects and that Pattern Development would focus on its extensive development pipeline. Since it was formed, Pattern Development has been very active in developing project opportunities. We and Pattern Development have agreed that we will transfer Pattern Development’s employees to our company, at no cost, once we reach $2.5 billion in total market capitalization, which we believe is a sufficient size to undertake development of future projects.
Key members of our management team, together with certain other executives at Pattern Development and investment funds managed by Riverstone Holdings LLC, or “Riverstone,” formed Pattern Development in June 2009. Upon its formation, Pattern Development acquired a portfolio of development projects, but did not own any operating or construction projects. In late 2009, Pattern Development closed financing for its first construction project, Hatchet Ridge. In 2010, Pattern Development acquired the Gulf Wind project, completed construction of the Hatchet Ridge project, commenced construction of the St. Joseph project and formed a joint venture with a subsidiary of Samsung C&T Corporation, or “Samsung,” to develop at least 1,000 MW of wind power projects located in Ontario. Since 2010, Pattern Development also successfully completed construction and commenced operation of the St. Joseph, Spring Valley, Santa Isabel, Ocotillo and South Kent projects and commenced construction of the El Arrayán, Panhandle 1 and Panhandle 2, Grand and K2 projects. Certain members of Pattern Development’s management team who are not part of our management team, including John Calaway, Pattern Development’s Senior Vice President—Wind Development, and George Hardie and Colin Edwards, each a Vice President—Development, intend to continue in their current roles at Pattern Development. These individuals have been key contributors to Pattern Development’s success and to the more than 3,000 MW portfolio of development assets that includes the remaining Initial ROFO Projects.
Upon completion of this offering, Pattern Development will hold approximately 27.46% of our outstanding Class A shares and 99.1% of our outstanding Class B shares (or 22.55% and 99.1%, respectively, if the underwriters exercise their overallotment option in full), representing in the aggregate an approximate 45.17% voting interest in our company (or 41.48% if the underwriters exercise their overallotment option in full). The remaining 0.9% of our outstanding Class B shares are held by members of our management. Until the Conversion Event, neither Pattern Development nor the management holders of our Class B shares will be entitled to receive any dividends on their Class B shares.
We own, acquire and operate projects for which the development risks have been substantially reduced in order to generate stable long-term cash flows, and we expect that Pattern Development will invest in and deploy its staff to engage in higher-risk project development activities. Pattern Development holds a retained interest of approximately 27% in Gulf Wind, representing approximately 76 MW of Pattern Development-owned capacity, which we refer to as the “Pattern Development retained Gulf Wind interest” and interests in development projects with an expected total rated capacity of more than 3,000 MW, including wind power and solar power projects, as well as certain transmission development projects. Three of these development projects, together with the Pattern Development retained Gulf Wind interest, constitute the remaining Initial ROFO Projects, and are predominantly operational or construction ready.
| Remaining Initial ROFO Projects |
Capacity (MW) | |||||||||||||||||||||
| Status | Location | Construction Start(1) |
Commercial Operations(2) |
Contract Type |
Rated(3) | Pattern Development- Owned(4) |
||||||||||||||||
| Gulf Wind |
Operational | Texas | 2008 | 2009 | Hedge | 283 | 76 | |||||||||||||||
| K2 |
In Construction | Ontario | 2014 | 2015 | PPA | 270 | 90 | |||||||||||||||
| Armow |
Ready for Financing | Ontario | 2014 | 2015 | PPA | 180 | 90 | |||||||||||||||
| Meikle |
Pre-Construction | British Columbia | 2015 | 2016 | PPA | 185 | 185 | |||||||||||||||
|
|
|
|
|
|||||||||||||||||||
| 918 | 441 | |||||||||||||||||||||
|
|
|
|
|
|||||||||||||||||||
7
Table of Contents
| (1) | Represents date of actual or anticipated commencement of construction. |
| (2) | Represents date of actual or anticipated commencement of commercial operations. |
| (3) | Rated capacity represents the maximum electricity generating capacity of a project in MW. As a result of wind and other conditions, a project or a turbine will not operate at its rated capacity at all times and the amount of electricity generated will be less than its rated capacity. The amount of electricity generated may vary based on a variety of factors. |
| (4) | Pattern Development-owned capacity represents the maximum, or rated, electricity generating capacity of the project multiplied by Pattern Development’s percentage ownership interest in the distributable cash flow of the project. |
Our Purchase Rights
To promote our growth strategy, concurrent with the completion of our IPO, we entered into a purchase rights agreement with Pattern Development and its equity owners that provides us with three distinct avenues to grow our business through acquisitions:
| • | the right to acquire the Pattern Development retained Gulf Wind interest at any time between the first and second anniversary of the completion our IPO on October 2, 2013 at its then current fair market value, which we refer to as our “Gulf Wind Call Right;” |
| • | a right of first offer with respect to any power project that Pattern Development decides to sell, including the Initial ROFO Projects, which we refer to as our “Project Purchase Right;” and |
| • | a right of first offer with respect to Pattern Development itself, or substantially all of its assets, if the equity owners of Pattern Development decide to sell any material portion of the equity interests in Pattern Development or substantially all of its assets, which we refer to as our “Pattern Development Purchase Right.” |
We refer to these rights as our “Purchase Rights.” Our Gulf Wind Call Right will commence on the first anniversary of the completion of the IPO, or October 2, 2014, and will terminate on the second anniversary of the completion our IPO, or October 2, 2015. Our Project Purchase Right and Pattern Development Purchase Right will terminate together upon the fifth anniversary of the completion our IPO, or October 2, 2018, but are subject to automatic five-year renewals unless either party dissents at the time of renewal. In addition, Pattern Development will have the right to terminate our Project Purchase Right and Pattern Development Purchase Right together upon the third occasion (within any five-year initial or renewal term) on which we have elected not to exercise our Project Purchase Right with respect to an operational or construction-ready project and following which Pattern Development has sold the project to an unrelated third party.
We have made a commitment to acquire the Panhandle 1 project from Pattern Development shortly after the commencement of that project’s commercial operations, which we expect to occur in June 2014, and the Panhandle 2 project from Pattern Development following the commencement of that project’s commercial operations, which we expect to occur in the fourth quarter of this year. In addition, although we have no commitments to make any such acquisitions, we consider it reasonably likely that we may have the opportunity to acquire some or all of the remaining Initial ROFO Projects under our Purchase Rights at various times within the 18-month period following the completion of this offering. See “Use of Proceeds” and “Certain Relationships and Related Party Transactions—Our Relationship with Pattern Development—Our Purchase Rights” in our 2014 Proxy Statement.
Shareholder Approval Rights Agreement
We entered into a shareholder approval rights agreement, or the “Shareholder Agreement,” with Pattern Development concurrently with the completion of our IPO. Pursuant to the Shareholder Agreement, for so long
8
Table of Contents
as Pattern Development beneficially owns at least 33 1/3% of our shares, Pattern Development’s consent will be necessary for us to take certain material corporate actions, including: (i) our consolidation with or merger into an unaffiliated entity; (ii) certain acquisitions of stock or assets of a third-party; (iii) our adoption of a plan of liquidation, dissolution or winding up; (iv) certain dispositions of our or our subsidiaries’ assets; (v) the incurrence of indebtedness in excess of a specified amount; (vi) a change in the size of our board of directors (subject to certain exceptions); and (vii) issuing equity securities with preferential rights to our Class A shares. See “Certain Relationships and Related Party Transactions—Shareholder Agreement” in our 2014 Proxy Statement.
Non-Competition Agreement
We entered into a non-competition agreement, or the “Non-Competition Agreement,” with Pattern Development concurrently with the completion of our IPO. Pursuant to the Non-Competition Agreement, Pattern Development agreed that, for so long as any of our Purchase Rights are exercisable, it will not compete with us for acquisitions of power generation or transmission projects from third parties. Pattern Development will notify us of opportunities to acquire power generation or transmission projects that it wishes to pursue and, should we be interested in acquiring all or a portion of such projects, we may direct Pattern Development to forego such opportunities. We may also elect to collaborate with Pattern Development to jointly pursue acquisition opportunities from time to time. Riverstone is not subject to the Non-Competition Agreement.
Management Services Agreement and Shared Management
We intend to grow our assets until we have sufficient size and cash flow to undertake development activities. Until such time, we have contracted for certain services pursuant to the terms of a bilateral services agreement with Pattern Development, or the “Management Services Agreement,” that we entered into upon the completion of our IPO. However, under the terms of the Management Services Agreement, upon the completion of the first 20 consecutive trading day period during which our total market capitalization is no less than $2.5 billion, such event, the “reintegration event,” the employees of Pattern Development will become our employees, which we refer to as the “employee reintegration.”
Our project operations and maintenance personnel and executive officers are solely compensated by us and their employment with Pattern Development terminated concurrently with the completion of our IPO. These executives lead our business functions and rely on support from Pattern Development employees for certain administrative functions. Pattern Development retained only those employees whose primary responsibilities relate to project development or legal, financial or other administrative functions. The Management Services Agreement provides for us and Pattern Development to benefit, primarily on a cost-reimbursement basis, from the parties’ respective management and other professional, technical and administrative personnel, all of whom report to and are managed by our executive officers. In the event that Pattern Development is, or substantially all of its assets are, acquired by an unrelated third party, we have the unilateral right to terminate the Management Services Agreement.
Pursuant to the Management Services Agreement, certain of our executive officers, including our Chief Executive Officer, also serve as executive officers of Pattern Development and devote their time to both our company and Pattern Development as is prudent in carrying out their executive responsibilities and fiduciary duties. We refer to our employees who serve as executive officers of both our company and Pattern Development as the “shared PEG executives.” The shared PEG executives have responsibilities to both us and Pattern Development and, as a result, these individuals do not devote all of their time to our business. Under the terms of the Management Services Agreement, Pattern Development is required to reimburse us for an allocation of the compensation paid to such shared PEG executives reflecting the percentage of time spent providing services to Pattern Development.
9
Table of Contents
Upon employee reintegration, we expect that our principal focus will continue to be owning operational and under construction power projects. However, reintegration is expected to enhance our long-term ability to independently develop projects and grow our business. Following the employee reintegration, we will continue to provide management services to Pattern Development (including services from the reintegrated departments of Pattern Development) to the extent required by Pattern Development’s remaining development activities and the consideration for such services would continue to be paid primarily on a cost reimbursement basis. See “Certain Relationships and Related Party Transactions—Management Services Agreement and Shared Management” in our 2014 Proxy Statement for a further discussion of the Management Services Agreement and the employee reintegration.
Initial Public Offering and Contribution Transactions
Concurrent with the completion of our IPO, pursuant to the terms of a contribution agreement between us and Pattern Development, which we refer to as the “Contribution Agreement,” we entered into a series of transactions with Pattern Development, or the “Contribution Transactions.” In connection with the Contribution Transactions, Pattern Development contributed to us all of our initial projects, including the related properties and other assets to be used in our business, together with liabilities and obligations to which such projects are subject.
On October 2, 2013, we issued 16,000,000 shares of Class A common stock in an IPO generating net proceeds of approximately $317.0 million. Concurrent with our IPO, we issued 19,445,000 shares of Class A common stock and 15,555,000 shares of Class B common stock to Pattern Development and utilized approximately $232.6 million of the net proceeds of the IPO as a portion of the consideration to Pattern Development for the entities and assets contributed to us in the Contribution Transactions, consisting of interests in eight wind power projects, including six projects in operation (Gulf Wind, Hatchet Ridge, St. Joseph, Spring Valley, Santa Isabel and Ocotillo), and two projects under construction (El Arrayán and South Kent). In accordance with ASC 805-50-30-5, Transactions between Entities under Common Control, we recognized the assets and liabilities contributed by Pattern Development at their historical carrying amounts at the date of the Contribution Transactions. On October 8, 2013, our underwriters exercised in full their overallotment option to purchase 2,400,000 shares of Class A common stock from Pattern Development, the selling shareholder, pursuant to the overallotment option granted by Pattern Development.
In connection with the Contribution Transactions, we also assumed certain indemnities previously granted by Pattern Development for the benefit of the Spring Valley, Santa Isabel and Ocotillo project finance lenders. These indemnity obligations consist principally of indemnities that protect the project finance lenders from the potential effect of any recapture by the U.S. Department of the Treasury, or “U.S. Treasury,” of any amount of the ITC cash grants previously received by the projects. The indemnity obligations that we assumed are in amounts that are up to the greater of the respective cash grant loans or the amounts of any cash grant subsequently recaptured. Such maximum indemnity amounts are approximately $116 million, $80 million and $58 million for the Ocotillo, Spring Valley and Santa Isabel projects, respectively. In addition, we also assumed an indemnity that was granted by Pattern Development to our Ocotillo project finance lenders in connection with certain legal matters, which is limited to the amount of certain related costs and expenses. See “Risk Factors—We are subject to various indemnity obligations,” in our 2013 Form 10-K, “Business—Legal Proceedings” and “Management’s Discussion & Analysis of Financial Condition and Results of Operations—Description of Credit Agreements—Santa Isabel Senior Financing Agreement and —Ocotillo Senior Financing Agreement” in our 2013 Form 10-K.
10
Table of Contents
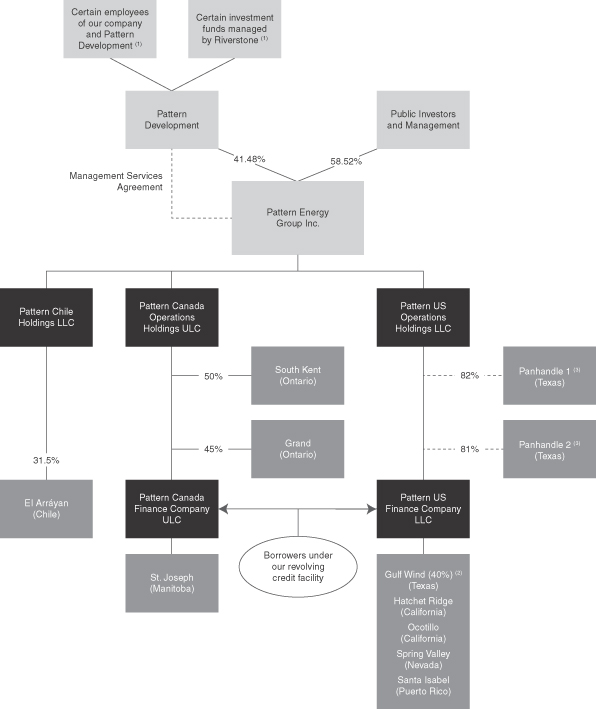
Our Ownership Structure
The following diagram summarizes our ownership structure upon completion of this offering (assuming that the underwriters’ option to purchase up to an additional 2,321,981 shares is exercised).
11
Table of Contents
| (1) | These funds and these employees hold indirect interests in Pattern Development. |
| (2) | Pattern Development holds an interest of approximately 27% in Gulf Wind, representing Pattern Development-owned capacity of 76 MW. |
| (3) | We have agreed to acquire the Panhandle 1 and Panhandle 2 projects from Pattern Development and expect to complete the acquisitions at different times prior to the end of 2014, subject to the satisfaction of customary closing conditions. |
Riverstone
Pattern Development was formed in June 2009 by the executive management team of Pattern Development and investment funds managed by Riverstone. Riverstone is an energy and power-focused private equity firm founded in 2000 with approximately $27.0 billion of equity capital raised across seven investment funds and related coinvestments, including the world’s largest renewable energy fund. Riverstone conducts buyout and growth capital investments in the midstream, exploration & production, oilfield services, power and renewable sectors of the energy industry. With offices in New York, London and Houston, the firm has committed approximately $25.8 billion to 107 investments in North America, Latin America, Europe, Africa and Asia.
Corporate Information
Our principal executive offices are located at Pier 1, Bay 3, San Francisco, California 94111, and our telephone number is (415) 283-4000. Our website is www.patternenergy.com. We make our periodic reports and other information filed or furnished to the SEC or Canadian Securities Administrators available, free of charge, through our website, as soon as reasonably practicable after those reports and other information are electronically filed with or furnished to the SEC or Canadian Securities Administrators. Except as specifically noted, information on our website is not incorporated by reference into this prospectus and does not constitute a part of this prospectus.
12
Table of Contents
| Common stock offered by us |
11,609,907 Class A shares. |
| Common stock offered by the selling shareholder |
3,869,969 Class A shares |
| Class A common stock to be outstanding after this offering(x) |
47,312,722 Class A shares. |
| Total common stock to be outstanding after this offering(x) |
62,867,722 Total Class A and Class B shares. |
| Class B common stock to be outstanding after this offering |
15,555,000 Class B shares. The rights of the holders of our Class A and Class B shares are identical other than in respect of dividends and the conversion rights of the Class B shares. While each Class A and Class B share have one vote on all matters submitted to a vote of our shareholders, our Class B shares have no rights to dividends or distributions (other than upon liquidation). Upon the Conversion Event, on December 31, 2014, all of our outstanding Class B shares will automatically convert, on a one-for-one basis, into Class A shares. See “Description of Capital Stock.” |
| Conversion Event |
Our amended and restated certificate of incorporation provides that all of our Class B shares will automatically convert into Class A shares on a one-for-one basis upon the later of December 31, 2014 and the date on which our South Kent project achieves “Commercial Operations,” which occurred on March 28, 2014. |
| Overallotment option |
Pattern Development, or the “selling shareholder,” has granted the underwriters an option, exercisable within 30 days following the closing date of this offering, to purchase up to an additional 2,321,981 Class A shares at the public offering price to cover overallotments, if any. We will not receive any proceeds from the exercise of the underwriters’ overallotment option. See “Use of Proceeds.” |
| Use of proceeds |
We estimate we will receive net proceeds of approximately $287.3 million from this offering, based on an assumed public offering price of $25.84 per Class A share, which is the last reported sale price of our Class A common stock on the NASDAQ on the cover page of this prospectus, and after deducting underwriting commissions and estimated offering expenses payable by us. We intend to use the net proceeds from this offering for working capital and general corporate purposes, including the acquisition of the Panhandle 1 wind project and potentially including certain other wind projects. See “Use of Proceeds” and “Certain Relationships and Related Party Transactions” in the 2014 Proxy Statement for additional information. |
| We will not receive any proceeds from the sale of the shares being sold by the selling shareholder. |
13
Table of Contents
| Pattern Development retained interest |
Upon completion of this offering, Pattern Development will hold approximately 27.46% of our outstanding Class A shares and 99.1% of our outstanding Class B shares (or 22.55% and 99.1%, respectively, if the underwriters exercise their overallotment option in full), representing in the aggregate an approximate 45.17% voting interest in our company (or 41.48% if the underwriters exercise their overallotment option in full). The remaining 0.9% of our outstanding Class B shares is held by members of our management. Until the Conversion Event, neither Pattern Development nor the management holders of our Class B shares will be entitled to receive any dividends on their Class B shares. |
| Dividends |
On November 26, 2013, we announced the initiation of a quarterly common stock dividend and on each of January 30, 2014 and April 30, 2014, we paid dividends to each of our Class A common shareholders of $0.3125 per Class A share, or $1.25 per Class A share on an annualized basis. We increased our quarterly dividend to $0.322 per Class A share, or $1.288 per Class A share on an annualized basis, commencing with respect to dividends payable to shareholders of record as of June 30, 2014. |
| Exchange listing |
Our Class A shares are listed on the NASDAQ Global Market, or “NASDAQ,” under the symbol “PEGI”, and the Toronto Stock Exchange, or “TSX,” under the symbol “PEG.” |
| U.S. Taxation of Dividends to Non-U.S. Holders |
The distributions that we will make to our shareholders will be treated as dividends under U.S. tax law only to the extent that they will be paid out of our current or accumulated earnings and profits computed under U.S. tax principles, which we refer to herein as “earnings and profits.” Our earnings and profits, as calculated under U.S. tax principles, may be negative at times due to various deductions, for example, depreciation. If the cash dividends paid to our shareholders exceed our current and accumulated earnings and profits for a taxable year, the excess cash dividends would not be taxable as a dividend but rather would be treated as a return of capital for U.S. federal income tax purposes, which would result in a reduction in the adjusted tax basis of our shares to the extent thereof, and any balance in excess of adjusted basis would be treated as a gain for U.S. federal income tax purposes. For non-U.S. Holders (as defined under “Material U.S. Federal Income Tax Considerations for Non-U.S. Holders of Our Class A Common Shares”), cash dividends that are treated as dividends would normally be subject to U.S. federal withholding tax at the rate of 30% (or at a reduced rate under an applicable income tax treaty). Although distributions on our Class A common shares in any year likely will exceed our earnings and profits and thus some or all of such distributions will not constitute dividends for U.S. federal income tax purposes, the facts necessary to make a determination of the extent to which a distribution on our Class A common shares is treated as a dividend for such purpose may not be known at the time of the distribution, and therefore a non- U.S. holder should expect that |
14
Table of Contents
| a withholding agent will treat the entire amount of a distribution on our Class A common shares as a dividend for purposes of determining the amount required to be withheld on such distribution. If it is later determined that all or a portion of such distribution did not in fact constitute a dividend for U.S. federal income tax purposes, a non-U.S. holder may be entitled to a refund of any excess tax withheld, provided that the required information is timely furnished to the IRS. |
| For more information, see “Material U.S. Federal Income Tax Considerations for Non-U.S. Holders of Our Class A Common Shares.” |
| Canadian Taxation of Dividends to Canadian Resident Shareholders and Non-Canadian Resident Shareholders |
Shareholders resident in Canada will generally be required to include in their income any dividends, including any amounts deducted for U.S. withholding tax, if any, received on the shares whether or not treated as dividends under U.S. tax law. Such shareholders may be eligible for a foreign tax credit or deduction in respect of any U.S. withholding tax in computing their Canadian tax liability. |
| Dividends paid in respect of our shares to shareholders not resident in Canada will not be subject to Canadian withholding tax or, generally, other Canadian income tax. |
| For more information, see “Material Canadian Federal Income Tax Considerations for Holders of Our Class A Common Shares.” |
| FERC-Related Purchase Restrictions |
As a result of the FPA and FERC’s regulations in respect of transfers of control, consistent with the requirements for blanket authorizations granted under or exemptions from FERC’s regulations, absent prior authorization by FERC, no purchaser in this offering will be permitted to purchase an amount of our Class A shares that would cause such purchaser and its affiliate and associate companies in aggregate to hold 10% or more of our common shares outstanding after this offering. See “Risk Factors—Risks Related to this Offering and Ownership of our Class A Shares—As a result of the FPA and FERC’s regulations in respect of transfers of control, absent prior authorization by FERC, neither we nor Pattern Development can convey to an investor, nor will an investor in our company generally be permitted to obtain, a direct and/or indirect voting interest in 10% or more of our issued and outstanding voting securities, and a violation of this limitation could result in civil or criminal penalties under the FPA and possible further sanctions imposed by FERC under the FPA.” |
| (x) | Includes (a) 11,609,907 Class A shares offered by us to the public hereby and (b) 35,702,815 Class A shares outstanding prior to this offering, and excludes 2,295,270 Class A shares available for future issuance under our 2013 Equity Incentive Award Plan. |
15
Table of Contents
SUMMARY HISTORICAL CONSOLIDATED FINANCIAL DATA
The following table presents summary historical consolidated financial data as of the dates and for the periods indicated. The summary historical consolidated financial data as of December 31, 2011, 2012 and 2013 and for the years ended December 31, 2011, 2012 and 2013 have been derived from the audited historical consolidated financial statements incorporated by reference in this prospectus. The summary historical consolidated financial data as of March 31, 2014 and for the three months ended March 31, 2013 and 2014 have been derived from our unaudited interim historical financial statements incorporated by reference in this prospectus.
Our historical consolidated financial statements are presented in U.S. dollars and have been prepared in accordance with U.S. GAAP, which differ in certain material respects from International Financial Reporting Standards, or “IFRS.” For recent and historical exchange rates between Canadian dollars and U.S. dollars, see “Currency and Exchange Rate Information.”
You should read the following table in conjunction with “Structure and Formation of Our Company,” “Use of Proceeds,” “Capitalization,” “Management’s Discussion and Analysis of Financial Condition and Results of Operations,” and the historical consolidated financial statements and the notes thereto, as well as the historical financial statements of Panhandle Wind Holdings LLC and Panhandle B Member 2 LLC and the pro forma financial information relating to the acquisitions of the Panhandle 1 and Panhandle 2 projects, included elsewhere or incorporated by reference in this prospectus.
| Three Months ended March 31, | Year ended December 31, | |||||||||||||||||||
| 2014 | 2013 | 2013 | 2012 | 2011 | ||||||||||||||||
| (U.S. dollars in thousands, except per share data, share data and operating data) |
||||||||||||||||||||
| Statement of Operations Data: |
||||||||||||||||||||
| Revenue |
||||||||||||||||||||
| Electricity Sales |
$ | 53,871 | $ | 45,232 | $ | 173,270 | $ | 101,835 | $ | 108,770 | ||||||||||
| Energy derivative settlements |
2,735 | 5,408 | 16,798 | 19,644 | 9,512 | |||||||||||||||
| Unrealized (loss) gain on energy derivative |
(7,733 | ) | (6,803 | ) | (11,272 | ) | (6,951 | ) | 17,577 | |||||||||||
| Related party revenue |
445 | — | 911 | — | — | |||||||||||||||
| Other Revenue |
231 | — | 21,866 | — | — | |||||||||||||||
|
|
|
|
|
|
|
|
|
|
|
|||||||||||
| Total revenue |
49,549 | 43,837 | 201,573 | 114,528 | 135,859 | |||||||||||||||
| Cost of revenue |
||||||||||||||||||||
| Project expenses |
16,074 | 12,977 | 57,677 | 34,843 | 31,343 | |||||||||||||||
| Depreciation and accretion |
21,177 | 22,566 | 83,180 | 49,027 | 39,424 | |||||||||||||||
|
|
|
|
|
|
|
|
|
|
|
|||||||||||
| Total cost of revenue |
37,251 | 35,543 | 140,857 | 83,870 | 70,767 | |||||||||||||||
|
|
|
|
|
|
|
|
|
|
|
|||||||||||
| Gross profit |
12,298 | 8,294 | 60,716 | 30,658 | 65,092 | |||||||||||||||
|
|
|
|
|
|
|
|
|
|
|
|||||||||||
| Total operating expenses |
5,183 | 2,806 | 12,988 | 11,636 | 9,668 | |||||||||||||||
|
|
|
|
|
|
|
|
|
|
|
|||||||||||
| Operating income |
7,115 | 5,488 | 47,728 | 19,022 | 55,424 | |||||||||||||||
|
|
|
|
|
|
|
|
|
|
|
|||||||||||
| Total other expense |
(31,046 | ) | (23,978 | ) | (33,110 | ) | (36,002 | ) | (28,829 | ) | ||||||||||
|
|
|
|
|
|
|
|
|
|
|
|||||||||||
| Net (loss) income before income tax |
(23,931 | ) | (18,490 | ) | 14,618 | (16,980 | ) | 26,595 | ||||||||||||
| Tax (benefit) provision |
(2,032 | ) | 294 | 4,546 | (3,604 | ) | 689 | |||||||||||||
|
|
|
|
|
|
|
|
|
|
|
|||||||||||
| Net (loss) income |
(21,899 | ) | (18,784 | ) | 10,072 | (13,376 | ) | 25,906 | ||||||||||||
| Net (loss) income attributable to noncontrolling interest |
(7,010 | ) | (3,579 | ) | (6,887 | ) | (7,089 | ) | 16,981 | |||||||||||
|
|
|
|
|
|
|
|
|
|
|
|||||||||||
| Net (loss) income attributable to controlling interest |
$ | (14,889 | ) | $ | (15,205 | ) | $ | 16,959 | $ | (6,287 | ) | $ | 8,925 | |||||||
|
|
|
|
|
|
|
|
|
|
|
|||||||||||
| Earnings per share information: |
||||||||||||||||||||
| Less Net income attributable to controlling interest prior to the IPO on October 2, 2013 |
(30,295 | ) | ||||||||||||||||||
|
|
|
|||||||||||||||||||
| Net loss attributable to controlling interest subsequent to the IPO |
$ | (13,336 | ) | |||||||||||||||||
|
|
|
|||||||||||||||||||
16
Table of Contents
| Three Months ended March 31, | Year ended December 31, | |||||||||||||||||||
| 2014 | 2013 | 2013 | 2012 | 2011 | ||||||||||||||||
| (U.S. dollars in thousands, except per share data, share data and operating data) |
||||||||||||||||||||
| Weighted average number of shares: |
||||||||||||||||||||
| Basic and diluted—Class A common stock |
35,533,166 | 35,448,056 | ||||||||||||||||||
| Basic and diluted—Class B common stock |
15,555,000 | 15,555,000 | ||||||||||||||||||
| Earnings per share for period subsequent to the IPO |
||||||||||||||||||||
| Class A common stock: |
||||||||||||||||||||
| Basic and diluted loss per share |
$ | (0.20 | ) | $ | (0.17 | ) | ||||||||||||||
|
|
|
|
|
|||||||||||||||||
| Class B common stock: |
||||||||||||||||||||
| Basic and diluted loss per share |
$ | (0.51 | ) | $ | (0.48 | ) | ||||||||||||||
|
|
|
|
|
|||||||||||||||||
| Unaudited pro forma net loss after tax: |
||||||||||||||||||||
| Net loss before income tax |
$ | (18,490 | ) | $ | (16,980 | ) | ||||||||||||||
| Pro forma tax provision |
279 | 818 | ||||||||||||||||||
|
|
|
|
|
|||||||||||||||||
| Pro forma net loss |
$ | (18,769 | ) | $ | (17,798 | ) | ||||||||||||||
|
|
|
|
|
|||||||||||||||||
| Other Financial Data: |
||||||||||||||||||||
| Adjusted EBITDA(1) |
$ | 37,194 | $ | 34,439 | $ | 141,769 | $ | 75,241 | $ | 77,258 | ||||||||||
| Cash available for distribution(2) |
$ | 17,844 | $ | 14,468 | $ | 42,621 | $ | 17,685 | $ | 18,530 | ||||||||||
| Cash available for distribution before principal payments(2) |
$ | 23,674 | $ | 20,699 | $ | 85,450 | $ | 45,231 | $ | 40,860 | ||||||||||
| Net cash provided by (used in) |
||||||||||||||||||||
| Operating activities |
$ | 16,405 | $ | 8,391 | $ | 78,152 | $ | 35,051 | $ | 46,930 | ||||||||||
| Investing activities |
$ | 1,366 | $ | (60,719 | ) | $ | 72,391 | $ | (638,953 | ) | $ | (340,977 | ) | |||||||
| Financing activities |
$ | (20,701 | ) | $ | 63,340 | $ | (63,401 | ) | $ | 573,167 | $ | 331,336 | ||||||||
| Operating Data: |
||||||||||||||||||||
| MWh sold(3) |
652,521 | 603,633 | 2,258,811 | 1,673,413 | 1,568,022 | |||||||||||||||
| Average realized electricity price ($/MWh)(4) |
$ | 87 | $ | 84 | $ | 84 | $ | 73 | $ | 75 | ||||||||||
| As of March 31, | As of December 31, | |||||||||||||||
| 2014 | 2013 | 2012 | 2011 | |||||||||||||
| (U.S. dollars in thousands) | ||||||||||||||||
| Balance Sheet Data: |
||||||||||||||||
| Cash |
$ | 100,343 | $ | 103,569 | $ | 17,574 | $ | 47,672 | ||||||||
| Construction in progress |
$ | — | $ | — | $ | 6,081 | $ | 201,245 | ||||||||
| Property, plant and equipment, net |
$ | 1,444,554 | $ | 1,476,142 | $ | 1,668,302 | $ | 784,859 | ||||||||
| Total assets |
$ | 1,834,950 | $ | 1,903,631 | $ | 2,035,730 | $ | 1,390,426 | ||||||||
| Long-term debt |
$ | 1,235,088 | $ | 1,249,218 | $ | 1,290,570 | $ | 867,548 | ||||||||
| Total liabilities |
$ | 1,313,460 | $ | 1,335,627 | $ | 1,446,318 | $ | 943,728 | ||||||||
| Total equity before noncontrolling interest |
$ | 428,612 | $ | 468,210 | $ | 514,111 | $ | 362,226 | ||||||||
| Noncontrolling interest |
$ | 92,878 | $ | 99,794 | $ | 75,301 | $ | 84,472 | ||||||||
| Total equity |
$ | 521,490 | $ | 568,004 | $ | 589,412 | $ | 446,698 | ||||||||
| (1) | Adjusted EBITDA represents net income before net interest expense, income taxes and depreciation and accretion, including our proportionate share of net interest expense, income taxes and depreciation and accretion for joint venture investments that are accounted for under the equity method. Adjusted EBITDA also excludes the effect of certain mark-to-market adjustments and infrequent items not related to normal or ongoing operations, such as early payment of debt and realized derivative gain or loss from refinancing transactions, and gain or loss related to acquisitions or divestitures. We disclose Adjusted EBITDA, which is a non-U.S. GAAP measure, because management believes this metric assists investors and analysts in comparing our operating performance across reporting periods on a consistent basis by excluding items that our management believes are not indicative of our core operating performance. We use Adjusted EBITDA to evaluate our operating performance. You should not consider Adjusted EBITDA as an alternative to net income (loss), determined in accordance with U.S. GAAP, or as an alternative to net cash provided by operating activities, determined in accordance with U.S. GAAP, as an indicator of our cash flows. |
Adjusted EBITDA has limitations as an analytical tool. Some of these limitations are:
| • | Adjusted EBITDA: |
| • | does not reflect our cash expenditures or future requirements for capital expenditures or contractual commitments; |
| • | does not reflect changes in, or cash requirements for, our working capital needs; |
17
Table of Contents
| • | does not reflect the significant interest expense, or the cash requirements necessary to service interest or principal payments, on our debt; |
| • | does not reflect our income tax expense or the cash requirement to pay our taxes; and |
| • | does not reflect the effect of certain mark-to-market adjustments and non-recurring items; |
| • | although depreciation and accretion are non-cash charges, the assets being depreciated and accreted will often have to be replaced in the future, and Adjusted EBITDA does not reflect any cash requirements for such replacements; and |
| • | other companies in our industry may calculate Adjusted EBITDA differently than we do, limiting its usefulness as a comparative measure. |
Because of these limitations, Adjusted EBITDA should not be considered in isolation or as a substitute for performance measures calculated in accordance with U.S. GAAP.
The most directly comparable U.S. GAAP measure to Adjusted EBITDA is net income (loss). The following table is a reconciliation of our net income (loss) to Adjusted EBITDA for the periods presented:
| Three Months ended March 31, | Year ended December 31, | |||||||||||||||||||
| 2014 | 2013 | 2013 | 2012 | 2011 | ||||||||||||||||
| (U.S. dollars in thousands, except per share data, share data and operating data) |
||||||||||||||||||||
| Net income (loss) |
$ | (21,899 | ) | $ | (18,784 | ) | $ | 10,072 | $ | (13,376 | ) | $ | 25,906 | |||||||
| Plus: |
||||||||||||||||||||
| Interest expense, net of interest income |
14,418 | 15,884 | 61,118 | 35,457 | 28,285 | |||||||||||||||
| Tax provision (benefit) |
(2,032 | ) | 294 | 4,546 | (3,604 | ) | 689 | |||||||||||||
| Depreciation and accretion |
21,177 | 22,566 | 83,180 | 49,027 | 39,424 | |||||||||||||||
|
|
|
|
|
|
|
|
|
|
|
|||||||||||
| EBITDA |
11,664 | 19,960 | 158,916 | 67,504 | 94,304 | |||||||||||||||
|
|
|
|
|
|
|
|
|
|
|
|||||||||||
| Unrealized loss (gain) on energy derivative |
7,733 | 6,803 | 11,272 | 6,951 | (17,577 | ) | ||||||||||||||
| Unrealized (gain) loss on interest rate derivatives |
3,723 | (1,931 | ) | (15,601 | ) | 4,953 | 345 | |||||||||||||
| Interest rate derivative settlements |
1,017 | — | 2,099 | — | — | |||||||||||||||
| Gain on transactions(a) |
— | — | (5,995 | ) | (4,173 | ) | — | |||||||||||||
| Plus: proportionate share from equity accounted investments: |
||||||||||||||||||||
| Interest expense, net of interest income |
253 | (2 | ) | 267 | 44 | — | ||||||||||||||
| Tax benefit |
— | (36 | ) | (172 | ) | (65 | ) | — | ||||||||||||
| Depreciation and accretion |
187 | 1 | 20 | — | 186 | |||||||||||||||
| Unrealized (gain) loss on interest rate and currency derivatives |
12,595 | 9,783 | (9,076 | ) | 27 | — | ||||||||||||||
| Realized (gain) loss on interest rate and currency derivatives |
22 | (139 | ) | 39 | — | — | ||||||||||||||
|
|
|
|
|
|
|
|
|
|
|
|||||||||||
| Adjusted EBITDA |
$ | 37,194 | $ | 34,439 | $ | 141,769 | $ | 75,241 | $ | 77,258 | ||||||||||
|
|
|
|
|
|
|
|
|
|
|
|||||||||||
| (a) | Represents transaction costs related to acquisitions and gain related to the sale of a portion of our investment in the El Arrayán project in 2012. |
| (2) | Cash available for distribution represents cash provided by (used in) operating activities as adjusted to (i) add or subtract changes in operating assets and liabilities, (ii) subtract net deposits into restricted cash accounts, which are required pursuant to the cash reserve requirements of financing agreements, to the extent they are paid from operating cash flows during a period, (iii) subtract cash distributions paid to noncontrolling interests, which currently reflects the cash distributions to our joint venture partners in our Gulf Wind project in accordance with the provisions of its governing partnership agreement and may in the future reflect distribution to other joint-venture partners, (iv) subtract scheduled project-level debt repayments in accordance with the related loan amortization schedule, to the extent they are paid from operating cash flows during a period, (v) subtract non-expansionary capital expenditures, to the extent they are paid from operating cash flows during a period, and (vi) add or subtract other items as necessary to present the cash flows we deem representative of our core business operations. Cash available for distribution before principal payments represents the sum of cash available for distribution and scheduled project-level debt repayments in accordance with the related loan amortization schedules, to the extent they are paid from operating cash flows during a period. |
We disclose cash available for distribution before principal payments and cash available for distribution because management recognizes that they will be used as supplemental measures by investors and analysts to evaluate our liquidity. However, cash available for distribution before principal payments and cash available for distribution have limitations as analytical tools because they exclude depreciation and accretion, do not capture the level of capital expenditures necessary to maintain the operating performance of our projects, are not reduced for principal payments on our project indebtedness except, with respect to cash available for distribution, to the extent they are paid from operating cash flows during a period, and exclude the effect of certain other cash flow items, all of which could have a material effect on our financial condition and results from operations. Cash available for distribution before principal payments
18
Table of Contents
and cash available for distribution are non-U.S. GAAP measures and should not be considered alternatives to net income, net cash provided by (used in) operating activities or any other liquidity measure determined in accordance with U.S. GAAP, nor are they indicative of funds available to fund our cash needs. In addition, our calculations of cash available for distribution before principal payments and cash available for distribution are not necessarily comparable to cash available for distribution before principal payments and cash available for distribution as calculated by other companies. Investors should not rely on these measures as a substitute for any U.S. GAAP measure, including net income (loss) and net cash provided by (used in) operating activities.
The most directly comparable U.S. GAAP measure to both cash available for distribution before principal payments and cash available for distribution is net cash provided by (used in) operating activities. The following table is a reconciliation of our net cash provided by (used in) operating activities to both cash available for distribution before principal payments and cash available for distribution for the periods presented:
| Three Months ended March 31, | Year ended December 31, | |||||||||||||||||||
| 2014 | 2013 | 2013 | 2012 | 2011 | ||||||||||||||||
| (U.S. dollars in thousands) | ||||||||||||||||||||
| Net cash provided by (used in) operating activities |
$ | 16,405 | $ | 8,391 | $ | 78,152 | $ | 35,051 | $ | 46,930 | ||||||||||
| Changes in current operating assets and liabilities |
6,651 | 12,695 | 8,237 | 6,885 | 3,237 | |||||||||||||||
| Network upgrade reimbursement(a) |
618 | — | 1,854 | 6,263 | — | |||||||||||||||
| Use of operating cash to fund maintenance and debt reserves |
— | — | — | (1,047 | ) | (1,048 | ) | |||||||||||||
| Release of restricted cash to fund general and administrative costs |
54 | — | 318 | — | — | |||||||||||||||
| Operations and maintenance capital expenditures |
(54 | ) | (219 | ) | (819 | ) | (623 | ) | (1,101 | ) | ||||||||||
| Less: |
||||||||||||||||||||
| Distributions to noncontrolling interests |
— | (168 | ) | (2,292 | ) | (1,298 | ) | (7,158 | ) | |||||||||||
|
|
|
|
|
|
|
|
|
|
|
|||||||||||
| Cash available for distribution before principal payments |
23,674 | 20,699 | 85,450 | 45,231 | 40,860 | |||||||||||||||
| Principal payments paid from operating cash flows |
(5,830 | ) | (6,231 | ) | (42,829 | ) | (27,546 | ) | (22,330 | ) | ||||||||||
|
|
|
|
|
|
|
|
|
|
|
|||||||||||
| Cash available for distribution |
$ | 17,844 | $ | 14,468 | $ | 42,621 | $ | 17,685 | $ | 18,530 | ||||||||||
|
|
|
|
|
|
|
|
|
|
|
|||||||||||
| (a) | During the construction of the Hatchet Ridge project, we funded the costs to construct interconnection facilities in order to connect to the utility’s power grid and we will be reimbursed from the utility for those costs during the years 2013 to 2015. We carry a network upgrade reimbursements receivable in prepaid expenses and other current assets and other assets on our balance sheet. |
| (3) | For any period presented, MWh sold represents the amount of electricity measured in MWh that our projects generated and sold. |
| (4) | For any period presented, average realized electricity price represents total revenue from electricity sales and energy derivative settlements divided by the aggregate number of MWh sold. |
19
Table of Contents
An investment in our shares involves a high degree of risk. You should carefully consider the following risks, together with other information provided to you in and incorporated by reference into this prospectus, in deciding whether to invest in our Class A shares. The selected risks presented below and the risks that are incorporated into this prospectus by reference to our 2013 Form 10-K are not our only risks, and additional risks and uncertainties that are not currently known to us or those we currently believe are immaterial may also materially adversely affect our business, financial condition, results of operations and liquidity. If any of the following risks, or those described in our 2013 Form 10-K, were to occur, our business, financial condition, results of operations and liquidity could be materially adversely affected. In that case, we might have to decrease, or may not be able to pay, dividends on our Class A shares, the trading price of our Class A shares could decline and you could lose all or part of your investment.
Risks Related to this Offering and Ownership of our Class A Shares
We are a holding company with no operations of our own, and we depend on our power projects for cash to fund all of our operations and expenses, including to make dividend payments.
Our operations are conducted entirely through our power projects and our ability to generate cash to meet our debt service obligations or to pay dividends is dependent on the earnings and the receipt of funds from our project subsidiaries through distributions or intercompany loans. Our power projects’ ability to generate adequate cash depends on a number of factors, including wind conditions, timely completion of our construction projects, the price of electricity, payments by key power purchasers, increased competition, foreign currency exchange rates, compliance with all applicable laws and regulations and other factors. See “Risk Factors—Risks Related to Our Projects” in our 2013 Form 10-K. Our ability to declare and pay regular quarterly cash dividends is subject to our obtaining sufficient cash distributions from our project subsidiaries after the payment of operating costs, debt service and other expenses. We may lack sufficient available cash to pay dividends to holders of our Class A shares due to shortfalls attributable to a number of operational, commercial or other factors, including insufficient cash flow generation by our projects, as well as unknown liabilities, the cost associated with governmental regulation, increases in our operating or general and administrative expenses, principal and interest payments on our and our subsidiaries’ outstanding debt, tax expenses, working capital requirements and anticipated cash needs.
Our cash available for distribution to holders of our Class A shares may be reduced as a result of restrictions on our subsidiaries’ cash distributions to us under the terms of their indebtedness.
We intend to declare and pay regular quarterly cash dividends on all of our outstanding Class A shares. However, in any period, our ability to pay dividends to holders of our Class A shares depends on the performance of our subsidiaries and their ability to distribute cash to us as well as all of the other factors discussed under “—Risks regarding our cash dividend policy.” The ability of our subsidiaries to make distributions to us may be restricted by, among other things, the provisions of existing and future indebtedness.
Restrictions on distributions to us by our subsidiaries under our revolving credit facility and the agreements governing their respective project-level debt could limit our ability to pay anticipated dividends to holders of our Class A shares. These agreements contain financial tests and covenants that our subsidiaries must satisfy prior to making distributions. If any of our subsidiaries is unable to satisfy these restrictions or is otherwise in default under such agreements, it would be prohibited from making distributions to us that could, in turn, limit our ability to pay dividends to holders of our Class A shares. The terms of our project-level indebtedness typically require commencement of commercial operations prior to our ability to receive cash distributions from a project. The terms of any such indebtedness also typically include cash management or similar provisions, pursuant to which revenues generated by projects subject to such indebtedness are immediately, or upon the occurrence of certain events, swept into an account for the benefit of the lenders under such debt agreements. As a result, project revenues typically only become available to us after the funding of reserve accounts for, among other
20
Table of Contents
things, debt service, taxes and insurance at the project level. In some instances, projects may be required to sweep cash to reserve funds intended to mitigate the results of pending litigation or other potentially adverse events. If our projects do not generate sufficient cash available for distribution, we may be required to fund dividends from working capital, borrowings under our revolving credit facility, proceeds from this and future offerings, the sale of assets or by obtaining other debt or equity financing, which may not be available, any of which could have a material adverse effect on the price of our Class A shares and on our ability to pay dividends at anticipated levels or at all. See “Management’s Discussion & Analysis of Financial Condition and Results of Operations—Description of Credit Agreements” in our 2013 Form 10-K.
Our ability to pay regular dividends on our Class A shares is subject to the discretion of our Board of Directors.
Our Class A shareholders have no contractual or other legal right to dividends. The payment of future dividends on our Class A shares will be at the discretion of our Board of Directors and will depend on, among other things, our earnings, financial condition, capital requirements, level of indebtedness, statutory and contractual restrictions applying to the payment of dividends and other considerations that our Board of Directors deems relevant. Our Board of Directors has the authority to establish cash reserves for the prudent conduct of our business, and the establishment of or increase in those reserves could result in a reduction in cash available for distribution to pay dividends on our Class A shares at anticipated levels. Accordingly, we may not be able to make, or may have to reduce or eliminate, the payment of dividends on our Class A shares, which could adversely affect the market price of our Class A shares.
Our cash dividend policy is subject to risks and uncertainties.
We do not have a sufficient operating history as an independent company upon which to rely in evaluating whether we will have sufficient cash available for distribution and other sources of liquidity to allow us to pay dividends on our Class A shares at our initial quarterly dividend level on an annualized basis. While we believe that we will have sufficient available cash to enable us to pay quarterly dividends on our Class A shares for the year ending December 31, 2014, we may be unable to pay the quarterly dividend or any amount on our Class A shares during this or any subsequent period. Holders of our Class A shares have no contractual or other legal right to receive cash dividends from us on a quarterly or other basis and, while we currently intend to maintain our initial dividend and to grow our business and increase our dividend per Class A share over time, our cash dividend policy is subject to all the risks inherent in our business and may be changed at any time. Some of the reasons for such uncertainties in our stated cash dividend policy include the following factors:
| • | Our $145 million revolving credit facility with a four-year term includes customary affirmative and negative covenants that will subject certain of our project subsidiaries to restrictions on making distributions to us. See “Management’s Discussion and Analysis of Financial Condition and Results of Operations—Description of Credit Agreements—Revolving Credit Facility” in our 2013 Form 10-K. Our subsidiaries are also subject to restrictions on distributions under the agreements governing their respective project-level debt. Additionally, we may incur debt in the future to acquire new power projects, the terms of which will likely require commencement of commercial operations prior to our ability to receive cash distributions from such acquired projects. These agreements likely will contain financial tests and covenants that our subsidiaries must satisfy prior to making distributions. The current financial tests and covenants applicable to our subsidiaries are described in “Management’s Discussion and Analysis of Financial Condition and Results of Operations—Description of Credit Agreements” in our 2013 Form 10-K. If any of our subsidiaries is unable to satisfy these restrictions or is otherwise in default under our financing agreements, it would be prohibited from making distributions to us, which could, in turn, limit our ability to pay dividends to holders of our Class A shares at our intended level or at all. |
| • | Our Board of Directors has the authority to establish cash reserves for the prudent conduct of our business, and the establishment of or increase in those reserves would reduce the cash available to pay our dividends. |
21
Table of Contents
| • | We may lack sufficient cash available for distribution to pay our dividends due to operational, commercial or other factors, some of which are outside of our control, including insufficient cash flow generation by our projects, as well as unexpected operating interruptions, insufficient wind resources, legal liabilities, the cost associated with governmental regulation, changes in governmental subsidies or regulations, increases in our operating or selling, general and administrative expenses, principal and interest payments on our and our subsidiaries’ outstanding debt, tax expenses, working capital requirements and anticipated cash reserve needs. |
Our ability to grow our cash available for distribution is substantially dependent on our ability to make acquisitions from Pattern Development or third parties on economically favorable terms.
Our goal of growing our cash available for distribution and increasing dividends to our Class A shareholders is substantially dependent on our ability to make and finance acquisitions on terms that result in an increase in cash available for distribution per Class A share. We have established a three-year targeted annual growth rate in our cash available for distribution per Class A share of 10% to 12%. To grow our cash available for distribution per Class A share through acquisitions, we must be able to acquire new generation assets, such as the Initial ROFO Projects, on economically favorable terms. If we are unable to make accretive acquisitions from Pattern Development or third parties because we are unable to identify attractive acquisition opportunities, negotiate acceptable purchase contracts, obtain financing on economically acceptable terms (as a result of the then current market value of our Class A shares or otherwise) or are outbid by competitors, we may not be able to realize our targeted growth in cash available for distribution per Class A share.
We are an emerging growth company, and we cannot be certain if the reduced reporting requirements applicable to emerging growth companies will make our Class A shares less attractive to investors.
We are an emerging growth company. For as long as we are an emerging growth company, we may take advantage of exemptions from various reporting requirements that are applicable to other public companies that are not emerging growth companies, including not being required to comply with the auditor attestation requirements of Section 404 of the Sarbanes-Oxley Act of 2002, or the “Sarbanes-Oxley Act,” certain reduced disclosure obligations regarding executive compensation in our periodic reports and proxy statements and exemptions from the requirements of holding a non-binding advisory vote on executive compensation and shareholder approval of any golden parachute payments not previously approved. We could be an emerging growth company for up to five years, although circumstances could cause us to lose that status earlier, including if the market value of our shares held by non-affiliates exceeds $700 million as of any June 30 before that time, in which case we would no longer be an emerging growth company as of the following December 31. We cannot predict if investors will find our Class A shares less attractive because we may rely on these exemptions. If some investors find our Class A shares less attractive as a result, there may be a less active trading market for our Class A shares and our Class A share price may be more volatile.
Under the JOBS Act, emerging growth companies can also delay adopting new or revised accounting standards until such standards apply to private companies. In addition, Section 107 of the JOBS Act also provides that an emerging growth company can take advantage of the extended transition period provided in Section 7(a)(2)(B) of the U.S. Securities Act of 1933, or the “U.S. Securities Act,” for complying with new or revised accounting standards that have different effective dates for public and private companies. In other words, an emerging growth company can delay the adoption of such accounting standards until the first to occur of the date the subject company (i) is no longer an emerging growth company or (ii) affirmatively and irrevocably opt outs of the extended transition period provided in U.S. Securities Act Section 7(a)(2)(B). We have elected to take advantage of the extended transition period provided in Section 7(a)(2)(B) of the U.S. Securities Act for complying with new or revised accounting standards that have different effective dates for public and private companies and, as a result, our financial statements may not be comparable to the financial statements of other public companies. In addition, we have availed ourselves of the exemption from disclosing certain executive compensation information in this prospectus pursuant to Title 1, Section 102 of the JOBS Act. We cannot predict if investors will find our Class A shares less attractive because we will rely on these exemptions. If some investors find our Class A shares less attractive as a result, there may be a less active trading market for our Class A shares and our Class A share price may be more volatile.
22
Table of Contents
We are an SEC foreign issuer under Canadian securities laws and, therefore, are exempt from certain requirements of Canadian securities laws applicable to other Canadian reporting issuers.
Although we are a reporting issuer in Canada, we are an SEC foreign issuer under Canadian securities laws and are exempt from certain Canadian securities laws relating to continuous disclosure obligations and proxy solicitation if we comply with certain reporting requirements applicable in the United States, provided that the relevant documents filed with the SEC are filed in Canada and sent to our Class A shareholders in Canada to the extent and in the manner and within the time required by applicable U.S. requirements. In some cases the disclosure obligations applicable in the United States are different or less onerous than the comparable disclosure requirements applicable in Canada for a Canadian reporting issuer that is not exempt from Canadian disclosure obligations. Therefore, there may be less or different publicly available information about us than would be available if we were a Canadian reporting issuer that is not exempt from such Canadian disclosure obligations.
Pattern Development’s general partner and its officers and directors have fiduciary or other obligations to act in the best interests of Pattern Development’s owners, which could result in a conflict of interest with us and our shareholders.
Pattern Development or its affiliates hold approximately 47.22% of our outstanding Class A shares and 99.1% of our outstanding B shares. Upon completion of this offering, Pattern Development or its affiliates will hold approximately 27.46% of our outstanding Class A shares and 99.1% of our outstanding Class B shares (or 22.55% and 99.1%, respectively, if the underwriters exercise their overallotment option in full), representing in the aggregate an approximate 45.17% voting interest in our company (or 41.48% if the underwriters exercise their overallotment option in full). The remaining 0.9% of our outstanding Class B shares are held by members of our management. Until the Conversion Event, neither Pattern Development nor the management holders of our Class B shares will be entitled to receive any dividends on their Class B shares. We are party to the Management Services Agreement, pursuant to which each of our executive officers (including our Chief Executive Officer), with the exception of our Chief Financial Officer and Senior Vice President, Operations, are also shared PEG executives and devote their time to both our company and Pattern Development as needed to conduct our respective businesses. As a result, these shared PEG executives have fiduciary and other duties to Pattern Development. Conflicts of interest may arise in the future between our company (including our shareholders other than Pattern Development) and Pattern Development (and its owners and affiliates). Our directors and executive officers owe fiduciary duties to the holders of our shares. However, Pattern Development’s general partner and certain of its officers and directors also have a fiduciary duty to act in the best interest of Pattern Development’s limited partners, which interest may differ from or conflict with that of our company and our other shareholders.
Pattern Development’s share ownership limits other shareholders’ ability to influence corporate matters.
Pattern Development or its affiliates hold approximately 62.95% of the combined voting power of our shares. Following this offering Pattern Development or its affiliates will hold approximately 41.48% of the combined voting power of our shares if the underwriters exercise their overallotment option in full, and this concentration of voting power limits other shareholders’ ability to influence corporate matters, and as a result, actions may be taken that shareholders other than Pattern Development may not view as beneficial. As a result of its ownership in our company, Pattern Development will continue to have significant influence over all matters that require approval by our shareholders, including the election of directors. As a result, Pattern Development or its affiliates have the ability to exercise substantial influence over our company, including with respect to decisions relating to our capital structure, issuing additional Class A shares or other equity securities, paying dividends on our Class A shares, incurring additional debt, making acquisitions, selling properties or other assets, merging with other companies and undertaking other extraordinary transactions. In any of these matters, the interests of Pattern Development and its affiliates may differ from or conflict with the interests of our other shareholders. Pursuant to the Shareholder Agreement, for so long as Pattern Development beneficially owns at least 33 1/3% of our shares, Pattern Development’s consent will be necessary for us to take certain material corporate actions. Pattern Development may withhold its consent, which could adversely affect our business. See “Certain Relationships and Related Party Transactions—Share Ownership—Shareholder Agreement” in our 2014 Proxy Statement.
23
Table of Contents
Certain of our executive officers have an economic interest in, as well as provide services to, Pattern Development, which could result in conflicts of interest.
Certain of our executive officers provide services to Pattern Development pursuant to the terms of the Management Services Agreement between our company and Pattern Development and, as a result, in some instances, have fiduciary or other obligations to Pattern Development. Additionally, our Chief Executive Officer, Executive Vice President, Business Development, Executive Vice President and General Counsel, Senior Vice President, Fiscal and Administrative Services and Senior Vice President, Engineering and Construction have economic interests in Pattern Development and, accordingly, the benefit to Pattern Development from a transaction between Pattern Development and our company will proportionately inure to their benefit as holders of economic interests in Pattern Development. Pattern Development is a related party under the applicable securities laws governing related party transactions and, as a result, any material transaction between our company and Pattern Development (except the occurrence of the reintegration event) will be subject to our corporate governance guidelines, which requires prior review of any such transaction by the conflicts committee, which is comprised solely of independent members of our Board of Directors, and a recommendation to the full Board of Directors in respect of such transaction. Those of our executive officers who have economic interests in Pattern Development may be conflicted when advising the conflicts committee or otherwise participating in the negotiation or approval of such transactions. These executive officers have significant project- and industry-specific expertise that could prove beneficial to the conflicts committee’s decision-making process and the absence of such strategic guidance could have a material adverse effect on our company’s ability to evaluate any such transaction and, in turn, on our business, financial condition and results of operations.
Riverstone is under no obligation to offer us an opportunity to participate in any business opportunities that it may consider from time to time, including those in the energy industry, and, as a result, Riverstone’s existing and future portfolio companies may compete with us for investment or business opportunities.
Conflicts of interest could arise in the future between us, on the one hand, and Riverstone, including its portfolio companies, on the other hand, concerning among other things, potential competitive business activities or business opportunities. Riverstone is a private equity firm in the business of making investments in entities primarily in the energy industry. As a result, Riverstone’s existing and future portfolio companies (other than Pattern Development, which will be subject to the Non-Competition Agreement) may compete with us for investment or business opportunities. These conflicts of interest may not be resolved in our favor.
Subject to the terms of the Non-Competition Agreement with, and our Purchase Rights granted to us by, Pattern Development (see “Certain Relationships and Related Party Transactions” in our 2014 Proxy Statement), we have expressly renounced any interest or expectancy in, or in being offered an opportunity to participate in, any business opportunity that may be from time to time presented to Riverstone or any of its officers, directors, agents, shareholders, members or partners or business opportunities that such parties participate in or desire to participate in, even if the opportunity is one that we might reasonably have pursued or had the ability or desire to pursue if granted the opportunity to do so, and no such person shall be liable to us for breach of any fiduciary or other duty, as a director or officer or controlling shareholder or otherwise, by reason of the fact that such person pursues or acquires any such business opportunity, directs any such business opportunity to another person or fails to present any such business opportunity, or information regarding any such business opportunity, to us unless, in the case of any such person who is our director or officer, any such business opportunity is expressly offered to such director or officer solely in his or her capacity as our director or officer. Riverstone has advised us that it does not have a formal policy regarding business opportunities presented to the investment funds managed or advised by it and their respective portfolio companies, but Riverstone’s practice has been that any business opportunities may be pursued by any such fund or directed to any such portfolio company except when the business opportunity has been presented to an employee of Riverstone or its affiliates solely in his or her capacity as a director of a portfolio company.
As a result, Riverstone may become aware, from time to time, of certain business opportunities, such as acquisition opportunities, and may direct such opportunities to other businesses in which it has invested, in which
24
Table of Contents
case we may not become aware of or otherwise have the ability to pursue such opportunities. Further, such businesses may choose to compete with us for these opportunities. As a result, our renouncing our interest and expectancy in any business opportunity that may be from time to time presented to Riverstone could adversely impact our business or prospects if attractive business opportunities are procured by such parties for their own benefit rather than for ours. See “Description of Capital Stock—Corporate Opportunity.”
Our actual or perceived failure to deal appropriately with conflicts of interest with Pattern Development could damage our reputation, increase our exposure to potential litigation and have a material adverse effect on our business, financial condition and results of operations.
Our conflicts committee is required to review, and make recommendations to the full Board of Directors regarding, any future transactions involving the acquisition of an asset or investment in an opportunity offered to us by Pattern Development to determine whether the offer is fair and reasonable (including any acquisitions by us of assets of Pattern Development pursuant to our Purchase Rights). However, our establishment of a conflicts committee may not prevent holders of our shares from filing derivative claims against us related to these conflicts of interest and related party transactions. Regardless of the merits of their claims, we may be required to expend significant management time and financial resources on the defense of such claims. Additionally, to the extent we fail to appropriately deal with any such conflicts, it could negatively impact our reputation and ability to raise additional funds and the willingness of counterparties to do business with us, all of which could have a material adverse effect on our business, financial condition and results of operations.
Market interest and foreign exchange rates may have an effect on the value of our Class A shares.
One of the factors that influences the price of our Class A shares is the effective dividend yield of our Class A shares (i.e., the yield as a percentage of the market price of our Class A shares) relative to market interest rates. An increase in market interest rates, which are currently at low levels relative to historical rates, may lead prospective purchasers of our Class A shares to expect a higher dividend yield and, our inability to increase our dividend as a result of an increase in borrowing costs, insufficient cash available for distribution or otherwise, could result in selling pressure on, and a decrease in the market price of, our Class A shares as investors seek alternative investments with higher yield. Additionally, we pay quarterly dividends in U.S. dollars, and to the extent the value of the U.S. dollar decreases relative to Canadian dollars, the market price of our Class A shares in Canada could decrease.
The price of our Class A shares may fluctuate significantly, and you could lose all or part of your investment.
Volatility in the market price of our shares may prevent you from being able to sell your Class A shares at or above the price you paid for your shares. The market price of our Class A shares could fluctuate significantly for various reasons, including:
| • | our operating and financial performance and prospects; |
| • | our quarterly or annual results of operations or those of other companies in our industry; |
| • | a change in interest rates or changes in currency exchange rates; |
| • | the public’s reaction to our press releases, our other public announcements and our filings with the Canadian securities regulators and the SEC; |
| • | changes in, or failure to meet, earnings estimates or recommendations by research analysts who track our Class A shares or the stock of other companies in our industry; |
| • | the failure of research analysts to cover our Class A shares; |
| • | strategic actions by us, our power purchasers or our competitors, such as acquisitions or restructurings; |
| • | new laws or regulations or new interpretations of existing laws or regulations applicable to our business; |
| • | changes in accounting standards, policies, guidance, interpretations or principles; |
| • | material litigation or government investigations; |
| • | changes in applicable tax laws; |
25
Table of Contents
| • | changes in general conditions in the United States, Canadian and global economies or financial markets, including those resulting from war, incidents of terrorism or responses to such events; |
| • | changes in key personnel; |
| • | sales of Class A shares by us or members of our management team; |
| • | termination of lock-up agreements with our management team and principal shareholders; |
| • | the granting or exercise of employee stock options; |
| • | volume of trading in our Class A shares; and |
| • | the realization of any risks described under “Risk Factors” included herein or in our 2013 Form 10-K. |
In addition, volatility in the stock markets has had a significant impact on the market price of securities issued by many companies, including companies in our industry. The changes frequently appear to occur without regard to the operating performance of the affected companies. Hence, the price of our Class A shares could fluctuate based upon factors that have little or nothing to do with our company, and these fluctuations could materially reduce the share price of our Class A shares and cause you to lose all or part of your investment. Further, in the past, market fluctuations and price declines in a company’s stock have led to securities class action litigation. If such a suit were to arise, it could have a substantial cost and divert our resources regardless of the outcome.
If we fail to maintain proper and effective internal controls, our ability to produce accurate and timely financial statements could be impaired and investors’ views of us could be harmed.
U.S. securities laws require, among other things, that we maintain effective internal control over financial reporting and disclosure controls and procedures. In particular, once we are no longer an emerging growth company as defined in the JOBS Act, we must perform system and process evaluation and testing of our internal control over financial reporting to allow management to report on the effectiveness of our internal control over financial reporting, as required by Section 404 of the Sarbanes-Oxley Act. If we are not able to comply with these requirements in a timely manner, or if we identify deficiencies in our internal control over financial reporting that are deemed to be material weaknesses, the market price of our shares could decline and we could be subject to sanctions or investigations by the stock exchanges on which we list, the SEC, the Canadian Securities Administrators or other regulatory authorities, which would require additional financial and management resources. However, for as long as we remain an emerging growth company, we intend to take advantage of certain exemptions from various reporting requirements that are applicable to other public companies that are not emerging growth companies including, but not limited to, not being required to comply with the auditor attestation requirements of Section 404 of the Sarbanes-Oxley Act. We may take advantage of these reporting exemptions until we are no longer an emerging growth company. We will remain an emerging growth company for up to five years from the time of our initial public offering, although if the market value of our shares that is held by non-affiliates exceeds $700 million as of any June 30 before that time, we would cease to be an emerging growth company as of the following December 31.
Our ability to successfully implement our business plan and comply with Section 404 of the Sarbanes-Oxley Act requires us to be able to prepare timely and accurate financial statements. Any delay in the implementation of, or disruption in the transition to, new or enhanced systems, procedures or controls, may cause our operations to suffer and we may be unable to conclude that our internal control over financial reporting is effective as required under Section 404 of the Sarbanes-Oxley Act. Moreover, we cannot be certain that these measures would ensure that we implement and maintain adequate controls over our financial processes and reporting in the future. Even if we were to conclude that our internal control over financial reporting provided reasonable assurance regarding the reliability of financial reporting and the preparation of financial statements for external purposes in accordance with U.S. GAAP, because of its inherent limitations, internal control over financial reporting may not prevent or detect fraud or misstatements. This, in turn, could have an adverse impact on trading prices for our Class A shares, and could adversely affect our ability to access the capital markets.
26
Table of Contents
We incur increased costs and demands upon management as a result of complying with the laws and regulations affecting public companies, which could harm our operating results, and such costs may increase when we cease to be an emerging growth company.
As a public company, we incur significant legal, accounting, investor relations and other expenses that we did not incur as a private company, including costs associated with public company reporting requirements. We also have incurred and will continue to incur costs associated with current corporate governance requirements, Section 404 and other provisions of the Sarbanes-Oxley Act and the Dodd-Frank Act of 2010, as well as rules implemented by the SEC, the Canadian Securities Administrators and the stock exchanges on which our Class A shares are traded.
Such costs may increase when we cease to be an emerging growth company. For as long as we remain an emerging growth company, we may take advantage of certain exemptions from various reporting requirements that are applicable to other public companies that are not emerging growth companies including, but not limited to, not being required to comply with the auditor attestation requirements of Section 404 of the Sarbanes-Oxley Act, reduced disclosure obligations regarding executive compensation in our periodic reports and proxy statements, and exemptions from the requirements of holding a non-binding advisory vote on executive compensation and shareholder approval of any golden parachute payments not previously approved. We may take advantage of these reporting exemptions until we are no longer an emerging growth company. We will remain an emerging growth company for up to five years unless we no longer qualify for such status prior to that time. We would cease to be an emerging growth company if we have more than $1.0 billion in annual revenues, have more than $700 million in market value of our shares held by non-affiliates or issue more than $1.0 billion of non-convertible debt over a three-year period. If the market value of our shares that is held by non-affiliates exceeds $700 million as of any June 30, before that time, we would cease to be an emerging growth company as of the following December 31. After we are no longer an emerging growth company, we expect to incur additional expenses and devote substantial management effort toward ensuring compliance with those requirements applicable to companies that are not emerging growth companies.
The expenses incurred by public companies for reporting and corporate governance purposes have increased dramatically over the past several years. These rules and regulations have increased our legal and financial compliance costs substantially and has made some activities more time consuming and costly. We are currently unable to estimate these costs with a high degree of certainty. Greater expenditures may be necessary in the future with the advent of new laws and regulations pertaining to public companies. If we are not able to comply with these requirements in a timely manner, the market price of our Class A shares could decline and we could be subject to sanctions or investigations by the SEC, the Canadian Securities Administrators, the applicable stock exchanges or other regulatory authorities, which would require additional financial and management resources.
As a result of the FPA and FERC’s regulations in respect of transfers of control, absent prior authorization by FERC, neither we nor Pattern Development can convey to an investor, nor will an investor in our company generally be permitted to obtain, a direct and/or indirect voting interest in 10% or more of our issued and outstanding voting securities, and a violation of this limitation could result in civil or criminal penalties under the FPA and possible further sanctions imposed by FERC under the FPA.
We are a holding company with U.S. operating subsidiaries that are “public utilities” (as defined in the FPA) and, therefore, subject to FERC’s jurisdiction under the FPA. As a result, the FPA requires us or Pattern Development, as the case may be, either to (i) obtain prior authorization from FERC to transfer an amount of our voting securities sufficient to convey direct or indirect control over any of our public utility subsidiaries or (ii) qualify for a blanket authorization granted under or an exemption from FERC’s regulations in respect of transfers of control. Similar restrictions apply to purchasers of our voting securities who are a “holding company” under the Public Utility Holding Company Act of 2005, or “PUHCA,” in a holding company system that includes a transmitting utility or an electric utility, or an “electric holding company,” regardless of whether our voting securities were purchased in our initial public offering, subsequent offerings by us or Pattern Development, in open market transactions or otherwise. A purchaser of our voting securities would be a “holding
27
Table of Contents
company” under the PUHCA and an electric holding company if the purchaser acquired direct or indirect control over 10% or more of our voting securities or if FERC otherwise determined that the purchaser could directly or indirectly exercise control over our management or policies (e.g., as a result of contractual board or approval rights). Under the PUHCA, a “public-utility company” is defined to include an “electric utility company,” which is any company that owns or operates facilities used for the generation, transmission or distribution of electric energy for sale, and which includes EWGs such as our U.S. operating subsidiaries. Accordingly, absent prior authorization by FERC or a general increase to the applicable percentage ownership under a blanket authorization, for the purposes of sell-side transactions by us or Pattern Development and buy-side transactions involving purchasers of our securities that are electric holding companies, no purchaser can acquire 10% or more of our issued and outstanding voting securities. A violation of these regulations by us or Pattern Development, as sellers, or an investor, as a purchaser of our securities, could subject the party in violation to civil or criminal penalties under the FPA, including civil penalties of up to $1 million per day per violation and other possible sanctions imposed by FERC under the FPA.
As a result of the FPA and FERC’s regulations in respect of transfers of control, and consistent with the requirements for blanket authorizations granted thereunder or exemptions therefrom, absent prior authorization by FERC, no purchaser of our common shares in this offering, the open market, or subsequent offerings of our voting securities, will be permitted to purchase an amount of our securities that would cause such purchaser and its affiliate and associate companies to collectively hold 10% or more of our voting securities outstanding on a post-offering basis. Additionally, purchasers in this offering should manage their investment in us in a manner consistent with FERC’s regulations in respect of obtaining direct or indirect “control” of our company. Accordingly, absent prior authorization by FERC, investors in our common shares that are electric holding companies are advised not to acquire a direct and/or indirect voting interest in 10% or more of our issued and outstanding voting securities, whether in connection with an offering by us or Pattern Development, open market purchases or otherwise.
Provisions of our organizational documents and Delaware law might discourage, delay or prevent a change of control of our company or changes in our management and, as a result, depress the trading price of our Class A shares.
Our amended and restated certificate of incorporation and amended and restated bylaws contain provisions that could discourage, delay or prevent a change in control of our company or changes in our management that the shareholders of our company may deem advantageous. These provisions:
| • | authorize the issuance of blank check preferred stock that our Board of Directors could issue to increase the number of outstanding shares and to discourage a takeover attempt; |
| • | prohibit our shareholders from calling a special meeting of shareholders if Pattern Development and its affiliates (other than our company) collectively cease to own more than 50% of our shares; |
| • | prohibit shareholder action by written consent, which requires all shareholder actions to be taken at a meeting of our shareholders if Pattern Development and its affiliates (other than our company) collectively cease to own more than 50% of our shares; |
| • | provide that the Board of Directors is expressly authorized to adopt, or to alter or repeal our bylaws; and |
| • | establish advance notice requirements for nominations for election to our Board of Directors or for proposing matters that can be acted upon by shareholders at shareholder meetings. |
These anti-takeover defenses could discourage, delay or prevent a transaction involving a change in control of our company. These provisions could also discourage proxy contests and make it more difficult for you and other shareholders to elect directors of your choosing and cause us to take corporate actions other than those you desire. See “Description of Capital Stock.”
28
Table of Contents
Future sales of our shares in the public market could lower our Class A share price, and any additional capital raised by us through the sale of equity or convertible debt securities may dilute shareholders’ ownership in us and may adversely affect the market price of our Class A shares.
If we sell, or if Pattern Development sells, a large number of our Class A shares, or if we issue a large number of shares of our Class A common stock in connection with future acquisitions, financings, or other circumstances, the market price of our Class A shares could decline significantly. Moreover, the perception in the public market that we or Pattern Development might sell Class A shares could depress the market price of those shares. We, our officers and directors and the selling stockholders will enter into lock-up agreements in connection with this offering that will restrict transfers for a period of 90 days, subject to certain exceptions and to compliance with the applicable requirements under Rule 144 of the U.S. Securities Act. In addition, Pattern Development expects to enter into a loan agreement pursuant to which it may pledge up to 18,700,000 Class A shares upon completion of this offering to secure an approximately $100 million loan. If Pattern Development were to default on its obligations under the loan, the lenders, upon the expiration of the lock-up agreements between our current shareholders and the underwriters described in “Underwriting,” would have the right to sell shares to satisfy Pattern Development’s obligation. Such an event could cause our stock price to decline.
We cannot predict the size of future issuances of our Class A shares or the effect, if any, that future issuances or sales of our shares will have on the market price of our shares. Sales of substantial amounts of our shares (including sales pursuant to Pattern Development’s registration rights and shares issued in connection with an acquisition), or the perception that such sales could occur, may adversely affect prevailing market prices for our Class A shares. See “Certain Relationships and Related Party Transactions” in our 2014 Proxy Statement and “Shares Eligible for Future Sale.”
29
Table of Contents
This prospectus contains forward-looking statements. All statements other than statements of historical fact included in this prospectus are forward-looking statements. The words “believe,” “expect,” “anticipate,” “intend,” “estimate” and other expressions that are predictions of or indicate future events and trends and that do not relate to historical matters identify forward-looking statements. You should not place undue reliance on these forward-looking statements. Although forward-looking statements reflect management’s good faith beliefs, reliance should not be placed on forward-looking statements because they involve known and unknown risks, uncertainties and other factors, which may cause the actual results, performance or achievements to differ materially from anticipated future results, performance or achievements expressed or implied by such forward-looking statements. Forward-looking statements in this prospectus speak only as of the date of this prospectus. We undertake no obligation to publicly update or revise any forward-looking statement, whether as a result of new information, future events, changed circumstances or otherwise. These forward-looking statements are subject to numerous risks and uncertainties, including, but not limited to:
| • | our ability to complete construction of our construction projects and transition them into financially successful operating projects; |
| • | our ability to complete the acquisition of power projects; |
| • | fluctuations in supply, demand, prices and other conditions for electricity, other commodities and RECs; |
| • | our electricity generation, our projections thereof and factors affecting production, including wind and other conditions, other weather conditions, availability and curtailment; |
| • | changes in law, including applicable tax laws; |
| • | public response to and changes in the local, state, provincial and federal regulatory framework affecting renewable energy projects, including the potential expiration or extension of the U.S. federal PTC, ITC, and the related U.S. Treasury grants and potential reductions in RPS requirements; |
| • | the ability of our counterparties to satisfy their financial commitments or business obligations; |
| • | the availability of financing, including tax equity financing, for our wind power projects; |
| • | an increase in interest rates; |
| • | our substantial short-term and long-term indebtedness, including additional debt in the future; |
| • | competition from other power project developers; |
| • | our expectations regarding the time during which we will be an emerging growth company under the JOBS Act; |
| • | development constraints, including the availability of interconnection and transmission; |
| • | potential environmental liabilities and the cost and conditions of compliance with applicable environmental laws and regulations; |
| • | our ability to operate our business efficiently, manage capital expenditures and costs effectively and generate cash flow; |
| • | our ability to retain and attract executive officers and key employees; |
| • | our ability to keep pace with and take advantage of new technologies; |
| • | the effects of litigation, including administrative and other proceedings or investigations, relating to our wind power projects under construction and those in operation; |
| • | conditions in energy markets as well as financial markets generally, which will be affected by interest rates, currency exchange rate fluctuations and general economic conditions; |
30
Table of Contents
| • | the effective life and cost of maintenance of our wind turbines and other equipment; |
| • | the increased costs of, and tariffs on, spare parts; |
| • | scarcity of necessary equipment; |
| • | negative public or community response to wind power projects; |
| • | the value of collateral in the event of liquidation; and |
| • | other factors discussed under “Risk Factors.” |
We derive many of our forward-looking statements from our operating budgets and forecasts, which are based upon many detailed assumptions, including industry data referenced elsewhere or incorporated by reference in this prospectus. While we believe our assumptions are reasonable, we caution that it is very difficult to predict the impact of known factors, and it is impossible for us to anticipate all factors that could affect our actual results. Important factors that could cause actual results to differ materially from our expectations are disclosed under “Risk Factors,” “Management’s Discussion and Analysis of Financial Condition and Results of Operations” and “Item 5. Market for Registrant’s Common Equity and Related Stockholder Matters—Cash Dividend Policy” included or incorporated by reference herein. All written and oral forward-looking statements attributable to us, or persons acting on our behalf, are expressly qualified in their entirety by the cautionary statements in this prospectus as well as other cautionary statements that are made from time to time in our other filings with the SEC and applicable Canadian securities regulatory authorities or public communications. You should evaluate all forward-looking statements made in this prospectus in the context of these risks and uncertainties.
We caution you that the important factors referenced above may not contain all of the factors that are important to you. In addition, we cannot assure you that we will realize the results or developments we expect or anticipate or, even if those results or developments are substantially realized, that they will result in the consequences we anticipate or affect us or our operations in the way we expect.
31
Table of Contents
Excluding the offering by the selling shareholder from which we will not receive any of the proceeds, we estimate the net proceeds to us from this offering will be approximately $287.3 million, based on the offering price of $25.84 per Class A share, which is the last reported sale price of our Class A common stock on the NASDAQ Global Market as set forth on the cover page of this prospectus and after deducting underwriting commissions and estimated offering expenses payable by us.
We intend to use the net proceeds from this offering for working capital and general corporate purposes, including the acquisition of the Panhandle 1 project and potentially including any of a number of third party acquisition opportunities which we are considering, or Panhandle 2 if we have not earlier used such proceeds. We have agreed to pay a cash purchase price of $125 million, subject to certain adjustments, to Pattern Development in connection with the acquisition of the Panhandle 1 project which we expect to complete shortly after the commencement of its commercial operations, which we expect to occur in June 2014. In addition, we have bid on, or are in discussions with respect to, several possible third party acquisitions that, should we be successful in their pursuit, could require the use of a portion of the proceeds of this offering. While we do not have any binding agreements for any such acquisitions, and we may not reach agreement with respect to any of these potential acquisitions, we are in advanced discussions regarding potential acquisitions of certain wind power projects that in the aggregate could exceed 500 MW. To the extent that the aggregate value of any agreed purchase prices for such acquisitions exceeds the funds available to us, we are evaluating various forms of financing that we believe would be required in order to complete such a transaction, which may include, among others, bridge financing, capital markets transactions, or both. We do not have any commitments for any such financing, and there can be no assurance that it will be available on acceptable terms or at all. The terms of any such bridge financing could limit our operational flexibility or, upon an event of default, our ability to pay dividends and the issuance of any additional equity securities could have an adverse effect on the price of our Class A common stock.
The underwriters may also purchase up to an additional 2,321,981 Class A shares from the selling shareholder at the public offering price, less the underwriting commissions, within 30 days from the closing date of this offering to cover overallotments, if any. We estimate that the net proceeds to the selling shareholder will be approximately $154 million, based on an assumed public offering price of $25.84 per Class A share, which is the last reported sale price of our Class A common stock on the NASDAQ Global Market as set forth on the cover page of this prospectus, after deducting underwriting commissions and assuming the exercise in full of the underwriters’ overallotment option. We will not receive any proceeds from the exercise of the underwriters’ overallotment option. The selling shareholder will pay the underwriters’ commissions and the expenses of the offering applicable to the sale of shares pursuant to the exercise of the underwriters’ overallotment option.
Upon completion of this offering, Pattern Development will hold approximately 27.46% of our outstanding Class A shares and 99.1% of our outstanding Class B shares (or 22.55% and 99.1%, respectively, if the underwriters exercise their overallotment option in full), representing in the aggregate an approximate 45.17% voting interest in our company (or 41.48% if the underwriters exercise their overallotment option in full). The remaining 0.9% of our outstanding Class B shares will be held by members of our management. Until the Conversion Event, neither Pattern Development nor the management holders of our Class B shares will be entitled to receive any dividends on their Class B shares.
Each $1.00 increase (decrease) in the assumed public offering price would increase (decrease) the net proceeds to us by approximately $11 million, after deducting underwriting commissions and estimated offering expenses payable by us, assuming the number of Class A shares offered by us, as set forth on the cover page of this prospectus, remains the same.
Certain of our executive officers have an economic interest in Pattern Development and, as a result, to the extent that a portion of the proceeds of this offering are used to acquire Panhandle 1 or Panhandle 2 projects from Pattern Development, these individuals will have an interest in that portion of the proceeds from this offering in proportion to their respective economic interest in Pattern Development. See “Certain Relationships and Related Party Transactions” in the 2014 Proxy Statement.
32
Table of Contents
The following table sets forth the cash and cash equivalents and the capitalization as of March 31, 2014 on (i) a historical basis from our consolidated financial statements; (ii) a pro forma basis to reflect the acquisitions of the Panhandle 1 and Panhandle 2 projects and other pro forma adjustments and assumptions set forth in the pro forma financial information incorporated by reference herein as if each had occurred on such date; and (iii) as further adjusted to give effect to this offering and the use of the proceeds therefrom as set forth under “Use of Proceeds.”
We derived this table from, and it should be read in conjunction with and is qualified in its entirety by reference to, our historical consolidated financial statements and the notes thereto, as well as the historical financial statements of Panhandle Wind Holdings LLC and Panhandle B Member 2 LLC and the pro forma financial information relating to the acquisitions of the Panhandle 1 and Panhandle 2 projects, included elsewhere or incorporated by reference in this prospectus. You should also read this table in conjunction with “Structure and Formation of Our Company,” “Use of Proceeds,” “Selected Historical Consolidated Financial Data,” and “Management’s Discussion and Analysis of Financial Condition and Results of Operations.”
| As of March 31, 2014 | ||||||||||||
| Historical | Pro forma | Pro forma as Adjusted |
||||||||||
| (U.S. dollars in thousands, except share data) |
||||||||||||
| Cash and cash equivalents |
$ | 100,343 | $ | $ | ||||||||
|
|
|
|
|
|
|
|||||||
| Long-term debt |
$ | 1,186,473 | $ | $ | ||||||||
| Current portion of long term debt |
48,615 | |||||||||||
| Revolving credit facility |
— | |||||||||||
| Total stockholders’ equity: |
— | |||||||||||
| Class A common stock, $0.01 par value per share: |
— | |||||||||||
| 500,000,000 shares authorized; 35,703,134 shares issued and outstanding at March 31, 2014, 47,312,722 pro forma shares issued and outstanding(1) |
357 | |||||||||||
| Class B common stock, $0.01 par value per share: 20,000,000 shares authorized; 15,555,000 shares issued and outstanding |
156 | |||||||||||
| Additional paid-in capital |
478,861 | |||||||||||
| Accumulated deficit |
(28,225 | ) | ||||||||||
| Accumulated other comprehensive loss |
(22,537 | ) | ||||||||||
| Noncontrolling interest |
92,878 | |||||||||||
|
|
|
|
|
|
|
|||||||
| Total equity |
521,490 | |||||||||||
|
|
|
|
|
|
|
|||||||
| Total capitalization |
$ | 1,756,578 | $ | $ | ||||||||
|
|
|
|
|
|
|
|||||||
| (1) | Includes 35,702,815 Class A shares outstanding before this offering and 11,609,907 Class A shares offered by us to the public hereby based on a public offering price of $25.84 per Class A share (the last reported sale price of our Class A common stock on the NASDAQ Global Market as set forth on the cover of this prospectus). |
33
Table of Contents
TRADING PRICE AND VOLUME; DIVIDENDS
The Class A common shares began trading on the NASDAQ on September 27, 2013, under the trading symbol “PEGI” and on the TSX under the trading symbol “PEG”. From September 27, 2013 to December 31, 2013, the high and low reported prices for our Class A common stock on the NASDAQ were $30.81 and $22.26, respectively; and from January 1, 2014 to March 31, 2014, the high and low reported prices for our Class A common stock on the NASDAQ were $31.79 and $25.82, respectively.
The following tables show the monthly range of high and low prices of Class A common shares and the total volume of Class A common shares traded on the NASDAQ and the TSX during the indicated periods before the date of this prospectus. On May 2, 2014, being the last day on which the Class A common shares traded prior to the date of this prospectus; the last reported sale price of our Class A common stock was $25.84 on the NASDAQ and C$28.23 on the TSX.
| NASDAQ: Date |
High | Low | Volume | |||||||||
| September 27-30, 2013 |
$ | 24.30 | $ | 22.81 | 10,915,856 | |||||||
| October 2013 |
$ | 23.64 | $ | 22.26 | 8,295,429 | |||||||
| November 2013 |
$ | 25.50 | $ | 22.32 | 5,118,980 | |||||||
| December 2013 |
$ | 30.81 | $ | 23.50 | 9,953,813 | |||||||
| January 2014 |
$ | 31.79 | $ | 26.72 | 7,328,178 | |||||||
| February 2014 |
$ | 28.71 | $ | 25.82 | 4,116,646 | |||||||
| March 2014 |
$ | 29.00 | $ | 26.25 | 4,052,980 | |||||||
| April 2014 |
$ | 29.40 | $ | 25.86 | 4,035,994 | |||||||
| May 2014 (through May 2) |
$ | 27.49 | $ | 25.32 | 515,424 | |||||||
The following table sets forth the range of high and low sale prices of the Class A common stock on the Toronto Stock Exchange.
| TSX: Date |
High | Low | Volume | |||||||||
| September 27-30, 2013 |
C$ | 24.95 | C$ | 23.50 | 142,688 | |||||||
| October 2013 |
C$ | 24.27 | C$ | 23.10 | 260,713 | |||||||
| November 2013 |
C$ | 26.29 | C$ | 23.50 | 23,386 | |||||||
| December 2013 |
C$ | 32.30 | C$ | 26.02 | 13,353 | |||||||
| January 2014 |
C$ | 34.99 | C$ | 30.61 | 19,386 | |||||||
| February 2014 |
C$ | 31.00 | C$ | 28.83 | 16,962 | |||||||
| March 2014 |
C$ | 31.95 | C$ | 29.06 | 16,169 | |||||||
| April 2014 |
C$ | 31.95 | C$ | 28.72 | 32,583 | |||||||
| May 2014 (through May 2) |
C$ | 29.93 | C$ | 27.83 | 1,700 | |||||||
The following table sets forth the dividends declared on shares of Class A common stock for the periods indicated. We declared our first, second and third quarterly dividends on our Class A common stock, the only dividends declared to date, payable to shareholders of record as of December 31, 2013, March 31, 2014 and June 30, 2014 respectively. See “Market Registrant’s Common Equity and Related Stockholder Matters—Cash Dividend Policy” in our 2013 Form 10-K for further discussion of our cash dividend policy.
| Period | Dividends Declared | |||
| Quarter ended December 31, 2013 |
$ | .3125 | ||
| Quarter ended March 31, 2014 |
$ | .3125 | ||
| Quarter ended June 30, 2014 |
$ | .3220 | ||
34
Table of Contents
SELECTED HISTORICAL CONSOLIDATED FINANCIAL DATA
The following table presents selected historical consolidated financial data as of the dates and for the periods indicated. The selected historical consolidated financial data as of December 31, 2011, 2012 and 2013 and for the years ended December 31, 2011, 2012 and 2013 have been derived from the audited historical consolidated financial statements incorporated by reference in this prospectus. The selected historical consolidated financial data as of March 31, 2014 and for the three months ended March 31, 2013 and 2014 have been derived from our unaudited interim historical financial statements incorporated by reference in this prospectus.
Our historical consolidated financial statements are presented in U.S. dollars and have been prepared in accordance with U.S. GAAP, which differ in certain material respects from IFRS. For recent and historical exchange rates between Canadian dollars and U.S. dollars, see “Currency and Exchange Rate Information.”
You should read the following table in conjunction with “Structure and Formation of Our Company,” “Use of Proceeds,” “Capitalization,” “Management’s Discussion and Analysis of Financial Condition and Results of Operations,” and the historical consolidated financial statements and the notes thereto, as well as the historical financial statements of Panhandle Wind Holdings LLC and Panhandle B Member 2 LLC and the pro forma financial information relating to the acquisitions of the Panhandle 1 and Panhandle 2 projects, included elsewhere or incorporated by reference in this prospectus.
| Three Months ended March 31, |
Year ended December 31, | |||||||||||||||||||
| 2014 | 2013 | 2013 | 2012 | 2011 | ||||||||||||||||
| (U.S. dollars in thousands, except per share data and share data) |
||||||||||||||||||||
| Statement of Operations Data: |
||||||||||||||||||||
| Revenue |
||||||||||||||||||||
| Electricity Sales |
$ | 53,871 | $ | 45,232 | $ | 173,270 | $ | 101,835 | $ | 108,770 | ||||||||||
| Energy derivative settlements |
2,735 | 5,408 | 16,798 | 19,644 | 9,512 | |||||||||||||||
| Unrealized (loss) gain on energy derivative |
(7,733 | ) | (6,803 | ) | (11,272 | ) | (6,951 | ) | 17,577 | |||||||||||
| Related party revenue |
445 | — | 911 | — | — | |||||||||||||||
| Other Revenue |
231 | — | 21,866 | — | — | |||||||||||||||
|
|
|
|
|
|
|
|
|
|
|
|||||||||||
| Total revenue |
49,549 | 43,837 | 201,573 | 114,528 | 135,859 | |||||||||||||||
| Cost of revenue |
||||||||||||||||||||
| Project expenses |
16,074 | 12,977 | 57,677 | 34,843 | 31,343 | |||||||||||||||
| Depreciation and accretion |
21,177 | 22,566 | 83,180 | 49,027 | 39,424 | |||||||||||||||
|
|
|
|
|
|
|
|
|
|
|
|||||||||||
| Total cost of revenue |
37,251 | 35,543 | 140,857 | 83,870 | 70,767 | |||||||||||||||
|
|
|
|
|
|
|
|
|
|
|
|||||||||||
| Gross profit |
12,298 | 8,294 | 60,716 | 30,658 | 65,092 | |||||||||||||||
| Operating expenses |
||||||||||||||||||||
| Development expenses |
— | — | — | 174 | 704 | |||||||||||||||
| General and administrative |
3,903 | 144 | 4,819 | 858 | 866 | |||||||||||||||
| Related party general and administrative |
1,280 | 2,662 | 8,169 | 10,604 | 8,098 | |||||||||||||||
|
|
|
|
|
|
|
|
|
|
|
|||||||||||
| Total operating expenses |
5,183 | 2,806 | 12,988 | 11,636 | 9,668 | |||||||||||||||
|
|
|
|
|
|
|
|
|
|
|
|||||||||||
| Operating income |
7,115 | 5,488 | 47,728 | 19,022 | 55,424 | |||||||||||||||
| Other income (expense) |
||||||||||||||||||||
| Interest expense |
(14,621 | ) | (16,642 | ) | (63,614 | ) | (36,502 | ) | (29,404 | ) | ||||||||||
| Equity in earnings in unconsolidated investments |
(12,548 | ) | (10,025 | ) | 7,846 | (40 | ) | (205 | ) | |||||||||||
| Interest rate derivative settlements |
(1,017 | ) | — | (2,099 | ) | — | — | |||||||||||||
| Unrealized loss on derivatives |
(3,723 | ) | 1,931 | 15,601 | (4,953 | ) | (345 | ) | ||||||||||||
| Net gain on transactions |
— | — | 5,995 | 4,173 | — | |||||||||||||||
| Related party income |
696 | — | 665 | — | — | |||||||||||||||
| Other income, net |
167 | 758 | 2,496 | 1,320 | 1,125 | |||||||||||||||
|
|
|
|
|
|
|
|
|
|
|
|||||||||||
| Total other expense |
(31,046 | ) | (23,978 | ) | (33,110 | ) | (36,002 | ) | (28,829 | ) | ||||||||||
|
|
|
|
|
|
|
|
|
|
|
|||||||||||
| Net income (loss) before income tax |
(23,931 | ) | (18,490 | ) | 14,618 | (16,980 | ) | 26,595 | ||||||||||||
| Tax provision (benefit) |
(2,032 | ) | 294 | 4,546 | (3,604 | ) | 689 | |||||||||||||
|
|
|
|
|
|
|
|
|
|
|
|||||||||||
| Net income (loss) |
(21,899 | ) | (18,784 | ) | 10,072 | (13,376 | ) | 25,906 | ||||||||||||
| Net (loss) income attributable to noncontrolling interest |
(7,010 | ) | (3,579 | ) | (6,887 | ) | (7,089 | ) | 16,981 | |||||||||||
|
|
|
|
|
|
|
|
|
|
|
|||||||||||
| Net income (loss) attributable to controlling interest |
$ | (14,889 | ) | $ | (15,205 | ) | $ | 16,959 | $ | (6,287 | ) | $ | 8,925 | |||||||
|
|
|
|
|
|
|
|
|
|
|
|||||||||||
| Earnings per share information: |
||||||||||||||||||||
| Less Net income attributable to controlling interest prior to the IPO on October 2, 2013 |
(30,295 | ) | ||||||||||||||||||
|
|
|
|||||||||||||||||||
| Net loss attributable to controlling interest subsequent to the IPO |
$ | (13,336 | ) | |||||||||||||||||
|
|
|
|||||||||||||||||||
35
Table of Contents
| Three Months ended March 31, |
Year ended December 31, | |||||||||||||||||||
| 2014 | 2013 | 2013 | 2012 | 2011 | ||||||||||||||||
| (U.S. dollars in thousands, except per share data and share data) |
||||||||||||||||||||
| Weighted average number of shares: |
||||||||||||||||||||
| Basic and diluted—Class A common stock |
35,533,166 | 35,448,056 | ||||||||||||||||||
| Basic and diluted—Class B common stock |
15,555,000 | 15,555,000 | ||||||||||||||||||
| Earnings per share for period subsequent to the IPO |
||||||||||||||||||||
| Class A common stock: |
||||||||||||||||||||
| Basic and diluted loss per share |
$ | (0.20 | ) | $ | (0.17 | ) | ||||||||||||||
|
|
|
|
|
|||||||||||||||||
| Class B common stock: |
||||||||||||||||||||
| Basic and diluted loss per share |
$ | (0.51 | ) | $ | (0.48 | ) | ||||||||||||||
|
|
|
|
|
|||||||||||||||||
| Unaudited pro forma net loss after tax: |
||||||||||||||||||||
| Net loss before income tax |
$ | (18,490 | ) | $ | (16,980 | ) | ||||||||||||||
| Pro forma tax provision |
279 | 818 | ||||||||||||||||||
|
|
|
|
|
|||||||||||||||||
| Pro forma net loss |
$ | (18,769 | ) | $ | (17,798 | ) | ||||||||||||||
|
|
|
|
|
|||||||||||||||||
| Other Data: |
||||||||||||||||||||
| Operating activities |
$ | 16,405 | $ | 8,391 | $ | 78,152 | $ | 35,051 | $ | 46,930 | ||||||||||
| Investing activities |
$ | 1,366 | $ | (60,719 | ) | $ | 72,391 | $ | (638,953 | ) | $ | (340,977 | ) | |||||||
| Financing activities |
$ | (20,701 | ) | $ | 63,340 | $ | (63,401 | ) | $ | 573,167 | $ | 331,336 | ||||||||
| As of March 31, |
As of December 31, | |||||||||||||||
| 2014 | 2013 | 2012 | 2011 | |||||||||||||
| (U.S. dollars in thousands) | ||||||||||||||||
| Balance Sheet Data: |
||||||||||||||||
| Cash |
$ | 100,343 | $ | 103,569 | $ | 17,574 | $ | 47,672 | ||||||||
| Construction in progress |
$ | — | $ | — | $ | 6,081 | $ | 201,245 | ||||||||
| Property, plant and equipment, net |
$ | 1,444,554 | $ | 1,476,142 | $ | 1,668,302 | $ | 784,859 | ||||||||
| Total assets |
$ | 1,834,950 | $ | 1,903,631 | $ | 2,035,730 | $ | 1,390,426 | ||||||||
| Long-term debt |
$ | 1,235,088 | $ | 1,249,218 | $ | 1,290,570 | $ | 867,548 | ||||||||
| Total liabilities |
$ | 1,313,460 | $ | 1,335,627 | $ | 1,446,318 | $ | 943,728 | ||||||||
| Total equity before noncontrolling interest |
$ | 428,612 | $ | 468,210 | $ | 514,111 | $ | 362,226 | ||||||||
| Noncontrolling interest |
$ | 92,878 | $ | 99,794 | $ | 75,301 | $ | 84,472 | ||||||||
| Total equity |
$ | 521,490 | $ | 568,004 | $ | 589,412 | $ | 446,698 | ||||||||
36
Table of Contents
MANAGEMENT’S DISCUSSION AND ANALYSIS OF FINANCIAL CONDITION
AND RESULTS OF OPERATIONS
The following discussion contains forward-looking statements that involve risks and uncertainties. Our actual results may differ materially from those discussed in the forward-looking statements as a result of various factors, including, without limitation, those set forth in “Risk Factors,” “Forward-Looking Statements” and other matters included elsewhere or incorporated by reference in this prospectus.
The following discussion of our financial condition and results of operations should be read in conjunction with our historical financial statements and the notes thereto, as well as the historical financial statements of Panhandle Wind Holdings LLC and Panhandle B Member 2 LLC and the pro forma financial information relating to the acquisitions of the Panhandle 1 and Panhandle 2 projects, included elsewhere or incorporated by reference in this prospectus and our unaudited pro forma financial data, as well as the information presented under “Summary Historical Consolidated Financial Data,” “Capitalization,” “Selected Historical Consolidated Financial Data,” “Material U.S. Federal Income Tax Considerations for Non-U.S. Holders of Our Class A Shares” and “Material Canadian Federal Income Tax Considerations for Holders of Our Class A Shares.”
Overview
We are an independent power company focused on owning and operating power projects with stable long-term cash flows in attractive markets with potential for continued growth of our business. Including the pending acquisitions of the Panhandle 1 and Panhandle 2 projects,2 which we have agreed to acquire from Pattern Development, we own interests in eleven wind power projects located in the United States, Canada and Chile that use proven, best-in-class technology and have a total owned capacity of 1,434 MW, consisting of seven operating projects and four construction projects. We expect our four construction projects will commence commercial operations prior to the end of 2014. Each of our projects has contracted to sell all or a majority of its output pursuant to a long-term, fixed-price power sale agreement with a creditworthy counterparty. Ninety-one percent of the electricity to be generated by our projects will be sold under these power sale agreements, which have a weighted average remaining contract life of approximately 17 years.
We intend to maximize long-term value for our shareholders in an environmentally responsible manner and with respect for the communities in which we operate. Our business is built around the core values of creating a safe, high-integrity and exciting work environment; applying rigorous analysis to all aspects of our business; and proactively working with our stakeholders in addressing environmental and community concerns. Our financial objectives, which we believe will maximize long-term value for our shareholders, are to produce stable and sustainable cash available for distribution, selectively grow our project portfolio and our dividend and maintain a strong balance sheet and flexible capital structure.
Our growth strategy is focused on the acquisition of operational and construction-ready power projects from Pattern Development and other third parties that we believe will contribute to the growth of our business and enable us to increase our dividend per share over time. We expect our continuing relationship with Pattern Development, a leading developer of renewable energy and transmission projects, will be an important source of growth for our business.
| 2 | We agreed in May 2014 to acquire Panhandle 1 from Pattern Development, subject to the satisfaction of customary closing conditions, shortly after its commencement of commercial operations, which we expect to occur in June 2014. We agreed in December 2013 to acquire Panhandle 2 from Pattern Development, subject to the satisfaction of customary closing conditions, following its commencement of commercial operations, which we expect to occur in the fourth quarter of 2014. See “—Factors that Significantly Affect our Business—Recent Transactions—Project Acquisitions.” |
37
Table of Contents
Factors that Significantly Affect our Business
Our results of operations in the near-term as well as our ability to grow our business and revenue from electricity sales over time could be impacted by a number of factors, including those affecting our industry generally and those that could specifically affect our existing projects and our ability to grow.
Recent Transactions
Our IPO and the Contribution Transactions
On October 2, 2013, we issued 16,000,000 shares of Class A common stock in an initial public offering generating net proceeds of approximately $317.0 million. Concurrently with the completion of the initial public offering, we issued 19,445,000 shares of Class A common stock and 15,555,000 shares of Class B common stock to Pattern Development and utilized approximately $232.6 million of the net proceeds of the initial public offering as the cash portion of the consideration paid to Pattern Development for the Contribution Transactions and repaid a $56.0 million outstanding balance of our revolving credit facility. On October 8, 2013, our underwriters exercised in full their overallotment option to purchase 2,400,000 shares of Class A common stock from Pattern Development, the selling shareholder, pursuant to the overallotment option granted by Pattern Development in connection with the initial public offering.
In connection with the Contribution Transactions, Pattern Development retained a 40% portion of the interest in Gulf Wind project previously held by it (equivalent to a 27% interest in the project) such that, following the completion of the IPO, we, Pattern Development and our joint venture partner hold interests of approximately 40%, 27% and 33%, respectively, of the distributable cash flow of Gulf Wind, together with certain allocated tax items.
Project Acquisitions
On December 20, 2013, we entered into agreements with Pattern Development to acquire its ownership interests in the Grand and Panhandle 2 wind projects. Pursuant to our agreement to purchase the Grand project, we acquired a 67 MW interest in the 149 MW Grand project for a cash purchase price of $79.5 million. Subject to the terms of this agreement, to the extent that the project makes a special distribution as a result of contruction cost underruns, we will make an additional contingent payment of up to $4.7 million to Pattern Development in 2014. Pursuant to our agreement to acquire the Panhandle 2 project, we agreed to acquire a 147 MW interest in the 182 MW Panhandle 2 project following the completion of its construction (the “Panhandle 2 closing date”) for a cash purchase price of $122.9 million, subject to certain price adjustments based on final project size, design and modeling assumptions, to be funded on the Panhandle 2 closing date. Both projects are currently under construction, and are expected to commence commercial operations in the fourth quarter of 2014.
On May 1, 2014, we entered into an agreement with Pattern Development to acquire its ownership interests in the Panhandle 1 wind project. Pursuant to this agreement, we will acquire, subject to satisfaction of customary closing conditions, a 179 MW interest in the 218 MW Panhandle 1 project shortly after the commencement of its commercial operations (the “Panhandle 1 closing date”) for a cash purchase price of $125 million, subject to certain price adjustments based on final project size, design and modeling assumptions, to be funded on the Panhandle 1 closing date. The Panhandle 1 project is currently under construction, and is expected to commence commercial operations in June 2014.
The Panhandle 1, Panhandle 2 and Grand project interests represent a portion of the Initial ROFO Projects and are the first three acquisitions that we agreed to make from Pattern Development in connection with our Project Purchase Rights. At the time of our IPO, we identified six projects at Pattern Development with an aggregate owned capacity of 746 MW that comprised the Initial ROFO Projects, and we indicated we had initiated discussions with Pattern Development in connection with one of these originally identified Initial ROFO Projects, the Panhandle
38
Table of Contents
project, which we might acquire shortly after the closing of the IPO. Pattern Development subsequently increased the owned capacity of the Panhandle project by 78 MW, to a total of 326 MW, and split the project into the Panhandle 1 project, with a Pattern Development-owned capacity of 179 MW, and the Panhandle 2 project, with an owned capacity of 147 MW. Pattern Development also increased its estimated capacity of another of the Initial ROFO Projects, the Meikle project in British Columbia, by 10 MW, to 185 MW. After accounting for Pattern Development’s increase in the size of the Panhandle and Meikle projects, our acquisition of the Grand project and our agreements to acquire the Panhandle 1 and Panhandle 2 projects, the owned capacity of the remaining Initial ROFO Projects is 441 MW. The status of the remaining Initial ROFO Projects is summarized in the table below:
| Capacity (MW) | ||||||||||||||||||||||
| Remaining Initial |
Status | Location | Construction Start(1) |
Commercial Operations(2) |
Contract Type |
Rated(3) | Pattern Development- Owned(4) |
|||||||||||||||
| Gulf Wind |
Operational | Texas | 2008 | 2009 | Hedge | 283 | 76 | |||||||||||||||
| K2 |
In Construction | Ontario | 2014 | 2015 | PPA | 270 | 90 | |||||||||||||||
| Armow |
Ready for financing | Ontario | 2014 | 2015 | PPA | 180 | 90 | |||||||||||||||
| Meikle |
Pre-Construction | British Columbia | 2015 | 2016 | PPA | 185 | 185 | |||||||||||||||
|
|
|
|
|
|||||||||||||||||||
| 918 | 441 | |||||||||||||||||||||
|
|
|
|
|
|||||||||||||||||||
| (1) | Represents date of actual or anticipated commencement of construction. |
| (2) | Represents date of actual or anticipated commencement of commercial operations. |
| (3) | Rated capacity represents the maximum electricity generating capacity of a project in MW. As a result of wind and other conditions, a project or a turbine will not operate at its rated capacity at all times and the amount of electricity generated will be less than its rated capacity. The amount of electricity generated may vary based on a variety of factors. |
| (4) | Pattern Development-owned capacity represents the maximum, or rated, electricity generating capacity of the project multiplied by Pattern Development’s percentage ownership interest in the distributable cash flow of the project. |
The project entity which owns the Grand project is fully financed with equity contributions from its owners, which were funded prior to our acquisition, and loan commitments from a consortium of commercial banks, which provided construction and term financing for the project. The project will sell all of its electrical output to the Ontario Power Authority.
The project entity which owns the Panhandle 1 project is fully financed with equity contributions from its owner, which were funded prior to our planned acquisition, and loan commitments from commercial lenders, which provided construction financing for the project. Pattern Development and two institutional tax equity investors have agreed, subject to certain customary conditions precedent, which we expect will be satisfied, to provide equity contributions to the project holding company upon completion of construction. These contributions will be used to repay in full the then outstanding construction loan balances and the project entity will accordingly not have any term debt once these contributions are made following the commencement of commercial operations. The project will sell approximately 77% of its expected annual average electrical output to an affiliate of Citibank, under fixed-for-floating energy swaps with a term of 13 years, and the balance of its electrical output in the ERCOT spot market and will market its RECs separately.
The project entity which owns the Panhandle 2 project is fully financed with equity contributions from its owner, which were funded prior to our planned acquisition, and loan commitments from commercial lenders, which provided construction financing for the project. Pattern Development and three institutional tax equity investors have agreed, subject to certain customary conditions precedent, which we expect will be satisfied, to provide equity contributions to the project holding company upon completion of construction. These contributions will be used to repay in full the then outstanding construction loan balances and the project entity will accordingly not have any term debt once these contributions are made following the commencement of
39
Table of Contents
commercial operations. The project will sell approximately 80% of its expected annual average electrical output to an affiliate of Morgan Stanley, under fixed-for-floating energy swaps with a term of 12.25 years, and the balance of its electrical output in the ERCOT spot market and will market its RECs separately.
Other Transactions and Events
In March 2014, certain of our operating projects entered into long-term service and maintenance agreements with the turbine supplier to provide turbine maintenance and incremental improvements for varying periods over the next twelve years. Under the terms of each of these agreements, the turbine supplier will provide a full turbine warranty, including parts and performance, and maintenance services and certain equipment modifications at agreed project sites, which are expected to provide incremental increases in the net capacity factors of the affected projects.
In addition to providing greater certainty about our future equipment maintenance costs, we believe that extending the warranty coverage under these long-term service agreements also provides greater protection against potential warranty issues that could arise later in the equipment life. For example, our Ocotillo and Santa Isabel (Siemens) and Gulf Wind (MHI) projects have experienced certain blade failures in the last two years. The Siemens blade failures have been fully addressed. While the manufacturer of the Gulf Wind turbines, MHI, has remediated the failed blades under our equipment warranty, which expires in late 2014, we are working with MHI to address any further remediation within the remaining warranty period.
In March 2014, we entered into an agreement to increase the size of our revolving credit facility by $25 million, to $145 million. In connection with this agreement, we added our interest in the Ocotillo project to the collateral pool that supports this loan facility.
On March 28, 2014, our South Kent construction project reached the commercial operation date under its PPA with the Ontario Power Authority.
Trends Affecting our Industry
Wind and solar power have been among the fastest growing sources of electricity generation in North America and globally over the past decade. This rapid growth is largely attributable to wind and solar power’s increasing cost competitiveness with other electricity generation sources, the advantages of wind and solar power over many other renewable energy sources and growing public support for renewable energy driven by concerns about security of energy supply and the environment. We expect these trends to continue to drive future growth in the wind power industry.
We believe that the key drivers for the long-term growth of wind power in North America include:
| • | overall and regional demand for new power plants resulting from regulatory or policy initiatives, such as state or provincial RPS programs, motivating utilities to procure electricity supply from renewable resources; |
| • | efficiency and capital cost improvements in wind, solar and other renewable energy technologies, enabling wind and other forms of renewable energy to compete successfully in more markets; |
| • | governmental incentives, including PTCs, which improve the cost competitiveness of renewable energy compared to traditional sources; |
| • | environmental and social factors supporting increasing levels of wind, solar and other renewable technologies in the generation mix: |
| • | regulatory barriers increase the time, cost and difficulty of permitting new fossil fuel-fired facilities, notably coal, and nuclear facilities; |
40
Table of Contents
| • | decommissioning of aging coal-fired and nuclear facilities is expected to leave a gap in electricity supply; |
| • | policy initiatives to include the cost of carbon pollution in conventional fossil fuel-fired electricity generation will increase costs of conventional generation; and |
| • | price volatility for natural gas used for electricity generation. |
Uncertainty related to the demand for power, generally, and thus the need for new power projects, and the expiration of U.S. federal incentives resulted in a reduction in the build rate of wind and solar power and other renewable energy projects in 2013, compared to 2012, and these trends may continue to dampen that build rate in 2014 and beyond. We expect these adverse effects to be partially or fully offset in certain markets by regional requirements for new power projects due to older power project retirements, passage of an extension or modification of the U.S. federal tax incentives or other government actions in support of new wind power projects, a potential return to higher natural gas prices, desire, on the part of regulatory commissions and ratepayers, for more stable power sale agreements such as those which wind and solar power projects are ideally suited to provide, and increased difficulty in permitting conventional power projects. In the long term, we believe that substantial growth potential remains in the U.S. market.
In addition, we continue to see more opportunities to acquire wind and solar projects in the North American market than has been typical for the past decade. Three factors are driving this accelerated activity level:
| • | We believe that many project developers have scaled back their wind project development teams and investment activity in reaction to the prior or anticipated potential expirations of PTC and ITC cash grant programs and continued uncertainty about federal, state and provincial energy policies and as a result of perceptions about slower market growth in the near term; |
| • | A number of large European utilities that have been major participants in the U.S. wind power market appear to be strengthening their consolidated balance sheets due to their own home market issues by selling portions of their U.S. investment portfolios; |
| • | The emergence of “yieldcos” has provided a new class of investors with an appetite for investment in contract-based renewable power projects. |
In general we continue to believe that there will be additional acquisition opportunities in the United States in the short term and that the longer-term growth trend will resume following the determination of federal government policy. We have seen this occur in previous periods when tax credit extensions were uncertain, and we consider it likely to happen again in the coming years. We are a relatively small company involved in a large and somewhat fragmented market in which we believe our fully integrated approach to the business allows us to assess and execute on market opportunities quickly.
Our Outlook
Our projects are generally unaffected by the short-term trends discussed above, given that 91% of the electricity to be generated by our projects will be sold under our fixed-price power sale agreements, which have a weighted average remaining life of approximately 17 years, the geographic diversity of our projects and the limited impact that expiring U.S. federal incentives will have upon completion of our construction projects in the United States, Canada and Chile.
Our near-term growth strategy will focus on wind power projects, but will also include evaluation of solar power opportunities, and is largely insulated from the short-term trends. We expect that most of our short-term growth will come from opportunities to acquire the remaining Initial ROFO Projects, including those located in Ontario, which have executed power sale agreements with terms substantially similar to our South Kent and Grand PPAs, Pattern Development’s Panhandle projects, which have already qualified for PTCs and which have long-term power sales agreements in the form of energy hedge contracts, pursuant to our Project Purchase Right and the Pattern Development retained Gulf Wind interest pursuant to our Gulf Wind Call Right.
41
Table of Contents
We intend to use the net proceeds from this offering for working capital and general corporate purposes, including the acquisition of the Panhandle 1 project and potentially including any of a number of third party acquisition opportunities which we are considering, or Panhandle 2 if we have not earlier used such proceeds. We have agreed to pay a cash purchase price of $125 million, subject to certain adjustments, to Pattern Development in connection with our acquisition of the Panhandle 1 project, which we expect to complete shortly after its commencement of commercial operations, which we expect to occur in June 2014. In addition, we have bid on, or are in discussions with respect to, several possible third party acquisitions that, should we be successful in their pursuit, could require the use of a portion of the proceeds of this offering. While we do not have any binding agreements for any such acquisitions, and we may not reach agreement with respect to any of these potential acquisitions, we are in advanced discussions regarding potential acquisitions of certain wind power projects that in the aggregate could exceed 500 MW. To the extent that the aggregate value of any agreed purchase prices for such acquisitions exceeds the funds available to us, we are evaluating various forms of financing that we believe would be required in order to complete such a transaction, which may include, among others, bridge financing, capital markets transactions, or both. We do not have any commitments for any such financing, and there can be no assurance that it will be available on acceptable terms or at all. The terms of any such bridge financing could limit our operational flexibility or, upon an event of default, our ability to pay dividends and the issuance of any additional equity securities could have an adverse effect on the price of our Class A common stock.
Factors Affecting Our Operational Results
The primary factors that affect our financial results are (i) the timing of commencement of commercial operations at our construction projects, (ii) the amount and price of electricity sales by our operating projects, (iii) accounting for derivative instruments, (iv) acquisitions of new projects, (v) achievement of efficient project operations, and (vi) interest expense on our corporate- and project-level debt.
Timing of Commencement of Commercial Operations at Our Construction Projects
Including the Panhandle 1 and Panhandle 2 projects which we have agreed to acquire from Pattern Development, and which we expect to complete, subject to the satisfaction of customary closing conditions, at different times prior to the end of 2014, our construction projects include interests in four projects that we expect will contribute an additional operating capacity of 429 MW in 2014, for an aggregate owned capacity of 1,434 MW together with our operating projects. Our near-term operating results will, in part, depend upon our ability to transition these projects into commercial operations in accordance with our existing construction budgets and schedules. The following table sets forth each of our construction projects as well as their respective power capacities and our anticipated date of their commencement of commercial operations.
| Construction Start |
Commercial Operations |
MW | ||||||||||||||||||
| Projects | Location | Rated | Owned | |||||||||||||||||
| El Arrayan |
Chile | Q3 2012 | Q2 2014 | 115 | 36 | |||||||||||||||
| Panhandle 1(1) |
Texas | Q4 2013 | Q2 2014 | 218 | 179 | |||||||||||||||
| Panhandle 2(2) |
Texas | Q4 2013 | Q4 2014 | 182 | 147 | |||||||||||||||
| Grand |
Ontario | Q3 2013 | Q4 2014 | 149 | 67 | |||||||||||||||
|
|
|
|
|
|||||||||||||||||
| 664 | 429 | |||||||||||||||||||
|
|
|
|
|
|||||||||||||||||
| (1) | Completion of the acquisition of Panhandle 1 is expected to occur shortly after its commencement of commercial operations, which we expect to occur in June 2014. |
| (2) | Commencement of commercial operations and the acquisition of Panhandle 2 are expected to occur in the fourth quarter of 2014. |
We are constructing our projects under fixed-price and fixed-schedule contracts with major equipment suppliers and experienced balance-of-plant constructors. Under our management team’s supervision, Pattern
42
Table of Contents
Development completed the construction of our Hatchet Ridge, St. Joseph, Spring Valley, Santa Isabel, Ocotillo and South Kent projects on time and within budget. Including their time together before forming Pattern Development, our management team has constructed and placed into service 26 wind power projects with an aggregate generating capacity of over 2,800 MW.
Electricity Sales and Energy Derivative Settlements of Our Operating Projects
Our electricity sales and energy derivative settlements are primarily determined by the price of electricity and any environmental attributes we sell under our power sale agreements and the amount of electricity that we produce, which is in turn principally the result of the wind conditions at our project sites and the performance of our equipment. Ninety-one percent of the electricity to be generated across our projects is currently committed under long-term, fixed-price power sale agreements with creditworthy counterparties, which have a weighted average remaining contract life of approximately 17 years.
Wind conditions and equipment performance represent the primary factors affecting our near-term operating results because these variables impact the volume of the electricity that we are able to generate from our operating projects.
Our revenue from electricity sales and energy derivative settlements during a period is primarily a function of the amount of electricity generated by our projects. The electricity generated from our power projects depends primarily on wind and weather conditions at each specific site and the performance of our equipment. We base our estimates of each project’s capacity to generate electricity on the findings of our internal and external experts’ long-term meteorological studies, which includes on-site data collected from equipment on the property and relevant reference wind data from other sources, as well as specific equipment power curves and estimates for the performance of our equipment over time. Although wind conditions in 2013 were below the assumptions that drive our long-term production expectations, the longer term data continues to support our production forecast and we have not changed our expected annual average output from our existing projects.
Our wind analysis evaluates the wind’s speed and prevailing direction, atmospheric conditions, and wake and seasonal variations for each project. The result of our meteorological analysis is a probabilistic assessment of a project’s likely output. A P50 level of production indicates we believe a 50% probability exists that the electricity generated from a project will exceed a specified aggregate amount of electricity generation during a given period. While we plan for variability around this P50 production level, it generally provides the foundation for our base case expectation. The variability is measured in a spectrum of possible output levels such as a P75 output level, which indicates that over a specified period of time, such as one or ten years, the P75 output level would be exceeded 75% of the time. Similarly, the P25 output level would be exceeded 25% of the time. We often use P95, P90 and P75 production levels to plan ahead for low-wind years, while recognizing that we should also have corresponding high-wind years.
In addition to annual P50 variability, we also expect seasonal variability to occur. Variability increases as the period of review shortens, so it is likely that we will experience more variability in monthly or quarterly production than we do for annual production. Therefore, our periodic cash flow and payout ratios will also reflect more variability during periods shorter than a year. As a result, we use cash reserves to help manage short term production and cash flow variability.
When analyzed together, a portfolio’s probability of exceedance changes when all the projects are considered as a portfolio instead of on a stand-alone basis. Due to the geographical separation between our projects, the uncertainty variables and wind speed correlations are diverse enough across the portfolio to provide improvement in the overall uncertainty, which we refer to as the portfolio effect. For example, the sum of our individual projects’ P75 output levels is approximately 92% of the aggregate P50 output level (which is unaffected by the portfolio effect), while the P75 output level, when taking into account the portfolio effect, is approximately 95% of our aggregate P50 output level. On a portfolio basis, our P90 and P95 production
43
Table of Contents
estimates for the annual electricity generation of our ten projects, once they are all fully operational, are approximately 90% and 87%, respectively, of our estimated P50 output levels. The portfolio effect results in an improvement in the production stability across the portfolio. A greater diversity of projects in the portfolio has the effect of increasing the frequency of occurrences aggregated around the expected result (probability level). This is demonstrated in the following diagram:
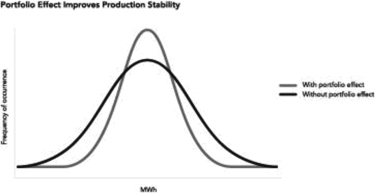
Our electricity generation is also dependent on the equipment that we use. We have selected high-quality equipment with a goal of having a concentration of turbines from top manufacturers. We employ (or will employ) the Siemens 2.3 MW turbine at nine of our ten project sites, the Mitsubishi MWT95/2.4 at the tenth and the General Electric GWT 1.85-87 at the eleventh. With a combination of high-quality equipment and scale, we have structured our projects such that we may expect high availability and long-term production from the equipment, develop operating expertise and experience, which can be shared among our operators, obtain a high level of attention and focus from the manufacturers and maintain a shared spare parts inventory and common operating practices. Given our manufacturers’ global fleet sizes and strong balance sheets, the warranties that we secure for our turbines and our operating approach described below, we are confident in our expectations for reliable long-term turbine operation.
In May 2013, a blade separated from the turbine hub on one of the wind turbines at our Ocotillo project following which we shut down all of the SWT-2.3-108 turbines which were at the time utilized only at our Ocotillo and Santa Isabel projects, pending determination of the cause. Siemens completed, and we accepted, a root cause analysis, a remediation plan, including inspection, repair or replacement, and a return to service program for all of the SWT-2.3-108 blades. Our warranty arrangements with Siemens required that Siemens complete the remediation plan at its cost and pay liquidated damages to us in the event that turbine availability falls below specified thresholds. During 2013, we received warranty liquidated damages from Siemens with respect to our availability warranties. Depending on future performance of the equipment, we may receive additional liquidated damages from Siemens in 2014.
Accounting for Derivative Instruments
We have, and expect to continue to enter into, contracts to hedge against risks related to fluctuations in energy prices and interest rates on our project loans and foreign currency exchange rates. Except with respect to contracts for which we do not elect or do not qualify for hedge accounting, we recognize derivative instruments as assets or liabilities at fair value in our consolidated balance sheets. Our method of accounting for a change in the fair value (i.e., gains or losses) of a derivative instrument depends on whether it has been designated as part of a hedging relationship and, if so, on the type of hedging relationship. For derivative instruments that are not so designated, such as our energy derivatives and certain of our interest rate derivatives, changes in fair value are recorded as a component of net income on our consolidated statement of operations. For derivative instruments that are designated as cash flow hedges, the effective portion of the change in the fair value of the instrument is recorded as a component of other comprehensive income. Changes in the fair value of derivative instruments
44
Table of Contents
designated as cash flow hedges are subsequently reclassified into net income in the period that the hedged transaction affects earnings. The ineffective portion of changes in the fair value of designated hedges is also recorded as a component of current net income.
The fair value of a derivative is a function of a number of factors, including the duration and notional volume of the derivative and forward price curve for the product to which the derivative applies. In general, there is more volatility in the fair value of derivative instruments that are designed to protect long-dated risks, such as an 18-year loan amortization profile, than those with short durations, such as a two-year foreign currency fixed-for-floating swap. Where possible, we have sought to protect ourselves against electricity and interest rate exposures with a relatively longer term hedging strategy. We expect to hedge exposure to foreign currency exchange rates in the future over shorter periods of time. Accordingly, we have experienced in the past, and expect to record in the future, substantial volatility in the components of our net income that relate to the mark-to-market adjustments on our undesignated energy and interest rate derivatives.
We believe that mark-to-market adjustments that we make to the fair value of our derivative assets and liabilities are generally mirrored by changes in the economic value of the related operating or financial assets, such as our wind projects and our project loans, for which the application of U.S. GAAP does not permit us to record such economic gains and losses. For this reason, and because one of our principal financial objectives is to produce stable and sustainable cash available for distribution, we believe that the economic value to our shareholders reflected in these derivative instruments, outweighs the risk of volatility in net income that we expect to report. Accordingly, we believe it is useful to investors to consider supplemental financial measures that we report, such as Adjusted EBITDA, where we have subtracted and added back, as applicable, the unrealized gains and losses arising from mark-to-market adjustments on our derivative instruments, and cash available for distribution.
Project Operations
Our ability to generate electricity in an efficient and cost-effective manner is impacted by our ability to maintain the operating capacity of our projects. We use reliable and proven wind turbines and other equipment for each of our projects. For the years ended December 31, 2012 and 2011, our turbine availability across our projects was 97.6% and 96.2%, respectively, which is in line with industry standards for original investment projections reviewed by independent engineering firms. For the year ended 2013, our turbine availability across our projects was 88.3%, which was lower than our and industry standards due primarily to the blade issue at our Santa Isabel and Ocotillo projects. It was also affected by certain unrelated equipment issues at our Spring Valley project which are covered under manufacturer warranty, which may result in certain liquidated damages being received in 2014, and which are not expected to have a long-term impact on our project operating results. More importantly, we operate our projects to maximize our revenues rather than solely focusing on time-based availability or electricity generation volume. See “Business—Organization of Our Business—Operations and Maintenance.” To accomplish this, we provide forward-looking wind forecasts to each of our sites twice a day. Our site managers use this information to plan the maintenance activities for those days, in order to schedule maintenance during low wind periods, where impact to revenues is minimized. In addition, for sites with power prices that vary during different periods, we schedule work to avoid known or anticipated high price periods. For example, on the Hatchet Ridge project in the summer of 2012, we scheduled summer maintenance crews to start work at 5:00 AM and finish by 1:00 PM, in order to have all available turbines operating when peak PPA pricing started at 2:00 PM.
In addition, as a result of the importance we place on safety and implementation of a safety management program, our operating business has experienced no significant lost time events, worksite accidents, or other significant environmental, health or safety, or “EHS,” issues in 2013 or 2012. Certain contractors or subcontractors at our construction sites have had worksite accidents, and we continue to work with these third parties to improve their safety performance.
45
Table of Contents
In 2013 and 2012, we took the following steps that should enable us to continue to improve our operating performance at our operating projects:
| • | We hired site management personnel six months prior to achieving commercial operations at our Spring Valley, Santa Isabel, Ocotillo and South Kent projects. This allows these individuals to go through an organized training program, which includes time in our Houston office to meet with the operations team, training at one of our existing operating projects, vendor and third-party external training, and focused time setting up project operational and compliance programs before arrival at site. After arrival at site, this time also allows the site management to be intimately involved in the project commissioning process and operational preparations. We also include regular visits from our management, safety, and turbine specialists during this pre-operational period to ensure smooth coordination of start-up. |
| • | At our projects nearing the end of their original turbine manufacturer warranty periods, which includes Hatchet Ridge in October 2012 and St. Joseph in early 2013, we conduct extensive third-party end-of-warranty inspections to identify any potential equipment or service issues that can be remedied by the manufacturer pursuant to their warranty contractual obligations and ensure the sites start their post-warranty periods with reliably functioning equipment. We believe these thorough inspections also provide a solid baseline for equipment condition to drive future maintenance planning. These same end-of-warranty dates on most projects also mark the end of the manufacturer’s service contracts, and we conduct competitive solicitations between both the manufacturers as well as top-tier third-party independent service providers for conducting the turbine service and maintenance in the post-warranty period. At Hatchet Ridge, this solicitation resulted in the selection of leading independent service provider Duke Energy Services, LLC at a significant cost savings, while still ensuring quality of service. |
| • | We implemented a robust NERC compliance program consisting of a suite of policies and procedures, employee training and record keeping systems. This program is run by a full-time in-house regulatory compliance specialist. In August 2012, we completed our first full NERC audit for the Gulf Wind project. The audit was successful, with no findings of any violations, and we were commended by the auditors for our strong regulatory compliance culture. |
Debt Financing
We intend to use a portion of our revenue from electricity sales to cover our subsidiaries’ interest expense and principal payments on borrowings under their respective project financing facilities. In the near-term, our interest expense primarily reflects (i) imputed interest on the lease financing of our Hatchet Ridge project, (ii) periodic interest on the term loan financing arrangements at our other operating projects and (iii) interest on short-term loan facilities, including any borrowings under our revolving credit facility.
We believe that our projects have been financed on average with stronger coverage ratios than is typical in our industry. A debt service coverage ratio is generally defined as a project’s operating cash flows divided by scheduled payments of principal and interest for a period. While we believe that the commercial bank market generally seeks a minimum average annual debt service coverage ratio for wind power projects, based on P50 output levels, of between 1.4 and 1.5 to 1.0, our projects, on a portfolio basis, have an expected average annual debt service coverage ratio over the remaining scheduled loan amortization periods of approximately 1.7 to 1.0.
Key Metrics
We regularly review a number of financial measurements and operating metrics to evaluate our performance, measure our growth and make strategic decisions. In addition to traditional U.S. GAAP performance and liquidity measures, such as revenue, cost of revenue, net income and cash provided by (used in) operating activities, we also consider MWh sold, average realized electricity price and Adjusted EBITDA in evaluating our operating performance and cash available for distribution as supplemental liquidity measures. Each of these key metrics is discussed below.
46
Table of Contents
MWh Sold and Average Realized Electricity Price
The number of MWh sold and the average realized price per MWh sold are the operating metrics that determine our revenue. For any period presented, average realized electricity price represents total revenue from electricity sales and energy derivative settlements divided by the aggregate number of MWh sold.
Adjusted EBITDA
We define Adjusted EBITDA as net income before net interest expense, income taxes and depreciation and accretion, including our proportionate share of net interest expense, income taxes and depreciation and accretion of joint venture investments that are accounted for under the equity method, and excluding the effect of certain other items that our company does not consider to be indicative of its ongoing operating performance such as mark-to-market adjustments and infrequent items not related to normal or ongoing operations, such as early payment of debt and realized derivative gain or loss from refinancing transactions, and gain or loss related to acquisitions or divestitures. In calculating Adjusted EBITDA, we exclude mark-to-market adjustments to the value of our derivatives because we believe that it is useful for investors to understand, as a supplement to net income and other traditional measures of operating results, the results of our operations without regard to periodic, and sometimes material, fluctuations in the market value of such assets or liabilities. Adjusted EBITDA is a non-U.S. GAAP measure.
The following table reconciles net income (loss) to Adjusted EBITDA for the periods presented and is unaudited (U.S. dollars in thousands):
| Three Months ended March 31, |
Year ended December 31, | |||||||||||||||||||
| 2014 | 2013 | 2013 | 2012 | 2011 | ||||||||||||||||
| (U.S. dollars in thousands) | ||||||||||||||||||||
| Net income (loss) |
$ | (21,899 | ) | $ | (18,784 | ) | $ | 10,072 | $ | (13,376 | ) | $ | 25,906 | |||||||
| Plus: |
||||||||||||||||||||
| Interest expense, net of interest income |
14,418 | 15,884 | 61,118 | 35,457 | 28,285 | |||||||||||||||
| Tax provision (benefit) |
(2,032 | ) | 294 | 4,546 | (3,604 | ) | 689 | |||||||||||||
| Depreciation and accretion |
21,177 | 22,566 | 83,180 | 49,027 | 39,424 | |||||||||||||||
|
|
|
|
|
|
|
|
|
|
|
|||||||||||
| EBITDA |
11,664 | 19,960 | 158,916 | 67,504 | 94,304 | |||||||||||||||
|
|
|
|
|
|
|
|
|
|
|
|||||||||||
| Unrealized loss (gain) on energy derivative |
7,733 | 6,803 | 11,272 | 6,951 | (17,577 | ) | ||||||||||||||
| Unrealized (gain) loss on interest rate derivatives |
3,723 | (1,931 | ) | (15,601 | ) | 4,953 | 345 | |||||||||||||
| Interest rate derivative settlements |
1,017 | — | 2,099 | — | — | |||||||||||||||
| Gain on transactions |
— | — | (5,995 | ) | (4,173 | ) | — | |||||||||||||
| Plus: proportionate share from equity accounted investments: |
||||||||||||||||||||
| Interest expense, net of interest income |
253 | (2 | ) | 267 | 44 | — | ||||||||||||||
| Tax benefit |
— | (36 | ) | (172 | ) | (65 | ) | — | ||||||||||||
| Depreciation and accretion |
187 | 1 | 20 | — | 186 | |||||||||||||||
| Unrealized (gain) loss on interest rate and currency derivatives |
12,595 | 9,783 | (9,076 | ) | 27 | — | ||||||||||||||
| Realized (gain) loss on interest rate and currency derivatives |
22 | (139 | ) | 39 | — | — | ||||||||||||||
|
|
|
|
|
|
|
|
|
|
|
|||||||||||
| Adjusted EBITDA |
$ | 37,194 | $ | 34,439 | $ | 141,769 | $ | 75,241 | $ | 77,258 | ||||||||||
|
|
|
|
|
|
|
|
|
|
|
|||||||||||
Cash Available for Distribution
We define cash available for distribution as net cash provided by operating activities as adjusted for certain other cash flow items that we associate with our operations. It is a non-U.S. GAAP measure of our ability to
47
Table of Contents
generate cash to service our dividends. Cash available for distribution represents cash provided by (used in) operating activities as adjusted to (i) add or subtract changes in operating assets and liabilities, (ii) subtract net deposits into restricted cash accounts, which are required pursuant to the cash reserve requirements of financing agreements, to the extent they are paid from operating cash flows during a period, (iii) subtract cash distributions paid to noncontrolling interests, which currently reflects the cash distributions to our joint venture partners in our Gulf Wind project in accordance with the provisions of its governing partnership agreement and will in the future reflect distribution to other joint venture partners, (iv) subtract scheduled project-level debt repayments in accordance with the related loan amortization schedule, to the extent they are paid from operating cash flows during a period, (v) subtract non-expansionary capital expenditures, to the extent they are paid from operating cash flows during a period, and (vi) add or subtract other items as necessary to present the cash flows we deem representative of our core business operations.
| Three Months ended March 31, |
Year ended December 31, | |||||||||||||||||||
| 2014 | 2013 | 2013 | 2012 | 2011 | ||||||||||||||||
| (U.S. dollars in thousands) | ||||||||||||||||||||
| Net cash provided by (used in) operating activities |
$ | 16,405 | $ | 8,391 | $ | 78,152 | $ | 35,051 | $ | 46,930 | ||||||||||
| Changes in current operating assets and liabilities |
6,651 | 12,695 | 8,237 | 6,885 | 3,237 | |||||||||||||||
| Network upgrade reimbursement |
618 | — | 1,854 | 6,263 | — | |||||||||||||||
| Use of operating cash to fund maintenance and debt reserves |
— | — | — | (1,047 | ) | (1,048 | ) | |||||||||||||
| Release of restricted cash to fund general and administrative costs |
54 | — | 318 | — | — | |||||||||||||||
| Operations and maintenance capital expenditures |
(54 | ) | — | (819 | ) | (623 | ) | (1,101 | ) | |||||||||||
| Less: |
||||||||||||||||||||
| Distributions to noncontrolling interests |
— | (168 | ) | (2,292 | ) | (1,298 | ) | (7,158 | ) | |||||||||||
|
|
|
|
|
|
|
|
|
|
|
|||||||||||
| Cash available for distribution before principal payments |
23,674 | 20,699 | 85,450 | 45,231 | 40,860 | |||||||||||||||
| Principal payments paid from operating cash flows(1) |
(5,830 | ) | (6,231 | ) | (42,829 | ) | (27,546 | ) | (22,330 | ) | ||||||||||
|
|
|
|
|
|
|
|
|
|
|
|||||||||||
| Cash available for distribution |
$ | 17,844 | $ | 14,468 | $ | 42,621 | $ | 17,685 | $ | 18,530 | ||||||||||
|
|
|
|
|
|
|
|
|
|
|
|||||||||||
| (1) | Excludes $7,495 of principal pre-payments on our Ocotillo project which were paid from ITC cash grant proceeds in 2013 |
48
Table of Contents
Results of Operations
The following discussion and analysis of financial condition and results of operations relate to our company and its predecessor presented as a single entity from the beginning of the earliest period presented. For periods prior to October 2, 2013, the Contribution Transaction date, our company was a shell company, with expenses of less than $10,000 for 2013 and 2012.
Three Months Ended March 31, 2014 Compared to Three Months Ended March 31, 2013
The following table provides selected financial information for the periods presented and is unaudited (U.S. dollars in thousands, except percentages):
| Three months ended March 31, |
||||||||||||||||
| 2014 | 2013 | $ Change | % Change | |||||||||||||
| Revenue |
$ | 49,549 | $ | 43,837 | $ | 5,712 | 13 | % | ||||||||
|
|
|
|
|
|
|
|
|
|||||||||
| Project expense |
16,074 | 12,977 | 3,097 | 24 | % | |||||||||||
| Depreciation and accretion |
21,177 | 22,566 | (1,389 | ) | -6 | % | ||||||||||
|
|
|
|
|
|
|
|
|
|||||||||
| Total cost of revenue |
37,251 | 35,543 | 1,708 | 5 | % | |||||||||||
|
|
|
|
|
|
|
|
|
|||||||||
| Gross profit |
12,298 | 8,294 | 4,004 | 48 | % | |||||||||||
|
|
|
|
|
|
|
|
|
|||||||||
| General and administrative |
3,903 | 144 | 3,759 | 2610 | % | |||||||||||
| Related party general and administrative |
1,280 | 2,662 | (1,382 | ) | -52 | % | ||||||||||
|
|
|
|
|
|
|
|
|
|||||||||
| Total operating expenses |
5,183 | 2,806 | 2,377 | 85 | % | |||||||||||
|
|
|
|
|
|
|
|
|
|||||||||
| Operating income |
7,115 | 5,488 | 1,627 | 30 | % | |||||||||||
| Total other expense |
(31,046 | ) | (23,978 | ) | (7,068 | ) | -29 | % | ||||||||
|
|
|
|
|
|
|
|
|
|||||||||
| Net loss before income tax |
(23,931 | ) | (18,490 | ) | (5,441 | ) | -29 | % | ||||||||
| Tax (benefit) provision |
(2,032 | ) | 294 | (2,326 | ) | -791 | % | |||||||||
|
|
|
|
|
|
|
|
|
|||||||||
| Net loss |
(21,899 | ) | (18,784 | ) | (3,115 | ) | -17 | % | ||||||||
| Net loss attributable to noncontrolling interest |
(7,010 | ) | (3,579 | ) | (3,431 | ) | -96 | % | ||||||||
|
|
|
|
|
|
|
|
|
|||||||||
| Net loss attributable to controlling interest |
$ | (14,889 | ) | $ | (15,205 | ) | $ | 316 | 2 | % | ||||||
|
|
|
|
|
|
|
|
|
|||||||||
MWh sold and average realized electricity price. We sold 652,521 MWh of electricity in the three months ended March 31, 2014 as compared to 603,633 MWh sold in the three months ended March 31, 2013. This increase in MWh sold during 2014 as compared to 2013 was primarily attributable to higher winds and the commencement of commercial operations on the final 42 megawatts at Ocotillo in July 2013, and includes our proportionate share of production at South Kent, our 50% owned unconsolidated investment, which reached commercial operations on March 28, 2014. Our average realized electricity price was approximately $87 per MWh in the three months ended March 31, 2014 as compared to approximately $84 per MWh in the three months ended March 31, 2013.
Although our electricity production was up 8% over the same period last year, it was lower than our expected long term average projections for the period. Weighted by our owned interest in our projects, our electricity production was about 5% below the expected production based on long-term average wind conditions. Particularly noteworthy was the low average wind in the western United States in late 2013 which continued into the first quarter of 2014 and which was partly the result of an unusual high pressure zone occurring within the region. The first quarter of 2014 wind conditions are, however, within the range of variability that has been measured in our seven operating wind regions over the last 35 years and, after considering these measured results, we have not changed our long-term wind forecast.
Revenue. Revenue for the three months ended March 31, 2014 was $49.6 million compared to $43.8 million for the three months ended March 31, 2013, an increase of $5.8 million, or approximately 13%. This increase in
49
Table of Contents
revenue for the three months ended March 31, 2014 as compared to the prior year was attributed to an increase of $8.6 million in electricity sales primarily attributable to higher winds during the period and the commencement of commercial operations on the final 42 megawatts at Ocotillo in July 2013. During the three months ended March 31, 2014, we recorded a $7.7 million unrealized loss on energy derivative compared to a $6.8 million unrealized loss in 2013. The value of our energy derivative, and the amount of unrealized gain or loss we record, increases and decreases due to our monthly derivative settlements and changes in forward electricity prices, which are derived from and impacted by changes in forward natural gas prices.
Cost of revenue. Cost of revenue for the three months ended March 31, 2014 was $37.3 million compared to $35.5 million for the three months ended March 31, 2013, an increase of $1.8 million, or approximately 4.8%. The increase in cost of revenue during 2014 as compared to 2013 was attributable to the commencement of commercial operations on the final 42 megawatts at Ocotillo in July 2013 and higher maintenance costs at our St. Joseph project, offset by a $1.4 million decrease in depreciation expense in 2014, as a result of receiving Ocotillo and Santa Isabel ITC grants during the second quarter of 2013. As each new project commences commercial operations, we incur new incremental and ongoing costs for maintenance and services agreements, property taxes, insurance, land lease and other costs associated with managing, operating and maintaining the facility, including adding site employees and other operations staff.
General and administrative costs. General and administrative costs for the three months ended March 31, 2014 was $3.9 million compared to $0.1 million for the three months ended March 31, 2013, an increase of $3.8 million. After the Contribution Transactions and the initial public offering in 2013, the Company has direct payroll costs and employee-related, audit and consulting expense costs, and other administrative expenses, that were previously allocated to the Company from Pattern Development and which were reflected in related party general and administrative expense. In addition, the Company has additional general and administrative costs, including $0.5 million of stock-based compensation expense, related to being a public company.
Related party general and administrative expense. Related party general and administrative expense for the three months ended March 31, 2014 was $1.3 million compared to $2.7 million for the three months ended March 31, 2013, a decrease of $1.4 million, or approximately 52%. After the Contribution Transactions and the initial public offering in 2013, the Company has direct payroll costs and employee-related, audit and consulting expense costs, and other administrative expenses, which has reduced the level of services provided by Pattern Development for the three months ended March 31, 2014 compared to the three months ended March 31, 2013.
Other expense. Other expense for the three months ended March 31, 2014 was $31.0 million compared to $24.0 million for the three months ended March 31, 2013. The increase of $7.0 million in other expense during 2014 as compared to 2013 was primarily attributable to a $5.7 million increase in unrealized loss on derivatives as our interest rate swaps on the Ocotillo project are not designated as hedges and there was a decrease in the forward interest rate curve which increases our liability and increases our unrealized loss on derivatives. In addition we had a $2.5 million increase in equity in losses in unconsolidated investments which was primarily related to certain interest rate derivatives on the unconsolidated investee’s financial statements that are not designated as hedges; the decrease in the forward interest rate curve during the three months ended March 31, 2014 increased their unrealized loss on derivatives and in turn increased our equity in losses in unconsolidated investments. In addition, in 2014, we had a $1.0 million increase in interest rate derivative settlements as a portion of our interest rate swaps on the Ocotillo project are not designated as hedges and therefore our settlements on these derivatives are recorded as interest rate derivative settlements in other expense. Offsetting these increased losses is a $2.0 million decrease in interest expense primarily related to our 2013 repayment of the Ocotillo and Santa Isabel bridge loans.
Tax provision. The tax provision was a $2.0 million benefit for the three months ended March 31, 2014 compared to $0.3 million provision for the same period in the prior year. The benefit for the three months ended March 31, 2014 was primarily the result of recording equity in losses in unconsolidated investments which were primarily related to interest rate swaps that are not designated as hedges.
50
Table of Contents
Noncontrolling interest. The net loss attributable to noncontrolling interest was $7.0 million for the three months ended March 31, 2014 compared to a $3.6 million loss attributable to noncontrolling interest for the three months ended March 31, 2013. The noncontrolling interest income or loss calculation is based on the hypothetical liquidation at book value method of accounting for the earnings attributable to the noncontrolling interest’s ownership in Gulf Wind. The higher loss allocation for the three months ended March 31, 2014 is primarily attributable to the period over period increase in Gulf Wind’s unrealized loss on energy derivative and lower electricity sales during the three months ended March 31, 2104 as well as the retention by Pattern Development of an approximate 27% interest in Gulf Wind in connection with the Contribution Transactions which occurred on October 2, 2013.
Adjusted EBITDA. Adjusted EBITDA for the three months ended March 31, 2014 was $37.2 million compared to $34.4 million for the same period in the prior year, an increase of $2.8 million. The increase in Adjusted EBITDA during 2014 as compared to 2013 was primarily attributable to higher period over period electricity sales.
Year Ended December 31, 2013 Compared to Year Ended December 31, 2012
The following table provides selected financial information for the periods presented (U.S. dollars in thousands, except percentages):
| Year ended December 31, | ||||||||||||||||
| 2013 | 2012 | $ Change | % Change | |||||||||||||
| Revenue |
$ | 201,573 | $ | 114,528 | $ | 87,045 | 76 | % | ||||||||
|
|
|
|
|
|
|
|||||||||||
| Project expense |
57,677 | 34,843 | 22,834 | 66 | ||||||||||||
| Depreciation and accretion |
83,180 | 49,027 | 34,153 | 70 | ||||||||||||
|
|
|
|
|
|
|
|||||||||||
| Total cost of revenue |
140,857 | 83,870 | 56,987 | 68 | ||||||||||||
|
|
|
|
|
|
|
|||||||||||
| Gross profit |
60,716 | 30,658 | 30,058 | 98 | ||||||||||||
|
|
|
|
|
|
|
|||||||||||
| Development expense |
— | 174 | (174 | ) | (100 | ) | ||||||||||
| General and administrative |
4,819 | 858 | 3,961 | 462 | ||||||||||||
| Related party general and administrative |
8,169 | 10,604 | (2,435 | ) | (23 | ) | ||||||||||
|
|
|
|
|
|
|
|||||||||||
| Total operating expenses |
12,988 | 11,636 | 1,352 | 12 | ||||||||||||
|
|
|
|
|
|
|
|||||||||||
| Operating income |
47,728 | 19,022 | 28,706 | 151 | ||||||||||||
| Total other expense |
(33,110 | ) | (36,002 | ) | 2,892 | 8 | ||||||||||
|
|
|
|
|
|
|
|||||||||||
| Net income (loss) before income tax |
14,618 | (16,980 | ) | 31,598 | 186 | |||||||||||
| Tax provision (benefit) |
4,546 | (3,604 | ) | 8,150 | (226 | ) | ||||||||||
|
|
|
|
|
|
|
|||||||||||
| Net income (loss) |
10,072 | (13,376 | ) | 23,448 | 175 | |||||||||||
| Net loss attributable to noncontrolling interest |
(6,887 | ) | (7,089 | ) | 202 | 3 | ||||||||||
|
|
|
|
|
|
|
|||||||||||
| Net income (loss) attributable to controlling interest |
$ | 16,959 | $ | (6,287 | ) | $ | 23,246 | 370 | % | |||||||
|
|
|
|
|
|
|
|||||||||||
MWh sold and average realized electricity price. We sold 2,258,811 MWh of electricity in the year ended December 31, 2013 as compared to 1,673,413 MWh sold in the year ended December 31, 2012. This increase in MWh sold during 2013 as compared to 2012 was primarily attributable to the commencement of commercial operations at Spring Valley in August 2012 and at Santa Isabel and Ocotillo in December 2012. Our average realized electricity price was approximately $84 per MWh in the year ended December 31, 2013 as compared to approximately $73 per MWh in the year ended December 31, 2012. The average realized electricity price in 2013 was higher than the comparable period in 2012 because the pricing terms under the Spring Valley, Santa Isabel and Ocotillo project PPAs are each higher than our overall average realized price applicable in 2012. Although our electricity production was up 35% over the same period last year, it was lower than our expected long term average in 2013. After adjusting for equipment downtime which is reimbursable by the vendor, our electricity
51
Table of Contents
production was about 9% below the expected production based on long-term average wind conditions. The 2013 wind conditions are, however, within the range of variability that has been measured in our six operating wind regions over the last 35 years and, after considering these measured results, we have not changed our long-term wind forecast. Particularly noteworthy was the low average wind in the western United States in 2013 which was partly the result of a high pressure zone towards the end of 2013.
Revenue. Revenue for the year ended December 31, 2013 was $201.6 million compared to $114.5 million for the year ended December 31, 2012, an increase of $87.1 million, or approximately 76%. This increase in revenue during 2013 as compared to 2012 was the result of an increase of $71.5 million in electricity sales primarily attributable to the commencement of commercial operations at Spring Valley in August 2012 and at Santa Isabel and Ocotillo in December 2012. Also during the year ended December 31, 2013, we recorded other revenue of $21.9 million related to warranty settlement payments we received from a turbine supplier during the period as a result of the turbines at the Ocotillo and Santa Isabel projects being off line for a portion of the period. The increase in electricity sales in 2013 as compared to 2012 was offset by a decrease of $4.3 million in period-over-period revenue due to energy derivative valuation. In 2013, we recorded a $11.3 million unrealized loss on energy derivative compared to a $7.0 million unrealized loss in 2012. The value of our energy derivative, and the amount of unrealized gain or loss we record, increases and decreases due to our monthly derivative settlements and changes in forward electricity prices, which are derived from and impacted by changes in forward natural gas prices.
Cost of revenue. Cost of revenue for the year ended December 31, 2013 was $140.9 million compared to $83.9 million for the year ended December 31, 2012, an increase of $57.0 million, or approximately 68%. The increase in cost of revenue during 2013 as compared to 2012 was primarily attributable to the commencement of commercial operations at Spring Valley in August 2012 and at Santa Isabel and Ocotillo in December 2012 with depreciation and accretion contributing $34.2 million of the $57.0 million increase in 2013 as compared to 2012. As each new project commences commercial operations, we incur new incremental and ongoing costs for maintenance and services agreements, property taxes, insurance, land lease and other costs associated with managing, operating and maintaining the facility, including adding site employees and operations center staff.
General and administrative expense. General and administrative expense for the year ended December 31, 2013 was $4.8 million compared to $0.9 million for the year ended December 31, 2012, an increase of $3.9 million, or approximately 462%. After the Contribution Transactions and the initial public offering, our company has direct payroll costs and employee-related, audit and consulting expenses costs, and other administrative costs that were previously allocated to our company from Pattern Development and which were reflected in related party general and administrative expense. In addition, our company has additional general and administrative costs related to being a public company, such as directors fees.
Related party general and administrative expense. Related party general and administrative expense for the year ended December 31, 2013 was $8.2 million compared to $10.6 million for the year ended December 31, 2012, a decrease of $2.4 million, or approximately 23%, resulting primarily from lower cash bonus expense in 2013, as compared to 2012, offset by the increased staffing and overhead costs related to commercial operations commencing at Spring Valley, Santa Isabel and Ocotillo as well as our ownership in El Arrayán and South Kent as construction on these projects advanced in 2013.
Other expense. Other expense for the year ended December 31, 2013 was $33.1 million compared to $36.0 million for the year ended December 31, 2012. The decrease of $2.9 million in other expense during 2013, as compared to 2012, was primarily related to a $7.9 million increase in equity in earnings in unconsolidated investments, which was primarily attributable to interest rate swaps that were entered into during 2013, which were deemed to be derivatives and not designated as hedges. The gain on these interest rate swaps was attributable to an increase in the forward interest rate curve after these interest rate swaps were entered into. In addition, there was a $20.6 million increase in unrealized gain on derivatives as a portion of our interest rate swaps on the Ocotillo project are not designated as hedges and there was an increase in the forward interest rate
52
Table of Contents
curve, which decreases our liability under these interest rate swaps and increases our unrealized gain on derivatives. During the year ended December 31, 2013 we also recorded a $7.2 million gain on the sale of Puerto Rico tax credits at the Santa Isabel project and $1.2 million of transaction expense related to our acquisition of the Grand and Panhandle 2 projects as compared to a $4.2 million gain on the sale of a portion of the El Arrayán project in 2012. Offsetting these gains was a $27.1 million increase in interest expense in 2013 attributable to the commencement of commercial operations at Spring Valley in August 2012 and at Santa Isabel and Ocotillo in December 2012 and the resultant cessation of interest capitalization and treatment of interest as expense under the related facilities.
Tax provision. The tax provision was $4.5 million for the year ended December 31, 2013 compared to a $3.6 million benefit for the year ended December 31, 2012. The 2012 benefit was principally the result of the Santa Isabel project holding company being subject to U.S. income taxes and the impact of receipt of a U.S. Treasury cash grant by the Santa Isabel project on a stand-alone basis in 2012, which then required a valuation allowance in 2013 as the Santa Isabel project is included in our company’s consolidated U.S. income tax return as a result of the Contribution Transactions.
Noncontrolling interest. The allocation to noncontrolling interest was a $6.9 million loss for the year ended December 31, 2013 compared to $7.1 million of loss for the year ended December 31, 2012. The noncontrolling interest income or loss calculation is based on the hypothetical liquidation at book value method of accounting for the earnings attributable to the noncontrolling interests’ ownership in Gulf Wind.
Adjusted EBITDA. Adjusted EBITDA for the year ended December 31, 2013 was $141.8 million compared to $75.2 million for the year ended December 31, 2012, an increase of $66.6 million. The increase in Adjusted EBITDA during 2013 as compared to 2012 was primarily attributable to the commencement of operations at Spring Valley in August 2012 and at Santa Isabel and Ocotillo in December 2012. For a reconciliation of net income to Adjusted EBITDA, see “—Key Metrics—Adjusted EBITDA.”
Year Ended December 31, 2012 Compared to Year Ended December 31, 2011
The following table provides selected financial information for the periods presented (U.S. dollars in thousands, except percentages):
| Year ended December 31, | ||||||||||||||||
| 2012 | 2011 | $ Change | % Change | |||||||||||||
| Revenue |
$ | 114,528 | $ | 135,859 | ($ | 21,331 | ) | 16 | % | |||||||
|
|
|
|
|
|
|
|||||||||||
| Project expense |
34,843 | 31,343 | 3,500 | 11 | ||||||||||||
| Depreciation and accretion |
49,027 | 39,424 | 9,603 | 24 | ||||||||||||
|
|
|
|
|
|
|
|||||||||||
| Total cost of revenue |
83,870 | 70,767 | 13,103 | 19 | ||||||||||||
|
|
|
|
|
|
|
|||||||||||
| Gross profit |
30,658 | 65,092 | (34,434 | ) | (53 | ) | ||||||||||
|
|
|
|
|
|
|
|||||||||||
| Development expense |
174 | 704 | (530 | ) | (75 | ) | ||||||||||
| General and administrative |
858 | 866 | (8 | ) | (1 | ) | ||||||||||
| Related party general and administrative |
10,604 | 8,098 | 2,506 | 31 | ||||||||||||
|
|
|
|
|
|
|
|||||||||||
| Total operating expense |
11,636 | 9,668 | 1,968 | 20 | ||||||||||||
|
|
|
|
|
|
|
|||||||||||
| Operating income |
19,022 | 55,424 | (36,402 | ) | (66 | ) | ||||||||||
| Total other expenses |
(36,002 | ) | (28,829 | ) | (7,173 | ) | 25 | |||||||||
|
|
|
|
|
|
|
|||||||||||
| Net (loss) income before income tax |
(16,980 | ) | 26,595 | (43,575 | ) | (164 | ) | |||||||||
| Tax (benefit) provision |
(3,604 | ) | 689 | (4,293 | ) | 623 | ||||||||||
|
|
|
|
|
|
|
|||||||||||
| Net (loss) income |
(13,376 | ) | 25,906 | (39,282 | ) | (152 | ) | |||||||||
| Net (loss) income attributable to noncontrolling interest |
(7,089 | ) | 16,981 | (24,070 | ) | (142 | ) | |||||||||
|
|
|
|
|
|
|
|||||||||||
| Net (loss) income attributable to controlling interest |
($ | 6,287 | ) | $ | 8,925 | ($ | 15,212 | ) | (170 | )% | ||||||
|
|
|
|
|
|
|
|||||||||||
53
Table of Contents
MWh sold and average realized electricity price. We sold 1,673,413 MWh of electricity in the year ended December 31, 2012 as compared to 1,568,022 MWh in the year ended December 31, 2011. This increase in MWh sold during 2012 as compared to 2011 was primarily attributable to a full year of operations at St. Joseph as compared to a partial year in 2011 as St. Joseph commenced commercial operations in April 2011. In 2012, we also began commercial operations at Spring Valley in August 2012 and at Santa Isabel and Ocotillo in December 2012. These increases were offset by lower production at our Gulf Wind and Hatchet Ridge projects primarily due to lower winds in 2012 compared to 2011. Our average realized electricity price was approximately $73 per MWh in the year ended December 31, 2012 as compared to approximately $75 per MWh in the year ended December 31, 2011.
Revenue. Revenue for the year ended December 31, 2012 was $114.5 million compared to $135.9 million for the year ended December 31, 2011, a decrease of $21.4 million, or approximately 16%. The decrease in revenue during 2012 as compared to 2011 was attributable to a net decrease of $16.8 million due to lower spot electricity prices applicable to Gulf Wind and a decrease of $24.6 million due to energy derivative valuation, offset by an increase of approximately $20.0 million in revenue from other projects. The Gulf Wind project received higher spot market electricity prices in 2011 than in 2012, including unusually high prices which exceeded $2,000 per MWh for a total of approximately 24 hours during 2011. The lower spot prices in 2012 reduced our electricity sales at the Gulf Wind project by approximately $26.9 million and increased our energy derivative settlements by approximately $10.1 million, for a net reduction of approximately $16.8 million in 2012. In addition, in 2012, we recorded a $7.0 million unrealized loss on energy derivative compared to a $17.6 million unrealized gain in 2011, resulting in a decrease in year-over-year revenue of $24.6 million in 2012. The value of our energy derivative, and the amount of unrealized gain or loss we record, increases and decreases due to our monthly derivative settlements and changes in forward electricity prices, which are derived from and impacted by changes in forward natural gas prices. These revenue decreases in 2012 were partially offset by increased electricity sales of approximately $20.0 million resulting from a full year of electricity sales at St. Joseph in 2012, which commenced commercial operations in April 2011, and electricity sales at Spring Valley, which commenced commercial operations in August 2012, and at Santa Isabel and Ocotillo, which both commenced commercial operations in December 2012.
Cost of revenue. Cost of revenue for the year ended December 31, 2012 was $83.9 million compared to $70.8 million for the year ended December 31, 2011, an increase of $13.1 million, or approximately 19%. The increase in cost of revenue during 2012 as compared to 2011 was attributable to a full year of costs at St. Joseph following the commencement of commercial operations in April 2011 and costs attributable to the commencement of commercial operations at Spring Valley in August 2012 and at Santa Isabel and Ocotillo in December 2012. As each new project commences commercial operations, we incur new incremental and ongoing costs for maintenance and services agreements, property taxes, insurance, land lease and other costs associated with managing, operating and maintaining the facility, including adding site employees and operations center staff.
Development expenses. Development expenses for the year ended December 31, 2012 were $0.2 million compared to $0.7 million for the year ended December 31, 2011, a decrease of $0.5 million, or approximately 71%. The decrease in development expenses was primarily attributable to our determination that development expenses related to El Arrayán should be capitalized starting in the first quarter of 2012.
Related party general and administrative expense. Related party general and administrative expense for the year ended December 31, 2012 was $10.6 million compared to $8.1 million for the year ended December 31, 2011, an increase of $2.5 million, or approximately 31%, resulting primarily from the increased staffing and overhead costs related to commercial operations commencing at Spring Valley, Santa Isabel and Ocotillo as well as our ownership in El Arrayán and South Kent as construction and development, respectively, on the projects advanced in 2012.
Other expense. Other expense for the year ended December 31, 2012 was $36.0 million compared to $28.8 million for the year ended December 31, 2011. The increase in other expense during 2012 as compared to 2011
54
Table of Contents
was primarily attributable to a $7.1 million, or approximately 25%, increase in interest expense in 2012 reflecting a full year of interest expense at St. Joseph following the commencement of commercial operations in April 2011 and interest expense attributable to the commencement of commercial operations at Spring Valley in August 2012 and at Santa Isabel and Ocotillo in December 2012. In 2012, we also had a $4.6 million increase in unrealized loss on derivatives as a portion of our interest rate swaps on the Ocotillo project are not designated as hedges and, during the period after the closing of the Ocotillo financing and entering into these interest rate swaps in October 2012, there was a decrease in the forward interest rate curve which increases our liability under these interest rate swaps and increases our unrealized loss on derivatives. These increased costs in 2012 were offset by a $4.2 million gain on the sale of a portion of our investment in El Arrayán in 2012.
Tax provision. The tax provision was a $3.6 million benefit for the year ended December 31, 2012 compared to $0.7 million for the year ended December 31, 2011. This was principally the result of the Santa Isabel project holding company being subject to U.S. income taxes at the end of 2012 but not during 2011.
Noncontrolling interest. The net loss attributable to noncontrolling interest was a $7.1 million for the year ended December 31, 2012 compared to a $17.0 million of income for the year ended December 31, 2011. The noncontrolling interest income or loss calculation is based on the hypothetical liquidation at book value method of accounting for the earnings attributable to the noncontrolling interest’s ownership in Gulf Wind, and 2011 was favorably impacted by unusually high power prices during the year.
Adjusted EBITDA. Adjusted EBITDA for the year ended December 31, 2012 was $75.2 million compared to $77.3 million for the year ended December 31, 2011, a decrease of $2.1 million. The decrease in Adjusted EBITDA during 2012 as compared to 2011 was primarily attributable to higher spot electricity prices at our Gulf Wind project in 2011, including unusually high prices which exceeded $2,000 per MWh for approximately 24 hours during 2011 (contrasted with an average spot-market electricity price of $25.31/MWh received at Gulf Wind in 2012) and which were not repeated in 2012; the absence of this unexpected incremental electricity revenue in 2012 was partially offset by additional revenue, net of project expense, that was earned following commencement of operations at our Spring Valley, Santa Isabel and Ocotillo projects in 2012 and from a full year of operations at our St. Joseph project. For a reconciliation of net income to Adjusted EBITDA, see “—Key Metrics—Adjusted EBITDA.”
Liquidity and Capital Resources
Our business requires substantial capital to fund (i) equity investments in our construction projects, (ii) current operational costs, (iii) debt service payments, (iv) dividends to our shareholders, (v) potential investments in new acquisitions (vi) modifications to our projects, (vii) unforeseen events and (viii) other business expenses. As a part of our liquidity strategy, we plan to retain a portion of our cash flows in above-average wind years in order to have additional liquidity in below-average wind years. Our sources of liquidity include cash generated by our operations, cash reserves, borrowings under our corporate and project-level credit agreements and further issuances of equity and debt securities.
The principal indicators of our liquidity are our restricted and unrestricted cash balances and availability under our credit agreements. As of March 31, 2014, our available liquidity was $324.1 million, including restricted cash on hand of $35.4 million, unrestricted cash on hand of $100.3 million, $188.4 million available under our revolving credit agreements and $90.5 million available under project financings for post construction use.
We believe that throughout 2014, we will have sufficient liquid assets, cash flows from operations, and borrowings available under our revolving credit facility to meet our financial commitments, debt service obligations, contingencies and anticipated required capital expenditures for at least the next 24 months, without taking into account capital required for additional project acquisitions. Additionally, we believe that our construction projects have been sufficiently capitalized such that we will not need to seek additional financing
55
Table of Contents
arrangements in order to complete construction and achieve commercial operations at these projects. However, we are subject to business and operational risks that could adversely affect our cash flow. A material decrease in our cash flows would likely produce a corresponding adverse effect on our borrowing capacity. In connection with our future capital expenditures and other investments, including any project acquisitions that we may make in addition to our acquisitions of the Panhandle 1 and Panhandle 2 projects, for which we have committed $125.0 million and $122.9 million, respectively, we may, from time to time, issue debt or equity securities.
Cash Flows
We use traditional measures of cash flows, including net cash provided by operating activities, net cash used in investing activities and net cash provided by financing activities as well as cash available for distribution to evaluate our periodic cash flow results.
Three Months Ended March 31, 2014 Compared to Three Months Ended March 31, 2013
Net cash provided by operating activities was $16.4 million for the three months ended March 31, 2014 as compared to $8.4 million for the same period in the prior year. This increase in cash provided by operating activities was primarily the result of higher production in 2014 and a $2.0 million decrease in interest expense primarily related to our 2013 repayment of the Ocotillo and Santa Isabel bridge loans. Offsetting these increases was a $3.0 million increase in project expense related primarily to the commencement of commercial operations on the final 42 megawatts at Ocotillo and maintenance repairs at our St. Joseph facility, and a $1.0 million increase in interest rate derivative settlements as a portion of our interest rate swaps on the Ocotillo project are not designated as hedges and therefore our settlements on these derivatives are recorded as interest rate derivative settlements in other expense.
Net cash provided by investing activities was $1.4 million for the three months ended March 31, 2014, which consisted primarily of $1.4 million receipt related to our reimbursable interconnection receivable. Net cash used in investing activities was $60.7 million for the three months ended March 31, 2013, which consisted of $67.2 million of capital expenditures primarily at Ocotillo, $5.2 million for interconnection network upgrades primarily at our Ocotillo project, and net cash receipts of $11.1 million related to the investment in and project financing at South Kent.
Net cash used in financing activities for the three months ended March 31, 2014 was $20.7 million, which was primarily attributable to an $11.1 million dividend payment, a $3.0 million increase in restricted cash, and $5.8 million of loan repayments. Net cash provided by financing activities for the three months ended March 31, 2013 was $64.3 million, which was primarily attributable to $21.4 million of capital contributions and $78.0 million of loan borrowings at Santa Isabel and Ocotillo, offset by $23.6 million of capital distributions and $6.2 million of loan repayments.
Cash available for distribution was $17.8 million for the three months ended March 31, 2014 as compared to $14.5 million for the same period in the prior year. This increase in cash available for distribution was primarily the result of higher production in 2014 and a $2.0 million decrease in interest expense primarily related to our 2013 repayment of the Ocotillo and Santa Isabel bridge loans. Offsetting these increases was a $3.0 million increase in project expense related primarily to the commencement of commercial operations on the final 42 megawatts at Ocotillo and maintenance repairs at our St. Joseph facility, and a $1.0 million increase in interest rate derivative settlements as a portion of our interest rate swaps on the Ocotillo project are not designated as hedges and therefore our settlements on these derivatives are recorded as interest rate derivative settlements in other expense.
Year Ended December 31, 2013 Compared to Year Ended December 31, 2012
Net cash provided by operating activities was $78.2 million for the year ended December 31, 2013 as compared to $35.1 million for the year ended December 31, 2012. Electricity sales were $71.5 million higher
56
Table of Contents
during 2013 as compared to 2012, which was primarily attributable to the commencement of commercial operations at Spring Valley in August 2012 and at Santa Isabel and Ocotillo in December 2012. Also during the year ended December 31, 2013, we recorded other revenue of $21.9 million related to non-refundable warranty settlement payments we received from a turbine supplier during the period as a result of the turbines at the Ocotillo and Santa Isabel projects being off line for a portion of the period. Offsetting these increases in electricity sales and other revenue is an $8.7 million increase in the period-over-period reduction of cash flow provided by operations related to an increase in trade receivables consistent with our terms under the power sales agreements, a period-over-period increase of $19.4 million in project expenses, and a period-over-period increase in cash interest expense of $22.8 million.
Net cash provided by investing activities was $72.4 million for the year ended December 31, 2013, which consisted of $173.4 million of ITC grant proceeds at Ocotillo and Santa Isabel, $14.3 million of proceeds from the sale of investments and tax credits, and a net reduction in our reimbursable interconnection receivable of $49.7 million, offset by $123.5 million of capital expenditures primarily at Ocotillo and Santa Isabel and a funding of restricted cash primarily at Ocotillo under the credit agreement. Net cash used in investing activities was $639.0 million for the year ended December 31, 2012, which consisted of $641.4 million of capital expenditures at Spring Valley, Santa Isabel and Ocotillo, $22.4 million of investments in our unconsolidated investments, and $47.1 million in net payments for interconnection network upgrades primarily at our Ocotillo project offset by ITC cash grant proceeds of $79.9 million.
Net cash used in financing activities for the year ended December 31, 2013 was $63.4 million, which was attributable to $317.9 million of net initial public offering proceeds, $138.6 million of loan proceeds primarily at Santa Isabel and Ocotillo and $32.7 million of capital contributions prior to the initial public offering offset by $232.6 million of distributions to Pattern Development in conjunction with the Contribution Transactions, $49.4 million related to the acquisition of Grand from Pattern Development, repayment of $114.1 million of construction and bridge loans at Santa Isabel and Ocotillo, $98.9 million of capital distributions prior to our initial public offering, and $50.3 million of long-term debt repayments. Net cash provided by financing activities for the year ended December 31, 2012 was $573.2 million which was primarily attributable to $281.5 million of capital contributions, $497.2 million of loan borrowings at Spring Valley, Santa Isabel and Ocotillo, offset by $80.9 million of loan repayments and $114.2 million of capital distributions.
Cash available for distribution was $42.6 million for the year ended December 31, 2013 as compared to $17.7 million for the year ended December 31, 2012, an increase of $24.9 million. This increase in cash available for distribution was the result of higher electricity sales of $71.5 million, which was primarily attributable to the commencement of commercial operations at Spring Valley in August 2012, and at Santa Isabel and Ocotillo in December 2012. Also, during the year ended December 31, 2013, we recorded other revenue of $21.9 million related to warranty settlement payments we received from a turbine supplier during the period as a result of the turbines at the Ocotillo and Santa Isabel projects being off line for a portion of the period. Offsetting these increases in electricity sales and other revenue is a period-over-period increase of $19.4 million in project expenses, a period-over-period increase in cash interest expense of $22.8 million, a $15.3 million increase in principal payments from operating cash flows as the additional projects commenced operations in late 2012 and a $4.4 million increase in network upgrade reimbursements. For a reconciliation of net cash provided by operating activities to cash available for distribution, see “—Key Metrics—Cash Available for Distribution.”
Year Ended December 31, 2012 Compared to Year Ended December 31, 2011
Net cash provided by operating activities was $35.1 million for the year ended December 31, 2012 as compared to $46.9 million for the year ended December 31, 2011. This decrease in cash provided by operating activities was primarily the result of lower revenue in 2012 at our Gulf Wind project as a result of receiving higher spot market electricity prices in 2011 than in 2012, including unusually high prices which exceeded $2,000 per MWh for approximately 24 hours during 2011. The lower revenue at Gulf Wind during 2012 as compared to 2011 was partially offset by increased electricity sales from a full year of operations at St. Joseph
57
Table of Contents
following its commencement of commercial operations in April 2011 and electricity sales following the commencement of commercial operations at Spring Valley in August 2012 and at Santa Isabel and Ocotillo in December 2012.
Net cash used in investing activities was $639.0 million for the year ended December 31, 2012, which consisted of $641.4 million of capital expenditures at Spring Valley, Santa Isabel and Ocotillo, $22.4 million of investments in our unconsolidated investments, and $47.1 million in net payments for interconnection network upgrades primarily at our Ocotillo project offset by ITC cash grant proceeds of $79.9 million. Net cash used in investing activities was $341.0 million for the year ended December 31, 2011, which consisted of $392.2 million of capital expenditures at St. Joseph, Spring Valley, Santa Isabel and Ocotillo and offset by the collection on our $80.3 million notes receivable at Hatchet Ridge.
Net cash provided by financing activities for the year ended December 31, 2012 was $573.2 million, which was primarily attributable to $281.5 million of capital contributions, $497.2 million of loan borrowings at Spring Valley, Santa Isabel and Ocotillo, offset by $80.9 million of loan repayments and $114.2 million of capital distributions. Net cash provided by financing activities for the year ended December 31, 2011 was $331.3 million, which was primarily attributable to $260.8 million of loan proceeds related to construction of St. Joseph, Spring Valley and Santa Isabel and $232.3 million of capital contribution, offset by $121.4 million of capital distributions.
Cash available for distribution was $17.7 million for the year ended December 31, 2012 as compared to $18.5 million for the year ended December 31, 2011. This decrease in cash available for distribution was primarily the result of higher spot electricity prices at our Gulf Wind project in 2011, including unusually high prices which exceeded $2,000 per MWh for approximately 24 hours during 2011 and which were not repeated in 2012; the loss of this unexpected incremental electricity revenue was partially offset by additional revenue, net of project expense, that was earned following commencement of operations at our Spring Valley, Santa Isabel and Ocotillo projects in 2012 and from a full year of operations at our St. Joseph project, $6.3 million of network upgrade reimbursements in 2012 and a decrease of $5.9 million in distributions to our noncontrolling interest in 2012 as compared to 2011. For a reconciliation of net cash provided by operating activities to cash available for distribution, see “—Key Metrics—Cash Available for Distribution.”
Capital Expenditures and Investments
We currently own only those projects that we acquired through the Contribution Transactions and those which we additionally acquired or agreed to acquire from Pattern Development. Each of the acquired project entities has secured all of the required project equity needed to complete the construction and achieve commercial operations at our construction projects and funding for all remaining planned construction costs, including contingency allowances, is available under financing commitments from project lenders. All capital expenditures and investments in 2013 have either been funded by Pattern Development or are available from project finance lenders under project-level credit facilities. For 2013, total capital expenditures were $123.5 million. For 2014, we do not expect to make capital expenditures at our construction projects as these projects are held in joint ventures for which we use the equity method of accounting.
We expect to make investments in additional projects. Although we have no commitments to make any such acquisitions, other than the acquisitions of the Panhandle 1 and Panhandle 2 projects, we consider it reasonably likely that we may have the opportunity to acquire certain Pattern Development near-term projects under our Project Purchase Rights within the 24 month period following December 31, 2013. We have agreed to make a cash payment to Pattern Development in the amount of $125 million, subject to certain price adjustments based on final project size, design and modeling assumptions, at the time of the Panhandle 1 acquisition, which we expect to occur shortly after its commencement of commercial operations, which we expect to occur in June 2014. We have also agreed to make a cash payment to Pattern Development in the amount of $122.9 million, subject to certain price adjustments based on final project size, design and modeling assumptions, at the time of
58
Table of Contents
the Panhandle 2 acquisition, which we expect to occur in the fourth quarter of 2014. We believe that we will have sufficient cash and revolving credit facility capacity to complete the Panhandle 1 and Panhandle 2 acquisitions, but this may be affected by any other acquisitions or investments that we make prior to the acquisitions of the Panhandle 1 and/or Panhandle 2 projects. To the extent that we make any such investments or acquisitions, we will evaluate capital markets and other corporate financing sources available to us at the time.
In addition, we will make investments from time to time at our operating projects. Operational capital expenditures are those capital expenditures required to maintain our long-term operating capacity. Capital expenditures for the projects are generally made at the project level using project cash flows and project reserves, although funding for major capital expenditures may be provided by additional project debt or equity. Therefore, the distributions that we receive from the projects may be made net of certain capital expenditures needed at the projects.
For the year ending December 31, 2014, we have budgeted $0.9 million for operational capital expenditures and $1.9 million for expansion capital expenditures.
Credit Agreements
See “Management’s Discussion & Analysis of Financial Condition and Results of Operations—Description of Credit Agreements” in our 2013 Form 10-K for a further discussion of the terms of our credit agreements.
Contractual Obligations
The following table summarizes our contractual obligations as of December 31, 2013 (U.S. dollars in thousands):
| Contractual Obligations |
Total | Less Than 1 Year |
1-3 Years | 3-5 Years | More Than 5 Years |
|||||||||||||||
| Long term debt principal payments |
$ | 1,249,218 | $ | 48,851 | $ | 119,330 | $ | 128,118 | $ | 952,919 | ||||||||||
| Long term debt interest payments |
532,719 | 57,236 | 106,949 | 96,811 | 271,722 | |||||||||||||||
| Purchase commitments |
4,128 | 4,128 | — | — | — | |||||||||||||||
| Land leases |
110,500 | 3,713 | 7,442 | 7,469 | 91,876 | |||||||||||||||
| Turbine operations and maintenance |
25,109 | 16,465 | 6,033 | 2,020 | 591 | |||||||||||||||
| Asset retirement obligations |
20,834 | — | — | — | 20,834 | |||||||||||||||
| Panhandle 2 acquisition commitment |
122,900 | 122,900 | — | — | — | |||||||||||||||
|
|
|
|
|
|
|
|
|
|
|
|||||||||||
| Total |
$ | 2,065,408 | $ | 253,293 | $ | 239,754 | $ | 234,418 | $ | 1,337,942 | ||||||||||
|
|
|
|
|
|
|
|
|
|
|
|||||||||||
Off-Balance Sheet Arrangements
We are not a party to any off-balance sheet arrangements.
Critical Accounting Policies and Estimates
Our discussion and analysis of our financial condition and results of operations are based on our consolidated historical financial statements that are incorporated by reference from our 2013 Form 10K, which have been prepared in accordance with U.S. GAAP. In applying the critical accounting policies set forth below, our management uses its judgment to determine the appropriate assumptions to be used in making certain estimates. These estimates are based on management’s experience, the terms of existing contracts, management’s observance of trends in the wind power industry, information provided by our power purchasers and information available to management from other outside sources, as appropriate. These estimates are subject to an inherent degree of uncertainty.
59
Table of Contents
We use estimates, assumptions and judgments for certain items, including the depreciable lives of property, plant and equipment, impairment of long-lived assets, asset retirement obligations, derivatives, income taxes, revenue recognition, certain components of cost of revenue and exemptions, stock-based compensation and reduced reporting requirements provided by the JOBS Act. These estimates, assumptions and judgments are derived and continually evaluated based on available information, experience and various assumptions we believe to be reasonable under the circumstances. To the extent these estimates are materially incorrect and need to be revised, our operating results may be materially adversely affected.
Property, Plant and Equipment
Property, plant and equipment represents the costs of completed and operational projects transferred from construction in progress as well as land, computer equipment and software, furniture and fixtures, leasehold improvements and other equipment. Property, plant and equipment are stated at cost, less accumulated depreciation. Depreciation is calculated using the straight-line method over the assets’ useful lives. Wind power projects are depreciated over 20 years and the remaining assets are depreciated over three to five years. Land is not depreciated. Improvements to Property, plant and equipment represents the costs of completed and operational projects transferred from construction in property, plant and equipment deemed to extend the useful economic life of an asset are capitalized. Repair and maintenance costs are expensed as incurred.
Derivatives
We have, and we intend to, enter into derivative transactions for the purpose of reducing exposure to fluctuations in interest rates, electricity prices and foreign currency exchange rates. We entered into fixed for floating interest rate swap agreements and have designated these derivatives as qualified cash flow hedges of its expected interest payments on variable rate debt. We have also entered into interest rate caps.
We recognize our derivative instruments at fair value in the consolidated balance sheet. Accounting for changes in the fair value (i.e., gains or losses) of a derivative instrument depends on whether the derivative instrument has been designated as part of a hedging relationship and on the type of hedging relationship.
For derivative instruments that are designated as cash flow hedges the effective portion of change in fair value of the derivative is reported as a component of other comprehensive income. The ineffective portion of change in fair value is recorded as a component of net income on the consolidated statement of operations.
For undesignated derivative instruments their change in fair value is reported as a component of net income on the consolidated statement of operations.
An interest rate cap is an instrument used to reduce exposure to future variable interest rates when the related debt is expected to be refinanced. We entered into an interest rate cap in 2010. The cap remains in place as of March 31, 2014.
We entered into an electricity price arrangement, which qualifies as a derivative, that fixes the price of approximately 58% of the electricity generation expected to be produced and sold by Gulf Wind through April 2019, and which reduces our exposure to spot electricity prices.
Our interest rate cap and energy derivative agreement do not qualify for hedge accounting.
Income Taxes
Prior to October 2, 2013, our predecessor did not provide for income taxes as it was treated as a pass-through entity for U.S. federal and state income tax purposes, except for several specific circumstances involving its Canadian entities, which are subject to Canadian income taxes, its Chilean entities, which are subject to
60
Table of Contents
Chilean income taxes, a U.S. entity that is subject to Puerto Rican taxes and a U.S. entity which became subject to U.S. income taxes in 2012. Federal and state income taxes were assessed at the owner level and each owner was liable for its own tax payments. Certain consolidated entities are corporations or have elected to be taxed as corporations. In these circumstances, income tax was accounted for under the asset and liability method.
Subsequent to October 2, 2013, following the Contribution Transactions, we account for income taxes under the asset and liability method, which requires the recognition of deferred tax assets and liabilities for the expected future tax consequences of events that have been included in the financial statements. Under this method, deferred tax assets and liabilities are determined on the basis of the differences between the financial statement and tax bases of assets and liabilities using enacted tax rates in effect for the year in which the differences are expected to reverse. The effect of a change in tax rates on deferred tax assets and liabilities is recognized in income in the period that includes the enactment date. We recognize deferred tax assets to the extent that we believe these assets are more likely than not to be realized. In making such a determination, we consider all available positive and negative evidence, including future reversals of existing taxable temporary differences, projected future taxable income, tax-planning and results of recent operations. If we determine that we would be able to realize deferred tax assets in the future in excess of their net recorded amount, we would make an adjustment to the deferred tax asset valuation allowance, which would reduce the provision for income taxes. We record uncertain tax positions in accordance with ASC 740 on the basis of a two-step process whereby (1) we determine whether it is more likely than not that the tax positions will be sustained on the basis of the technical merits of the position and (2) for those tax positions that meet the more-likely-than-not recognition threshold, we recognize the largest amount of tax benefit that is more likely than not to be realized upon ultimate settlement with the related tax authority. We have a policy to classify interest and penalties associated with uncertain tax positions together with the related liability, and the expenses incurred related to such accruals, if any are included in the provision for income taxes.
Revenue Recognition
We sell the electricity we generate under the terms of our power sale agreements or at spot market prices. Revenue is recognized based upon the amount of electricity delivered at rates specified under the contracts, assuming all other revenue recognition criteria are met. We evaluate our PPAs to determine whether they are in substance leases or derivatives and, if applicable, recognize revenue pursuant to Accounting Standards Codification (“ASC”) 840 Leases and ASC 815 Derivatives and Hedging, respectively. As of March 31, 2014, there were no PPAs that are accounted for as leases or derivatives.
We also generate renewable energy credits as we produce electricity. Certain of these energy credits are sold independently in an open market and revenue is recognized at the time title to the energy credits is transferred to the buyer.
We acquired a ten-year energy derivative instrument under the terms of our acquisition of Gulf Wind, which fixes approximately 58% of our expected electricity sales at Gulf Wind through April 2019. The energy derivative instrument reduces exposure to changes in commodity prices by allowing us to lock in a fixed price per MWh for a specified amount of annual electricity production. The monthly settlement amounts under the energy hedge are accounted for as energy derivative settlements in the consolidated statements of operations. The change in the fair value of the energy hedge is classified as energy derivative revenue in the consolidated statements of operations.
Cost of Revenue
Our cost of revenue is comprised of direct costs of operating and maintaining our power projects, including labor, turbine service arrangements, land lease royalties, depreciation, amortization, property taxes and insurance.
61
Table of Contents
Stock-Based Compensation
We account for stock-based compensation related to stock options granted to employees by estimating the fair value of the stock-based awards using the Black-Scholes option-pricing model. The fair value of the stock options granted are amortized over the applicable vesting period. The Black-Scholes option pricing model includes assumptions regarding dividend yields, expected volatility, expected option term, expected forfeiture rate and risk-free interest rates. We estimate expected volatility based on the historical volatility of comparable publicly traded companies for a period that is equal to the expected term of the options. The risk-free interest rate is based on the U.S. treasury yield curve in effect at the time of grant for a period commensurate with the estimated expected life. The expected term of options granted is derived using the “simplified” method as allowed under the provisions of the ASC 718 Compensation—Stock Compensation, and represents the period of time that options granted are expected to be outstanding.
We account for stock-based compensation related to restricted stock award grants by amortizing the fair value of the restricted stock award grants, which is the grant date market price, over the applicable vesting period.
JOBS Act
In April 2012, the JOBS Act was enacted. Section 107 of the JOBS Act provides that an emerging growth company can take advantage of the extended transition period provided in Section 7(a)(2)(B) of the U.S. Securities Act for complying with new or revised accounting standards. In other words, an emerging growth company can delay the adoption of certain accounting standards until those standards would otherwise apply to private companies. We are electing to delay such adoption of new or revised accounting standards, and as a result, we may not comply with new or revised accounting standards on the relevant dates on which adoption of such standards is required for other companies.
Additionally, we regularly evaluate the benefits of relying on other exemptions and reduced reporting requirements provided by the JOBS Act. We may choose to take advantage of some but not all of these reduced burdens. For so long as we are an SEC foreign issuer under Canadian securities laws, we will be exempt from the continuous disclosure requirements of Canadian securities laws, subject to limited exceptions, if we comply with the reporting requirements applicable in the United States, including certain provisions of the JOBS Act.
Subject to certain conditions set forth in the JOBS Act and Canadian securities laws, as an emerging growth company, we intend to rely on certain of these exemptions, including, without limitation, providing an auditor’s attestation report on our system of internal controls over financial reporting pursuant to Section 404 and complying with any requirement that may be adopted regarding mandatory audit firm rotation or a supplement to the auditor’s report providing additional information about the audit and the financial statements (auditor discussion and analysis). These exemptions will apply for a period of five years following our initial public offering; although, if the market value of our shares that are held by non-affiliates exceeds $700 million as of any June 30 before that time, we would cease to be an emerging growth company as of the following December 31.
Recent Accounting Pronouncements
We have evaluated recent accounting pronouncements and their adoption has not had or is not expected to have a material impact on our financial statements.
Quantitative and Qualitative Disclosure about Market Risk
We have significant exposure to commodity prices, interest rates and foreign currency exchange rates, as described below. To mitigate these market risks, we have entered into multiple derivatives. We have not applied hedge accounting treatment to all of our derivatives, therefore we are required to mark some of our derivatives to market through earnings on a periodic basis, which will result in non-cash adjustments to our earnings and may result in volatility in our earnings, in addition to potential cash settlements for any losses.
62
Table of Contents
Commodity Price Risk
We manage our commodity price risk for electricity sales through the use of long-term power sale agreements with creditworthy counterparties. Our financial results reflect approximately 308,000 MWh of electricity sales in the year ended December 31, 2013 that were not subject to power sale agreements and were subject to spot market pricing. A hypothetical increase or decrease of $3.04 per MWh (or an approximately 10% change) in these spot market prices would have increased or decreased earnings by $0.9 million, respectively, for the year ended December 31, 2013.
Interest Rate Risk
We use a variety of derivative instruments to manage our exposure to fluctuations in interest rates, including interest rate swaps and interest rate caps, primarily in the context of our project-level indebtedness. We generally match the tenor and amount of these instruments to the tenor and amount, respectively, of the related debt financing. We also will have exposure to changes in interest rates with respect to our revolving credit agreement to the extent that we make draws under that facility. A hypothetical increase or decrease in short-term interest rates by 1% would not have changed our earnings for the year ended December 31, 2013.
Foreign Currency Risk
We manage our foreign currency risk through the consideration of forward exchange rate derivatives. Certain of our power sale agreements are U.S. dollar denominated and others are Canadian dollar denominated. We did not enter into forward exchange rate derivatives to manage our exposure to Canadian dollar denominated revenues at our St. Joseph project in the past. Our financial results include approximately $40.3 million of revenue that was earned pursuant to Canadian dollar denominated power sale agreements. A hypothetical increase of US$0.10 per Canadian dollar would have increased our earnings by $0.3 million for the year ended December 31, 2013, and a hypothetical decrease of US$0.10 per Canadian dollar would have decreased our earnings by $0.3 million for the year ended December 31, 2013.
63
Table of Contents
Overview of the Electricity Generation Industry
According to the U.S. Energy Information Administration, or “EIA,” International Energy Outlook 2013, global net electricity generation is expected to grow at a CAGR of 2.8% from 2010 to 2020. Although the 2008-2009 global economic recession slowed the rate of growth in global demand for electricity, demand returned in 2010, led by strong recoveries in non-Organisation for Economic Co-operation and Development, or “OECD,” countries. The EIA expects net electricity generation in non-OECD countries to grow at a CAGR of 4.3% from 2010 to 2020, led by non-OECD Asia (including China and India), which is expected to grow at a CAGR of 5.5%. In contrast, total net electricity generation in OECD countries is expected to grow at a CAGR of 1.1% over the same period. In all of these markets, transmission infrastructure expansion will be required to transmit electricity from new power generation projects to areas of customer demand.
Renewable energy is generated using naturally-replenishing resources such as water, wind, sunlight, plant and wood waste, and geothermal energy. In many parts of the world, increasing concerns regarding manufacturing jobs, security of energy supply and the environmental consequences of greenhouse gas emissions as well as the outlook for fossil-fuel prices have resulted in governmental policies that support an increase in electricity generation from renewable energy. Over the period from 2010 to 2020, the EIA expects net electricity generation from renewable energy to be the fastest growing source of net electricity generation at a CAGR of 4.5%. The significant growth in electricity generation from renewable energy is principally the result of an improvement in the cost competitiveness of renewable energy technologies and support from governments to increase the contribution of electricity generation from renewable energy. According to the EIA, net electricity generation from renewable energy accounted for 20.6% of global net electricity generation in 2010, making it the third largest contributor after coal and natural gas. By 2020, net electricity generation from renewable energy is projected to account for 24.4% of global net electricity generation. While wind and solar resources are intermittent, depending on the time of day and climatic conditions, improving storage technology and the dispersing of wind power and solar power projects over wide geographic areas can mitigate these concerns.
Natural gas is expected to be the third fastest growing source of electricity generation. An increase in unconventional natural gas resources, in particular, in North America, is expected to result in growth in net electricity generation from natural gas at a CAGR of 2.3% from 2010 to 2020.
The EIA expects net electricity generation from nuclear power to increase at a CAGR of 3.3% from 2010 to 2020. However, there is still considerable uncertainty regarding the future of nuclear power, which suggests that the EIA’s expectations for the addition of new nuclear power generating capacity may not be fully realized. Further, the EIA expects approximately 98% of the increase in net electricity generating capacity from nuclear power to occur in non-OECD countries, with China, Russia and India accounting for the largest growth through 2020.
Future net electricity generation from renewable energy, natural gas, and, to a lesser extent, nuclear power is largely expected to displace net electricity generation from coal, although coal is expected to remain the largest source of global net electricity generation through 2020.
64
Table of Contents
Global Net Electricity Generation by Energy Source
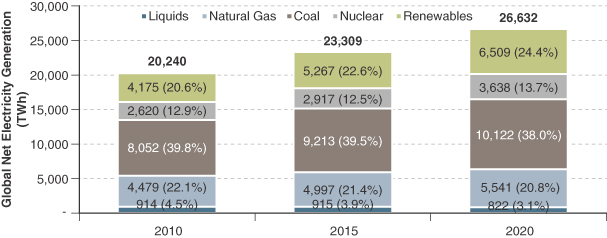
Source: International Energy Outlook 2013—U.S. Energy Information Administration
Over the period from 2010 to 2020, the EIA expects 45% and 34% of the increase in net electricity generation from renewable energy to be from hydro power and wind power, respectively. While hydro power represented 81.5% of global net electricity generation from renewable energy in 2010, its contribution is expected to decline to approximately 68.4% by 2020 as projects utilizing other renewable energy technologies, including wind power and solar power, come online. Net electricity generation from wind power is expected to increase at a CAGR of 12.8% from 2010 to 2020, increasing its contribution to global net electricity generation from renewable energy from 8.2% in 2010 to 17.5% in 2020.
Global Net Electricity Generation from Renewable Energy by Energy Source
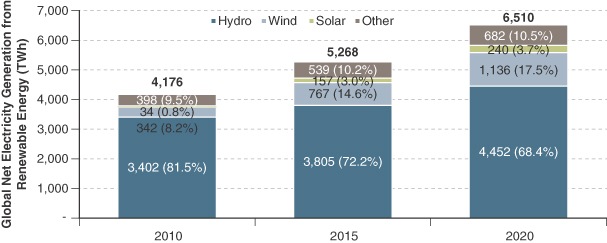
Source: International Energy Outlook 2013—U.S. Energy Information Administration
Regulatory Frameworks
The regulatory frameworks applicable to the electricity industry vary between regions.
65
Table of Contents
United States
Electricity markets in the United States are subject to regulation at both the federal and state levels. Federal law provides for the exclusive jurisdiction over the sale of electricity at wholesale and the transmission of electricity in interstate commerce, while state regulators review individual utilities’ electricity supply requirements and have oversight over the ability of public utilities to pass through to their ratepayers the costs associated with power purchases from IPPs. Federal regulatory filings are required for renewable energy projects in the United States that sell energy at wholesale, but state and local approvals (such as siting and permitting approvals) typically require more time to secure.
FERC regulates the sale of electricity at wholesale and the transmission of electricity pursuant to its regulatory authority under the Federal Power Act. FERC’s jurisdiction includes, among other things, authority over the rates, charges and other terms for the sale of electricity at wholesale by public utilities (entities that own or operate projects subject to FERC jurisdiction) and for transmission services. In most cases, FERC does not set specific rates for the sale of electricity at wholesale by generating companies (such as our U.S. project companies) that qualify for market-based rate authority, enabling companies to price based upon negotiated rates reflecting market conditions. In order to be eligible for market-based rate authority, and to maintain exemptions from certain FERC regulations, our projects must request market based rate authorization from FERC. With respect to its regulation of the transmission of electricity, FERC requires transmission providers to provide open access transmission services, which supports the development of non-utility power generators and competitive power markets by assuring non-discriminatory access of non-utility generators to the transmission grid. FERC has also encouraged the formation of regional transmission operators, or “RTOs,” to allow non-utility generators greater access to transmission services and certain competitive wholesale markets administered by RTOs.
In 2005, the U.S. federal government enacted the Energy Policy Act of 2005, or “EPACT 2005,” conferring new authority for FERC to act to limit wholesale market power if required and strengthening FERC’s criminal and civil penalty authority (including the power to assess fines of up to $1 million per day per violation), and adding certain disclosure requirements. EPACT 2005 also directed FERC to develop regulations to promote the development of transmission infrastructure, which provides incentives for transmitting utilities to serve renewable energy projects and expanded and extended the availability of U.S. federal tax credits to a variety of renewable energy technologies, including wind power.
In addition, PUHCA provides FERC and state regulatory commissions with access to the books and records of holding companies and other companies in holding company systems, and it also provides for the review of certain costs. Companies that are holding companies under PUHCA solely with respect to one or more EWGs, “qualifying facilities”, or foreign utilities are exempt from these books and records requirements. Each of our U.S. projects must request EWG or qualifying facility status, as applicable, and file updates to ensure they maintain the applicable status and are not treated as a holding company under PUHCA. Given that our operating projects in the U.S. are all EWGs, we are exempt from regulation under PUHCA.
While federal law provides the utility regulatory framework for our sales of electricity at wholesale in interstate commerce, there are also important areas in which state regulatory actions over traditional public utilities that fall under state jurisdiction may have an effect on our U.S. projects. For example, the regulated electric utility buyers of electricity from our projects are generally required to seek state public utility commission approval for the pass through in retail rates of costs associated with PPAs entered into with a wholesale seller, such as one of our U.S. projects. Certain states, such as New York, regulate to some extent the transfer of wholesale power projects and financing activities by the owners of such projects. California, one of our markets, requires compliance with certain operations and maintenance reporting requirements for wholesale generators. In addition, states and other local agencies require a variety of environmental and other permits.
Canada
In Canada, provincial governments have jurisdiction over their respective intra-provincial electricity markets and the Canadian federal government has jurisdiction over inter-provincial and international
66
Table of Contents
transmission and export permitting. Significant regional diversity of the sources of supply and market structures exists among provinces. In addition, the pace and extent of electricity market deregulation varies among, and reflects the unique circumstances and challenges faced by, each province. In recent years there has been a shift to retail and wholesale competition in Alberta and to a much lesser extent in Ontario, and some other provinces have undertaken varying degrees of sector unbundling through the granting of PPAs to IPPs and greater access to transmission and distribution networks. As a result, the number of IPPs active across Canada has increased. Some provinces are experiencing supply adequacy challenges during demand peaks and are focused on immediate generation and transmission investments for both short-term reliability and long-term security of supply, while surplus baseload generation is presently occurring in Ontario.
Chile
Energy policy in Chile is founded on the principles of free market competition between private companies, the regulation of natural monopolies and the limited role of the state. Chile has two major electricity grids, the Central Interconnected System, or the “SIC,” and the Northern Interconnected System, or the “SING.” Each of these two main grids has its own independent system operator and market administrator, a Centro de Despacho Económico de Carga, or “CDEC”, and is subject to the oversight of La Comisión Nacional de Energía, or “CNE.” The CDECs’ functions include ensuring an adequate supply of electricity into the system and providing efficient and economical dispatch of power projects.
Power Markets
U.S. State Power Markets
In the United States, power prices vary across regions and states. The price of electricity varies based on supply and demand dynamics, generation mix, fuel-supply costs and other inputs required to generate electricity and relevant environmental laws and regulations.
California
California ranked second in the United States in terms of electricity generating capacity, which stood at approximately 68 GW as of the end of 2011. Electricity in California is principally sold by load-serving utilities which buy the majority of their required electricity supply from IPPs. Load-serving entities within the state include investor-owned utilities, including Pacific Gas & Electric, Southern California Edison and San Diego Gas & Electric, and municipal utilities, including Los Angeles Department of Water and Power, Sacramento Municipal Utilities District, and the Imperial Irrigation District. The market clearing price of electricity in California is highly correlated with the price of natural gas as natural gas-fired projects are the marginal cost electricity generators. The average retail electricity price in California was approximately 14 cents/kWh in 2012. Much of the California power grid is operated by the CAISO, which operates and controls the bulk transmission grid and also administers a competitive bulk power market. Approximately 80% of California’s load falls within the footprint of the CAISO, with the remaining 20% served by irrigation districts and municipal utilities, which have chosen not to join the CAISO.
Texas
Texas had approximately 109 GW of electricity generating capacity as of the end of 2011, ranking first nationally. The provision of transmission and distribution service in Texas remains regulated by the Public Utility Commission of Texas, or “PUCT.” Population growth, an improving economy and extreme temperatures have resulted in record electricity demand during recent summer and winter seasons in ERCOT. The market clearing, real-time settlement-point price of electricity within ERCOT is highly correlated with the price of natural gas as natural gas-fired projects are the marginal cost electricity generators in Texas for most of the on-peak hours. The average retail electricity price in Texas was approximately 9.0 cents/ kWh in 2012.
67
Table of Contents
The majority of the Texas power market is deregulated, with competition in wholesale electricity generation and retail electricity sales. Most of Texas is within the ERCOT NERC region, with the balance included in the Southwest Power Pool, or “SPP,” and SERC Reliability Council regions. ERCOT is an ISO that serves approximately 85% of Texas’ electricity load and is subject to oversight by the PUCT. ERCOT is a self-contained market on a standalone grid with only approximately 1,100 MW of transfer capability through direct current ties with the SPP and the Comision Federal de Electricidad in Mexico. Nearly 95% of ERCOT transactions are bilateral, with only 5% of market operations conducted in the real-time energy market. In December 2010, ERCOT replaced its zonal market design with a nodal market. The nodal system was designed to mitigate congestion costs with a greater number of settlement points and improve wind power dispatch efficiency, given more frequent and specific instructions to controllable generation. The nodal market continues to support bilateral agreements, such as long-term power sale agreements, designated at settlement points.
In order to address curtailment issues that have historically impacted wind power projects in the western and northwestern areas of the State of Texas, the PUCT over the past several years has implemented a project to construct over $6 billion of new transmission facilities to serve those installations, or the “CREZ Transmission Lines.” The primary CREZ Transmission Lines have all been certificated and constructed.
Nevada
Nevada had approximately 11,646 MW of electricity generating capacity as of the end of 2011. In 1997, Nevada began to deregulate its power markets, but this plan was suspended in 2001. Electricity is regulated in the state by the Public Utility Commission of Nevada. The Nevada market is primarily served by NV Energy, Inc., or “NV Energy,” an integrated utility holding company, with natural gas as its primary fuel for electricity generation. The average retail electricity price in Nevada was approximately 9.0 cents/kWh in 2012.
Puerto Rico
PREPA is a public corporation and governmental instrumentality of Puerto Rico. PREPA transmits and distributes virtually all of the electricity consumed in Puerto Rico. As of June 30, 2012, PREPA owned and had entered into power sale agreements for approximately 4,878 MW and 1,000 MW of electricity generating capacity, respectively. Imported heavy distillate oil and residual oil are the primary fuels utilized for electricity generation in Puerto Rico. The average retail electricity price in Puerto Rico was approximately 27.8 cents/kWh in the 12-month period ended June 30, 2012.
Canadian Provincial Power Markets
Similar to the United States, power prices in Canada vary across regions and provinces. The price of electricity varies based on supply and demand dynamics, generation mix, fuel supply costs and other inputs required to generate electricity and relevant environmental laws and regulations.
Ontario
Ontario ranks second in Canada in terms of electricity generating capacity, which stood at approximately 37 GW as of the end of 2012. Ontario’s electricity market is structured around the five entities that resulted from the break-up of Ontario Hydro in 1999, namely: the Ontario Electricity Financial Corporation, Ontario Hydro’s legal successor with the mandate to manage and retire Ontario Hydro debt and contractual obligations with certain IPPs; Ontario Power Generation, or “OPG,” the electricity generating company, which generated approximately 60% of the electricity in Ontario in 2012; Hydro One Inc., the transmission and rural distribution company; the IESO, the grid operator that ensures security of supply, operates the spot market providing open access to regulated transmission systems; and the Electrical Safety Authority, with responsibility to oversee electrical safety in Ontario. In addition, in 2005, the Ontario government established the OPA, which awards and enters into PPAs for the supply of new electricity generation in Ontario.
Manitoba
Manitoba had approximately 5,927 MW of electricity generating capacity as of the end of 2012, which consists predominantly of hydro power. Manitoba Hydro is a Crown Corporation of the Province of Manitoba
68
Table of Contents
and generates, transmits and distributes virtually all of the electricity consumed in the province. Manitoba is a net exporter of electricity, mainly to Saskatchewan, Ontario and certain midwestern states of the United States. To date, the province has successfully utilized its large hydro power resources to satisfy its internal demand for electricity while exporting the balance.
Chilean Power Markets
Chile had approximately 18.3 GW of electricity generating capacity as of November 2012. Chile’s Ministry of Energy expects electricity consumption in Chile to increase at an annual rate of approximately 6% to 7% from 2011 to 2020. According to the Ministry of Energy, 63% of Chile’s electricity generation is generated from fossil fuel-fired sources, the majority of which is imported, 34% from domestic hydro power and only 3% from renewable energy, including wind power, small-scale hydro power and biomass. According to figures published by the OECD, electricity prices in Chile posted a four-fold increase between 1998 and 2011 due in large part to its dependence on foreign energy sources and a reduction in natural gas supply from Argentina. To satisfy this expected increase in demand, Chile’s Ministry of Energy estimates that approximately 8,000 MW of additional electricity generating capacity would be required.
Overview of the Wind Industry
Wind power has been one of the fastest growing sources of electricity generation in North America and globally over the past decade. According to GWEC, from 2003 to 2013, net electricity generation from wind power in the United States and Canada grew at a CAGR of 25% and 38%, respectively. According to AWEA, wind was the number one source of new U.S. generating capacity in 2012. However, uncertainty related to the demand for new power projects in general and the potential expiration of U.S. federal incentives on December 31, 2012 resulted in a reduction in the build rate of wind power and other renewable energy projects in 2013 and potentially 2014 from a high of 13,124 MW installed in 2012, according to AWEA. According to Wood Mackenzie, 8%, or 97 GW, of the U.S. and Canadian power supply is estimated to come from wind by 2020. This rapid growth is largely attributable to renewable energy’s increasing cost competitiveness with other power generation technologies, the advantages of wind power over other renewable energy sources, and growing public support for renewable energy driven by concerns regarding security of energy supply and the environment. As global demand for electricity generation from wind power has increased technology enhancements—supported by U.S. government incentives—have reduced the cost of wind power by more than 90% over the past 20 years, according to AWEA.
Wind power projects have a longstanding history of being able to secure long-term PPAs with creditworthy counterparties. Counterparties to PPAs, which are typically electric utilities, enter into these agreements to satisfy their requirements for electricity generating capacity, interest in diversifying their power sources, interests of their customers, or governmental mandates requiring a portion of their electricity supply to come from renewable energy sources. By entering into long-term, fixed-price PPAs, utilities are able to insulate themselves from the volatility in wholesale electricity prices that are typically passed on to ratepayers in their jurisdictions. Wind power generating capacity is typically sourced through a RFP, which is a solicitation by electric utilities for bids to provide a fixed generation amount, or a FIT program, which offers project operators fixed prices under long-term contracts for electricity typically generated from renewable energy sources. However, there are numerous cases of PPAs being negotiated on a bilateral basis with utilities and IPPs, such as Pattern Development.
United States
The United States is the second largest market for wind power in the world by electricity generating capacity. According to the DoE, wind power was the second largest source of new electricity generating capacity in the United States after natural gas for six of the seven years between 2005 and 2011. According to AWEA, wind power became a leading source of new electricity generating capacity in the United States for the first time in 2012. The success of wind power is evidenced by approximately $90 billion in investments over the last five
69
Table of Contents
years, according to the AWEA. In 2013, wind power generating capacity grew to a total of 61 GW, equivalent to powering over 15.3 million homes. As of the end of 2013, 39 of the 50 U.S. states and Puerto Rico had utility-scale wind projects, and 16 states had more than 1,000 MW of wind power generating capacity. Texas and California, two of our markets, represent the first- and second-ranked states in terms of wind power generating capacity, as of the end of 2013. Despite this growth, wind power represented only 4.1% of electricity generating capacity in the United States as of the end of 2013. Based on the percentage of electricity generated by wind power in other developed countries, we believe that, despite a reduction in the build rate of wind power and other renewable energy projects in 2013 and potentially 2014, as a result of the uncertainty related to the demand for new power projects in general, substantial growth potential remains in the U.S. market over the long-term.
U.S. Wind Power Generating Capacity by State—2013
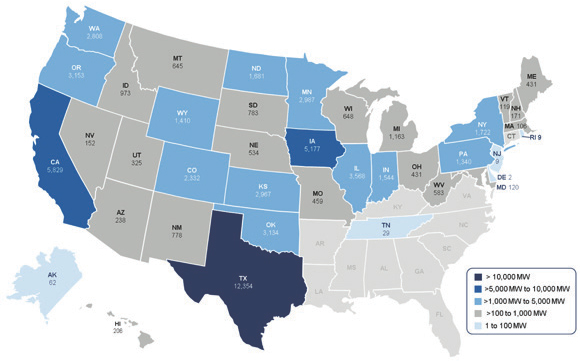
Source: American Wind Energy Association, U.S. Wind Industry Fourth Quarter 2013 Market Report
California
As of December 31, 2013, California ranked second nationally in terms of overall wind installations, after Texas, with 5,812 MW of wind power generating capacity. In 2013, 6.6% of electricity in the state was generated from wind power, equivalent to powering approximately 1.9 million homes. The wind power installed in California avoids over 7.8 million metric tons of carbon dioxide annually. According to the National Renewable Energy Laboratory, or “NREL,” the California wind resource could meet 40% of the state’s current electricity needs.
Texas
As of December 31, 2013, Texas ranked first nationally in terms of overall wind installations with 12,355 MW of wind power generating capacity and was the first state to reach 10 GW of wind power generating capacity. It is home to six of the nation’s largest ten wind power projects. In 2013, 8.3% of electricity generated in the state was generated by wind power, equivalent to powering over 3.3 million homes. The wind power installed in Texas avoids over 22 million metric tons of carbon dioxide annually. According to NREL, the Texas wind resource could meet 18 times the state’s current electricity needs. AWEA ranks the state’s wind resource as the first in the United States.
70
Table of Contents
Nevada
Our Spring Valley project was the first commercial-scale wind power project commissioned in Nevada, and the output from Spring Valley is currently being sold to NV Energy under a long-term PPA. According to NREL, the Nevada wind resource could meet nearly 60% of the state’s current electricity needs.
Puerto Rico
Our Santa Isabel project was the first commercial-scale wind power project to achieve commercial operations in Puerto Rico.
Canada
The Canadian wind power industry has also experienced dramatic growth in recent years. In 2013, Canada experienced approximately 1,600 MW of new installed wind power generating capacity. In 2013, new wind power projects were built in Prince Edward Island, Nova Scotia, Quebec, Ontario, British Columbia and Saskatchewan, resulting in wind power generating capacity in Canada reaching approximately 7,800 MW as of January 2014. Ontario, one of our markets, is the national leader in installed capacity, with approximately 2.5 GW of wind power generating capacity, although recent changes to the Ontario government FIT regime may make future projects less attractive and PPAs more difficult to obtain. The EIA forecasts total wind power generating capacity in Canada to exceed 13 GW by 2020.
Canadian Wind Power Generating Capacity by Province—2013
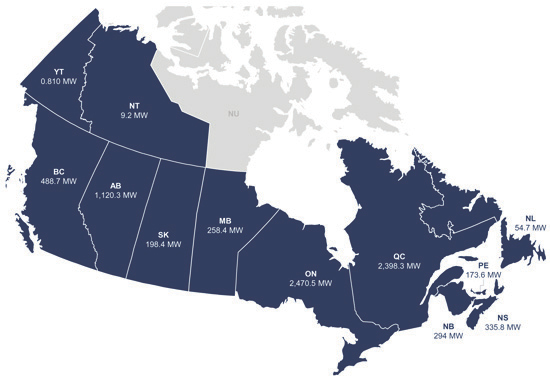
Source: Canadian Wind Energy Association
71
Table of Contents
Ontario
Ontario is the current provincial leader, with approximately 2,740 MW of wind power generating capacity. Our South Kent project, representing 135 MW of owned capacity, achieved commercial operation in the first quarter of 2014.
Manitoba
Manitoba has 259 MW of wind power generating capacity, including our St. Joseph project, which commenced commercial operations in 2011 and represents 138 MW of electricity generating capacity.
Chile
Chile has an abundant wind resource, which GWEC estimates could provide the potential for more than 40 GW of electricity generating capacity, including within the south-central zone where approximately 80% of Chile’s population resides. As of the end of 2013, Chile had approximately 335 MW of wind power generating capacity, representing approximately 2% of total electricity generating capacity. According to GWEC, as of the end of 2013, Chile had approximately 6,445 MW of wind projects under various stages of development, of which 450 MW of wind power projects were expected to come online in 2014 and a further 1,400 MW during 2015 to 2018.
Wind Power Fundamentals
Wind power harnesses the kinetic energy of moving air. Electricity is generated from the energy of wind flows exerted on the blades of a wind turbine, which activates an electric generator. Wind turbines are equipped with a control system that optimizes electricity generation output. In addition, wind power projects can be monitored and operated remotely to respond to changing weather conditions, including shutting down during heavy lightning storms and rotating to adjust to shifts in wind direction.
The amount of energy that the wind transfers to the turbine depends on the blades’ surface area and the wind speed. The amount of energy captured by a wind turbine increases as a square-function of an increase in blade size. For example, doubling the surface area of the blades quadruples the wind energy captured. The speed of the wind has an even greater effect. As wind speed doubles, the available energy increases by a factor of eight. Stronger winds are also able to drive larger turbine blades. In order to maximize the efficiency of the transfer of energy from wind to electricity, blade size must be chosen to capture the most wind energy the highest proportion of the time.
As a result of these factors, manufacturers have developed wind turbines to increase blade size in order to increase the swept area of a turbine, thereby increasing the electricity generation of the turbine and simultaneously decreasing the cost of electricity generated. In addition, manufacturers have successfully increased the height of towers in order to benefit from greater wind speeds at higher elevations (e.g., shear) in many wind regions. According to AWEA, a typical wind turbine today generates approximately 15 times more electricity than a typical turbine in 1990 and can generate electricity equivalent to powering approximately 500 homes.
Not only has technological evolution increased a wind turbine’s ability to generate electricity, it has also increased the accuracy with which wind is forecast. New meteorological technology dispatched to a potential project site can measure wind at a higher hub height and rotor swept area with greater accuracy than previously possible. Additionally, improvements and new analytical methods have been incorporated into the prediction models. This improvement in forecasting has increased the predictability of the electricity generation of wind power projects, which, in turn, has increased their ability to attract long-term debt financing.
72
Table of Contents
Wind Power Project Electricity Generation
Wind is a source of energy that is naturally variable; wind generally does not blow at a constant speed throughout a given day nor month-to-month. As a result, the amount of electricity generated on a daily or monthly basis is also variable or intermittent. However, long-term historical site-specific measurements for wind power allow for an annual average or “mean” wind speed, enabling the use of statistical analyses to estimate electricity generation.
There are a number of factors that preclude a wind turbine from operating at its maximum theoretical electricity generation, but the primary factor is wind speed. As a result of the variance in wind speed at any given project, a turbine will be operating for significant periods of time at levels less than its maximum electricity generating capacity. Other factors also affect the capacity factor but are generally much less significant, including scheduled annual maintenance of electricity-generating equipment and unscheduled non-operation resulting from equipment failure. In general, wind power projects have capacity factors, defined as the percentage of electricity that an electricity-generating source is expected to generate relative to the maximum theoretical electricity generation in a given period of time, ranging from 20% to 60%, depending on various site and equipment-specific factors.
Advantages of Wind Power
Low Operating Costs
Wind power projects do not have any fuel costs and typically use remote monitoring systems, which enable off-site operation and supervision. In addition, improvements in wind turbine technology have increased the efficiency and reliability of wind power projects. As a result, operating expenses for wind power projects are generally lower than those of comparably-sized fossil fuel-fired power projects such as natural gas or coal.
Simple Construction
Wind power projects are relatively simple to construct relative to conventional power projects. We believe that 50 MW and 200 MW wind power projects can be constructed within approximately six and 12 months, respectively, while constructing large-scale hydro power, natural gas, nuclear power or coal projects typically requires a longer timeframe. As a result, wind power projects are susceptible to far fewer risks associated with construction delays and cost over-runs.
Environmentally Responsible
Wind power projects do not emit any greenhouse gases or contribute to acid rain, both of which have significant negative impacts on the environment. Electricity generation from wind power does not result in thermal, chemical, radioactive, water or air pollution that is typically associated with fossil fuel-fired and nuclear power projects. According to GWEC, collectively, U.S. wind power projects can potentially account for 31% of the required emissions reductions between 2005 and 2020, avoiding 385 million tons of carbon dioxide in 2020 alone. Wind power projects can have an adverse impact on birds and bats, as well as plants and animals. However, a well-designed and operated wind power project can minimize these impacts and have a significantly lower environmental impact relative to most environmentally-responsible conventional power projects.
Technological Improvements
Technological improvements resulting in greater power efficiency are decreasing the cost of electricity generated from wind toward parity with the cost of other energy sources, such as natural gas. The diagram below exemplifies how, at specified wind speeds, new turbine technology that we believe can be deployed in 2014 is able to produce 50% to 100% more power for most North American wind locations than the technology that was available in 2009.
73
Table of Contents
Power Efficiency Improvements
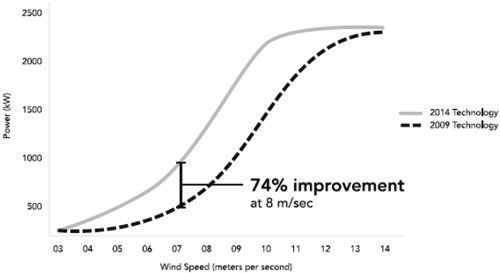
Limited Use of Land
Wind power projects require only a small percentage of the land they occupy for road access and foundations for wind turbines. The remainder of a wind power project site is available for other uses such as agriculture, industry and recreation. We believe a typical wind power project uses only 2% to 5% of the land area leased to or owned by the project.
Key Drivers of Demand for Wind Power
We believe the following factors have driven, and will continue to drive, the growth of wind power in North America:
Requirements for New Electricity Generating Capacity
As stated above, from 2010 to 2020, the EIA expects global net electricity generation to grow at a CAGR of 2.8%; however, OECD countries are expected to grow at a CAGR of 1.1% over the same period. In the United States and Canada, in addition to the new electricity generating capacity associated with this growth, further capacity additions will be required to replace aging fossil fuel-fired and nuclear power projects. With the current low natural gas price environment and increased sensitivity regarding environmental concerns, it is expected that natural gas and renewable energy, including wind power, will be the future choice for new electricity generating capacity.
Governmental Incentives
Increasing concerns regarding manufacturing jobs, security of energy supply and consequences of greenhouse gas emissions as well as the outlook for fossil-fuel prices have resulted in support for governmental policies at the federal and state or provincial level that support electricity generation from wind power and other renewable energy sources. The state and provincial RPS as well as FIT programs have been and will continue to be the most important governmental policies supporting wind power. In order to promote employment in the manufacturing sector, jurisdictions are implementing domestic content requirements for renewable energy projects. For example, the FIT program in Ontario requires wind power projects greater than 10 KW and all solar projects to include a minimum amount of Ontario-based content. Minimum domestic content of 50% is required for projects that achieve commercial operations in Ontario after January 1, 2012. The minimum domestic content was lowered for FIT contracts issued after August 2013, for example minimum domestic content of 20% is required for on-shore wind projects under Ontario’s current FIT program.
74
Table of Contents
Continued Improvements in Wind Power Technologies
Wind turbine technology has evolved significantly over the last 20 years and technological advances are expected to continue in the future. The cost of electricity generation from wind projects has dropped over 90% over the last 20 years, we believe, as a result of technological advances, which have included:
| • | advances in wind turbine blade aerodynamics and development of variable speed generators to improve conversion of wind energy to electricity over a range of wind speeds, resulting in higher capacity factors and increased capacity per turbine; |
| • | advances in turbine height resulting in the ability to benefit from greater wind speeds at higher elevations; |
| • | advances in remote operation and monitoring systems; |
| • | improvements in wind monitoring and forecasting tools, allowing for more accurate prediction of electricity generation and availability and for better system management and reliability; and |
| • | advances in turbine maintenance, resulting in longer turbine lives. |
Growing Environmental Concerns
The growing concern over the environmental consequences of greenhouse gas emissions has contributed to the growth of wind power generation. According to the World Meteorological Organization, 2013 tied with 2007 as the sixth warmest since global records began in 1850, and thirteen of the fourteen warmest years on record have all occurred in the twenty-first century. As one of the largest emitters of greenhouse gases in the world, the United States has experienced growing awareness of climate change and other effects of greenhouse gas emissions, which has resulted in increased demand for emissions-free electricity generation. As an emissions-free electricity source, wind power is an attractive alternative that is capable of addressing these growing environmental concerns.
Outlook for Energy Prices
We expect that increased demand for electricity coupled with a finite supply of fossil fuels, and capacity and distribution constraints, including volatility in fossil-fuel prices, will result in continued increases and volatility in electricity prices. Current natural gas prices are low; however, they are expected to increase in coming years. Additionally, electricity generation from natural gas is either exposed to volatility in natural gas prices or is priced at a premium for medium-term, fixed-price gas supply contracts. Wind power projects, in contrast, typically contract for long periods (e.g., 20 years) at fixed prices. As a result and given the lack of fuel costs associated with wind power projects, we believe that wind power has become cost competitive with conventional power projects and that this cost competitiveness will contribute to further growth in wind power.
Increasing Obstacles for Conventional Power Projects
Growing environmental concerns have made it increasingly difficult to construct new or expand existing fossil fuel-fired electricity generation projects. For example, according to industry sources, only 41 of the approximately 150 coal plants proposed in the United States between 2000 and 2006 were built or were under construction by the end of 2013. Nuclear power projects have also faced significantly increasing capital costs and steep environmental hurdles associated with, among other things, complications relating to the disposal of spent nuclear fuel and concerns over operational safety. Wind power, in contrast, does not create solid waste by-products, emit greenhouse gases or deplete non-renewable resources, and, as a result, is an attractive alternative to fossil fuel-fired power projects.
Dependence on Foreign Energy Sources
According to the EIA, the net import share of total U.S. energy consumption was 16% in 2012. In addition, many of the regions rich in energy supply are politically unstable, raising public concerns regarding the dependence of the United States on foreign energy imports and related threats to U.S. national security. The
75
Table of Contents
potential for future growth in U.S. wind power generating capacity is supported by the large amount of land available for turbine installations and the availability of significant wind resources. According to the DoE, wind power industry experts estimate that the United States has more than 10,500 GW of available land-based wind resources that can be captured economically, assuming 80 meter turbine heights and a capacity factor of at least 30%. Increased public awareness of the dependence of the United States on foreign energy sources has generated momentum to diversify the energy supply within the United States. We believe that wind power, which supplied only 4.1% of the total net electricity generation in the United States in 2013, according to the AWEA, is a viable domestic alternative to decrease the dependence of the United States on foreign energy sources and satisfy a portion of the expected increased demand for electricity in the United States.
Mechanisms to Promote Wind Power and Other Renewable Energy Sources
Generally, there has been broad support from governments to facilitate growth in electricity generation from renewable energy through the development of mechanisms that encourage the adoption of renewable energy, including wind power.
United States
Federal Government Support for Renewable Energy
Presently under U.S. law, the PTC provides a tax credit of 2.3 cents/kWh for projects that began construction on or before December 2013. Although the tax credit expired for projects beginning construction after December 2013, the U.S. Senate approved adding language to a tax extenders package in April 2014 that would revive the PTC for two years. For projects placed into service on or before December 31, 2012, for which construction began on or after January 1, 2009 and before the end of 2011, project owners were permitted to elect to receive an ITC cash grant equivalent to 30% of the capital cost of qualified equipment. On March 4, 2013, the U.S. Treasury announced that the automatic federal spending reductions occurring across most U.S. government programs, known as sequestration, would apply to ITC cash grants. Awards made through the remainder of the government’s fiscal year (September 30, 2013) were reduced by 8.7%. Alternatively, project owners were permitted to elect to claim an ITC equal to 30% of the capital cost of qualified equipment for wind projects placed in service on or after January 1, 2009 for which construction began before January 1, 2014. Given that many of the factors that gave rise to the initial establishment of the U.S. federal incentives remain, including strong public support for the continued expansion of renewable energy, we believe new U.S. federal incentives may be enacted, although the form and timing of any potential future incentives remain uncertain.
State Government Support for Renewable Energy
U.S. state RPS and targets have been a key driver of the expansion of wind power and will continue to drive wind power installations in many areas of the United States. As of March 2013, 29 states and the District of Columbia have RPS in place, and eight other states have non-binding goals supporting renewable energy. California, one of our markets, has been a leader in RPS with one of the highest state targets. In 2011, the governor of California signed into law legislation that increased the state’s RPS from 20% to 33% by 2020. Texas, another of our markets, has surpassed its mandated RPS of 5,880 MW by 2015 as well as its target of 10,000 MW by 2025, but is completing a large expansion of the electricity grid in Texas principally to facilitate the development of additional wind power generating capacity.
76
Table of Contents
Renewable Portfolio Standards and Targets by State—March 2013
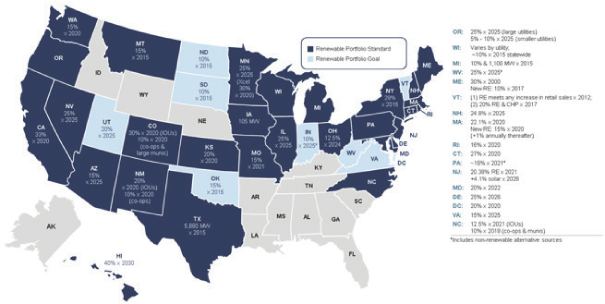
Source: Database of State Incentives for Renewables & Efficiency, U.S. Department of Energy
California. California has one of the most aggressive RPS in the United States with a target of 33% of electricity to be generated from renewable energy sources by 2020. Load-serving entities in California satisfy their RPS requirements, in part, by issuing requests for proposals for new renewable energy PPAs. The success of bringing currently contracted projects into operation will impact future demand for renewable energy in California.
Texas. While the Texas RPS requires 5,880 MW of renewable energy generating capacity by 2015 and Texas has a target of 10,000 MW by 2025, both of these levels have already been met.
Nevada. Under Nevada’s RPS, NV Energy is required to utilize renewable energy sources to supply a minimum percentage of the electricity it sells in the state, which was set at 6% in 2005, increasing by 3% every two years to 20% by 2015 and to 25% by 2025. Both of NV Energy’s operating subsidiaries, Nevada Power Company and Sierra Pacific Power Company, surpassed the minimum requirement of 18% in 2013, delivering 20.4% and 34.7%, respectively. NV Energy satisfies its RPS requirements, in part, by issuing requests for proposals for new renewable energy PPAs.
Puerto Rico. Under Puerto Rico’s RPS, PREPA is required to meet targets for electricity generation from renewable energy sources as a percentage of electricity sales as follows: 12% by 2015; 15% by 2020; and 20% by 2035. In the 12-month period ended June 30, 2012, less than 1% of electricity generation in Puerto Rico was generated from renewable energy sources. PREPA primarily satisfies its RPS requirements by entering into power sale agreements for new electricity generation from renewable energy. As of June 30, 2012, PREPA had signed a total of more than 40 power sale agreements representing approximately 1,000 MW of renewable energy projects. Should these projects achieve commercial operation, PREPA expects that, collectively, they will generate approximately 4%, 8% and 11% of electricity generation in 2013, 2015 and 2017, respectively, in all years below the relevant RPS targets.
77
Table of Contents
Canada
Federal Government Support for Renewable Energy
While provincial governments have jurisdiction over their respective intra-provincial electricity markets, from 2007 to 2011, the Canadian federal government supported the development of renewable energy through its ecoENERGY for Renewable Power program, or “ecoEnergy federal incentive”, which resulted in a total of 104 projects qualifying for funds, including our St. Joseph project, and will represent cash incentives of approximately C$1.4 billion over 14 years and encouraged an aggregate of approximately 4,500 MW of new renewable energy generating capacity. The program is now fully subscribed, and the Canadian federal government has not signaled an intention to renew it.
Provincial Government Support for Renewable Energy
Provincial governments have been active in promoting renewable energy in general and wind power in particular through RPS as well as through RFPs and FIT programs for renewable energy. Several provinces are currently preparing new RFPs for renewable energy. Current provincial targets for renewable energy in those provinces with stated targets are outlined below.
Ontario. In 2009, the Green Energy and Green Economy Act, 2009 was passed into law and the OPA launched its FIT program, which offers stable prices under long-term contracts for electricity generation from renewable energy, including biomass, wind, solar photovoltaic and hydro power. In November 2010, the Ministry of Energy, or “MoE,” released the draft Supply Mix Directive and Long Term Energy Plan, or “LTEP.” Ontario, one of our markets, has been a leader in supporting the development of renewable energy through the LTEP, which calls for 10,700 MW of renewable energy generating capacity (excluding small-scale hydro power) by 2021. In addition, Ontario was the first jurisdiction in North America to introduce a FIT program, which has resulted in contracts being executed for approximately 4,541 MW of electricity generating capacity as of March 31, 2013. These new contract awards under the FIT program along with previously-awarded PPAs suggests Ontario is close to meeting its current RPS by 2015, provided that all of the currently-contracted projects are successfully developed, financed and constructed.
In April and July of 2012, the OPA implemented version 2.0 of the FIT program, which, among other things, reduced contract prices for new wind power and solar power projects, limited the acceptance of applications to specific application windows, and prioritized projects based upon project type (community participation, Aboriginal participation, public infrastructure participation), municipal and Aboriginal support, project readiness and electricity system benefit. The revisions to the FIT program do not affect FIT contracts issued prior to October 31, 2011, including our South Kent project and the Grand, K2 and Armow projects. Prices under the FIT program will be reviewed annually, with prices established in November that will take effect January 1st of the following year. Such price changes do not affect previously issued FIT contracts but, rather, only FIT contracts to be entered into subsequent to the price change. The revisions may, however, make project economics less attractive (because of the PPA price reduction) and by granting priority points or status to certain types of projects, may make it more difficult to obtain PPAs in the future.
In October 2013, the OPA issued version 3.0 of the FIT program, with new price schedules. Version 3.0 of the FIT program generally limits the size of eligible renewable energy projects to 500 kW. In the fall of 2013, the OPA announced that it would begin developing a process for procuring larger renewable energy projects, i.e. those greater than 500 kW in capacity, that will take into account local needs and considerations. This “Large Renewable Procurement” program is currently in the draft request for qualifications stage and will ultimately lead to a request for proposals for larger renewable energy projects.
Manitoba. The Manitoba government and Manitoba Hydro independently undertook studies to determine the potential of wind power generation in the province of Manitoba. As a result of such studies, in November 2005, the Manitoba government announced that it was targeting plans to add approximately 1,000 MW of new
78
Table of Contents
wind power generating capacity by 2016, a portion of which is expected to be procured from IPPs. To date, it has awarded three PPAs for electricity generating capacity in excess of 250 MW, including our St. Joseph project.
Other Provinces. Provincial support for renewable energy in other provinces includes the following objectives:
| • | British Columbia: To achieve energy self-sufficiency by 2016 with at least 93% of net electricity generation from clean or renewable sources; |
| • | New Brunswick: To generate 10% of net electricity generation from new renewable sources by 2016; |
| • | Nova Scotia: To generate 25% and 40% of net electricity generation from new (post-2001) sources of renewable energy by 2015 and 2020, respectively; |
| • | Prince Edward Island: To acquire 30% of electricity from wind power over the next few years; |
| • | Québec: To develop 4,000 MW of wind power generating capacity by 2015; and |
| • | Saskatchewan: To generate approximately 29% of electricity from sources of renewable energy by 2016. |
Chile
In 2008, the Chilean government enacted the Renewable and Non-Conventional Energy Law (law 20.257), which required power generation companies who sell directly to end-use customers, to source 5% of their electricity from renewable energy sources by 2010, which such percentage gradually increasing each year until it reaches 20% in 2024. As of the end of 2011, renewable energy accounted for approximately 3% of total electricity generation in Chile.
79
Table of Contents
Overview
We are an independent power company focused on owning and operating power projects with stable long-term cash flows in attractive markets with potential for continued growth of our business. Including the pending acquisitions of the Panhandle 1 and Panhandle 2 projects,3 which we have agreed to acquire from Pattern Development, we own interests in eleven wind power projects located in the United States, Canada and Chile that use proven, best-in-class technology and have a total owned capacity of 1,434 MW, consisting of seven operating projects and four construction projects. We expect our four construction projects will commence commercial operations prior to the end of 2014. Each of our projects has contracted to sell all or a majority of its output pursuant to a long-term, fixed-price power sale agreement with a creditworthy counterparty. Ninety-one percent of the electricity to be generated by our projects will be sold under these power sale agreements, which have a weighted average remaining contract life of approximately 17 years.
We have two classes of authorized common stock outstanding, Class A shares and Class B shares. The rights of the holders of our Class A and Class B shares are identical other than in respect of dividends and the conversion rights of our Class B shares. On December 31, 2014, which is the later of that date and the date on which our South Kent project achieved commercial operations (which occurred on March 28, 2014), and which we refer to as the “Conversion Event,” all of our outstanding Class B shares will automatically convert, on a one-for-one basis, into Class A shares. Our Class B shares, all of which are held by Pattern Development and members of management, have no rights to dividends. See “Description of Capital Stock.”
We intend to use a substantial portion of the cash available for distribution generated from our projects to pay regular quarterly dividends in U.S. dollars to holders of our Class A shares. On November 26, 2013, we announced the initiation of a quarterly common stock dividend and on each of January 30, 2014 and April 30, 2014, respectively we paid a dividend to each of our Class A common shareholders of $0.3125 per Class A share, or $1.25 per Class A share on an annualized basis. We established our initial quarterly dividend level based on a target payout ratio of approximately 80% after considering our expected 2014 and subsequently sustainable cash available for distribution to be generated from our projects, together with the impact of the Class A shares to be issued upon the Conversion Event. We increased our quarterly dividend to $0.322 per Class A share, $1.288 per Class A share on an annualized basis, representing a 3% increase in our quarterly dividend, commencing with respect to dividends payable to shareholders of record on June 30, 2014. The declaration and amount of our future dividends, if any, will be subject to our actual earnings and capital requirements and the discretion of our Board of Directors, and will likely take into account any contribution to our expected sustainable cash available for distribution resulting from projects that we acquire from Pattern Development or third parties.
Our growth strategy is focused on the acquisition of operational and construction-ready power projects from Pattern Development or third parties that we believe will contribute to the growth of our business and enable us to increase our dividend per Class A share over time. We expect that our continuing relationship with Pattern Development, a leading developer of renewable energy projects, will be an important source of growth for our business.
| 3 | We agreed in May 2014 to acquire Panhandle 1 from Pattern Development, subject to the satisfaction of customary closing conditions, shortly after its commencement of commercial operations, which we expect to occur in June 2014. We agreed in December 2013 to acquire Panhandle 2 from Pattern Development, subject to the satisfaction of customary closing conditions, following its commencement of commercial operations, which we expect to occur in the fourth quarter of 2014. See “Management’s Discussion & Analysis of Financial Condition and Results of Operations—Factors that Significantly Affect our Business—Recent Transactions—Project Acquisitions.” |
80
Table of Contents
Our Core Values and Financial Objectives
We intend to maximize long-term value for our shareholders in an environmentally responsible manner and with respect for the communities in which we operate. Our business is built around three core values:
| • | creating a safe, high-integrity, exciting work environment for our employees; |
| • | applying rigorous analysis to all aspects of our business in a timely, disciplined and functionally integrated manner to understand patterns in wind regimes, technology developments, market trends and regulatory, financial and legal constraints; and |
| • | proactively working with our stakeholders to address environmental and community concerns, which we believe is a socially responsible approach that also benefits our business by reducing operating risks at our projects. |
Our financial objectives, which we believe will maximize long-term value for our shareholders, are to:
| • | produce stable and sustainable cash available for distribution; |
| • | selectively grow our project portfolio and our dividend; and |
| • | maintain a strong and flexible capital structure. |
Our Projects
The following table provides an overview of our projects:
| Location and Start-up | Capacity (MW) |
Power Sale Agreements | ||||||||||||||||||||||||||||||||
| Projects |
Location | Construction Start(1) |
Commercial Operations (2) |
Rated (3) |
Owned (4) |
Type | Contracted Volume(5) |
Counterparty |
Counter- party Credit Rating(6) |
Expiration | ||||||||||||||||||||||||
| Operating Projects |
|
|||||||||||||||||||||||||||||||||
| Gulf Wind |
Texas | Q1 2008 | Q3 2009 | 283 | 113 | Hedge | (7) | ~58 | % | Credit Suisse Energy LLC | A/A1 | 2019 | ||||||||||||||||||||||
| Hatchet Ridge |
California | Q4 2009 | Q4 2010 | 101 | 101 | PPA | 100 | % | Pacific Gas & Electric | BBB/A3 | 2025 | |||||||||||||||||||||||
| St. Joseph |
Manitoba | Q1 2010 | Q2 2011 | 138 | 138 | PPA | 100 | % | Manitoba Hydro | AA/Aa1(8) | 2039 | |||||||||||||||||||||||
| Spring Valley |
Nevada | Q3 2011 | Q3 2012 | 152 | 152 | PPA | 100 | % | NV Energy | BBB+/Baa2 | 2032 | |||||||||||||||||||||||
| Santa Isabel |
Puerto Rico | Q4 2011 | Q4 2012 | 101 | 101 | PPA | 100 | % | Puerto Rico Electric Power Authority | BBB/Ba2 | 2037 | |||||||||||||||||||||||
| Ocotillo(9) |
California | Q3 2012 | Q4 2012 | 223 | 223 | PPA | 100 | % | San Diego Gas & Electric | A/A1 | 2033 | |||||||||||||||||||||||
| Q2 2013 | 42 | 42 | PPA | 100 | % | San Diego Gas & Electric | A/A1 | 2033 | ||||||||||||||||||||||||||
| South Kent |
Ontario | Q1 2013 | Q1 2014 | 270 | 135 | PPA | 100 | % | Ontario Power Authority | AA-/Aa2(10) | 2034 | |||||||||||||||||||||||
|
|
|
|
|
|||||||||||||||||||||||||||||||
| 1,310 | 1,005 | |||||||||||||||||||||||||||||||||
|
|
|
|
|
|||||||||||||||||||||||||||||||
| Construction Projects |
||||||||||||||||||||||||||||||||||
| El Arrayán |
Chile | Q3 2012 | Q2 2014 | 115 | 36 | Hedge | (11) | ~74 | % | Minera Los Pelambres | NA | 2034 | ||||||||||||||||||||||
| Grand |
Ontario | Q3 2013 | Q4 2014 | 149 | 67 | PPA | 100 | % | Ontario Power Authority | AA-/Aa2(10) | 2035 | |||||||||||||||||||||||
| Panhandle 1(12) |
Texas | Q4 2013 | Q2 2014 | 218 | 179 | Hedge | (13) | ~77 | % | Citigroup Energy | A-/Baa2 | 2027 | ||||||||||||||||||||||
| Panhandle 2(12) |
Texas | Q4 2013 | Q4 2014 | 182 | 147 | Hedge | (14) | ~80 | % | Morgan Stanley | A-/Baa2 | 2027 | ||||||||||||||||||||||
|
|
|
|
|
|||||||||||||||||||||||||||||||
| 664 | 429 | |||||||||||||||||||||||||||||||||
|
|
|
|
|
|||||||||||||||||||||||||||||||
| 1,974 | 1,434 | |||||||||||||||||||||||||||||||||
|
|
|
|
|
|||||||||||||||||||||||||||||||
| (1) | Represents date of commencement of construction. |
| (2) | Represents date of actual or anticipated commencement of commercial operations. |
| (3) | Rated capacity represents the maximum electricity generating capacity of a project in MW. As a result of wind and other conditions, a project or a turbine will not operate at its rated capacity at all times and the amount of electricity generated will be less than its rated capacity. The amount of electricity generated may vary based on a variety of factors discussed elsewhere in this prospectus. See “Risk Factors” in our 2013 Form 10-K. |
| (4) | Owned capacity represents the maximum, or rated, electricity generating capacity of the project in MW multiplied by our percentage ownership interest in the distributable cash flow of the project. |
| (5) | Represents the percentage of a project’s total estimated average annual MWh of electricity generation contracted under power sale agreements. |
| (6) | Reflects the counterparty’s corporate credit ratings issued by S&P/Moody’s as of April 23, 2014. |
| (7) | Represents a 10-year fixed-for-floating power price swap. See “Business—Operating Projects—Gulf Wind.” |
| (8) | Reflects the corporate credit ratings of the Province of Manitoba, which owns 100% of Manitoba Hydro-Electric. |
81
Table of Contents
| (9) | We initially commenced commercial operations on 223 MW of electricity generating capacity in the fourth quarter of 2012 and commenced commercial operations on the remaining 42 MW of electricity generating capacity from Ocotillo’s additional 18 turbines in July 2013. |
| (10) | Reflects the corporate credit ratings of the Province of Ontario, which owns 100% of the Ontario Power Authority. |
| (11) | Represents a 20-year fixed-for-floating swap. See “Business—Operating Projects—El Arrayán.” |
| (12) | The Panhandle project was separated into a separate Panhandle 1 project, with a Pattern Development-owned capacity of 179 MW, and the Panhandle 2 project, with an owned capacity of 147 MW; acquisition of the Panhandle 1 and 2 projects is pending, and scheduled to close at different times prior to the end of 2014. |
| (13) | Represents a 13-year fixed-for-floating swap. See “Business—Construction Projects—Panhandle 1 and Panhandle 2.” |
| (14) | Represents a 12.25-year fixed-for-floating swap. See “Business—Construction Projects—Panhandle 1 and Panhandle 2.” |
Each of our projects has gone through a rigorous vetting process in order to meet our investment and our lenders’ financing criteria. The development of each project was managed and overseen by our management team over a period of several years and each project was designed to meet or exceed industry, environmental, community and safety standards applicable for industrial-scale power projects. As a result, our projects generally have the following characteristics:
| • | multi-year on-site wind data analysis tied to one or more long-term wind energy reference sources. Pattern Development employs a full-time, five-person meteorological team that manages and verifies third party wind analysis. Our wind analysis is carefully vetted through detailed studies by internal and independent experts in meteorology and statistics to derive an expected production profile based on daily and seasonal wind patterns, structural interference, topography and atmospheric conditions. Our average on-site wind data collection is over four years (or approximately seven years including post-construction data collection); |
| • | long-term power sale agreement designed to ensure a predictable revenue stream. As is typical in our industry, we sell our electricity at a fixed price on a contingent, as-produced basis such that only the electricity that we generate is sold to and must be purchased by the counterparty at the agreed price. Our power sale agreements have a weighted average remaining contract life of approximately 17 years; |
| • | contractually secured real estate property and easement rights for a period well in excess of the project’s expected useful life and contractual obligations. Each of our projects has land rights generally for 30 years or more; |
| • | a firm right to interconnect to the electricity grid through interconnection agreements, which defines the cost allocation and schedule for interconnection, as well as any upgrades required to connect the project to the transmission system. Our interconnection agreements allow our projects to connect to the electricity transmission system. Market rules and protocols generally govern dispatch of our electricity generation and allow it to flow freely into the grid as it is produced, except in very limited circumstances where our projects can be curtailed, for example during system emergencies. To date, our projects have on average been curtailed less than 1% per year; |
| • | long-term, limited-recourse, amortizing project financing designed to match the long-lived nature of our power projects and the related power sales agreements. The interest rates on our long-term loans are fixed for the tenor of the loans or are subject to fixed-for-floating swaps that match the amortization schedules of the debt; |
| • | all necessary construction and operating permits and other requisite federal, state or provincial and local permits, and regulatory approvals secured, which critical permits typically include federal aviation, state or provincial environmental approvals and local zoning and land-use permits and are designed to protect the community, cultural resources, plants, animal and other affected resources at or near the facility; |
| • | fixed-price turbine supply and construction contracts with guaranteed completion dates to ensure that our projects are completed on time and within the estimated budget. The construction period for our projects has typically been less than one year, although in certain instances circumstances warrant a longer construction period; |
82
Table of Contents
| • | an operations and maintenance service program based on our own on-site personnel and central operations management as well as equipment warranties and service arrangements with qualified contractors experienced in wind project maintenance. We have existing equipment warranties for approximately 92% of our operating turbine units; and |
| • | safety, environmental and community programs to support our existing projects and relationships in the communities in which we operate. |
Our ability to transition each of our construction projects to commercial operations and achieve anticipated power output at all of our operating projects is subject to numerous risks and uncertainties.
Our Strategy
We intend to make profitable investments in environmentally responsible power projects, while embracing a long-term commitment to the communities in which we operate. To achieve our financial objectives while adhering to our core values, we intend to execute the following business strategies:
Maintaining and Increasing the Value of Our Projects
We intend to efficiently operate our projects to meet projected revenues and cash available for distribution. We expect to maximize the long-term value of our projects by focusing on value-oriented project availability (by ensuring our projects are operational when the wind is strong and PPA prices are at their highest) and by regularly scheduled and preventative maintenance. We believe that good operating performance begins with a long-term maintenance program for our equipment. We also seek to improve performance or lower operating costs by working closely with our equipment vendors and considering contracting with third parties, if appropriate.
We believe it is important to employ our own personnel in aspects of our business that we deem critical to the value of our projects but to contract with reliable third parties for on-going major maintenance of our turbines and similar specialized services such as repairs on our substations or transmission lines. As a result, we have and expect to continue to employ on-site personnel, maintain a 24/7 OCC to monitor our projects and control all critical aspects of commercial asset management. We also believe it is important to invest in our employees to give our operating personnel the tools to pursue our objectives through regular training, performance incentives, integrating teams of different experts, use of advanced software programming and regular upgrading of our automated systems. See “Business—Organization of Our Business.”
Completing Our Construction Projects on Schedule and Within Budget
We intend to promote the success of our business by completing our construction projects on schedule and within budget, transitioning projects under construction to commercial operation on a timely basis and efficiently operating our projects to maximize project revenues and minimize operating costs. Including the Panhandle 1 and Panhandle 2 projects, which we have agreed to acquire from Pattern Development, and which we expect to complete, subject to the satisfaction of customary closing conditions, at different times prior to the end of 2014, our construction projects consist of interests in four projects that we expect will contribute an additional owned capacity of 429 MW in 2014, for an aggregate of 1,434 MW together with our currently operating projects.
We utilize experienced, creditworthy contractors and proven technology to build high-quality power projects. In addition, over the past 11 years, our management team has overseen the construction and commencement of commercial operations of 26 wind power projects, and our project and construction management capabilities are well respected throughout our industry. By capitalizing on these significant construction and operational resources available to us, including those available to us through the Management Services Agreement, we intend to complete the construction and commence commercial operations at our construction projects in accordance with construction schedules and within budget.
83
Table of Contents
Maintaining a Prudent Capital Structure and Financial Flexibility
We intend to maintain a conservative approach to our capital structure to protect our ability to pay regular dividends and fund investments to provide for future growth. Power projects by their nature require significant up front capital investment and as a result we believe it prudent to match these long-lived assets with long-term debt and/or equity. The average maturity of our project-level debt is approximately 13 years and we have an expected average annual debt service coverage ratio over the remaining scheduled loan amortization periods of approximately 1.7 to 1.0. This prudent capital structure coupled with our predictable price for our electricity and our standard operations and maintenance programs help to achieve a stable cash flow profile.
Consistent with our existing indebtedness, we expect to typically utilize fixed-rate indebtedness (or swapping any variable rate indebtedness) with strong debt service coverage ratios to finance projects. We believe this approach, together with a strategic consideration of project-level financial restructuring and recapitalization opportunities, will contribute to our ability to maintain and, over time, increase our cash available for distribution.
Working Closely With Our Stakeholders
We believe that close working relationships with our various stakeholders, including suppliers, power sales agreement counterparties, regulators, the local communities where we are located and environmental organizations and with Pattern Development and other developers enable us to best support our existing projects and will help us access attractive, construction-ready projects. For example, by working closely with the regulatory agencies and the community, we believe that we create an environment within which if problems are identified we can work constructively and efficiently to resolve the problems and minimize the impact to our operations.
Selectively Growing Our Business
Our strategy for growth is focused on the acquisition of operational and construction-ready power projects from Pattern Development and other third parties that we believe will contribute to the growth of our business and enable us to increase our dividend per Class A share over time. We expect that projects we may acquire in the future will represent a logical extension of our existing business and be consistent with our risk profile, and that any incremental assumption of risk will require commensurate expectations of higher returns. As a result, our near-term growth strategy will remain focused on largely contracted cash flows with creditworthy counterparties and operating or in-construction projects.
We expect that new opportunities will arise from our relationship with Pattern Development, which provides us with the opportunity to acquire projects that it successfully develops and efficiently complete construction and achieve commercial operations at these projects. At the time of our initial public offering, we identified six projects at Pattern Development with an aggregate owned capacity of 746 MW as the Initial ROFO Projects. Pattern Development subsequently increased the owned capacity of the Panhandle projects by 78 MW to 326 MW, which includes the Panhandle 1 project, with a Pattern Development-owned capacity of 179 MW, and the Panhandle 2 project, with a Pattern Development-owned capacity of 147 MW. We agreed in December 2013 to acquire two of the Initial ROFO Projects, Grand and Panhandle 2, with an aggregate owned capacity of 214 MW, and in May 2014 to acquire the Panhandle 1 project, with an owned capacity of 179 MW. The remaining Initial ROFO Projects represent a total Pattern Development-owned capacity of 441 MW, and our Gulf Wind Call Right and Project Purchase Right will provide us the initial opportunity to purchase these projects, as well as any other of the currently owned and future construction-ready power projects that Pattern Development intends to sell.
Our management team will rigorously review and analyze new market opportunities and selectively consider opportunities offered by Pattern Development as well as those offered by other third parties, either independently or jointly with Pattern Development. We believe our management team provides us with the experience to bring both currently owned and subsequently acquired domestic and international power projects online.
84
Table of Contents
Reintegration of Pattern Development Employees
Under the terms of the Management Services Agreement, upon the completion of the first 20 consecutive trading day period during which our total market capitalization is no less than $2.5 billion, the employees of Pattern Development will become our employees. We refer to this event as the employee reintegration. For the purposes of determining the employee reintegration date, total market capitalization will be determined by multiplying the number of our issued and outstanding Class A shares (assuming all of our then outstanding Class B shares had converted into Class A shares prior to such date) and the closing price of our Class A shares as reported on the then primary stock exchange on which our Class A shares are listed. We will not be required to make any payments to Pattern Development upon the occurrence of the employee reintegration, other than the payment of any statutory severance payments that may as a result be due and payable to Canadian and Chilean employees who may be employed at that time. The employee reintegration will result in our complete internalization of the administrative, technical and other services that were initially provided to us by Pattern Development under the Management Services Agreement. The occurrence of the employee reintegration will neither alter our Purchase Rights nor the terms of the Management Services Agreement.
Upon the employee reintegration, we expect that our principal focus will continue to be owning operational and under-construction power projects. However, the employee reintegration is expected to enhance our long-term ability to independently develop projects and grow our business. Following the employee reintegration, we will continue to provide management services to Pattern Development (including services from the reintegrated departments of Pattern Development) to the extent required by Pattern Development’s remaining development activities, and Pattern Development will continue to pay us for those services primarily on a cost reimbursement basis.
Competitive Strengths
We believe our key competitive strengths include:
Our High-Quality Projects
We believe our high-quality projects are better positioned to generate stable long-term cash flows compared to typical projects in the industry and will generate available cash in excess of our initial dividend level, providing us the financial resources for investing in new opportunities. Having high-quality projects also provides us access to low-cost project-level debt and strong stakeholder relationships. The key attributes and strengths of our projects are:
Long-Term, Fixed-Price Power Sale Agreements. We believe our long-term, fixed-price power sale agreements with nine distinct creditworthy counterparties will deliver stable long-term revenues, although we note on February 10, 2014 the credit rating of PREPA, the Puerto Rican counterparty, was downgraded. Our power sale agreements cover 91% of the electricity to be generated across our projects with a weighted average remaining contract life of approximately 17 years.
Geographically Diverse Markets and Wind Regimes. Our geographically diverse projects are located across regions generally characterized by high demand for renewable energy, documented reliable wind resources, deregulated energy markets and favorable renewable energy policies. The geographic diversity of our projects—from California to Puerto Rico, and Manitoba to Chile—helps insulate us against regional wind fluctuations as well as adverse regulatory conditions in any one jurisdiction.
State-of-the-Art Wind Turbine Technologies. Our projects utilize state-of-the-art, proven, reliable wind turbine technologies. Our projects utilize Siemens 2.3 MW, General Electric GWT 1.85-87 and Mitsubishi MWT95/2.4 wind turbines, some of the most reliable and proven turbine technologies available in the market. The wind turbines were in each case specifically selected for the site conditions to ensure optimal performance and longevity of the machines. Our turbines have an average asset age of less than two and a half years.
85
Table of Contents
Our Strong Reputation in the Industry
We believe the success of our team has created a highly respected organization which attracts talented people and new opportunities. Our integrity, expertise, and solutions-oriented approach is attractive to stakeholders and parties providing services to our existing projects as well as those who are looking for buyers of their assets.
Our Spring Valley project received the Wind Project of the Year Award in 2012 from POWER-GEN International (the publisher of Power Engineering and Renewable Energy World), which we believe is considered among the most prestigious awards in the renewable energy industry. Our El Arrayán project won two Chilean International Renewable Energy Awards, presented at the Chilean International Renewable Energy Congress (CIREC) 2012 annual conference in Santiago. The awards were the Best Renewable Energy Project in 2012 (Mejor proyecto de Energía Renovable de 2012) and the Best Renewable Energy Joint Venture (Mejor colaboración entre dos empresas). In 2013, our Ocotillo project received an award for its outstanding environmental analysis and documentation from the California Association of Environmental Professionals and also received the Renewable Project Finance Deal of the Year award from Power Finance & Risk published by Power Intelligence. Also in 2013, our Santa Isabel project won the Outstanding Project of the Year Award in Land Surveying and Environmental Engineering from the Professional College of Engineers and Land Surveyors of Puerto Rico.
Our Approach to Project Selection
Our approach to project selection aims to deliver superior financial results and minimize long-term operating risks by focusing on the acquisition of projects that are operational or construction-ready and have long-term power sales agreements with creditworthy counterparties. Once we identify an attractive opportunity, we apply rigorous analysis in a timely, disciplined and functionally integrated manner to evaluate the wind regime, technology options, site design improvement, regional market trends and regulatory, financial and legal constraints. The most attractive projects offer the proper combination of land accessibility, power transmission capacity, attractive power sales markets and favorable and dependable winds. We believe the members of our management team are recognized by their industry peers as skilled in identifying, analyzing and executing successful power project acquisitions.
Our approach to project selection has also enabled us to successfully execute new projects in a complex renewable energy market characterized by economic, political and regulatory changes that affect energy investment opportunities. Examples include the cyclical nature of U.S. federal incentives and the challenge of realizing the full value of these incentives, increasing environmental and permitting concerns, reduced PPA opportunities that are influenced by changing power markets, a cyclical wind turbine supply environment that alternates between tight and loose supply constraints, changes in wind turbine technology, changes in availability of debt markets, and changes in electricity market structure. Our management team has had success in identifying and executing attractive acquisitions through all of these changing circumstances. For example, through our innovative approach to our business, we developed a financial structure to realize value for PTCs, implemented ground-breaking radar technology to protect bird and bat populations, became one of the first IPPs to capture value from a number of newly deregulated markets and found long-term debt solutions even when the debt markets were highly constrained.
As a fundamental principle, we seek to acquire projects that will contribute measurable improvements in our Adjusted EBITDA and our cash available for distribution and that will have a risk profile consistent with our current business objectives. In addition, we view projects as long-term partnerships with all stakeholders, and the benefits that we pledge to the community are fundamental to creating a positive environment for a project’s long-term success. This has frequently resulted in community benefits on some of our projects that exceed market expectations and occasionally in decisions to cancel projects where our management team felt that we could not adequately address stakeholder concerns.
86
Table of Contents
Our Relationship with Pattern Development
Our continuing relationship with Pattern Development provides us with access to a pipeline of acquisition opportunities. We believe Pattern Development’s ownership position in our company incentivizes Pattern Development to support the successful execution of our objectives and business strategy, including through the preparation of projects to the stage where they are construction-ready. Pattern Development has a dedicated development team of professionals with significant experience across the spectrum of power project development:
| • | site selection; |
| • | meteorological and market analysis; |
| • | land acquisition; |
| • | transmission rights; |
| • | power contract negotiation; |
| • | project financing; |
| • | construction management; |
| • | government relations; |
| • | community outreach; and |
| • | environmental permitting. |
Pattern Development also has teams devoted to engineering, legal and project financing that enable it to develop and construct projects through to commercial operations. We believe Pattern Development’s focus on project development combined with our Project Purchase Right will complement our acquisition strategy, which focuses on the identification and acquisition of operational and construction-ready power projects.
Our Proven Management Team
Our proven management team has extensive experience in all aspects of the independent power business, a demonstrated track record of success in power project investment management, operation and construction. Our and Pattern Development’s management teams include professionals who have a history of financial and technological innovation in the power industry as well as a proven track record in managing energy assets during both periods of growth and economic challenge. While working together at Pattern Development and prior to its formation, members of our management team were responsible for, and successfully financed and managed, over $12 billion of infrastructure assets, including over 3,000 MW of wind power projects (representing a wind business compound annual growth rate, or “CAGR” of 34% from 2003 to 2014, measured by cumulative wind MW installed), several independent transmission projects and other conventional power assets. Before forming Pattern Development in 2009, our and Pattern Development’s management teams developed, financed, constructed or acquired and operated 2,100 MW of wind power projects, as well as transmission projects and other power projects. Since the formation of Pattern Development in 2009, the Pattern Development management team has acquired and developed the operational and in-construction wind power projects that comprise our owned capacity of 1,434 MW, representing a CAGR of 51%, and more than a 3,000 MW portfolio of development assets, which we will have preferential rights to acquire. Additionally, our and Pattern Development’s management teams have extensive acquisition, finance and commodity-hedging expertise, allowing us to react to opportunities, optimize our capital structure and manage risk.
87
Table of Contents
We believe our and Pattern Development’s management teams’ extensive experience and involvement in bringing domestic and international power and infrastructure projects, from the initial development stage through financing to on-going operations and maintenance, positions us to operate our projects efficiently and generate strong cash available for distribution.
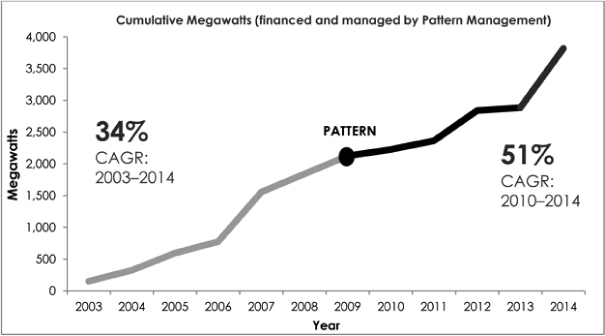
Organization of Our Business
Our business is organized around our current projects. In the future, we expect that our business will include additional operating and construction-ready projects acquired from Pattern Development and other third parties. In addition to our executive officers, we employ 40 full-time staff in two key functional areas associated with operations and maintenance and commercial management. We rely on some services to be performed by third parties, including Pattern Development, but have all the core functions required for overseeing constructing, operating and managing of our projects.
Operations and Maintenance
Our operations team’s objective is to maximize revenues from each of our projects rather than focus solely on technical plant performance metrics. In order for us to maximize our revenues, we seek to operate and maintain our equipment so that we can ensure our equipment is productive during times of optimal wind resources and power prices. Our approach to achieving efficient operations involves the following key strategic objectives;
| • | Safety. We believe that the safety of our workers, our contractors, our visitors and the community is paramount and takes precedence over all other aspects of operations. To date, we have not experienced any serious lost-time incident or worksite accidents at any of our sites. We achieve this through promoting a strong safety culture, implementing a formal safety management program, employing a full time in-house safety program manager and conducting annual site safety audits. |
| • | Equipment reliability and fleet management. We have selected high-quality equipment with a goal of having a concentration of equipment from top manufacturers. We employ the Siemens 2.3 MW turbine |
88
Table of Contents
| at nine of our eleven project sites, the General Electric 1.85-87 at the tenth and the Mitsubishi MWT95/2.4 at the eleventh. With a combination of high-quality equipment and scale, we have structured our fleet such that we may: |
| • | expect high availability and long-term production from the equipment; |
| • | develop operating expertise and experience, which can be shared among our operators; |
| • | obtain a high level of attention and focus from the manufacturer; and |
| • | maintain a shared spare parts inventory and common operating practices. |
| • | Long-term service and maintenance. Good operating performance begins with a long-term maintenance approach to the equipment. While approximately 92% of our operating turbine units remain under warranty, on-going maintenance and replacement of parts is essential to equipment longevity. All of our wind turbines are managed under service agreements that ensure regular repair and replacement of parts. In some situations, we conduct competitive solicitations between the manufacturers as well as top-tier, third-party, independent service providers for conducting wind turbine service and maintenance. As a matter of operating practice, our turbine service program typically does not require shut down of the entire facility and is performed around the project’s production profile to minimize lost revenue. In March 2014, we entered into long-term service contracts with Siemens described above under “Management’s Discussion & Analysis of Financial Condition and Results of Operations—Factors That Significantly Affect our Business—Other Transactions and Events.” |
| • | Inspection. As our warranty contracts and service arrangements expire, we conduct extensive third-party end of warranty inspections to identify any potential equipment or service issues which can be remedied by the manufacturer pursuant to their contractual obligations under the warranty and ensure the projects start their post-warranty periods with reliably functioning equipment. |
| • | Staff training. We employ highly experienced personnel from a variety of power generation sectors. In addition, we bring into the organization a broad base of best industry practices. After hiring, we provide our operators with on-going training, in-house and from manufacturers and from third parties, to keep them current on latest industry practices and experiences. |
| • | Focus on our value-added capabilities. In order to maximize efficiencies, we concentrate our resources on our core operating areas. In particular, we believe it is critical to have on-site management personnel that are our employees and provide oversight of all site activities to assure our safety and financial objectives have priority. We contract with third parties, often the turbine manufacturer, for on-going major maintenance of the turbines and similar specialized services such as repairs on our substations or transmission lines. |
| • | Maximize structural efficiencies. Our operating resources are allocated across three key areas, site operations, our 24/7 OCC and other central support services. |
| • | Site-operators. All of our projects have on-site operators, which allows for direct management of the projects and all contractors working on site. In addition, these individuals also strive for a high level of involvement in the communities we serve, including with respect to our power purchasers, the regulatory agencies and local communities. Each of our projects has the latest, state-of-the-art supervisory control and data acquisition systems that help us efficiently assess operating faults and plan preventative maintenance. |
| • | 24/7 Operations Control Center. Our OCC, located in Houston, Texas, focuses on monitoring and controlling each wind turbine to prevent downtime, monitoring regional and local climate, tracking real time market prices and, for some of our projects, monitoring certain environmental activities. In addition, the OCC supports various other central activities such as safety, power marketing, and regulatory compliance and maintains constant communications with each of our site operators, which frees our site operators to concentrate on day-to-day equipment and safety activities. |
89
Table of Contents
| • | Central Support Services. In addition to our OCC, our Houston office also hosts the balance of our operations organization which provides critical support to the operating projects. This team includes our operations management team and specialists in safety, environmental management, regulatory compliance, contract management, turbine specialists and asset administration. |
| • | Equipment improvements. We believe that our foundation of reliable and proven equipment allows us to make further operating improvements over time. In connection with our long-term turbine service agreements with Siemens, it has agreed to make certain equipment improvements to our projects, which includes, among other things, retrofitting our blades with vortex generators and dino tails to improve the shape of the power curve, and software adjustments, such as increasing the cut-out speed and allowing continued operation through higher wind periods. We continuously evaluate new technologies to identify promising solutions which will improve our projects’ performance and increase our electricity generation. |
Commercial Management
Our commercial management group is tasked with protecting the long-term value of our projects’ commercial arrangements. We have adopted a commercial strategy of managing our projects and other assets with an in-house commercial management group acting as “owner’s representatives.” The role of the commercial management group is to oversee contract management, environmental management, community relations, power marketing and finance and to closely monitor the performance of each project from an owner’s point of view in order to maximize financial performance and minimize risk. Although the commercial management group manages the day-to-day aspects of commercial management, functional and managerial expertise is often brought in to support key areas such as legal, finance and power marketing.
| • | Contract Management. With a group of seasoned managers, our commercial management group optimizes the commercial performance of our assets, services the project debt, manages project agreements and compliance with relevant laws, regulations and rules and has ultimate responsibility for the financial performance of each project. The team also manages our real estate obligations as well as our corporate insurance program, local government obligations, home office, remote facilities and mobile assets. Our commercial management group also facilitates a seamless transfer of responsibilities from the development team through construction to commercial operations in order to ensure all contractual and regulatory obligations are clearly captured and tracked in a formal compliance program. |
| • | Environmental Management and Community Relations. Adaptive environmental management is increasingly the standard by which power projects are managed and our company has been a leader in adopting strategies to minimize environmental impacts, such as bird and bat fatalities. Each project has different circumstances so our environmental and community programs range from hiring of local personnel and historical preservation to use of advanced radar systems to monitor birds and bats and presence of on-site biologists to assist in species recognition and mitigation management. By proactively addressing the concerns of the regions, our environmental management and community relations program seeks to minimize additional costs and burdens from a potential increase in regulations or law suits. |
| • | Power Marketing. A crucial element of a successful project is assuring revenue from the sale of power and other environmental attributes. We manage the risk associated with fluctuations in electricity prices across our business by seeking to commit the electricity we generate under long-term, fixed-price power sale agreements and have been able to secure 91% of our electricity sales under such arrangements. Our uncontracted power and renewable attributes are sold in the spot market or under shorter term contracts to optimize revenue realization. We believe this management philosophy will result in a steady, predictable source of revenue for each of our projects. |
| • | Finance. Our projects are typically funded with construction financing during the construction phase which converts to long-term financing when the project commences commercial operations. Debt at |
90
Table of Contents
| each individual project is project financed, which means that, with very limited exceptions, the lenders have no or only limited recourse to other assets of the company other than the assets that are being financed. Debt for our projects is typically provided by commercial banks and institutional lenders that have the expertise to evaluate the risks associated with the construction and operation of a wind power project, including evaluation of the equipment technology, construction, operations and wind resources. These lenders provide construction financing for many sizable industrial and infrastructure projects. Since debt comprises a significant portion of total project capitalization, achievement of construction financing is a general indication that lenders and their independent consultants have carefully evaluated the project and find it viable for long-term financing. Given the complexity involved in financing large infrastructure assets, projects are often completed with a syndicate of lenders, and the credibility we have established among the financial community allows lenders to have confidence in the quality of our projects and enables us to secure competitive financing terms and other financing efficiencies for our projects. Over the years our team has developed close relationships with many of the active renewable energy lenders. |
Engineering and Construction
The key leadership in our engineering and construction group resides within our company, which provides us with the in-house capabilities required to evaluate a project’s design and construction process. We rely as necessary upon additional personnel from third-party sources and Pattern Development, with respect to the construction of our projects. We also typically enter into fixed-price construction contracts for our projects’ construction with a guaranteed completion date to encourage completion on time and within budget.
Project design involves close and frequent communication with both field development personnel as well as the construction contractor in order to develop a project that conforms to local geotechnical and topographic characteristics while accommodating permitting and real estate restrictions. The developer also strives to integrate experience obtained from operating projects in order to design projects with optimal maintenance and equipment-availability profiles. During construction, we are responsible for overseeing the construction contractor and turbine-vendor activities to ensure that the construction schedule is met. Collaboration among engineers and managers on each of our projects and with our major equipment suppliers allows us to efficiently transition from construction to commercial operations and to identify and process technical improvements over the life-cycle of each project.
Our engineering and construction team is comprised of highly experienced project and construction managers and includes personnel who have supervised the design and completion of construction of 26 wind power projects representing over 2,800 MW over the last eleven years. We set, and ensure compliance with, design specifications and take an active role in supervising field work, safety compliance, quality control and adherence to project schedules. Each project has a dedicated resident construction manager, and other engineering and construction functions are centralized, which allows the group to efficiently scale its resources to support our developing global platform and growth strategy.
Investing
We are organized in a manner that will allow us to independently and comprehensively evaluate investments in new projects. Key members of our management team, including Messrs. Garland, Armistead, Elkort, Lyon, and Pedersen, have spent extensive periods of their careers in the investment advisory, principal investment and finance field. While working together at Pattern Development and prior to its formation, members of our management team were responsible for, and successfully financed and managed, over $12 billion of infrastructure assets, including over 3,000 MW of wind projects, several independent transmission projects and other conventional power projects.
As a major part of our growth strategy, we intend to seek to acquire projects that would contribute measurable amounts to our Adjusted EBITDA and our cash available for distribution. Our approach to project
91
Table of Contents
selection is focused on projects (i) with strong economics that will support our long-term financial goals, as determined by intensive analysis and in-depth due diligence, (ii) in which we can add value and which have characteristics that are strategically compatible with our other projects and overall business, and (iii) which meet our core values, including our commitments to environmental stewardship and being a good neighbor in the communities in which our projects are located. To achieve proper investment management, we have implemented processes to ensure rigorous analysis and proper internal approval controls, including preparing formal investment approval documentation, maintaining strict limits on delegation of authority for making capital commitments, and vetting our assumptions with independent technical experts and advisors. In addition, we believe that alignment and independence is critical to successful investing. As a result, we require that certain of our executive officers maintain a minimum ownership interest in our company and have structured our Board of Directors to include a conflicts committee to review specific matters that the Board of Directors believes may involve conflicts of interest, primarily acquisitions from Pattern Development or its affiliates.
We view projects as long-term partnerships with all the stakeholders, and the benefits that we pledge to the community are fundamental to creating a positive environment for a project’s long-term success.
Our Projects
Including the Panhandle 1 and Panhandle 2 projects, which we have agreed to acquire from Pattern Development, and which we expect to complete, subject to the satisfaction of customary closing conditions, at different times prior to the end of 2014, we own interests in eleven wind power projects, consisting of seven operating projects and four construction projects. Each of our projects has contracted to sell all or a majority of its output pursuant to a long-term, fixed-price power sale agreement with a creditworthy counterparty. We expect any project we acquire in the future will be party to a similar agreement, but we may acquire projects with greater levels of uncontracted capacity.
Operating Projects
Gulf Wind
Gulf Wind is a 283 MW project located on the Gulf Coast in Kenedy County, Texas. The project consists of 118 2.4 MW Mitsubishi MWT95/2.4 turbines and commenced commercial operations in 2009. Pattern Development acquired this operational project in March 2010. Gulf Wind is held by a tax equity partnership with MetLife. We, Pattern Development and MetLife currently own approximately 40%, 27% and 33% of Gulf Wind, respectively.
The project is located in the South Zone of the ERCOT market and sells 100% of its power output into the ERCOT market, receiving the locational marginal price, or “LMP.” Approximately 58% of the project’s expected annual electricity generation has been hedged under a 10-year fixed-for-floating swap with Credit Suisse Energy LLC. This financial hedging agreement settles using the South Trading Hub hourly LMP weighted by the settlement volume in each hour. The hourly notional settlement volume varies to match the project’s hourly average production profile. Gulf Wind’s obligations under the hedge are secured by a first priority lien on substantially all of the assets of Gulf Wind and a first priority lien on the membership interests in the operating project entity up to approximately $73 million, both of which are first in priority relative to the second priority liens associated with the debt financing up to approximately $250 million and which are second in priority over the third-priority liens in favor of Credit Suisse Energy LLC in excess of the first and second lien caps.
The project is connected to the Electric Transmission Texas 345 kV transmission system and is located on approximately 9,600 acres in Kenedy County, TX and is entirely on land owned by a single private landowner. Gulf Wind entered into an easement agreement with a single landowner on May 9, 2007 for an initial term of 30 years and with an option to extend for an additional 10 years. The land, which is primarily grassland and dunes, is part of a very large ranch. In addition to our wind operations, the ranch is also used for cattle raising, oil & gas production, and private hunting outings. Due to the afternoon sea breeze effect along the coast, Gulf Wind benefits from an average daily wind production profile that generally follows the typical electricity demand load profile, which is heaviest during the daytime.
92
Table of Contents
Hatchet Ridge
Hatchet Ridge is a 101 MW project located in Burney, California. The project consists of 44 2.3 MW Siemens turbines and commenced commercial operations in December 2010. The project is connected to the PG&E transmission system.
The project sells 100% of its electricity generation, including environmental attributes, to PG&E under a 15-year PPA that expires in 2025. The price under the PPA is a stated price per MWh, adjusted by seasonal time of day multipliers, with no escalation. Hatchet Ridge is required to post performance security in the amount of $21.2 million to secure damages under the PPA. The PPA also contains customary termination and event of default provisions. Under the terms of the PPA, Hatchet Ridge is required to pay liquidated damages for failure to produce a certain amount of energy in each of two consecutive years.
The project, located along a gentle ridge top, spans an area of roughly 2,700 acres in Shasta County, CA and is entirely on land owned by two private landowners, subject to 30-year wind power ground lease agreements.
St. Joseph
St. Joseph is a 138 MW project located near St. Joseph, Manitoba, just north of the U.S. border. The project consists of 60 2.3 MW Siemens turbines and commenced commercial operations in April 2011. The project is connected to the Manitoba Hydro transmission system. St. Joseph was the second commercial wind power project, and is the largest, in Manitoba.
The project sells 100% of its electricity generation, including environmental attributes, to Manitoba Hydro under a 27-year PPA that expires in 2039. The price under the PPA is a stated price per MWh at inception of the PPA, with approximately 20% of the stated price escalating annually at the consumer price index for Canada, or “Canadian CPI.” The project will additionally receive the ecoEnergy federal incentive of C$10/MWh for approximately ten years for up to 423,108 MWh of production per year. Under the PPA, if there is a sale of the project, Manitoba Hydro has a right of first offer to purchase the St. Joseph project for a fixed minimum purchase price on terms specified by us. In addition to customary termination and event of default provisions, the PPA will terminate upon the exercise by Manitoba Hydro of its right of first offer to purchase the St. Joseph project, and St. Joseph will trigger an event of default, if after the first three contract years, it fails to supply at least 80% of certain minimal energy obligations for two consecutive years.
The project is located on approximately 125 square kilometers of agricultural land in the Rural Municipalities of Montcalm and Rhineland, Province of Manitoba. The project is constructed on privately owned lands pursuant to right-of-way agreements with 64 private landowners, with 40-year terms and all on substantially the same form of agreement covering all of turbine sites, collection lines, roads and an operations and maintenance building for the project. In addition, the project purchased a small parcel of property for the project substation.
Spring Valley
Spring Valley is a 152 MW project located in White Pine County, Nevada. The project consists of 66 2.3 MW Siemens turbines and commenced commercial operations in August 2012. The project is connected to the NV Energy transmission system. Spring Valley was Nevada’s first commercial wind power project.
The project sells 100% of its electricity generation, including environmental attributes, to NV Energy, under a 20-year PPA that expires in 2032. The price under the PPA is a stated price per MWh escalating at 1.0% per year. Spring Valley is required to reimburse NV Energy for replacement costs for any annual energy shortfall and post operating security in the amount of $6.3 million for the performance of its obligations under the PPA. The PPA also contains customary termination and event of default provisions. In connection with the PPA and subject
93
Table of Contents
to certain pricing conditions, NV Energy was granted an option to acquire up to 50% of the equity membership interests in Spring Valley held by our project-level operating subsidiary, which option expires in August 2014. NV Energy’s right to acquire the equity membership interests is subject to negotiation of terms and conditions that are acceptable to us. If we fail to agree on terms within 120 days of commencing negotiations, we have the right to terminate the option. In any event, if the option is exercised, the exercise price for the option is up to 50% of the fair market value of the Spring Valley project based on its assets and liabilities at the time of exercise and assuming a 25-year life of the Spring Valley project, provided that in no event will the agreed price result in a book loss to us.
The project is located on approximately 7,680 acres in White Pine County, NV on federal land administered by the Bureau of Land Management. Spring Valley was granted a right-of-way from the Bureau of Land Management with a 30-year term, which terminates on December 31, 2040.
Santa Isabel
Santa Isabel is a 101 MW project located on the south coast of Puerto Rico. The project consists of 44 2.3 MW Siemens turbines and commenced commercial operations during the fourth quarter of 2012. The project is connected to the Puerto Rico Electric Power Authority, or “PREPA,” transmission system. Santa Isabel is Puerto Rico’s first commercial wind power project and is reflective of the Puerto Rican government’s efforts to diversify its energy sources away from fossil fuels by fostering local renewable energy projects.
The project sells 100% of its electricity generation including environmental attributes to PREPA under a 20-year PPA, expiring in 2030, with automatic 5-year extensions unless terminated at the end of any term or extension by us, and PREPA may terminate after year 25 if there is a liquid spot market for electricity or the agreement has been in effect for 30 years. Under the PPA, PREPA has agreed to purchase electricity from us subject to a 75 MW per hour cap, with such cap increasing to 95 MW during certain hours of certain months. If the project is capable of generating electricity in excess of the applicable cap, PREPA has the option, but not the obligation, to purchase any such surplus electricity actually generated at the PPA price. The price for energy under the PPA and the price for RECs under a separate purchase agreement are both a stated price per MWh. Each price escalates at 1.5% per year. In the case that project electricity generation exceeds a threshold multiple of contractual electricity generation in a given year, the price for energy under the PPA reduces until output drops below contractual output for such year. Santa Isabel is required to post operating security in the amount of $3.0 million for the performance of its obligations under the PPA. In addition to customary termination and event of default provisions, the PPA may terminate if Santa Isabel fails to generate a threshold energy output during any 12 consecutive months.
The project is located on approximately 5,500 acres of land owned by the Puerto Rico Land Authority, or “PRLA,” which is actively farmed by private operations under land leases with the PRLA. The project entered into a deed of lease, easements and restrictive covenants with the PRLA on October 6, 2011, with a 30-year initial term, together with up to 45 years in renewal options, comprising substantially all project infrastructure, including all turbine sites, collection lines, roads, substation and operations and maintenance buildings for the project. The project also has entered into transmission line leases for the transmission line corridor from the project substation to the point of interconnection with PREPA with four private landowners.
Ocotillo
Ocotillo is a 265 MW project located in western Imperial County, California. The project consists of 112 2.37 MW Siemens turbines. We initially commenced commercial operations on 223 MW of Ocotillo’s electricity generating capacity during the fourth quarter of 2012 and commenced commercial operations on the remaining 42 MW of electricity generating capacity from Ocotillo’s additional 18 turbines in July 2013. The project connects to the San Diego Gas & Electric, or “SDG&E,” 500 kV transmission system and has a large generator interconnection agreement with SDG&E and CAISO.
94
Table of Contents
The project sells 100% of its electricity generation, including capacity and environmental attributes, to SDG&E under a 20-year PPA. The PPA has a stated price per MWh with no escalation. Ocotillo is required to post performance security in the amount of $26.7 million to secure damages. The PPA also contains customary termination and event of default provisions. Under the PPA, Ocotillo is required to pay liquidated damages for failure to produce a certain amount of energy in the two previous years.
Ocotillo is the subject of active lawsuits brought by a variety of project opponents. See “Legal Proceedings.”
The project is located on approximately 12,500 acres in Imperial County, CA and is almost entirely on federal land administered by Bureau of Land Management. The project was granted a right-of-way from the Bureau of Land Management with a 30-year term, which terminates on December 31, 2041. All the project’s turbine sites, a substation and an operations and maintenance building are located on land administered by the Bureau of Land Management. The project has entered into collection and distribution line easements with two private landowners for a portion of the underground collection system. In addition, the project has purchased a small parcel of land for a portion of the underground collection system. The project also has a lease agreement in place with a private landowner for an additional 26 acres of private land.
South Kent
South Kent is a 270 MW project located in the municipality of Chatham-Kent in southern Ontario. The project consists of 124 2.3 MW Siemens turbines that have been de-rated to a range from 1.903 MW to 2.221 MW in order to facilitate permitting compliance. The project connects to the Hydro One Networks, Inc., or “HONI,” 230 kV transmission system at the existing Chatham switching station. The South Kent project commenced construction in the first quarter of 2013 and achieved commercial operations in March 2014.
The project sells 100% of its electricity generation, including environmental attributes, to the OPA under a 20-year PPA. The PPA has a stated price, which indexes at Canadian CPI from September 2009 until the December 31 of the year prior to commencement of commercial operations; thereafter 20% of the PPA price escalates at Canadian CPI. The PPA was granted in connection with the Green Energy Investment Agreement, an agreement among Samsung, Korea Electric Power Corporation and the Province of Ontario. This agreement supports growth in domestic renewable energy through both jobs creation and support of wind power and solar power projects.
The project is a 50/50 joint venture between us and Samsung, with shared development and financing responsibilities. Samsung has customary rights to purchase our interest in South Kent upon any subsequent sale of the project by us.
The project is located on approximately 165 distinct private land parcels and includes a conglomeration of multiple acquired wind power projects and greenfield acquired lands. The project has renegotiated and standardized each of the land agreements that were assumed along with the acquired projects. All land parcels containing project infrastructure are contracted under registered right-of-way agreements, providing for real estate interests in favor of the project in the form of easements-in-gross in respect of each land parcel, enforceable for a term of not less than 40 years.
The project’s generation tie to the HONI transmission system is constructed on real estate comprised primarily of 26 kilometers of an abandoned railway corridor running across the project area, together with additional private land transmission easements and ancillary interests.
95
Table of Contents
Construction Projects
El Arrayán
El Arrayán is a 115 MW project located on the coast of Chile, near Ovalle in the Fourth Region. The project consists of 50 2.3 MW Siemens turbines and is presently under construction, with commercial operations scheduled for the second quarter of 2014. The project will connect to the Sistema Interconectado Central’s, or “SIC,” 220kV transmission system. El Arrayán will be Chile’s largest commercial wind power project and is reflective of the Chilean government’s efforts to diversify its energy sources away from fossil fuels by fostering local renewable energy projects.
The project will sell its electricity generation into the Chilean spot market at the prevailing market price at the time of sale. Approximately 75% of the project’s expected output has been hedged under a 20-year fixed-for-floating swap escalating at 1.5% annually with Minera Los Pelambres, or “MLP,” one of the world’s largest copper mines. The hedge includes the transfer of environmental attributes to MLP. The project has also entered into a 20-year PPA with MLP to acquire from the market and supply MLP with up to 40 MW of capacity and related energy. This PPA is a purely cost pass-through arrangement intended to firm the power supplied to MLP, under which MLP will reimburse the project for amounts incurred.
Project construction is being performed by Skanska Chile SA, a subsidiary of Skanska AB and one of the leading wind-focused construction firms in Chile, having recently built two projects over 35 MW. As of May 2014, construction efforts remain on schedule and on budget.
We are a minority owner of El Arrayán. The project is owned 30% by Antofagasta Minerals SA, or “AMSA,” and 70% by a joint venture between us and AEI El Arrayán Chile SpA. We own 45% of the joint venture such that our net ownership in the project is 31.5%. AEI El Arrayán Chile SpA holds the other 55% of the joint venture. The other equity owners of El Arrayán have customary rights to purchase our interest in the project upon any subsequent sale of the project by us.
The project is located on approximately 15,320 acres of coastal land and is leased from a single landowner. The land is not presently used for any residential or other commercial purposes. The project entered into the lease agreement with Sociedad Inmobiliaria Correa y Compańía Limitada on January 4, 2012, with a 30-year term covering the project site and comprising all of the turbine sites, collection lines, roads, a project substation and an operations and maintenance building for the project. The project has entered into easement agreements with three private landowners and a usufruct agreement with another landowner, together for the approximately 22 kilometer transmission line corridor from the project substation to the point of interconnection with Transelec S.A.
Mining rights are entirely separate from surface rights in Chile and must be controlled in order to prevent interference by a third party. The project has mining rights for all of its planned infrastructure including the turbines and operational facilities, the interconnecting transmission line and all main roads which are not public.
Grand
Grand is a 148.6 MW project located in Haldimand County in southern Ontario. The project will consist of 67 2.3 MW Siemens turbines that have been de-rated to a range from 2.126 MW to 2.221 MW in order to facilitate permitting compliance. The project will connect to the Hydro One Networks, Inc., or “HONI,” transmission system via a shared transmission line that is co-owned with an adjacent solar facility. The project has executed a co-ownership agreement that ensures unimpeded access across the shared transmission line to the HONI system. The Grand project commenced construction in the third quarter of 2013 and is expected to commence commercial operations in the fourth quarter of 2014. Project construction is being performed by an affiliate of Samsung C&T Corporation, an experienced global infrastructure construction provider.
96
Table of Contents
The project will sell 100% of its electricity generation, including environmental attributes, to the OPA under a 20-year PPA. The PPA has a stated price, which indexes at Canadian CPI from September 2009 until the December 31 of the year prior to commencement of commercial operations; thereafter 20% of the PPA price escalates at Canadian CPI. The PPA was granted in connection with the Green Energy Investment Agreement, an agreement among Samsung, Korea Electric Power Corporation and the Province of Ontario. This agreement supports growth in domestic renewable energy through both jobs creation and support of wind power and solar power projects.
The project is a 45/45/10 joint venture between us, Samsung and the Six Nations. Samsung has customary rights to purchase our interest in Grand upon any subsequent sale of the project by us.
All real estate rights needed for the construction and operation of the project have been secured. The project is being constructed on a combination of leased privately owned farm properties (as to 58 turbines) and leased lands owned and managed by Ontario Infrastructure and Lands Corporation (“OILC”) (as to 9 turbines). All parcels containing project infrastructure are governed by the terms of standardized leases and easements with terms of a minimum of 25 years (including all renewal periods). The project’s transmission line is to be constructed primarily on a major public road allowance pursuant to a Road Use Agreement (with a registered easement with the municipality).
The transmission facilities also include a collector substation located on OILC lands, underground transition stations located on two private properties and an interconnection station located on lands controlled by a local aggregate producer. Collector lines and ancillary project infrastructure will be located within public road allowance throughout Haldimand County pursuant to a Road Use Agreement with the municipality.
Panhandle 1
Panhandle 1 is a 218.3 MW project located in the Texas Panhandle in Carson County, Texas. The project will consist of 118 1.85 MW General Electric 1.85-87 turbines and is expected to commence commercial operations in June 2014. We agreed in May 2014 to acquire Panhandle 1 from Pattern Development, subject to satisfaction of customary closing conditions, following its commencement of commercial operations. See “Management’s Discussion & Analysis of Financial Condition and Results of Operations—Factors That Significantly Affect our Business—Recent Transactions—Project Acquisitions.” We expect to hold an approximately 82% ownership interest and receive the majority of cash flow throughout the project’s life.
The project is located in the West Zone of the ERCOT market and will sell 100% of its power output into the ERCOT market, receiving the locational marginal price, or “LMP.” Approximately 77% of the project’s expected annual electricity generation has been hedged under a physical power hedge with an affiliate of Citibank with a term of 13 years. This hedging agreement settles using the North Trading Hub hourly LMP weighted by the settlement volume in each hour. The hourly notional settlement volume varies to match the project’s hourly average production profile. Panhandle 1’s obligations under the hedge will be secured by a first priority lien on substantially all of the assets of Panhandle 1 and a first priority lien on the membership interests in the project entity.
The project will be connected to the ERCOT grid via a new 345kV transmission line owned by Cross Texas Transmission, LLC, which is part of the Texas Competitive Renewable Energy Zone (“CREZ”) program. The project is located on approximately 18,200 acres of private land pursuant to 40-year easement agreements with approximately 52 private landowners, all of which agreements are in substantially the same form. The project’s operations and maintenance building will be shared with our neighboring Panhandle 2 project.
Panhandle 2
Panhandle 2 is a 181.7 MW project located in the Texas Panhandle in Carson County, Texas. The project will consist of 79 2.3 MW Siemens SWT 2.3-108 turbines and is expected to commence commercial operations
97
Table of Contents
in the fourth quarter of 2014. We, together with three institutional tax equity investors, agreed in December 2013 to acquire Panhandle 2 from Pattern Development, subject to satisfaction of customary closing conditions, following its commencement of commercial operations. We expect to hold an approximately 81% ownership interest and receive the majority of cash flow throughout the project’s life.
The project is located in the West Zone of the ERCOT market and will sell 100% of its power output into the ERCOT market, receiving the locational marginal price, or “LMP.” Approximately 80% of the project’s expected annual electricity generation has been hedged under a physical power hedge with an affiliate of Morgan Stanley with a term of 12.25 years. This hedging agreement settles using the North Trading Hub hourly LMP weighted by the settlement volume in each hour. The hourly notional settlement volume varies to match the project’s hourly average production profile. Panhandle 2’s obligations under the hedge will be secured by a first priority lien on substantially all of the assets of Panhandle 2 and a first priority lien on the membership interests in the project entity.
Like Panhandle 1, the project will be connected to the ERCOT grid via a new 345kV transmission line owned by Cross Texas Transmission, LLC, which is part of the CREZ program. The project is located on approximately 11,840 acres of private land pursuant to 40-year easement agreements with approximately 20 private landowners, all of which agreements are in substantially the same form. The project’s operations and maintenance building will be shared with our neighboring Panhandle 1 project.
Competition
We compete with other wind power, infrastructure funds and renewable energy companies, as well as conventional power companies, to acquire profitable construction-ready and operating projects. In addition, competitive conditions may be substantially affected by various forms of energy legislation and regulation considered from time to time by federal, state, provincial and local legislatures and administrative agencies. Such laws and regulations may substantially increase the costs of acquiring, constructing and operating projects, and some of our competitors may be better able to adapt to and operate under such laws and regulations.
Suppliers
Operating equipment for wind power projects primarily consists of turbines. Turbine costs represent the majority of our wind power project investment costs. There are a limited number of turbine suppliers and, although demand for turbines in the past has generally been high relative to manufacturing capacity, we believe that current turbine manufacturing capacity is adequate. Our turbine supply strategy is largely based on maintaining strong relationships with leading turbine suppliers to secure our supply needs.
| Project |
Supplier | Number of Turbines | Turbine Type | |||||
| Operating Projects |
||||||||
| Gulf Wind |
Mitsubishi | 118 | MWT95/2.4 | |||||
| Hatchet Ridge |
Siemens | 44 | SWT-2.3-93 | |||||
| St. Joseph |
Siemens | 60 | SWT-2.3-101 | |||||
| Spring Valley |
Siemens | 66 | SWT-2.3-101 | |||||
| Santa Isabel |
Siemens | 44 | SWT-2.3-108 | |||||
| Ocotillo |
Siemens | 112 | SWT-2.3-108 | |||||
| South Kent |
Siemens | 124 | SWT-2.3-101 | |||||
| Construction Projects |
||||||||
| El Arrayan |
Siemens | 50 | SWT-2.3-101 | |||||
| Grand |
Siemens | 67 | SWT-2.3-101 | |||||
| Panhandle 1(1) |
General Electric | 118 | GWT 1.85-87 | |||||
| Panhandle 2(1) |
Siemens | 79 | SWT-2.3-108 | |||||
| (1) | Acquisitions of the Panhandle 1 and Panhandle 2 projects pending, scheduled to close at different times prior to the end of 2014. |
98
Table of Contents
To date, our projects have purchased or agreed to purchase 646 turbines from Siemens. Siemens has been active in the wind power industry since 1980. It has a reputation for conservative engineering, robust design and high reliability. The SWT-2.3MW turbine technology has a significant and well established track record. First installed in February 2005, Siemens has installed 6,430 SWT-2.3MW turbines worldwide, with 3,424 in the United States, as of December 2013. Siemens data indicates that fleet availability for the 2.3MW turbine exceeds 97%. Apart from Siemens we have relationships with other reputable turbine manufacturers such as General Electric, Mitsubishi and others, and some of our future projects may utilize turbines from these and other manufacturers.
In May 2013, a blade separated from the turbine hub on one of the Siemens SWT-2.3-108 wind turbines at our Ocotillo project. Our Santa Isabel project also employs Siemens SWT-2.3-108 turbines. All of our turbines using this blade have been successfully retrofitted, or replaced, and the retrofits have a 20-year life certification. For information regarding the consequences of the blade separation event, see “Management’s Discussion and Analysis of Financial Condition and Results of Operations—Factors that Significantly Affect Our Business—Electricity Sales and Energy Derivative Settlements of Our Operating Projects.”
Other important suppliers include the engineering and construction companies, such as M. A. Mortenson Company, RES-Americas and Blattner Energy, Inc., with whom we contract to perform civil engineering, electrical work and other infrastructure construction for our projects. We believe there are a sufficient number of capable engineering and construction companies available in our markets to meet our needs.
Customers
We sell our electricity and environmental attributes, including RECs, primarily to local utilities under long-term, fixed-price PPAs or, in limited instances, local liquid ISO markets. For the year ended December 31, 2013, Manitoba Hydro, San Diego Gas & Electric, Pacific Gas and Electric Company (“PG&E”) and Electric Reliability Council of Texas (“ERCOT”) accounted for 18%, 17%, 15% and 12%, respectively, of our total revenue.
To the extent that PPAs are not available in a given market, but market prices allow for acceptable project economics, we will enter into hedging agreements to obtain a fixed price for the energy output of our projects. We enter into these hedging agreements to reduce our exposure to potential volatility in spot-market electricity prices. We seek to hedge volumes that are expected to be exceeded 99.0% of the time. Those hedging agreements are executed for a monthly or hourly production profile that matches the forecasted production profile of the project. We will also consider hedging agreements beyond the initial volume up to an amount that is expected to be exceeded over half the time. Those hedging agreements are executed for a shorter term in order to reduce volatility of our cash flows.
We also enter into interest rate hedging agreements to convert floating-rate debt to fixed-rate debt for some of our projects. Additionally, our El Arrayán project enters into currency exchange rate hedging agreements to manage construction costs that may be payable or receivable in a foreign currency and do not have a same currency offset.
We expect to initiate a program of exchange rate management due to the substantial portion of our electricity sales that are Canadian dollar denominated. For additional information regarding our hedging activities, please read “Quantitative and Qualitative Disclosure about Market Risk.”
Legal Proceedings
Ocotillo
On April 25, 2012, the County of Imperial certified a Final Environmental Impact Report and Environmental Impact Statement, and entered into a project implementation agreement, or “County Agreement,” regarding the Ocotillo project. On May 11, 2012, the Bureau of Land Management issued a Record of Decision,
99
Table of Contents
or “ROD,” and granted a right-of-way relating to the Ocotillo project. The ROD, right-of-way and County Agreement, which we collectively refer to as the “Approvals,” allow Ocotillo to construct the project. Following issuance of the Approvals, a total of six lawsuits were filed in court by various local opposition groups alleging that the Approvals were not appropriately issued. While initially one of the six lawsuits was filed in state court, the state lawsuit was removed to the U.S. District Court for the Southern District of California and was later remanded back to the state court. In three lawsuits, the plaintiffs sought preliminary equitable relief to enjoin the construction of the project while the court decided the claims, and in each instance, the court rejected such request and allowed project construction to continue. The project has since been completed and has achieved commercial operations. In addition, the courts have subsequently dismissed all of the lawsuits. At present, three of the dismissals were appealed to the U.S. Court of Appeals for the Ninth Circuit. The time to appeal each of the remaining dismissed cases has lapsed. The state lawsuit that was removed to the federal district court was remanded to state court following a motion by the plaintiff, was dismissed on March 12, 2014, and plaintiffs have 60 days to appeal.
We do not believe these proceedings will have a material adverse effect on our business, financial position or liquidity based on the information currently available to us, principally because attempts to enjoin the construction of the project have failed, and, subject to the pending appeals, the actively adjudicated lawsuits have all been dismissed. We initially commenced commercial operations on 223 MW of Ocotillo’s electricity generating capacity during the fourth quarter of 2012 and commenced commercial operations on the remaining 42 MW of electricity generating capacity from Ocotillo’s additional 18 turbines in July 2013. We believe, but can give no assurance, that the remaining litigation will ultimately be resolved favorably to the project.
Other Proceedings
We are also subject, from time to time, to various other routine legal proceedings and claims arising out of the normal course of business. These proceedings primarily involve claims from landowners related to calculation of land royalties and warranty claims we initiate against equipment suppliers. The outcome of these legal proceedings and claims cannot be predicted with certainty. Nevertheless, we believe the outcome of any of such currently existing proceedings, even if determined adversely, would not have a material adverse effect on our financial condition or results of operations.
Employees
As of March 31, 2014, we had 51 full-time employees of whom 13 are based in our corporate headquarters, 18 are based at our project sites and 20 are based at our other offices, including our OCC, in Houston, Texas. None of our employees are represented by a labor union or covered by any collective bargaining agreement. We believe that our relationship with our employees is good.
Insurance
We maintain insurance on terms generally carried by companies engaged in similar business and owning similar properties in the United States, Canada and Chile and whose projects are financed in a manner similar to our projects. As is common in the wind industry, however, we do not insure fully against all the risks associated with our business either because insurance is not available or because the premiums for some coverage are prohibitive. For example, we do not maintain terrorism insurance. We maintain varying levels of insurance for the development, construction and operation phases of our projects, including property insurance, which, depending on the location of each project, may include catastrophic windstorm, flood and earthquake coverage (CAT coverage); transportation insurance; advance loss of profits insurance; business interruption insurance; general liability and umbrella liability insurance; time element pollution liability insurance; auto liability insurance; worker’s compensation and employers’ liability insurance; and (except in Chile) title insurance. The “all risk” property insurance coverage is currently maintained in amounts based on the full replacement value of our projects (subject to certain sub-limits for windstorm, flood and earthquake risks) and the business interruption insurance generally provides 15 months of coverage in amounts that vary from project to project
100
Table of Contents
based on the revenue generation potential of each project. All types of coverage are subject to applicable deductibles. We generally do not maintain insurance for certain environmental risks, such as environmental contamination.
Regulatory Matters
Environmental Regulation
We are subject to various environmental, health and safety laws and regulations in each of the jurisdictions in which we operate. These laws and regulations require us to obtain and maintain permits and approvals, undergo environmental review processes and implement environmental, health and safety programs and procedures to monitor and control risks associated with the siting, construction, operation and decommissioning of wind power projects, all of which involve a significant investment of time and can be expensive.
We incur costs in the ordinary course of business to comply with these laws, regulations and permit requirements. We do not anticipate material capital expenditures for environmental controls for our operating projects in the next several years. However, these laws and regulations frequently change and often become more stringent, or subject to more stringent interpretation or enforcement. Future changes could require us to incur materially higher costs.
Failure to comply with these laws, regulations and permit requirements may result in administrative, civil and criminal penalties, imposition of investigatory, cleanup and site restoration costs and liens, denial or revocation of permits or other authorizations and issuance of injunctions to limit or cease operations. In addition, claims for damages to persons or property or for injunctive relief have been brought and may in the future result from environmental and other impacts of our activities.
Environmental Permitting—United States
We are required to obtain from U. S. federal, state and local governmental authorities a range of environmental permits and other approvals to build and operate our projects, including, but not limited to, those described below. In addition to being subject to these regulatory requirements, we could experience and have experienced significant opposition from third parties when we initially apply for permits or when there is an appeal proceeding after permits are issued. The delay or denial of a permit or the imposition of conditions that are costly or difficult to comply with can impair or even prevent the development of a project or can increase the cost so substantially that the project is no longer attractive to us.
Federal Clean Water Act
Frequently, our U.S. projects are located near wetlands, and we are required to obtain permits under the U.S. Clean Water Act from the U.S. Army Corps of Engineers, or the “Army Corps,” for the discharge of dredged or fill material into waters of the United States, including wetlands and streams. The Army Corps may also require us to mitigate any loss of wetland functions and values that accompanies our activities. In addition, we are required to obtain permits under the Clean Water Act for water discharges, such as storm water runoff associated with construction activities, and to follow a variety of best management practices to ensure that water quality is protected and impacts are minimized. Certain activities, such as installing a power line across a navigable river, may also require permits under the Rivers and Harbors Appropriation Act of 1899.
Federal Bureau of Land Management Permits
As some of our U.S. projects are located on lands administered by the Bureau of Land Management, we are required to obtain rights-of-way from the Bureau of Land Management. The Bureau of Land Management encourages the development of wind power within acceptable areas, consistent with Environmental Policy Act of
101
Table of Contents
2005 and the Bureau of Land Management’s energy and mineral policy. Obtaining a grant requires that the proposed project prepare a plan of development and demonstrate that it will adhere to the Bureau of Land Management’s best management practices for wind power development, including meeting criteria for protecting biological, archeological and cultural resources.
National Environmental Policy Act and Endangered Species Requirements
Our U.S. projects may also be subject to environmental review under the U.S. National Environmental Policy Act, or “NEPA,” which requires federal agencies to evaluate the environmental impact of all “major federal actions” significantly affecting the quality of the human environment. The granting of a land lease, a federal permit or similar authorization for a major development project, or the interconnection of a significant private project into a federal project generally is considered a “major federal action” that requires review under NEPA. As part of the NEPA review, the federal agency considers a broad array of environmental impacts, including impacts on air quality, water quality, wildlife, historical and archeological resources, geology, socioeconomics and aesthetics and alternatives to the project. The NEPA review process, especially if it involves preparing a full Environmental Impact Statement, can be time-consuming and expensive. A federal agency may decide to deny a permit based on its environmental review under NEPA, though in most cases a project would be redesigned to reduce impacts or agree to provide some form of mitigation to offset impacts before a denial is issued.
Federal agencies granting permits for our U.S. projects also consider the impact on endangered and threatened species and their habitat under the U.S. Endangered Species Act, which prohibits and imposes stringent penalties for harming endangered or threatened species and their habitats. Our projects also need to consider the Migratory Bird Treaty Act and the Bald and Golden Eagle Protection Act, which protect migratory birds and bald and golden eagles and are administered by the U.S. Fish and Wildlife Service. Most states also have similar laws. Because the operation of wind turbines may result in injury or fatalities to birds and bats, federal and state agencies often recommend or require that we conduct avian and bat risk assessments prior to issuing permits for our projects. They may also require ongoing monitoring or mitigation activities as a condition to approving a project. In addition, U.S. federal agencies consider a project’s impact on historical or archeological resources under the U.S. National Historic Preservation Act and may require us to conduct archeological surveys or take other measures to protect these resources. Among other things, the National Historic Preservation Act requires federal agencies to evaluate the impact of all federally funded or permitted projects on historic properties (buildings, archaeological sites, etc.) through a process known as “ Section 106 Review.”
Other State and Local Programs
In addition to federal requirements, our U.S. projects, and any future U.S. projects we may acquire, are subject to a variety of state environmental review and permitting requirements. Many states where our projects are located, or may in the future be located, have laws that require state agencies to evaluate a broad array of environmental impacts before granting state permits. The state environmental review process often resembles the federal NEPA process and may be more stringent than the federal review. Our projects also often require state law based permits in addition to federal permits. State agencies evaluate similar issues as federal agencies, including the project’s impact on wildlife, historic sites, aesthetics, wetlands and water resources, agricultural operations and scenic areas. States may impose different or additional monitoring or mitigation requirements than federal agencies. Additional approvals may be required for specific aspects of a project, such as stream or wetland crossings, impacts to designated significant wildlife habitats, storm water management and highway department authorizations for oversize loads and state road closings during construction. Permitting requirements related to transmission lines may be required in certain cases.
Our projects also are subject to local environmental and regulatory requirements, including county and municipal land use, zoning, building and transportation requirements. Permitting at the local municipal or county
102
Table of Contents
level often consists of obtaining a special use or conditional use permit under a land use ordinance or code, or, in some cases, rezoning in connection with the project. Obtaining a permit usually depends on our demonstrating that the project will conform to development standards specified under the ordinance so that the project is compatible with existing land uses and protects natural and human environments. Local or state regulatory agencies may require modeling and measurement of permissible sound levels in connection with the permitting and approval of our projects. Local or state agencies also may require us to develop decommissioning plans for dismantling the project at the end of its functional life and establish financial assurances for carrying out the decommissioning plan.
Environmental Permitting—Canada
We are required to obtain from Canadian federal, provincial and local governmental authorities a range of environmental permits and other approvals to build and operate our Canadian projects, including, but not limited to, those described below. In addition to being subject to these regulatory requirements, we could experience and have experienced significant opposition from third parties, including, but not limited to, environmental non-governmental organizations, neighborhood groups, municipalities and First Nations when the permits were initially applied for or when there is an appeal proceeding after permits are issued. The delay or denial of a permit or the imposition of conditions that are costly or difficult to comply with can impair or even prevent the development of a project or can increase the cost so substantially that the project is no longer attractive to us.
Ontario Renewable Energy Approvals
Our projects in Ontario are subject to Ontario’s Environmental Protection Act, which requires proponents of significant wind projects to obtain a Renewable Energy Approval (“REA”). The REA application requires a variety of studies on environmental, archeological and heritage issues. Significant public consultation, as well as consultation with Aboriginal communities, is also required. Before issuing a REA, the Ontario Ministry of the Environment evaluates a broad range of potential impacts, including on wildlife, wetlands and water resources, communities, scenic areas, species and heritage resources, as well as impacts on people and communities. This review can be time consuming and expensive, and an approval can be rejected or approved with conditions that are costly or difficult to comply with. Renewable energy approvals are also subject to appeal by third parties and can result and have resulted in lengthy appeal tribunal hearings.
Manitoba Environment Act
The Manitoba Environment Act requires proponents of significant projects to submit a proposal with the Manitoba Conservation Environmental Assessment & Licensing Branch, and to comply with Manitoba’s environmental assessment process under the Environment Act. This process will consider a similar range of impacts on the environment, the heritage and scenic values of an area and on people, communities and wildlife as the Ontario process, and brings with it similar risks.
Endangered Species Legislation
Our Canadian projects may be subject to endangered species legislation, either federally or provincially, which prohibits and imposes stringent penalties for harming endangered or threatened species and their habitats. Our projects may also be subject to the Migratory Birds Convention Act, which protects the habitat of migratory species, and which may also trigger federal “Species at Risk” requirements. Because the operation of wind turbines may result in injury or fatalities to birds and bats, avian and bat risk assessments are generally required both prior to permits being issued for projects and after commercial operations. In Ontario, if any of the affected species are listed as endangered or threatened, permits under the Endangered Species Act may also be required.
Other Approvals
Our Canadian projects, and any future projects we may acquire, are subject to a variety of other federal, provincial and municipal permitting and zoning requirements. Most provinces where our projects are located or
103
Table of Contents
may be located have laws that require provincial agencies to evaluate a broad array of environmental impacts before granting permits and approvals. These agencies evaluate similar issues as the permitting regimes above, including impact on wildlife, historic sites, esthetics, wetlands and water resources, scenic areas, endangered and threatened species and communities. In addition, federal government approvals dealing with, among other things, aeronautics, fisheries, navigation or species protection may be required and could in some cases trigger additional environmental assessment requirements. Additional requirements related to the permitting of transmission lands may be applicable in some cases. Our projects are also subject to certain municipal requirements, including land use and zoning requirements except where superseded by Ontario’s Green Energy and Green Economy Act, 2009, as well as requirements for building permits and other municipal approvals that can be difficult or costly to comply with and impair or prevent the development of a project.
Management, Disposal and Remediation of Hazardous Substances
We own and lease real property and may be subject to requirements regarding the storage, use and disposal of petroleum products and hazardous substances, including spill prevention, control and counter-measure requirements. If our owned or leased properties are contaminated, whether during or prior to our ownership or operation, we could be responsible for the costs of investigation and cleanup and for any related liabilities, including claims for damage to property, persons or natural resources. That responsibility may arise even if we were not at fault and did not cause or were not aware of the contamination. In addition, waste we generate is at times sent to third-party disposal facilities. If those facilities become contaminated, we and any other persons who arranged for the disposal or treatment of hazardous substances at those sites may be jointly and severally responsible for the costs of investigation and remediation, as well as for any claims for damage to third parties, their property or natural resources.
Intellectual Property
We do not own any intellectual property material to the conduct of our business. However, we own various information that includes, without limitation, financial, business, scientific, technical, economic, and engineering information, formulas, designs, methods, techniques, processes, and procedures, all of which is protected confidential and proprietary information.
104
Table of Contents
STRUCTURE AND FORMATION OF OUR COMPANY
On October 17, 2012, Pattern Energy issued 100 shares to Pattern Renewables LP, a subsidiary of Pattern Development, at a total issue price of US$1,000 in connection with our initial capitalization.
On October 2, 2013, Pattern Energy issued 16,000,000 shares of Class A common stock in an initial public offering generating net proceeds of approximately $317.0 million. Concurrent with the IPO, Pattern Energy issued 19,445,000 shares of Class A common stock and 15,555,000 shares of Class B common stock to Pattern Development and utilized approximately $232.6 million of the net proceeds of the IPO as a portion of the consideration to Pattern Development for certain entities and assets contributed to Pattern Energy (“Contribution Transactions”) consisting of interests in eight wind power projects, including six projects in operation (Gulf Wind, Hatchet Ridge, St. Joseph, Spring Valley, Santa Isabel and Ocotillo), and two projects under construction (El Arrayán and South Kent). In accordance with ASC 805-50-30-5, Transactions between Entities under Common Control, Pattern Energy recognized the assets and liabilities contributed by Pattern Development at their historical carrying amounts at the date of the Contribution Transactions. On October 8, 2013, Pattern Energy’s underwriters exercised in full their overallotment option to purchase 2,400,000 shares of Class A common stock from Pattern Development, the selling shareholder, pursuant to the overallotment option granted by Pattern Development.
105
Table of Contents
The following diagram summarizes our ownership structure upon completion of this offering (assuming that the underwriters’ option to purchase up to an additional 2,321,981 shares is exercised).
| (1) | These funds and these employees hold indirect interests in Pattern Development. |
106
Table of Contents
| (2) | Pattern Development holds an interest of approximately 27% in Gulf Wind, representing Pattern Development-owned capacity of 76 MW. |
| (3) | We have agreed to acquire the Panhandle 1 and Panhandle 2 projects from Pattern Development and expect to complete the acquisitions at different times prior to the end of 2014, subject to the satisfaction of customary closing conditions. |
107
Table of Contents
PRINCIPAL AND SELLING SHAREHOLDERS
The following table sets forth information with respect to the beneficial ownership of, and the combined voting power with respect to, our Class A shares and Class B shares immediately following the completion of this offering:
| • | each person we know to own beneficially more than 5% of our shares, including the selling shareholder; |
| • | each of our directors and named executive officers; and |
| • | all of our directors and executive officers as a group, |
and, with respect to each of the foregoing, excluding and including, the impact of the exercise of the underwriters’ overallotment option to purchase an up to an additional 2,321,981 of our Class A shares from the selling shareholder within 30 days from the closing date of this offering.
The amounts and percentages of shares beneficially owned are reported on the basis of SEC regulations governing the determination of beneficial ownership of securities. Under SEC rules, a person is deemed to be a “beneficial” owner of a security if that person has or shares voting power or investment power, which includes the power to dispose of or to direct the disposition of such security. A person is also deemed to be a beneficial owner of any securities of which that person has a right to acquire beneficial ownership within 60 days. Securities that can be so acquired are not deemed to be outstanding for purposes of computing any other person’s percentage. Under these rules, more than one person may be deemed to be a beneficial owner of securities as to which such person has no economic interest. The number of Class A shares outstanding after this offering includes 11,609,907 Class A shares being offered for sale by us in this offering. The percentage of beneficial ownership for the following table is based on 35,702,815 Class A shares and 15,555,000 Class B shares outstanding as of May 5, 2014, and 47,312,722 Class A shares and 15,555,000 Class B shares outstanding after the completion of this offering assuming no exercise of the underwriters’ option to purchase additional shares.
Except as otherwise indicated in these footnotes, each of the beneficial owners listed will have, to our knowledge, sole voting and investment power with respect to the shares of capital stock and the business address of each such beneficial owner is c/o Pattern Energy Group Inc., Pier 1, Bay 3, San Francisco, California 94111.
| Shares Beneficially Owned Before the Offering† |
Shares Beneficially Owned After the Offering |
|||||||||||||||||||||||||||
| Name of Beneficial Owner | Number of Class A Shares† |
Number of Class B Shares† |
Percentage of Combined Voting Power |
Number of Class A Shares Being Offered |
Number of Class A Shares† |
Number of Class B Shares† |
Percentage of Combined Voting Power |
|||||||||||||||||||||
| Principal and Selling Shareholders: |
||||||||||||||||||||||||||||
| Pattern Renewables LP(1) |
16,861,099 | 15,407,808 | 62.95 | % | 12,991,130 | 15,407,808 | 45.17 | % | ||||||||||||||||||||
| Wellington Management Company, LLP(2) |
2,683,507 | — | 5.24 | % | 2,683,507 | — | 4.27 | % | ||||||||||||||||||||
| Named Executive Officers and Directors: |
||||||||||||||||||||||||||||
| Alan R. Batkin(3) |
17,609 | — | * | — | 17,609 | — | * | |||||||||||||||||||||
| Patricia S. Bellinger(4) |
6,347 | — | * | — | 6,347 | — | * | |||||||||||||||||||||
| The Lord Browne of Madingley |
— | — | * | — | — | — | * | |||||||||||||||||||||
| Douglas G. Hall |
3,435 | — | * | — | 3,435 | — | * | |||||||||||||||||||||
| Michael B. Hoffman |
— | — | * | — | — | — | * | |||||||||||||||||||||
| Patricia M. Newson |
9,878 | — | * | — | 9,878 | — | * | |||||||||||||||||||||
| Michael M. Garland(5) |
181,308 | 44,443 | * | — | 181,308 | 44,443 | * | |||||||||||||||||||||
| Hunter Armistead(6) |
80,069 | 20,201 | * | 80,069 | 20,201 | * | ||||||||||||||||||||||
| Esben W. Pedersen(7) |
72,678 | 38,426 | * | 72,678 | 38,426 | * | ||||||||||||||||||||||
| All executive officers and directors as a group (15 persons)(8) |
568,538 | 147,192 | 1.39 | % | 568,538 | 147,192 | 1.14 | % | ||||||||||||||||||||
108
Table of Contents
| † | The rights of the holders of our Class A and Class B shares are identical other than in respect of economic rights. Each Class B share has one vote on all matters submitted to a vote of our shareholders, but has no rights to dividends or distributions (other than upon liquidation). Upon the Conversion Event, on December 31, 2014, all of our outstanding Class B shares will convert into Class A shares. See “Description of Capital Stock.” |
| * | Less than 1%. |
| (1) | Based on the number of shares disclosed in the Schedule 13G filed on February 14, 2014 and Forms 4 filed during fiscal year 2013 by Pattern Renewables LP and includes up to 18,700,000 Class A shares (upon completion of this offering) whose ownership may be transferred to Pattern Development Finance Company LLC in connection with a loan agreement to be entered into by Pattern Development shortly before or after commencement of this offering. R/C Renewable Energy GP II, LLC is the managing member of Riverstone/Carlyle Renewable Energy Grant GP, L.L.C., which is the general partner of R/C Wind II LP, which is the managing member of Pattern Energy Group Holdings GP LLC, which is the general partner of Pattern Energy Group Holdings LP, which is the managing member of Pattern Energy GP, LLC, which is the general partner of Pattern Energy Group LP, which is the sole member of Pattern Renewables GP LLC, which is the general partner of Pattern Renewables LP. Accordingly, each of the foregoing entities may be deemed to share beneficial ownership of the shares held by Pattern Renewables LP. R/C Renewable Energy GP II, LLC is managed by an eight-person investment committee. Pierre F. Lapeyre, Jr., David M. Leuschen, Ralph C. Alexander, The Lord Browne of Madingley, Michael B. Hoffman, Stephen J. Schaefer, Daniel A. D’Aniello and Edward J. Mathias, as the members of the investment committee of R/C Renewable Energy GP II, LLC, may be deemed to share beneficial ownership of the shares beneficially owned by R/C Wind II LP. Such individuals expressly disclaim any such beneficial ownership. |
| (2) | Wellington Management Company, LLP, in its capacity as investment adviser, may be deemed to beneficially own the number of shares of common stock set forth in the table above, which are held of record by clients of Wellington Management Company, LLP., based on the number of shares disclosed in the Schedule 13G filed on February 14, 2014. Based on the information disclosed in the Schedule 13G filed on February 14, 2014, the business address of Wellington Management Company, LLP is 280 Congress Street Boston, MA 02210. |
| (3) | Includes 10,000 shares held by a trust of which Mr. Batkin is the trustee and beneficiary. |
| (4) | Includes 2,500 shares held by Mr. Bellinger’s spouse. |
| (5) | Includes 29,166 shares of our Company’s common stock that Mr. Garland has the right to acquire by exercise of stock options and 9,722 shares issuable upon exercise of options exercisable without 60 days of completion of this offering. |
| (6) | Includes 10,128 shares of our company’s common stock that Mr. Armistead has the right to acquire by exercise of stock options and 3,376 shares issuable upon exercise of options exercisable within 60 days of completion of this offering. |
| (7) | Includes 6,072 shares of our company’s common stock that Mr. Pedersen has the right to acquire by exercise of stock options and 2,024 shares issuable upon exercise of options exercisable within 60 days of completion of this offering. |
| (8) | Includes 74,118 shares of our company’s common stock that our directors have the right to acquire by exercise of stock options and 24,706 shares issuable upon exercise of options exercisable within 60 days of completion of this offering. |
109
Table of Contents
The following is a description of our capital stock and the material provisions of our amended and restated certificate of incorporation and amended and restated bylaws upon the closing of this offering. The following is only a summary and is qualified in its entirety to the provisions of our amended and restated certificate of incorporation and amended and restated bylaws, copies of which are available as set forth under the caption entitled “Where You Can Find More Information.”
General
Our authorized capital stock consists of 500,000,000 Class A shares, par value $0.01 per share, 20,000,000 Class B shares, par value $0.01 per share and 100,000,000 shares of preferred stock, par value $0.01 per share. Following the completion of this offering, 47,312,722 and 15,555,000 shares of Class A common stock and Class B common stock, respectively, will be issued and outstanding. The underwriters have been granted an option to purchase up to 2,321,981 of our Class A shares from Pattern Development within 30 days from the closing date of this offering at the public offering price per Class A share less underwriters’ commissions. However, because the Class A shares subject to the underwriters’ overallotment option will be sold by Pattern Development from shares it currently holds, any exercise by the underwriters of their overallotment option will not increase our issued and outstanding Class A shares. The rights and privileges of holders of our Class A shares and Class B shares are subject to any series of preferred stock that we may issue in the future.
Class A Shares
Holders of Class A shares are entitled to one vote for each share held of record on all matters submitted to a vote of the shareholders, including the election of directors. There are no cumulative voting in the election of directors, which means that holders of a majority of the outstanding Class A and Class B shares are able to elect all of the directors, and holders of less than a majority of such shares will be unable to elect any director. Under our amended and restated certificate of incorporation, subject to preferences that may be applicable to any outstanding shares of preferred stock, holders of Class A shares are entitled to receive ratably such dividends, if any, as may be declared from time to time by our board of directors out of funds legally available for dividend payments. Our revolving credit facility imposes restrictions on certain of our project subsidiaries’ ability to distribute funds to us. See “Management’s Discussion & Analysis of Financial Condition and Results of Operations—Description of Credit Agreements—Revolving Credit Facility” in our 2013 Form 10-K. The holders of Class A shares have no preferences or rights of conversion, exchange, pre-emption or other subscription rights. There are no redemption or sinking fund provisions applicable to the Class A shares. No subdivision or consolidation of our Class A shares can be made unless the same subdivision or consolidation of the Class B shares is made concurrently. In the event of any liquidation, dissolution or winding-up of our affairs, holders of Class A shares will be entitled to share ratably, together with holders of Class B shares, in our assets that are remaining after payment or provision for payment of all of our debts and obligations and after liquidation payments to holders of outstanding shares of preferred stock, if any.
Class B Shares
The rights of the holders of our Class A and Class B shares are identical other than in respect of dividends and the conversion rights of the Class B shares. While each Class A and Class B share have one vote on all matters submitted to a vote of our shareholders, our Class B shares have no rights to dividends or distributions (other than upon liquidation). In the case of a proposed amendment to our amended and restated certificate of incorporation affecting our Class A shares and/or our Class B shares, holders of our Class A shares and holders of our Class B shares are each entitled to vote separately as a class to approve such amendment. Upon the later of December 31, 2014 and the date on which our South Kent project has achieved commercial operations (which occurred on March 28, 2014), which we refer to as the “Conversion Event,” all of our outstanding Class B shares will automatically convert, on a one-for-one basis, into Class A shares. Other than upon occurrence of the
110
Table of Contents
Conversion Event, there are no conversion rights attaching to the Class B shares. Other than in certain circumstances involving a take-over bid, tender offer or merger or similar business combination in respect of our company, in which circumstance a transfer of our Class B shares to the acquiror, and subsequently among the acquirer and its officers, employees and affiliates, would be permitted, our Class B shares will not be transferrable except to and among Pattern Development, our company and its respective officers, employees and affiliates. No subdivision or consolidation of our Class B shares can be made unless the same subdivision or consolidation of the Class A shares is made concurrently.
Under applicable Canadian securities laws, a take-over bid to purchase our Class B shares would not necessarily require that the take-over bid also be made to purchase our Class A shares. In order to ensure that, in the event of a take-over bid, the holders of our Class A shares will be entitled to participate on an equal footing with holders of our Class B shares, our amended and restated certificate of incorporation contains restrictions which provide that the Class B shares are not transferrable, directly or indirectly, pursuant to a take-over bid (as defined in applicable Canadian securities legislation) under circumstances in which applicable securities legislation would have required the same offer to be made to holders of Class A shares if the sale by the holder of Class B shares had been a sale of Class A shares rather than Class B shares (but otherwise on the same terms); provided that, these restrictions will not apply to prevent a transfer by any holder of Class B shares pursuant to such a take-over bid if concurrently an offer is made to purchase Class A shares that:
(a) offers a price per Class A share at least as high as the highest price per share paid pursuant to the offer to acquire the Class B shares;
(b) provides that the percentage of outstanding Class A shares to be taken up (exclusive of shares owned immediately prior to the offer by the offerer or persons acting jointly or in concert with the offerer) is at least as high as the percentage of Class B shares to be sold (exclusive of Class B shares owned immediately prior to the offer by the offerer and persons acting jointly or in concert with the offerer) and the offerer does not acquire any Class B shares unless the offerer also acquires a proportionate number of Class A shares actually tendered to such offer;
(c) has no conditions attached other than the conditions attached to the offer for the Class B shares; and
(d) is in all other material respects identical to the offer for the Class B shares.
In addition and for greater certainty, the foregoing transfer restrictions will not prevent a sale by a holder of Class B shares if the offer and sale would have constituted an exempt take-over bid (as defined in applicable Canadian securities legislation) or would not constitute a take-over bid had it been an offer to acquire from such holder, Class A shares rather than Class B shares.
Preferred Stock
Our amended and restated certificate of incorporation authorizes the issuance of blank check preferred stock, which, if issued, would have priority over the shares of common stock with respect to dividends and other distributions, including the distribution of our assets upon liquidation. Unless required by law or by applicable stock exchanges, our board of directors has the authority without further shareholder authorization to issue from time to time shares of preferred stock in one or more series and to fix the terms, limitations, relative rights and preferences and variations of each series. Although we have no present plans to issue any shares of preferred stock, the issuance of shares of preferred stock, or the issuance of rights to purchase such shares, could decrease the amount of earnings and assets available for distribution to the holders of Class A shares, could adversely affect the rights and powers, including voting rights, of the holders of shares of our common stock, and could have the effect of delaying, deterring or preventing a change in control of us or an unsolicited acquisition proposal.
111
Table of Contents
Limitations on Directors’ Liability
Our amended and restated certificate of incorporation and amended and restated bylaws contain provisions indemnifying our directors and officers to the fullest extent permitted by law. We have entered into indemnification agreements with each of our directors and executive officers that may, in some cases, be broader than the specific indemnification provisions contained under Delaware law.
In addition, as permitted by Delaware law, our amended and restated certificate of incorporation will provide that no director will be liable to us or our shareholders for monetary damages for breach of fiduciary duty as a director. The effect of this provision is to restrict our rights and the rights of our shareholders in derivative suits to recover monetary damages against a director for breach of fiduciary duty as a director, except that a director will be personally liable for:
| • | any breach of his or her duty of loyalty to us or our shareholders; |
| • | acts or omissions not in good faith that involve intentional misconduct or a knowing violation of law; |
| • | the payment of dividends or the redemption or purchase of stock in violation of Delaware law; or |
| • | any transaction from which the director derived an improper personal benefit. |
This provision does not affect a director’s liability under the federal securities laws.
To the extent that our directors, officers and controlling persons are indemnified under the provisions contained in our amended and restated certificate of incorporation, Delaware law or contractual arrangements against liabilities arising under the U.S. Securities Act, we have been advised that in the opinion of the SEC such indemnification is against public policy as expressed in the U.S. Securities Act and is therefore unenforceable.
Provisions of Our Certificate of Incorporation and Delaware Law that May Have an Anti-Takeover Effect
Certificate of Incorporation and Bylaws
Our amended and restated certificate of incorporation and amended and restated bylaws contain certain provisions that could discourage, delay or prevent a change in control of our company or changes in our management that the shareholders of our company may deem advantageous. Among other things, these provisions include those that would:
| • | authorize the issuance of blank check preferred stock that our board of directors could issue to increase the number of outstanding shares and to discourage a takeover attempt; |
| • | prohibit our shareholders from calling a special meeting of shareholders if Pattern Development and its affiliates (other than our company) collectively cease to own more than 50% of our shares; |
| • | prohibit shareholder action by written consent, which requires all shareholder actions to be taken at a meeting of our shareholders if Pattern Development and its affiliates (other than our company) collectively cease to own more than 50% of our shares; |
| • | provide that the board of directors is expressly authorized to adopt, or to alter or repeal our bylaws; and |
| • | establish advance notice requirements for nominations for election to our board of directors or for proposing matters that can be acted upon by shareholders at shareholder meetings. |
The foregoing provisions of our amended and restated certificate of incorporation and bylaws could discourage potential acquisition proposals and could delay or prevent a change in control. These provisions are intended to enhance the likelihood of continuity and stability in the composition of the board of directors and in the policies formulated by the board of directors and to discourage certain types of transactions that may involve an actual or threatened change of control. These provisions are designed to reduce our vulnerability to an
112
Table of Contents
unsolicited acquisition proposal. The provisions also are intended to discourage certain tactics that may be used in proxy fights. However, such provisions could have the effect of discouraging others from making tender offers for our shares and, as a consequence, they also may inhibit fluctuations in the market price of our shares of common stock that could result from actual or rumoured takeover attempts. Such provisions also may have the effect of preventing changes in our management.
Delaware Takeover Statute
Subject to certain exceptions, Section 203 of the Delaware General Corporation Law, or “DGCL,” prohibits a Delaware corporation from engaging in any “business combination” (as defined below) with any “interested shareholder” (as defined below) for a period of three years following the date that such shareholder became an interested shareholder, unless: (1) prior to such date, the board of directors of the corporation approved either the business combination or the transaction that resulted in the shareholder becoming an interested shareholder; (2) on consummation of the transaction that resulted in the shareholder becoming an interested shareholder, the interested shareholder owned at least 85% of the voting stock of the corporation outstanding at the time the transaction commenced, excluding for purposes of determining the number of shares outstanding those shares owned (x) by persons who are directors and also officers and (y) by employee stock plans in which employee participants do not have the right to determine confidentially whether shares held subject to the plan will be tendered in a tender or exchange offer; or (3) on or subsequent to such date, the business combination is approved by the board of directors and authorized at an annual or special meeting of shareholders, and not by written consent, by the affirmative vote of at least 66 2/3% of the outstanding voting stock that is not owned by the interested shareholder.
In our amended and restated certificate of incorporation, we have elected not to be governed by Section 203 of the DGCL, as permitted under and pursuant to subsection (b)(3) of Section 203. Section 203 of the DGCL defines “business combination” to include: (1) any merger or consolidation involving the corporation and the interested shareholder; (2) any sale, transfer, pledge or other disposition of 10% or more of the assets of the corporation involving the interested shareholder; (3) subject to certain exceptions, any transaction that results in the issuance or transfer by the corporation of any stock of the corporation to the interested shareholder; (4) any transaction involving the corporation that has the effect of increasing the proportionate share of the stock of any class or series of the corporation beneficially owned by the interested shareholder; or (5) the receipt by the interested shareholder of the benefit of any loans, advances, guarantees, pledges or other financial benefits provided by or through the corporation. In general, Section 203 defines an “interested shareholder” as any entity or person beneficially owning 15% or more of the outstanding voting stock of the corporation and any entity or person affiliated with or controlling or controlled by such entity or person.
Corporate Opportunity
Subject to the terms of the Non-Competition Agreement with and our Purchase Rights granted to us by Pattern Development (see “Certain Relationships and Related Party Transactions” in our 2014 Proxy Statement), we have expressly renounced any interest or expectancy in, or in being offered an opportunity to participate in, any business opportunity that may be from time to time presented to Riverstone or any of their respective officers, directors, agents, shareholders, members, partners, affiliates and subsidiaries or business opportunities that such parties participate in or desire to participate in, even if the opportunity is one that we might reasonably have pursued or had the ability or desire to pursue if granted the opportunity to do so, and no such person shall be liable to us for breach of any fiduciary or other duty, as a director or controlling shareholder or otherwise, by reason of the fact that such person pursues or acquires any such business opportunity, directs any such business opportunity to another person or fails to present any such business opportunity, or information regarding any such business opportunity, to us, unless, in the case of any such person who is our director, any such business opportunity is expressly offered to such director in writing solely in his or her capacity as our director.
113
Table of Contents
Exchange Listing
Our Class A shares are listed on NASDAQ under the symbol “PEGI” and on TSX under the symbol “PEG”.
Transfer Agent and Registrar
We have appointed Computershare Trust Company, N.A. (including its affiliates in Canada) as the transfer agent and registrar for our shares of common stock.
114
Table of Contents
SHARES ELIGIBLE FOR FUTURE SALE
Upon the completion of this offering, we will have outstanding 47,312,722 Class A shares and 15,555,000 Class B shares. Of these shares, 33,862,376 Class A shares, assuming no exercise of the underwriters’ option to purchase additional shares, will be freely transferable without restriction or further registration under the U.S. Securities Act by persons other than “affiliates,” as that term is defined in Rule 144 under the U.S. Securities Act. Generally, the balance of our outstanding shares are “restricted securities” within the meaning of Rule 144 under the U.S. Securities Act, subject to the limitations and restrictions that are described below. Shares purchased by our affiliates, such as Pattern Development, will be “restricted securities” under Rule 144. All of our Class B shares are “restricted securities.” Restricted securities may be sold in the public market only if registered or if they qualify for an exemption from registration under Rules 144 or 701 promulgated under the U.S. Securities Act.
Lock-Up Agreements
In connection with this offering, we, our executive officers and directors and Pattern Development have agreed, subject to certain exceptions, not to sell or transfer any shares or securities convertible into, exchangeable for, exercisable for, or repayable with shares, for 90 days after the date of the closing of this offering without first obtaining the written consent of the underwriters. See “Underwriting.”
Rule 144
In general, under Rule 144 as in effect on the date of this prospectus, beginning 90 days after the completion of this offering, a person (or persons whose shares are required to be aggregated) who is an affiliate and who has beneficially owned our shares for at least six months is entitled to sell in any three-month period a number of shares that does not exceed the greater of:
| • | 1% of the number of shares then outstanding, which will equal approximately 473,127 shares immediately after completion of this offering; or |
| • | the average weekly trading volume in our shares on the applicable stock exchange during the four calendar weeks preceding the filing of a notice on Form 144 with respect to such a sale. |
Sales by our affiliates under Rule 144 are also subject to manner of sale provisions and notice requirements and to the availability of current public information about us. An “affiliate” is a person that directly, or indirectly through one or more intermediaries, controls or is controlled by, or is under common control with an issuer.
Under Rule 144, a person (or persons whose shares are aggregated) who is not deemed to have been an affiliate of ours at any time during the 90 days preceding a sale, and who has beneficially owned the shares proposed to be sold for at least six months (including the holding period of any prior owner other than an affiliate), would be entitled to sell those shares subject only to availability of current public information about us, and after beneficially owning such shares for at least 12 months (including the holding period of any prior owner other than an affiliate), would be entitled to sell an unlimited number of shares without restriction. To the extent that our affiliates sell their shares, other than pursuant to Rule 144 or a registration statement, the purchaser’s holding period for the purpose of effecting a sale under Rule 144 commences on the date of transfer from the affiliate.
Rule 701
In general, under Rule 701 as in effect on the date of this prospectus, any of our employees, directors, officers, consultants or advisors who purchased shares from us in reliance on Rule 701 in connection with a compensatory stock or option plan or other written agreement before the effective date of this offering, or who purchased shares from us after that date upon the exercise of options granted before that date, are eligible to resell such shares 90 days after the effective date of this offering in reliance upon Rule 144. If such person is not
115
Table of Contents
an affiliate, such sale may be made subject only to the manner of sale provisions of Rule 144. If such a person is an affiliate, such sale may be made under Rule 144 without compliance with the holding period requirement, but subject to the other Rule 144 restrictions described above.
S-8 Registration Statement
On October 9, 2013 we filed a registration statement on Form S-8 under the U.S. Securities Act, which registered 3,000,000 Class A shares in the form of underlying stock options or restricted stock awards or reserved for issuance under our equity incentive plans. The 3,000,000 Class A shares covered by such registration statement are eligible for sale in the public market, subject to Rule 144 volume limitations applicable to affiliates, vesting restrictions with us and the lock-up agreements described above.
Registration Rights Agreement
In connection with our initial public offering on October 2, 2013, we granted Pattern Development, who received our shares in the Contribution Transactions, certain registration rights with respect to the resale of such shares. All of the Class A shares issued to Pattern Development in the Contribution Transactions, as well as Class A shares held by Pattern Development upon the conversion of the Class B shares, are subject to the Registration Rights Agreement. From April 2, 2014, which is six months following completion of our initial public offering, the holders of such Class A shares are entitled to require us to seek to register all such Class A shares for public sale under the U.S. Securities Act, and/or qualify such Class A shares for distribution under Canadian securities laws, subject to certain exceptions, limitations and conditions precedent.
Additional Restrictions for Sales in Canada
The sale of any of our shares in the public market in Canada by a control person will be subject to restrictions under applicable Canadian securities laws in addition to those restrictions noted above, unless the sale is qualified under a prospectus filed with Canadian securities regulatory authorities or if prior notice of the sale is filed with Canadian securities regulatory authorities at least seven (7) days before any sale. Sales under the procedure noted above are also subject to other requirements and restrictions regarding the manner of sale, payment of commissions, reporting and availability of current public information about us and compliance with applicable Canadian securities laws.
116
Table of Contents
MATERIAL U.S. FEDERAL INCOME TAX CONSIDERATIONS FOR NON-U.S. HOLDERS
OF OUR CLASS A COMMON SHARES
The following is a discussion of the material U.S. federal income and estate tax consequences of the ownership and disposition of Class A common shares by a beneficial owner that is a “non-U.S. holder.” A “non-U.S. holder” is a person or entity that, for U.S. federal income tax purposes, is a:
| • | non-resident alien individual, other than certain former citizens and residents of the United States subject to U.S. tax as expatriates, |
| • | foreign corporation, or |
| • | foreign estate or trust. |
A “non-U.S. holder” does not include an individual who is present in the United States for 183 days or more in the taxable year of a disposition of Class A common shares and is not otherwise a resident of the United States for U.S. federal income tax purposes. Such an individual is urged to consult his or her tax adviser regarding the U.S. federal income tax consequences of the sale, exchange or other disposition of our Class A common shares.
If a partnership or other pass-through entity (including an entity or arrangement treated as a partnership or other type of pass-through entity for U.S. federal income tax purposes) owns our Class A common shares, the tax treatment of a partner or beneficial owner of such entity may depend upon the status of such partner or beneficial owner and the activities of such entity and on certain determinations made at the partner or beneficial owner level. Partnerships, partners and beneficial owners in partnerships or other pass-through entities that own our Class A common shares should consult their tax advisers as to the particular U.S. federal income and estate tax consequences applicable to them.
This discussion is based on the Internal Revenue Code of 1986, as amended (the “Code”), and administrative pronouncements, judicial decisions and final, temporary and proposed Treasury Regulations, changes to any of which subsequent to the date of this prospectus may affect the tax consequences described herein. This discussion does not address all aspects of U.S. federal income and estate taxation that may be relevant to non-U.S. holders in light of their particular circumstances and does not address any tax consequences arising under the laws of any state, local or foreign jurisdiction. Prospective non-U.S. holders are urged to consult their tax advisers with respect to the particular tax consequences to them of owning and disposing of our Class A common shares, including the consequences under the laws of any state, local or foreign jurisdiction.
Distributions
Distributions on our Class A common shares will constitute dividends for U.S. federal income tax purposes to the extent paid from our current or accumulated earnings and profits, as determined under U.S. federal income tax principles. To the extent those distributions exceed both our current and accumulated earnings and profits, they will constitute a return of capital and will first reduce the non-U.S. Holder’s basis in our Class A common shares, but not below zero, and then will be treated as gain from the sale of our Class A common shares, the treatment of which is described below under “—Gain on Disposition of Our Class A Common Shares.” Dividends paid to a non-U.S. Holder of our Class A common shares generally will be subject to withholding tax at a 30% rate or a reduced rate specified by an applicable income tax treaty. In order to obtain a reduced rate of withholding (subject to the discussion below under “—FATCA Legislation”), a non-U.S. holder generally will be required to provide an Internal Revenue Service (“IRS”) Form W-8BEN certifying its entitlement to benefits under a treaty. While it is likely that distributions on our Class A common shares in any year will exceed our earnings and profits and thus that some or all of such distributions will not constitute dividends for U.S. federal income tax purposes, the facts necessary to make a determination of the extent to which a distribution on our Class A common shares is treated as a dividend for such purpose may not be known at the time of the distribution. A non- U.S. holder should therefore expect that a withholding agent will treat the entire amount of a distribution on our Class A common shares as a dividend for purposes of determining the amount required to be withheld on such distribution.
117
Table of Contents
If it is later determined that all or a portion of such distribution did not in fact constitute a dividend for U.S. federal income tax purposes, a non-U.S. holder may be entitled to a refund of any excess tax withheld, provided that the required information is timely furnished to the IRS.
The withholding tax does not apply to dividends paid to a non-U.S. holder that provides an IRS Form W-8ECI, certifying that the dividends are effectively connected with the non-U.S. holder’s conduct of a trade or business within the United States. Instead, the effectively connected dividends will be subject to regular U.S. income tax as if the non-U.S. holder were a U.S. person, subject to an applicable income tax treaty providing otherwise. A non-U.S. corporation receiving effectively connected dividends may also be subject to an additional “branch profits tax” imposed at a rate of 30% (or a lower treaty rate).
Gain on Disposition of Our Class A Common Shares
A non-U.S. holder generally will not be subject to U.S. federal income tax on gain realized on a sale, exchange or other disposition of our Class A common shares unless:
| • | the gain is effectively connected with the non-U.S. holder’s conduct of a trade or business in the United States and, if required by an applicable tax treaty, is also attributable to a permanent establishment in the United States maintained by such non-U.S. holder (in which case the gain will be taxed on a net income basis at the regular graduated rates and in the manner applicable to U.S. persons and, if the non-U.S. holder is a foreign corporation, an additional “branch profits tax” imposed at a rate of 30%, or a lower treaty rate, may also apply); or |
| • | we are or have been a U.S. real property holding corporation (a “USRPHC”), as described below, at any time within the five-year period preceding the disposition or the non-U.S. holder’s holding period, whichever period is shorter, and either (i) our Class A common shares have ceased to be regularly traded on an established securities market prior to the beginning of the calendar year in which the sale or disposition occurs or (ii) the non-U.S. holder has owned or is deemed to have owned, at any time within the five-year period preceding the disposition or the non-U.S. holder’s holding period, whichever period is shorter, more than 5% of our Class A common shares. |
Generally, a U.S. corporation is a USRPHC if the fair market value of its “U.S. real property interests,” as defined in the Code and applicable Treasury Regulations, equals or exceeds 50% of the aggregate fair market value of its worldwide real property interests and its other assets used or held for use in a trade or business. Although we have not undertaken a complete analysis and there can be no assurance that the IRS will not take a contrary position, we believe that we are not currently nor do we expect to be a USRPHC for U.S. federal income tax purposes. The determination of whether we are a USRPHC depends on certain assumptions regarding the fair market value of our U.S. real property interests relative to the fair market value of our other trade or business assets and our non-U.S. real property interests. Moreover, the composition and relative values of our assets may change over time. As a result, we may be, now or at any time while a non-U.S. holder owns our Class A common shares, a USRPHC.
Our Class A common shares are currently listed on the NASDAQ Global Market and we believe that, for as long as we continue to be so listed, our Class A common shares will be treated as regularly traded on an established securities market. If we are or become a USRPHC, and if our Class A common shares cease to be regularly traded on an established securities market, a non-U.S. holder generally would be subject to U.S. federal income tax on any gain from the disposition of our Class A common shares and transferees of our shares would generally be required to withhold 10% of the gross proceeds payable to the transferor. The gain would be subject to regular U.S. income tax as if the non-U.S. holder were a U.S. person, and the non-U.S. holder would be required to file a U.S. tax return with respect to such gain. Regardless of whether our Class A common shares are regularly traded on an established securities market, if we are or become a USRPHC, a non-U.S. holder that has owned, or is deemed to have owned, at any time within the shorter of the five-year period preceding the
118
Table of Contents
disposition of our Class A common shares or the non-U.S. holder’s holding period, more than 5% of our Class A common shares, generally would be subject to U.S. federal income tax on any gain from the disposition of our Class A common shares. This gain would be subject to regular U.S. income tax as if the non-U.S. holder were a U.S. person, and a non-U.S. holder would be required to file a U.S. tax return with respect to such gain.
Information Reporting Requirements and Backup Withholding
Information returns will be filed with the IRS in connection with payments of dividends and may be filed in connection with the proceeds from a sale or other disposition of our Class A common shares. A non-U.S. holder may have to comply with certification procedures to establish that it is not a U.S. person in order to avoid information reporting and backup withholding requirements. Compliance with the certification procedures required to claim a reduced rate of withholding under a treaty will satisfy the certification requirements necessary to avoid backup withholding as well. The amount of any backup withholding from a payment to a non-U.S. holder will be allowed as a credit against such non-U.S. holder’s U.S. federal income tax liability and may entitle such non-U.S. holder to a refund, provided that the required information is furnished to the IRS in a timely manner.
FATCA Legislation
Sections 1471 through 1474 of the Code (commonly referred to as “FATCA”) and applicable Treasury Regulations impose withholding of 30% on payments of dividends on, and gross proceeds from the sale or redemption of, our Class A common shares paid to “foreign financial institutions” (which is broadly defined for this purpose and in general includes investment vehicles) and certain other non-U.S. entities unless various U.S. information reporting and due diligence requirements (generally relating to ownership by U.S. persons of certain interests in or accounts with those entities) have been satisfied, or an exemption applies. An intergovernmental agreement between the United States and an applicable foreign country may modify these requirements. If FATCA withholding is imposed, a beneficial owner of our Class A common shares that is not a foreign financial institution generally will be entitled to a refund of any amounts withheld in excess of otherwise applicable withholding tax by filing a U.S. federal income tax return (which may entail significant administrative burden). A beneficial owner that is a foreign financial institution but not a “participating foreign financial institution” (as defined under FATCA) will be able to obtain a refund only to the extent an applicable income tax treaty with the United States entitles such beneficial owner to an exemption from, or reduced rate of, tax on the payment that was subject to withholding under FATCA. These withholding requirements apply to payments of dividends on our Class A common shares made after June 30, 2014, and payments of gross proceeds from a disposition of our Class A common shares made after December 31, 2016. Non-U.S. holders should consult their tax advisers regarding the effects of FATCA on their investment in our Class A common shares and their potential ability to obtain a refund of any FATCA withholding.
Federal Estate Tax
Individual non-U.S. holders and entities the property of which is potentially includible in such an individual’s gross estate for U.S. federal estate tax purposes (for example, a trust funded by such an individual and with respect to which the individual has retained certain interests or powers), should note that, absent an applicable treaty benefit, our Class A common shares will be treated as U.S. situs property subject to U.S. federal estate tax.
119
Table of Contents
MATERIAL CANADIAN FEDERAL INCOME TAX CONSIDERATIONS FOR HOLDERS OF OUR
CLASS A COMMON SHARES
The following is a summary of the material Canadian federal income tax considerations under the Income Tax Act (Canada), or the “Tax Act,” generally applicable to a holder who acquires our Class A shares pursuant to this offering, and who, for the purposes of the Tax Act and at all relevant times, holds such Class A shares as capital property and deals at arm’s length with, and is not affiliated with, us, which we refer to as a “Holder.” The Class A shares will generally be considered to be capital property to a Holder unless the Holder holds such Class A shares in the course of carrying on a business of buying and selling securities or has acquired them in one or more transactions considered to be an adventure or concern in the nature of trade.
This summary is not applicable to a holder: (i) with respect to which our company is or will be, at any time, a “foreign affiliate” within the meaning of the Tax Act, (ii) that is a “financial institution” for the purposes of the mark-to-market rules under the Tax Act, (iii) an interest in which is a “tax shelter” or a “tax shelter investment”, each as defined in the Tax Act, (iv) that is a “specified financial institution” as defined in the Tax Act, (v) which has made a “functional currency” reporting election under section 261 of the Tax Act to report the holder’s “Canadian tax results” (as defined in the Tax Act) in a currency other than the Canadian currency, or (vi) that has entered, or will enter, into a “derivative forward agreement”, as defined in the Tax Act, with respect to the Class A shares. Any such holder should consult its own tax advisor with respect to the income tax considerations applicable to it in respect of acquiring, holding and disposing of the Class A shares acquired pursuant to this offering.
This summary is based on the current provisions of the Tax Act and the regulations promulgated thereunder and an understanding of the current published administrative policies and assessing practices of the Canada Revenue Agency, or the “CRA,” made public prior to the date hereof. This summary takes into account all proposed amendments to the Tax Act and the regulations promulgated thereunder that have been publicly announced by or on behalf of the Minister of Finance (Canada), or “Finance,” prior to the date hereof, which we refer to as the “Proposed Amendments,” and assumes that such Proposed Amendments will be enacted in the form proposed, although no assurance can be given that the Proposed Amendments will be enacted in their current form or at all. Except for the Proposed Amendments, this summary does not take into account or anticipate any other changes in law or any changes in the CRA’s administrative policies or assessing practices, whether by judicial, governmental or legislative action or decision, nor does it take into account other federal or any provincial, territorial or foreign tax legislation or considerations, which may differ from the Canadian federal income tax considerations described herein. The provisions of provincial income tax legislation vary from province to province in Canada and in some cases differ from the Tax Act.
For purposes of the Tax Act, all amounts relating to the acquisition, holding or disposition of Class A shares (including dividends, adjusted cost base and proceeds of disposition) must generally be expressed in Canadian dollars. Amounts denominated in any other currency must be converted into Canadian dollars generally based on the exchange rate quoted by the Bank of Canada for noon on the date such amounts arise or such other rate of exchange as is acceptable to the Minister of National Revenue (Canada).
This summary is of a general nature only and is not intended to be, nor should it be construed to be, legal or tax advice to any particular Holder, and no representations with respect to the income tax considerations applicable to any particular Holder are made. This summary is not exhaustive of all Canadian federal income tax considerations. The relevant tax considerations applicable to the acquiring, holding and disposing of Class A shares may vary according to the status of the purchaser, the jurisdiction in which the purchaser resides or carries on business and the purchaser’s own particular circumstances. Accordingly, prospective Holders are urged to consult their own tax advisors about the specific tax consequences to them of acquiring, holding and disposing of Class A shares.
120
Table of Contents
Holders Resident in Canada
The following discussion applies to a Holder who, for the purposes of the Tax Act and any applicable income tax treaty or convention, and at all relevant times, is resident in Canada, which we refer to as a “Resident Holder.”
Dividends on Class A Shares
A Resident Holder will be required to include in computing such Resident Holder’s income for a taxation year the amount of any dividends including amounts deducted for U.S. withholding tax, if any, received (or deemed to be received) on our Class A shares. Dividends received on our Class A shares by a Resident Holder who is an individual will not be subject to the gross-up and dividend tax credit rules in the Tax Act normally applicable to taxable dividends received from “taxable Canadian corporations” (as defined in the Tax Act). A Resident Holder that is a corporation will not be entitled to deduct the amount of such dividends in computing its taxable income under the rules that generally apply to dividends received from taxable Canadian corporations.
To the extent that U.S. withholding tax is payable by a Resident Holder in respect of any dividends received on our Class A shares, the Resident Holder may be eligible for a foreign tax credit or deduction under the Tax Act to the extent and under the circumstances described in the Tax Act. Generally, a Resident Holder will be eligible to claim a foreign tax credit or deduction in respect of U.S. withholding tax payable by the Resident Holder only to the extent the Resident Holder has U.S. source income. Dividends paid on our Class A shares to a Resident Holder will generally be regarded as U.S. source income if our company is a resident of the United States for Canadian federal income tax purposes. Resident Holders should consult their own tax advisors regarding the availability of a foreign tax credit or deduction in their particular circumstances.
Disposition of Class A Shares
A disposition or deemed disposition of our Class A shares by a Resident Holder (including on a purchase of a Class A share for cancellation by the company) will generally result in a capital gain (or capital loss) to the extent that the proceeds of disposition, net of any reasonable costs of the disposition, exceed (or are exceeded by) the adjusted cost base to the Resident Holder of such Class A shares immediately before the disposition. See “—Taxation of Capital Gains and Capital Losses.”
Taxation of Capital Gains and Capital Losses
Generally, one-half of any capital gain, or a “taxable capital gain,” realized by a Resident Holder will be included in the Resident Holder’s income for the year of disposition. One-half of any capital loss, or an “allowable capital loss,” realized by a Resident Holder in a taxation year generally must be deducted by the Holder against taxable capital gains in that year (subject to, and in accordance with, the provisions of the Tax Act). Any excess of allowable capital losses over taxable capital gains realized by a Resident Holder in a taxation year may be carried back up to three taxation years or forward indefinitely and deducted against net taxable capital gains realized in such years, to the extent and under the circumstances described in the Tax Act.
Capital gains realized by a Resident Holder that is an individual or trust, other than certain specified trusts, may give rise to a liability for alternative minimum tax under the Tax Act.
U.S. tax, if any, levied on any gain realized on a disposition of our Class A shares may be eligible for a foreign tax credit under the Tax Act to the extent and under the circumstances described in the Tax Act. Resident Holders should consult their own tax advisors with respect to the availability of a foreign tax credit, having regard to their own particular circumstances.
121
Table of Contents
Offshore Investment Fund Property Rules
The Tax Act contains provisions, or the “OIF Rules,” which, in certain circumstances, may require a Resident Holder to include an amount in income in each taxation year in respect of the acquisition and holding of our Class A shares if (1) the value of such Class A shares may reasonably be considered to be derived, directly or indirectly, primarily from portfolio investments in: (i) shares of the capital stock of one or more corporations, (ii) indebtedness or annuities, (iii) interests in one or more corporations, trusts, partnerships, organizations, funds or entities, (iv) commodities, (v) real estate, (vi) Canadian or foreign resource properties, (vii) currency of a country other than Canada, (viii) rights or options to acquire or dispose of any of the foregoing, or (ix) any combination of the foregoing, which we collectively refer to as “Investment Assets;” and (2) it may reasonably be concluded that one of the main reasons for the Resident Holder acquiring, holding or having our Class A shares was to derive a benefit from portfolio investments in Investment Assets in such a manner that the taxes, if any, on the income, profits and gains from such Investment Assets for any particular year are significantly less than the tax that would have been applicable under Part I of the Tax Act if the income, profits and gains had been earned directly by the Resident Holder.
In making the determination under point (2) in the preceding paragraph, the OIF Rules provide that regard must be had to all of the circumstances, including (i) the nature, organization and operation of any non-resident entity, including our company, and the form of, and the terms and conditions governing, the Resident Holder’s interest in, or connection with, any such non-resident entity, (ii) the extent to which any income, profit and gains that may reasonably be considered to be earned or accrued, whether directly or indirectly, for the benefit of any such non-resident entity, including our company, are subject to an income or profits tax that is significantly less than the income tax that would be applicable to such income, profits and gains if they were earned directly by the Resident Holder, and (iii) the extent to which any income, profits and gains of any such non-resident entity, including our company, for any fiscal period are distributed in that or the immediately following fiscal period.
If applicable, the OIF Rules generally require a Resident Holder to include in the Resident Holder’s income for each taxation year in which such Resident Holder owns our Class A shares the amount, if any, by which (i) the total of all amounts each of which is the product obtained when the Resident Holder’s “designated cost” (as defined in the Tax Act) of our Class A shares at the end of a month in the year is multiplied by 1/12 of the aggregate of the prescribed rate of interest for the period including that month plus two percentage points exceeds (ii) any dividends or other amounts included in computing such Resident Holder’s income for the year (other than a capital gain) in respect of our Class A shares determined without reference to the OIF Rules. Any amount required to be included in computing a Resident Holder’s income in respect of our Class A shares under these provisions will be added to the adjusted cost base and the designated cost of our Class A shares to the Resident Holder.
The CRA has taken the position that the term “portfolio investment” should be given a broad interpretation. While the value of our Class A shares should not be regarded as being derived primarily from portfolio investments in Investment Assets, there is a possibility that the CRA may take a different view. However, as noted above, even if this is the case, the OIF Rules will apply only if it is reasonable to conclude that one of the main reasons for a Resident Holder acquiring, holding or having our Class A shares was to derive a benefit from Investment Assets in such a manner that the taxes, if any, on the income, profits and gains from such Investment Assets for any particular year are significantly less than the tax that would have been applicable under Part I of the Tax Act if the income, profits and gains had been earned directly by the Resident Holder.
The OIF Rules are complex and their application will potentially depend, in part, on the reasons for a Resident Holder acquiring, holding or having our Class A shares. Resident Holders are urged to consult their own tax advisors regarding the application and consequences of the OIF Rules in their own particular circumstances.
122
Table of Contents
Additional Refundable Tax
A Resident Holder that is, throughout the relevant taxation year, a “Canadian-controlled private corporation” (as defined in the Tax Act) may be subject to pay a refundable tax on its “aggregate investment income” (as defined in the Tax Act), including taxable capital gains and certain dividends.
Foreign Property Information Reporting
In general, a Resident Holder that is a “specified Canadian entity” (as defined in the Tax Act) for a taxation year or a fiscal period and whose total “cost amount” (as defined in the Tax Act) of “specified foreign property” (as defined in the Tax Act), including our Class A shares, at any time in the year or fiscal period exceeds C$100,000 will be required to file an information return with the CRA for the taxation year or fiscal period disclosing certain prescribed information in respect of such property. Subject to certain exceptions, a taxpayer resident in Canada, other than a corporation or trust exempt from tax under Part I of the Tax Act, will be a “specified Canadian entity,” as will certain partnerships. Our Class A shares will be “specified foreign property” to a Resident Holder. Penalties may apply where a Resident Holder fails to file the required information return in respect of such Resident Holder’s “specified foreign property” on a timely basis in accordance with the Tax Act. The reporting requirements with respect to “specified foreign property” were recently expanded so that more detailed information is required to be provided to the CRA, subject to administrative relief in respect of a “specified foreign property” where the taxpayer has received a CRA form T3 or T5 issued by a Canadian issuer in respect of the “specified foreign property”.
The reporting rules in the Tax Act relating to “specified foreign property” are complex and this summary does not purport to address all circumstances in which reporting may be required by a Resident Holder. Resident Holders should consult their own tax advisors regarding the reporting rules contained in the Tax Act.
Eligibility for Investment
The Class A shares offered hereby will, on the date of this offering, provided that the Class A shares are on that date listed on a “designated stock exchange”, as defined in the Tax Act (which currently includes the TSX and the NASDAQ), be qualified investments under the Tax Act for a trust governed by a registered retirement savings plan, or “RRSP,” registered retirement income fund, or “RRIF,” registered disability savings plan, deferred profit sharing plan, registered education savings plan, or tax-free savings account, or “TFSA”, all within the meaning of the Tax Act.
Notwithstanding that the Class A shares may be qualified investments for a trust governed by a TFSA, RRSP or RRIF, the holder of the TFSA or the annuitant under the RRSP or RRIF, as the case may be, will be subject to a penalty tax in respect of the Class A shares if such Class A shares are “prohibited investments” for the TFSA, RRSP or RRIF, as the case may be. The Class A shares will generally not be a “prohibited investment” provided the holder of the TFSA or the annuitant under the RRSP or RRIF, as the case may be, deals at arm’s length with our company for purposes of the Tax Act and does not have a “significant interest” in our company for purposes of the prohibited investment rules in the Tax Act. In addition, the Class A shares will not be a “prohibited investment” if the Class A shares are “excluded property” as defined in subsection 207.01(1) of the Tax Act for a trust governed by a TFSA, RRSP or RRIF. Holders of a TFSA and annuitants under a RRSP or RRIF should consult their own tax advisors as to whether the Class A shares will be a “prohibited investment” in their particular circumstances.
Holders Not Resident in Canada
The following portion of this summary is applicable to a Holder who: (i) has not been, is not, and will not be resident or deemed to be resident in Canada for purposes of the Tax Act or any applicable tax treaty or convention; and (ii) does not and will not use or hold, and is not and will not be deemed to use or hold, our
123
Table of Contents
Class A shares in connection with, or in the course of, carrying on a business in Canada, or a “Non-Resident Holder.” Special rules, which are not discussed in this summary, may apply to a Non-Resident Holder that is an insurer carrying on business in Canada and elsewhere. Such Non-Resident Holders should consult their own tax advisors.
Dividends on Class A Shares
Dividends paid in respect of our Class A shares to a Non-Resident Holder will not be subject to Canadian withholding tax or other income tax under the Tax Act.
Disposition of Class A Shares
A Non-Resident Holder who disposes or is deemed to dispose of our Class A shares that were acquired under the offering will not be subject to Canadian income tax in respect of any capital gain realized on the disposition unless such Class A shares constitute “taxable Canadian property” of the Non-Resident Holder for the purposes of the Tax Act and no exemption is available under an applicable income tax treaty or convention between Canada and the jurisdiction in which the Non-Resident Holder is resident.
Generally, our Class A shares will not be taxable Canadian property at a particular time of a Non-Resident Holder provided that our Class A shares are listed on a “designated stock exchange” as defined in the Tax Act, (which currently includes the TSX and NASDAQ) at that time, unless, at any time during the sixty-month period that ends at that time when (a)(i) the Non-Resident Holder, (ii) persons not dealing at arm’s length with such Non-Resident Holder, (iii) partnerships in which the Non-Resident Holder or a person mentioned in (a)(ii) holds a membership interest directly or indirectly through one or more partnerships or (iv) any combination of (a)(i) to (iii), owned 25% or more of the issued shares of any class or series of the capital stock of our company and (b) at that time more than 50% of the value of such Class A shares was derived directly or indirectly from one or any combination of (i) real or immovable property situated in Canada; (ii) “Canadian resource properties” as defined in the Tax Act; (iii) “timber resource properties” as defined in the Tax Act; and (iv) options in respect of, interests in or rights in any property listed in (i) to (iii). Notwithstanding the foregoing, in certain circumstances set out in the Tax Act, our Class A shares may be deemed to be taxable Canadian property to a Non-Resident Holder. Non-Resident Holders whose Class A shares are taxable Canadian property should consult their own tax advisors for advice having regard to their particular circumstances.
124
Table of Contents
BMO Capital Markets Corp., Morgan Stanley & Co. LLC, RBC Dominion Securities Inc., Scotia Capital Inc., Merrill Lynch, Pierce, Fenner & Smith Incorporated, Wells Fargo Securities, LLC, CIBC World Markets Inc., KeyBanc Capital Markets Inc. and Raymond James Ltd. are acting as the underwriters of this offering. BMO Capital Markets Corp., Morgan Stanley & Co. LLC, and RBC Dominion Securities Inc. are acting as the representatives of the several underwriters of this offering. Subject to the terms and conditions stated in the underwriting agreement dated the date of this prospectus, or the “Underwriting Agreement,” each underwriter named below has severally agreed to purchase from us, and we and the selling shareholder have agreed to sell to such underwriter, the respective number of our Class A shares shown opposite its name below at a price of $ per Class A share by , 2014 payable in cash against delivery.
| Underwriter |
Number of Class A Shares | |
| BMO Capital Markets Corp. |
||
| Morgan Stanley & Co. LLC |
||
| RBC Dominion Securities Inc. |
||
| Scotia Capital Inc. |
||
| Merrill, Lynch, Pierce, Fenner & Smith Incorporated |
||
| Wells Fargo Securities, LLC |
||
| CIBC World Markets Inc. |
||
| KeyBanc Capital Markets Inc. |
||
| Raymond James Ltd. |
||
|
| ||
| Total |
||
|
|
This offering is being made concurrently in the United States and in each of the provinces and territories of Canada. Our Class A shares will be offered in the United States through those underwriters or their U.S. affiliates who are registered to offer the Class A shares for sale in the United States, and in Canada through those underwriters or their Canadian affiliates who are registered to offer our Class A shares for sale in applicable Canadian provinces or territories, and such other registered dealers as may be designated by the underwriters. Subject to applicable law, the underwriters may offer our Class A shares outside of the United States and Canada. Each of Wells Fargo Securities, LLC and KeyBanc Capital Markets Inc. is not registered to sell securities in any Canadian jurisdiction and, accordingly, will only sell Class A common shares outside of Canada.
The obligations of the underwriters under the Underwriting Agreement may be terminated at their discretion based on their assessment of the state of the financial markets and may also be terminated upon the occurrence of certain stated events. The underwriters are, however, obligated to take up and pay for all of the offered Class A shares if any of the Class A shares are purchased under the Underwriting Agreement. The Underwriting Agreement also provides that if an underwriter defaults, the purchase commitments of non-defaulting underwriters may also be increased or the offering may be terminated.
The underwriters propose to offer our Class A shares directly to the public at the public offering price set forth on the cover page of this prospectus and to certain dealers at that price less a concession not in excess of $ per Class A share. After the public offering of the Class A shares, the offering price and other selling terms may be changed by the underwriters.
The underwriters have an option to buy up to 2,321,981 additional Class A shares from the selling shareholder at a price of $ per Class A share to cover sales of Class A shares by the underwriters which exceed the number of Class A shares specified in the table above. The underwriters have 30 days from the closing date of this offering to exercise this overallotment option. If any Class A shares are purchased with this overallotment option, the underwriters will purchase Class A shares in approximately the same proportion as
125
Table of Contents
shown in the table above. If any additional Class A shares are purchased, the underwriters will offer the additional Class A shares on the same terms as those on which the Class A shares are being offered. We will not receive any proceeds from the exercise of the underwriters’ overallotment option.
A purchaser who acquires Class A shares forming part of the underwriters’ over-allocation position acquires such shares under this prospectus, regardless of whether the over-allocation position is ultimately filled through the sales of our Class A shares by the selling shareholder upon exercise of the overallotment option or secondary market purchases. Any naked short position shall form part of the underwriters’ over-allocation position.
The following table shows the per Class A share and total underwriters’ commission to be paid to the underwriters, assuming both no exercise and full exercise of the underwriters’ option to purchase additional Class A shares.
| Per Class A Share | Total | |||||||||||||||
| Without Over- Allotment |
With Over- Allotment |
Without Over- Allotment |
With Over- Allotment |
|||||||||||||
| Public offering price |
$ | $ | $ | $ | ||||||||||||
| Underwriters’ commissions paid by us |
$ | $ | $ | $ | ||||||||||||
| Underwriters’ commissions paid by the selling shareholder |
$ | $ | $ | $ | ||||||||||||
The public offering price for our Class A shares, wherever offered, is payable in U.S. dollars, except as may otherwise be agreed by the underwriters.
We estimate that the total expenses of this offering to us, including registration, filing and listing fees, printing fees, and legal and accounting expenses, but excluding the underwriters’ commission, will be approximately $1.6 million.
Each of Pattern Renewables LP, Pattern Development, Pattern Development Finance Company LLC, us and our directors and executive officers have entered into lock-up agreements with the underwriters pursuant to which each of these persons or entities, with limited exceptions, for a period of 90 days after the date of the closing of this offering, may not, without the prior written consent of each of BMO Capital Markets Corp., Morgan Stanley & Co. LLC, and RBC Dominion Securities Inc., (1) offer, pledge, sell, contract to sell, sell any option or contract to purchase, purchase any option or contract to sell, grant any option, right, or warrant to purchase, or otherwise transfer or dispose of, directly or indirectly, any of our shares or any securities convertible into or exercisable or exchangeable for our shares (including, without limitation, our shares or such other securities which may be deemed to be beneficially owned by such persons in accordance with the rules and regulations of the SEC and securities which may be issued upon exercise of a stock option or warrant), (2) enter into any swap or other agreement that transfers, in whole or in part, any of the economic consequences of ownership of our shares or such other securities, whether any such transaction described in clause (1) or (2) above is to be settled by delivery of our shares or such other securities, in cash, or otherwise, or (3) file, request or make any demand for or exercise any right with respect to the registration of any of our shares or any security convertible into or exercisable or exchangeable for our shares. In addition, the lock-up agreements will not restrict the pledge by Pattern Development or Pattern Renewables of our shares as security for a bona fide loan, provided the lender agrees not to foreclose upon such shares during the lock-up period; or the transfer of our shares as bona fide gifts, transfer by will or the laws of intestacy, transfers to family members (including to vehicles of which they are beneficial owners), transfers pursuant to domestic relations or court orders, transfers to certain members of our management team by Pattern Development in exchange for their equity interest in Pattern Development or (in the case of corporations or other entities) transfers to affiliates, in each case so long as the transferee agrees to be bound by the restrictions in the lock-up agreements.
We and Pattern Development have agreed to indemnify the underwriters against certain liabilities, including liabilities under the U.S. Securities Act and applicable Canadian securities laws.
126
Table of Contents
Pursuant to Canadian securities laws and the Universal Market Integrity Rules for Canadian Marketplaces, the underwriters may not, throughout the period of distribution, bid for, or purchase our shares, except in accordance with certain permitted transactions, including market stabilization and passive market making activities.
In connection with this offering, the underwriters may engage in stabilizing transactions, which involves making bids for, purchasing, and selling our Class A shares in the open market for the purpose of preventing or retarding a decline in the market price of our Class A shares while this offering is in progress. These stabilizing transactions may include making short sales of our Class A shares, which involves the sale by the underwriters of a greater number of our Class A shares than they are required to purchase in this offering, and purchasing our Class A shares on the open market to cover positions created by short sales. Short sales may be “covered” shorts, which are short positions in an amount not greater than the underwriters’ overallotment option referred to above, or may be “naked” shorts, which are short positions in excess of that amount. The underwriters may close out any covered short position either by exercising their overallotment option, in whole or in part, or by purchasing Class A shares in the open market. In making this determination, the underwriters will consider, among other things, the price of Class A shares available for purchase in the open market compared to the price at which the underwriters may purchase Class A shares pursuant to the overallotment option. A naked short position is more likely to be created if the underwriters are concerned that there may be downward pressure on the price of our Class A shares in the open market that could adversely affect investors who purchase in this offering. To the extent that the underwriters create a naked short position, they will purchase Class A shares in the open market to cover the position.
The underwriters have advised us that, pursuant to Regulation M of the U.S. Securities Act and applicable Canadian securities laws, they may also engage in other activities that stabilize, maintain, or otherwise affect the price of our shares, including the imposition of penalty bids. This means that if the underwriters purchase our Class A shares in the open market in stabilizing transactions or to cover short sales, the joint book-running managers can require the underwriters that sold those Class A shares as part of this offering to repay the underwriters’ commission received by them.
These activities may have the effect of raising or maintaining the market price of our Class A shares or preventing or retarding a decline in the market price of our Class A shares, and, as a result, the price of our Class A shares may be higher than the price that otherwise might exist in the open market. If the underwriters commence these activities, they may discontinue them at any time. The underwriters may carry out these transactions on applicable stock exchanges, in the over-the-counter market, or otherwise.
The public offering price will be determined by negotiations between us and the underwriters. In determining the public offering price, we and the underwriters expect to consider a number of factors including:
| • | the information set forth in this prospectus and otherwise available to us and the underwriters; |
| • | our prospects and the history and prospects for the industry in which we compete; |
| • | an assessment of our management; |
| • | our prospects for future earnings; |
| • | the general condition of the securities markets at the time of this offering; |
| • | the recent market prices of, and demand for, our Class A common stock and publicly traded common stock of generally comparable companies; and |
| • | other factors deemed relevant by the underwriters and us. |
Selling Restrictions
Other than in the United States and in each of the Canadian provinces and territories, no action has been taken by us or the underwriters that would permit a public offering of the securities offered by this prospectus in any jurisdiction where action for that purpose is required. The securities offered by this prospectus may not be
127
Table of Contents
offered or sold, directly or indirectly, nor may this prospectus or any other offering material or advertisements in connection with the offer and sale of any such securities be distributed or published in any jurisdiction, except under circumstances that will result in compliance with the applicable rules and regulations of that jurisdiction. Persons into whose possession this prospectus comes are advised to inform themselves about and to observe any restrictions relating to the offering and the distribution of this prospectus. This prospectus does not constitute an offer to sell or a solicitation of an offer to buy any securities offered by this prospectus in any jurisdiction in which such an offer or a solicitation is unlawful.
European Economic Area
In relation to each member state of the European Economic Area which has implemented the Prospectus Directive, each referred to herein as a “Relevant Member State”, with effect from and including the date on which the Prospectus Directive is implemented in that Relevant Member State, referred to herein as the “Relevant Implementation Date”, no offer of any securities which are the subject of the offering contemplated by this prospectus has been or will be made to the public in that Relevant Member State other than any offer where a prospectus has been or will be published in relation to such securities that has been approved by the competent authority in that Relevant Member State or, where appropriate, approved in another Relevant Member State and notified to the relevant competent authority in that Relevant Member State in accordance with the Prospectus Directive, except that with effect from and including the Relevant Implementation Date, an offer of such securities may be made to the public in that Relevant Member State:
| • | to any legal entity which is a “qualified investor” as defined in the Prospectus Directive; |
| • | to fewer than 100 or, if the Relevant Member State has implemented the relevant provision of the 2010 PD Amending Directive, 150, natural or legal persons (other than qualified investors as defined in the Prospectus Directive), as permitted under the Prospectus Directive, subject to obtaining the prior consent of the representatives of the underwriters for any such offer; or |
| • | in any other circumstances falling within Article 3(2) of the Prospectus Directive, |
provided that no such offer of securities shall require us or any of the underwriters to publish a prospectus pursuant to Article 3 of the Prospectus Directive or supplement a prospectus pursuant to Article 16 of the Prospectus Directive.
For the purposes of this provision, the expression an “offer to the public” in relation to any securities in any Relevant Member State means the communication in any form and by any means of sufficient information on the terms of the offer and the securities to be offered so as to enable an investor to decide to purchase or subscribe for the securities, as the same may be varied in that Relevant Member State by any measure implementing the Prospectus Directive in that Relevant Member State and the expression “Prospectus Directive” means Directive 2003/71/EC (and amendments thereto, including the 2010 PD Amending Directive, to the extent implemented in the Relevant Member State), and includes any relevant implementing measure in the Relevant Member State and the expression “2010 PD Amending Directive” means Directive 2010/73/EU.
France
Neither this prospectus nor any other offering material relating to the shares described in this prospectus has been submitted to the clearance procedures of the Autorité des Marchés Financiers or of the competent authority of another member state of the European Economic Area and notified to the Autorité des Marchés Financiers. The shares have not been offered or sold and will not be offered or sold, directly or indirectly, to the public in France. Neither this prospectus nor any other offering material relating to the shares has been or will be:
| • | released, issued, distributed or caused to be released, issued or distributed to the public in France; or |
| • | used in connection with any offer for subscription or sale of the shares to the public in France. |
128
Table of Contents
Such offers, sales and distributions will be made in France only:
| • | to qualified investors (investisseurs qualifiés) and/or to a restricted circle of investors (cercle restraint d’investisseurs), in each case investing for their own account, all as defined in, and in accordance with articles L.411-2, D.411-1, D.411-2, D.734-1, D.744-1, D.754-1 and D.764-1 of the French Code monétaire et financier; |
| • | to investment services providers authorized to engage in portfolio management on behalf of third parties; or |
| • | in a transaction that, in accordance with article L.411-2-II-1°-or-2°-or 3° of the French Code monétaire et financier and article 211-2 of the General Regulations (Règlement Général) of the Autorité des Marchés Financiers, does not constitute a public offer (appel public à l’épargne). |
The shares may be resold directly or indirectly, only in compliance with articles L.411-1, L.411-2, L.412-1 and L.621-8 through L.621-8-3 of the French Code monétaire et financier.
Switzerland
The securities may not be publicly offered in Switzerland and will not be listed on the SIX Swiss Exchange, or SIX, or on any other stock exchange or regulated trading facility in Switzerland. This prospectus has been prepared without regard to the disclosure standards for issuance prospectuses under art. 652a or art. 1156 of the Swiss Code of Obligations or the disclosure standards for listing prospectuses under art. 27 ff. of the SIX Listing Rules or the listing rules of any other stock exchange or regulated trading facility in Switzerland. Neither this prospectus nor any other offering or marketing material relating to the securities or the offering may be publicly distributed or otherwise made publicly available in Switzerland.
Neither this prospectus nor any other offering or marketing material relating to the offering, us or the securities have been or will be filed with or approved by any Swiss regulatory authority. In particular, this prospectus will not be filed with, and the offer of securities will not be supervised by, the Swiss Financial Market Supervisory Authority FINMA, and the offer of securities has not been and will not be authorized under the Swiss Federal Act on Collective Investment Schemes, or “CISA”. The investor protection afforded to acquirers of interests in collective investment schemes under the CISA does not extend to acquirers of securities.
United Kingdom
This prospectus is only being distributed to, and is only directed at, persons in the United Kingdom that are qualified investors within the meaning of Article 2(1)(e) of the Prospectus Directive that are also (i) investment professionals falling within Article 19(5) of the Financial Services and Markets Act 2000 (Financial Promotion) Order 2005, as amended, referred to herein as the Order, and/or (ii) high net worth entities falling within Article 49(2)(a) to (d) of the Order and other persons to whom it may lawfully be communicated. Each such person is referred to herein as a “Relevant Person”.
This prospectus and its contents are confidential and should not be distributed, published or reproduced (in whole or in part) or disclosed by recipients to any other persons in the United Kingdom. Any person in the United Kingdom that is not a Relevant Person should not act or rely on this document or any of its contents.
We have not authorized and do not authorize the making of any offer of securities through any financial intermediary on their behalf, other than offers made by the underwriters with a view to the final placement of the securities as contemplated in this prospectus. Accordingly, no purchaser of the securities, other than the underwriters, is authorized to make any further offer of the securities on behalf of us or the underwriters.
129
Table of Contents
Other Relationships
Certain of the underwriters and their affiliates have provided in the past to us and our affiliates and may provide from time to time in the future certain commercial banking, financial advisory, investment banking, and other services for us and such affiliates in the ordinary course of their business, for which they have received and may continue to receive customary fees and commissions. Affiliates of BMO Capital Markets, Morgan Stanley & Co. LLC and RBC Dominion Securities Inc. are lenders under our revolving credit facility. Certain affiliates of the underwriters are also lenders under and parties to certain of our project financing arrangements. Affiliates of BMO Capital Markets Corp., Morgan Stanley & Co. LLC, RBC Dominion Securities Inc. and KeyBanc Capital Markets Inc. may also be parties to a margin loan agreement with Pattern Development. An affiliate of Morgan Stanley & Co. LLC has agreed to acquire, together with us and two other institutional tax equity investors, Panhandle 2 from Pattern Development, subject to satisfaction of customary closing conditions, following its commencement of commercial operations. An affiliate of Morgan Stanley & Co. LLC is also party to a physical power hedge arrangement with Panhandle 2. For more information, see “Business—Construction Projects—Panhandle 2.” In addition, from time to time, certain of the underwriters and their affiliates may effect transactions for their own account or the account of customers, and hold, on behalf of themselves or their customers, long or short positions in our equity or debt securities or loans, and may do so in the future. In addition, certain affiliates of the Canadian underwriters act as agents and/or are lenders, as applicable, under our revolving credit facility. Accordingly, we may be considered a “connected issuer” (as defined in National Instrument 33-105—Underwriting Conflicts of the Canadian Securities Administrators) of BMO Nesbitt Burns Inc., Morgan Stanley Canada Limited, RBC Dominion Securities Inc. and Scotia Capital Inc. for the purposes of applicable Canadian securities laws. The decision to offer our Class A shares was made solely by us and Pattern Development, and the terms upon which the Class A shares are being offered were determined by negotiation between us, Pattern Development, and the underwriters. Our subsidiaries which are party to the revolving credit facility are currently in compliance with the facility, and no breach thereof has been waived since the execution of our revolving credit facility. Other than as disclosed in this prospectus, our financial position has not changed since the execution of our revolving credit facility. See “Management’s Discussion & Analysis of Financial Condition and Results of Operations—Description of Credit Agreements—Revolving Credit Facility” in our 2013 Form 10-K. As a result of this offering, each of the underwriters (or their respective U.S. or Canadian underwriter affiliate) will receive their share of the underwriting fee payable to the underwriters.
Subscriptions will be received subject to rejection or allotment in whole or in part and the right is reserved to close the subscription books at any time without notice. We expect that delivery of our Class A shares will be made against payment therefor on or about the date specified on the cover page of this prospectus.
Our offered Class A shares (other than any Class A shares issuable or to be sold on exercise of the overallotment option) are to be taken up by the underwriters, if at all, on or before a date not later than 42 days after the date of the receipt for the final Canadian short form prospectus or the date of a Canadian prospectus supplement for such offering, as applicable.
130
Table of Contents
The validity of the Class A shares being sold in this offering will be passed upon for us by Davis Polk & Wardwell LLP, New York, New York. Certain Canadian legal matters relating to this offering are being passed on for us by Blake, Cassels & Graydon LLP. Certain U.S. legal matters relating to this offering will be passed upon for the underwriters by Vinson & Elkins L.L.P., New York, New York. Certain Canadian legal matters relating to this offering will be passed upon for the underwriters by Torys LLP.
The consolidated financial statements of Pattern Energy Group Inc. appearing in Pattern Energy Group Inc.’s Annual Report (Form 10-K) as of December 31, 2013 and 2012 and for each of the three years in the period ended December 31, 2013 (including the schedule appearing therein) have been audited by Ernst & Young LLP, independent registered public accounting firm, as set forth in their report thereon, included therein, and incorporated herein by reference which, as to the year 2013, are based in part on the report of PricewaterhouseCoopers LLP, an independent registered public accounting firm. Such consolidated financial statements are incorporated herein by reference in reliance upon such report given on the authority of such firm as experts in accounting and auditing.
The consolidated financial statements of Panhandle Wind Holdings LLC and Panhandle B Member 2 LLC as of December 31, 2013 and for the fiscal year ended December 31, 2013, appearing in Pattern Energy Group Inc.’s Current Report on Form 8-K filed with the Securities and Exchange Commission on May 5, 2014, have been audited by Ernst &Young LLP, independent registered public accounting firm, as set forth in their reports thereon, included therein, and incorporated herein by reference. Such consolidated financial statements are incorporated herein by reference in reliance upon such reports given on the authority of such firm as experts in accounting and auditing.
PricewaterhouseCoopers LLP has audited the financial statements of South Kent Wind LP and Grand Renewable Wind LP and has confirmed that they are independent within the meaning of auditor independence rules of the Securities and Exchange Commission. Such financial statements are incorporated herein by reference in reliance upon such report given on the authority of such firm as experts in accounting and auditing.
131
Table of Contents
WHERE YOU CAN FIND MORE INFORMATION
We have filed with the SEC a registration statement on Form S-1 pursuant to the U.S. Securities Act covering our shares being offered hereby. This prospectus, which constitutes part of this registration statement, does not contain all the information set forth in this registration statement. For further information about us and our shares, we refer you to this registration statement and the exhibits and schedules filed as a part of this registration statement. Statements contained in this prospectus as to the contents of any contract or other document filed as an exhibit to this registration statement are not necessarily complete. If a contract or document has been filed as an exhibit to this registration statement, we refer you to the copy of the contract or document that has been filed.
You may inspect a copy of this registration statement and the exhibits and schedules to this registration statement without charge at the Public Reference Room of the SEC at 100 F Street, NE, Washington, DC 20549. You may obtain information on the operation of the Public Reference Room by calling the SEC at 1-800-SEC-0330. You can receive copies of these documents upon payment of a duplicating fee by writing to the SEC. The SEC maintains a web site at www.sec.gov that contains reports, proxy and information statements and other information regarding registrants that file electronically with the SEC. You can also inspect our registration statement on this web site. In addition, the Canadian Securities Administrators maintains the System for Electronic Document Analysis and Retrieval, or “SEDAR,” web site at www.sedar.com that contains reports, proxy and information statements and other information regarding reporting issuers under their relevant SEDAR profile. You can inspect the Canadian prospectus on this website.
For purposes of U.S. law, our filings with the SEC (other than those specifically incorporated by reference into the registration statement of which this prospectus forms a part) and the Canadian Securities Administrators are not incorporated by reference into this prospectus.
132
Table of Contents
15,479,876 Shares
Pattern Energy Group Inc.
Class A Common Stock
Prospectus
| BMO Capital Markets | Morgan Stanley | RBC Capital Markets |
| Scotiabank | BofA Merrill Lynch | Wells Fargo Securities | ||
| CIBC | KeyBanc Capital Markets |
Raymond James | ||
, 2014
Table of Contents
PART II
INFORMATION NOT REQUIRED IN PROSPECTUS
| Item 13. | Other Expenses of Issuance and Distribution.4 |
The actual and estimated expenses in connection with this offering, all of which will be borne by us, are as follows:
| SEC Registration Fee |
$ | 59,248.00 | ||
| FINRA Filing Fee |
$ | 69,500.00 | ||
| Printing and Engraving Expense |
$ | 55,000.00 | ||
| Legal Fees |
$ | 750,000.00 | ||
| Accounting Fees |
$ | 316,000.00 | ||
| Blue Sky Fees |
$ | — | ||
| Stock Exchange Listing Fees |
$ | 320,000.00 | ||
| Transfer Agent Fee |
$ | 2,000.00 | ||
| Miscellaneous |
$ | 35,000.00 | ||
|
|
|
|||
| Total |
$ | 1,606,748.00 | ||
|
|
|
| Item 14. | Indemnification of Directors and Officers |
Reference is made to Section 102(b)(7) of the DGCL, which enables a corporation in its original certificate of incorporation or an amendment thereto to eliminate or limit the personal liability of a director for violations of the director’s fiduciary duty, except (1) for any breach of the director’s duty of loyalty to the corporation or its shareholders, (2) for acts or omissions not in good faith or which involve intentional misconduct or a knowing violation of law, (3) pursuant to Section 174 of the DGCL, which provides for liability of directors for unlawful payments of dividends of unlawful stock purchase or redemptions or (4) for any transaction from which a director derived an improper personal benefit.
Reference is also made to Section 145 of the DGCL, which provides that a corporation may indemnify any person, including an officer or director, who is, or is threatened to be made, party to any threatened, pending or completed legal action, suit or proceeding, whether civil, criminal, administrative or investigative, other than an action by or in the right of such corporation, by reason of the fact that such person was an officer, director, employee or agent of such corporation or is or was serving at the request of such corporation as a director, officer, employee or agent of another corporation or enterprise. The indemnity may include expenses (including attorneys’ fees), judgments, fines and amounts paid in settlement actually and reasonably incurred by such person in connection with such action, suit or proceeding, provided such officer, director, employee or agent acted in good faith and in a manner he reasonably believed to be in, or not opposed to, our company’s best interest and, for criminal proceedings, had no reasonable cause to believe that his conduct was unlawful. A Delaware corporation may indemnify any officer or director in an action by or in the right of the corporation under the same conditions, except that no indemnification is permitted without judicial approval if the officer or director is adjudged to be liable to the corporation. Where an officer or director is successful on the merits or otherwise in the defense of any action referred to above, the corporation must indemnify him against the expenses that such officer or director actually and reasonably incurred. If a claim for indemnification or advancement of expenses is not paid in full in accordance with our amended and restated bylaws, the officer or director is entitled to file suit to recover the unpaid amount of such claim.
Our amended and restated certificate of incorporation filed as Exhibit 3.1 to this registration statement provides that our directors will not be personally liable to our company or its shareholders for monetary damages resulting from breach of their fiduciary duties. However, nothing contained in such provision will eliminate or
II-1
Table of Contents
limit the liability of directors (1) for any breach of the director’s duty of loyalty to us or our shareholders, (2) for acts or omissions not in good faith or which involve intentional misconduct or a knowing violation of the law, (3) under Section 174 of the DGCL or (4) for any transaction from which the director derived an improper personal benefit.
Our amended and restated bylaws provide for indemnification of the officers and directors to the full extent permitted by applicable law.
In addition, we entered into agreements to indemnify our directors and executive officers containing provisions which are in some respects broader than the specific indemnification provisions contained in the DGCL. The indemnification agreements may require us, among other things, to indemnify our directors against certain liabilities that may arise by reason of their status or service as directors and to advance their expenses incurred as a result of any proceeding against them as to which they could be indemnified. The form of such indemnification agreement is filed as Exhibit 10.4 to this registration statement.
The proposed form of Underwriting Agreement filed as Exhibit 1.1 to this registration statement provides for indemnification by the underwriters of the registrant and its officers and directors for certain liabilities arising under the U.S. Securities Act, or otherwise.
| Item 15. | Recent Sales of Unregistered Securities. |
On October 17, 2012, Pattern Energy issued 100 shares to Pattern Renewables LP, a subsidiary of Pattern Development, at a total issue price of US$1,000 in connection with our initial capitalization.
On October 2, 2013, Pattern Energy issued 16,000,000 shares of Class A common stock in an initial public offering generating net proceeds of approximately $317.0 million. Concurrent with the IPO, Pattern Energy issued 19,445,000 shares of Class A common stock and 15,555,000 shares of Class B common stock to Pattern Development and utilized approximately $232.6 million of the net proceeds of the IPO as a portion of the consideration to Pattern Development for certain entities and assets contributed to Pattern Energy (“Contribution Transactions”) consisting of interests in eight wind power projects, including six projects in operation (Gulf Wind, Hatchet Ridge, St. Joseph, Spring Valley, Santa Isabel and Ocotillo), and two projects under construction (El Arrayán and South Kent). In accordance with ASC 805-50-30-5, Transactions between Entities under Common Control, Pattern Energy recognized the assets and liabilities contributed by Pattern Development at their historical carrying amounts at the date of the Contribution Transactions. On October 8, 2013, Pattern Energy’s underwriters exercised in full their overallotment option to purchase 2,400,000 shares of Class A common stock from Pattern Development, the selling shareholder, pursuant to the overallotment option granted by Pattern Development. See “Structure and Formation of Our Company.”
II-2
Table of Contents
| Item 16. | Exhibits and Financial Statement Schedules. |
(A) Exhibits
| EXHIBIT NO. |
DESCRIPTION OF EXHIBIT | |
| 1.1 | Form of Underwriting Agreement | |
| 3.1 | Amended and Restated Certificate of Incorporation of Pattern Energy Group Inc. (Incorporated by reference to Exhibit 3.1 to the Registrant’s Registration Statement on Form S-1/A dated September 20, 2013 (Registration No. 333-190538)). | |
| 3.2 | Amended and Restated Bylaws of Pattern Energy Group Inc. (Incorporated by reference to Exhibit 3.2 to the Registrant’s Registration Statement on Form S-1/A dated September 3, 2013 (Registration No. 333-190538)). | |
| 4.1 | Form of Class A Stock Certificate (Incorporated by reference to Exhibit 3.2 to the Registrant’s Registration Statement on Form S-1/A dated September 3, 2013 (Registration No. 333-190538)). | |
| 5.1 | Form of Opinion of Davis Polk & Wardwell LLP | |
| 10.1 | Credit and Guaranty Agreement, among Pattern US Finance Company LLC, Pattern Canada Finance Company ULC, as borrowers, certain subsidiaries of the borrowers, the lenders party thereto from time to time, Royal Bank of Canada, as Administrative Agent and Collateral Agent, Bank of Montreal, as Syndication Agent, and Morgan Stanley Bank, N.A., as Documentation Agent, dated as of November 15, 2012. (Incorporated by reference to Exhibit 10.1 to the Registrant’s Registration Statement on Form S-1/A dated September 3, 2013 (Registration No. 333-190538)). | |
| 10.2 | Pattern Energy Group Inc. 2013 Equity Incentive Award Plan (Incorporated by reference to Exhibit 10.2 to the Registrant’s Registration Statement on Form S-1/A dated September 3, 2013 (Registration No. 333-190538)). | |
| 10.3 | Form of Pattern Energy Group Inc. 2013 Incentive Bonus Plan. (Incorporated by reference to Exhibit 10.3 to the Registrant’s Registration Statement on Form S-1/A dated September 3, 2013 (Registration No. 333-190538)). | |
| 10.4 | Form of Stock Option Agreement under 2013 Equity Incentive Award Plan. (Incorporated by reference to Exhibit 10.4 to the Registrant’s Registration Statement on Form S-1/A dated September 3, 2013 (Registration No. 333-190538)). | |
| 10.5 | Form of Restricted Stock Agreement under 2013 Equity Incentive Award Plan. (Incorporated by reference to Exhibit 10.5 to the Registrant’s Registration Statement on Form S-1/A dated September 20, 2013 (Registration No. 333-190538)). | |
| 10.6 | Form of Restricted Stock Unit Agreement under 2013 Equity Incentive Award Plan. (Incorporated by reference to Exhibit 10.6 to the Registrant’s Registration Statement on Form S-1/A dated September 3, 2013 (Registration No. 333-190538)). | |
| 10.7 | Form of Indemnification Agreement between the Registrant and each of its Executive Officers and Directors. (Incorporated by reference to Exhibit 10.7 to the Registrant’s Registration Statement on Form S-1/A dated September 3, 2013 (Registration No. 333-190538)). | |
| 10.8 | Registration Rights Agreement between the Company and Pattern Energy Group LP, dated as of October 2, 2013. (Incorporated by reference to Exhibit 10.1 to the Registrant’s Current Report on Form 8-K dated September 26, 2013). | |
| 10.9 | Contribution Agreement among the Company, Pattern Renewables LP, Pattern Energy Group LP, and Pattern Renewable Holdings Canada ULC, dated as of October 2, 2013. (Incorporated by reference to Exhibit 10.2 to the Registrant’s Current Report on Form 8-K dated September 26, 2013). | |
II-3
Table of Contents
| EXHIBIT NO. |
DESCRIPTION OF EXHIBIT | |
| 10.10 | Purchase Rights Agreement among the Company, Pattern Energy Group LP, Pattern Energy Group Holdings LP and Pattern Energy GP LLC, dated as of October 2, 2013. (Incorporated by reference to Exhibit 10.3 to the Registrant’s Current Report on Form 8-K dated September 26, 2013). | |
| 10.11 | Bilateral Management Services Agreement between the Company and Pattern Energy Group LP, dated as of October 2, 2013. (Incorporated by reference to Exhibit 10.4 to the Registrant’s Current Report on Form 8-K dated September 26, 2013). | |
| 10.12 | Non-Competition Agreement between the Company and Pattern Energy Group LP, dated October 2, 2013. (Incorporated by reference to Exhibit 10.5 to the Registrant’s Current Report on Form 8-K dated September 26, 2013). | |
| 10.13 | Shareholder Approval Rights Agreement between the Company and Pattern Energy Group LP, dated as of October 2, 2013. (Incorporated by reference to Exhibit 10.6 to the Registrant’s Current Report on Form 8-K dated September 26, 2013). | |
| 10.14 | Employment Agreement between Pattern Energy Group Inc. and Michael M. Garland dated October 2, 2013 (Incorporated by reference to Exhibit 10.19 to the Registrant’s Annual Report on Form 10-K dated February 28, 2014). | |
| 10.15 | Employment Agreement between Pattern Energy Group Inc. and Hunter H. Armistead dated October 2, 2013 (Incorporated by reference to Exhibit 10.20 to the Registrant’s Annual Report on Form 10-K dated February 28, 2014) | |
| 10.16** | Employment Agreement between Pattern Energy Group Inc. and Esben Pedersen dated October 2, 2013 | |
| 10.17 | Purchase and Sale Agreement, dated as of December 20, 2013, by and between Pattern Canada Operations Holdings ULC and Pattern Energy Group LP (Grand PSA) . (Incorporated by reference to Exhibit 2.1 to the Registrant’s Current Report on Form 8-K dated December 20, 2013). | |
| 10.18 | Purchase and Sale Agreement, dated as of December 20, 2013, by and among Pattern Energy Group Inc., Panhandle B Holdco 2 LLC and Pattern Energy Group LP (PH2 PSA) ((Incorporated by reference to Exhibit 2.2 to the Registrant’s Current Report on Form 8-K dated December 20, 2013). | |
| 10.19 | Management, Operation and Maintenance Agreement, dated as of December 20, 2013, by and between Pattern Panhandle Wind 2 LLC and Pattern Operators LP (PH2 MOMA) (Incorporated by reference to Exhibit 2.3 to the Registrant’s Current Report on Form 8-K dated December 20, 2013). | |
| 10.20 | Project Administration Agreement, dated as of December 20, 2013, by and between Pattern Panhandle Wind 2 LLC and Pattern Operators LP (PH2 PAA) (Incorporated by reference to Exhibit 2.4 to the Registrant’s Current Report on Form 8-K dated December 20, 2013). | |
| 10.21** | Amendment Agreement among Pattern US Finance Company LLC, Pattern Canada Finance Company ULC, as borrowers, and Royal Bank of Canada, as Administrative Agent, dated October 2, 2013. | |
| 10.22** | Amendment No. 2 to Credit and Guaranty Agreement and Waiver Agreement among Pattern US Finance Company LLC, Pattern Canada Finance Company ULC, as borrowers, the lenders party thereto from time to time, and Royal Bank of Canada, as Administrative Agent, dated as of March 10, 2014. | |
II-4
Table of Contents
| EXHIBIT NO. |
DESCRIPTION OF EXHIBIT | |
| 21.1** | List of Subsidiaries | |
| 23.1 | Consent of Davis Polk & Wardwell LLP (included in Exhibit 5.1) | |
| 23.2 | Consent of Ernst & Young LLP | |
| 23.3 | Consent of PricewaterhouseCoopers LLP | |
| 24.1** | Powers of Attorney (included in the signature pages to this registration statement) | |
| ** | Previously filed. |
(B) Financial Statement Schedules
Schedule II—Valuation and Qualifying Accounts
Certain information required in Schedule II, Valuation and Qualifying Accounts, has been omitted because equivalent information has been included in the financial statements included in this registration statement.
Other financial statement schedules have been omitted because they either are not required, are immaterial or are not applicable.
| Item 17. | Undertakings |
The undersigned registrant hereby undertakes to provide to the underwriters at the closing specified in the underwriting agreement certificates in such denominations and registered in such names as required by the underwriters to permit prompt delivery to each purchaser.
Insofar as indemnification for liabilities arising under the U.S. Securities Act may be permitted to our directors, officers, and controlling persons pursuant to the foregoing provisions, or otherwise, we have been advised that in the opinion of the SEC such indemnification is against public policy as expressed in the U.S. Securities Act and is, therefore, unenforceable. In the event that a claim for indemnification against such liabilities (other than the payment by us of expenses incurred or paid by a director, officer, or controlling person of us in the successful defense of any action, suit, or proceeding) is asserted by such director, officer, or controlling person in connection with the securities being registered, we will, unless in the opinion of counsel the matter has been settled by controlling precedent, submit to a court of appropriate jurisdiction the question whether such indemnification by us is against public policy as expressed in the U.S. Securities Act and will be governed by the final adjudication of such issue.
We hereby undertake that:
| (1) | for purposes of determining any liability under the U.S. Securities Act, the information omitted from the form of prospectus filed as part of this registration statement in reliance upon Rule 430A and contained in a form of prospectus filed by the registrant pursuant to Rule 424(b)(1) or (4) or 497(h) under the U.S. Securities Act shall be deemed to be part of this registration statement as of the time it was declared effective; |
| (2) | for purposes of determining any liability under the U.S. Securities Act, each post-effective amendment that contains a form of prospectus shall be deemed to be a new registration statement relating to the securities offered therein, and the offering of such securities at that time shall be deemed to be the initial bona fide offering thereof; and |
II-5
Table of Contents
| (3) | for the purpose of determining liability of the registrant under the Securities Act to any purchaser in the initial distribution of the securities: |
| (i) | that in a primary offering of securities of the undersigned registrant pursuant to this registration statement, regardless of the underwriting method used to sell the securities to the purchaser, if the securities are offered or sold to such purchaser by means of any of the following communications, the undersigned registrant will be a seller to the purchaser and will be considered to offer or sell such securities to such purchaser: |
| (A) | any preliminary prospectus or prospectus of the undersigned registrant relating to the offering required to be filed pursuant to Rule 424, |
| (B) | any free writing prospectus relating to the offering prepared by or on behalf of the undersigned registrant or used or referred to by the undersigned registrant, |
| (C) | the portion of any other free writing prospectus relating to the offering containing material information about the undersigned registrant or its securities provided by or on behalf of the undersigned registrant, and |
| (D) | any other communication that is an offer in the offering made by the undersigned registrant to the purchaser. |
6
Table of Contents
SIGNATURES
Pursuant to the requirements of the Securities Act of 1933 as amended, the registrant has duly caused this registration statement to be signed on its behalf by the undersigned, thereunto duly authorized, in the city of San Francisco, State of California, on May 5, 2014.
| PATTERN ENERGY GROUP INC. | ||
| By: |
/s/ Michael M. Garland | |
| Name: Michael M. Garland | ||
| Title: Director, President and Chief Executive Officer | ||
Pursuant to the requirements of the Securities Act of 1933 as amended, this registration statement has been signed by the following persons in the capacities indicated.
| Signature |
Title | |
| * Michael M. Garland |
Director, President and Chief Executive Officer (Principal Executive Officer) | |
| /s/ Michael J. Lyon Michael J. Lyon |
Chief Financial Officer (Principal Financial Officer) | |
| * Eric S. Lillybeck |
Senior Vice President, Fiscal and Administrative Services (Principal Accounting Officer) | |
| * Alan R. Batkin |
Director | |
| * Patricia S. Bellinger |
Director | |
| * The Lord Browne of Madingley |
Director | |
| * Douglas G. Hall |
Director | |
| * Michael B. Hoffman |
Director | |
| * Patricia M. Newson |
Director | |
*
| By: |
/s/ Michael J. Lyon | |
| Name: Michael J. Lyon | ||
| Title: Attorney-in-Fact |
Table of Contents
EXHIBIT INDEX
| EXHIBIT NO. |
DESCRIPTION OF EXHIBIT | |
| 1.1 | Form of Underwriting Agreement | |
| 3.1 | Amended and Restated Certificate of Incorporation of Pattern Energy Group Inc. (Incorporated by reference to Exhibit 3.1 to the Registrant’s Registration Statement on Form S-1/A dated September 20, 2013 (Registration No. 333-190538)) | |
| 3.2 | Amended and Restated Bylaws of Pattern Energy Group Inc. (Incorporated by reference to Exhibit 3.2 to the Registrant’s Registration Statement on Form S-1/A dated September 3, 2013 (Registration No. 333-190538)) | |
| 4.1 | Form of Class A Stock Certificate (Incorporated by reference to Exhibit 3.2 to the Registrant’s Registration Statement on Form S-1/A dated September 3, 2013 (Registration No. 333-190538)) | |
| 5.1 | Form of Opinion of Davis Polk & Wardwell LLP | |
| 10.1 | Credit and Guaranty Agreement, among Pattern US Finance Company LLC, Pattern Canada Finance Company ULC, as borrowers, certain subsidiaries of the borrowers, the lenders party thereto from time to time, Royal Bank of Canada, as Administrative Agent and Collateral Agent, Bank of Montreal, as Syndication Agent, and Morgan Stanley Bank, N.A., as Documentation Agent, dated as of November 15, 2012. (Incorporated by reference to Exhibit 10.1 to the Registrant’s Registration Statement on Form S-1/A dated September 3, 2013 (Registration No. 333-190538)). | |
| 10.2 | Pattern Energy Group Inc. 2013 Equity Incentive Award Plan (Incorporated by reference to Exhibit 10.2 to the Registrant’s Registration Statement on Form S-1/A dated September 3, 2013 (Registration No. 333-190538)) | |
| 10.3 | Form of Pattern Energy Group Inc. 2013 Incentive Bonus Plan. (Incorporated by reference to Exhibit 10.3 to the Registrant’s Registration Statement on Form S-1/A dated September 3, 2013 (Registration No. 333-190538)). | |
| 10.4 | Form of Stock Option Agreement under 2013 Equity Incentive Award Plan. (Incorporated by reference to Exhibit 10.4 to the Registrant’s Registration Statement on Form S-1/A dated September 3, 2013 (Registration No. 333-190538)). | |
| 10.5 | Form of Restricted Stock Agreement under 2013 Equity Incentive Award Plan. (Incorporated by reference to Exhibit 10.5 to the Registrant’s Registration Statement on Form S-1/A dated September 20, 2013 (Registration No. 333-190538)). | |
| 10.6 | Form of Restricted Stock Unit Agreement under 2013 Equity Incentive Award Plan. (Incorporated by reference to Exhibit 10.6 to the Registrant’s Registration Statement on Form S-1/A dated September 3, 2013 (Registration No. 333-190538)). | |
| 10.7 | Form of Indemnification Agreement between the Registrant and each of its Executive Officers and Directors. (Incorporated by reference to Exhibit 10.7 to the Registrant’s Registration Statement on Form S-1/A dated September 3, 2013 (Registration No. 333-190538)). | |
| 10.8 | Registration Rights Agreement between the Company and Pattern Energy Group LP, dated as of October 2, 2013. (Incorporated by reference to Exhibit 10.1 to the Registrant’s Current Report on Form 8-K dated September 26, 2013 (Registration No. 333-190538)). | |
| 10.9 | Contribution Agreement among the Company, Pattern Renewables LP, Pattern Energy Group LP, and Pattern Renewable Holdings Canada ULC, dated as of October 2, 2013. (Incorporated by reference to Exhibit 10.2 to the Registrant’s Current Report on Form 8-K dated September 26, 2013 (Registration No. 333-190538)). | |
Table of Contents
| EXHIBIT NO. |
DESCRIPTION OF EXHIBIT | |
| 10.10 | Purchase Rights Agreement among the Company, Pattern Energy Group LP, Pattern Energy Group Holdings LP and Pattern Energy GP LLC, dated as of October 2, 2013. (Incorporated by reference to Exhibit 10.3 to the Registrant’s Current Report on Form 8-K dated September 26, 2013 (Registration No. 333-190538)). | |
| 10.11 | Bilateral Management Services Agreement between the Company and Pattern Energy Group LP, dated as of October 2, 2013. (Incorporated by reference to Exhibit 10.4 to the Registrant’s Current Report on Form 8-K dated September 26, 2013 (Registration No. 333-190538)). | |
| 10.12 | Non-Competition Agreement between the Company and Pattern Energy Group LP, dated October 2, 2013. (Incorporated by reference to Exhibit 10.5 to the Registrant’s Current Report on Form 8-K dated September 26, 2013 (Registration No. 333-190538)). | |
| 10.13 | Shareholder Approval Rights Agreement between the Company and Pattern Energy Group LP, dated as of October 2, 2013. (Incorporated by reference to Exhibit 10.6 to the Registrant’s Current Report on Form 8-K dated September 26, 2013 (Registration No. 333-190538)). | |
| 10.14 | Employment Agreement between Pattern Energy Group Inc. and Michael M. Garland dated October 2, 2013 (Incorporated by reference to Exhibit 10.19 to the Registrant’s Annual Report on Form 10-K dated February 28, 2014 (Registration No. 333-190538)). | |
| 10.15 | Employment Agreement between Pattern Energy Group Inc. and Hunter H. Armistead dated October 2, 2013 (Incorporated by reference to Exhibit 10.20 to the Registrant’s Annual Report on Form 10-K dated February 28, 2014 (Registration No. 333-190538)) | |
| 10.16** | Employment Agreement between Pattern Energy Group Inc. and Esben Pedersen dated October 2, 2013. | |
| 10.17 | Purchase and Sale Agreement, dated as of December 20, 2013, by and between Pattern Canada Operations Holdings ULC and Pattern Energy Group LP (Grand PSA) . (Incorporated by reference to Exhibit 2.1 to the Registrant’s Current Report on Form 8-K dated December 20, 2013). | |
| 10.18 | Purchase and Sale Agreement, dated as of December 20, 2013, by and among Pattern Energy Group Inc., Panhandle B Holdco 2 LLC and Pattern Energy Group LP (PH2 PSA) ((Incorporated by reference to Exhibit 2.2 to the Registrant’s Current Report on Form 8-K dated December 20, 2013). | |
| 10.19 | Management, Operation and Maintenance Agreement, dated as of December 20, 2013, by and between Pattern Panhandle Wind 2 LLC and Pattern Operators LP (PH2 MOMA) (Incorporated by reference to Exhibit 2.3 to the Registrant’s Current Report on Form 8-K dated December 20, 2013). | |
| 10.20 | Project Administration Agreement, dated as of December 20, 2013, by and between Pattern Panhandle Wind 2 LLC and Pattern Operators LP (PH2 PAA) (Incorporated by reference to Exhibit 2.4 to the Registrant’s Current Report on Form 8-K dated December 20, 2013). | |
| 10.21** | Amendment Agreement among Pattern US Finance Company LLC, Pattern Canada Finance Company ULC, as borrowers, and Royal Bank of Canada, as Administrative Agent, dated October 2, 2013. | |
| 10.22** | Amendment No. 2 to Credit and Guaranty Agreement and Waiver Agreement among Pattern US Finance Company LLC, Pattern Canada Finance Company ULC, as borrowers, the lenders party thereto from time to time, and Royal Bank of Canada, as Administrative Agent, dated as of March 10, 2014. | |
| 21.1** | List of Subsidiaries | |
| 23.1 | Consent of Davis Polk & Wardwell LLP (included in Exhibit 5.1) | |
| 23.2 | Consent of Ernst & Young LLP | |
| 23.3 | Consent of PricewaterhouseCoopers LLP | |
Table of Contents
| EXHIBIT NO. |
DESCRIPTION OF EXHIBIT | |
| 24.1** | Powers of Attorney (included in the signature pages to this registration statement) | |
| ** | Previously filed. |