Attached files
| file | filename |
|---|---|
| 8-K - FORM 8-K - ALLIANCE DATA SYSTEMS CORP | form_8k.htm |

©2013ADS Alliance Data Systems, Inc. Confidential and Proprietary NYSE: ADS | 2nd Quarter 2014 * Second Quarter 2014 Investor Presentation Alliance Data Company Overview NYSE: ADS Exhibit 99.1

©2013ADS Alliance Data Systems, Inc. Confidential and Proprietary NYSE: ADS | 2nd Quarter 2014 * $400 Billion Opportunity Opportunity: $400 Billion in North American marketing spend expected by 2016 Over half has shifted to data-enabled, multi-channel direct marketing Alliance Data: The largest and most comprehensive provider of transaction-based marketing and loyalty solutions Three businesses → same focus Private Label Non-discretionary Discretionary Analytics/Segmentation Distribution TXN. DATA DEMO/ PSYCH. DATA POS Direct Mail Email Mobile Social Display

©2013ADS Alliance Data Systems, Inc. Confidential and Proprietary NYSE: ADS | 2nd Quarter 2014 * Historical Performance → Great Recession → Recovery → 6 Yr. CAGR Revenues +14% Adj. EBITDA, net +13% Core earnings +13% Core EPS +17% Doubled the size of the company over a six-year period, including Great Recession Grew both revenue & core EPS during Great Recession Pre-Recession Peak 2007 End 2013
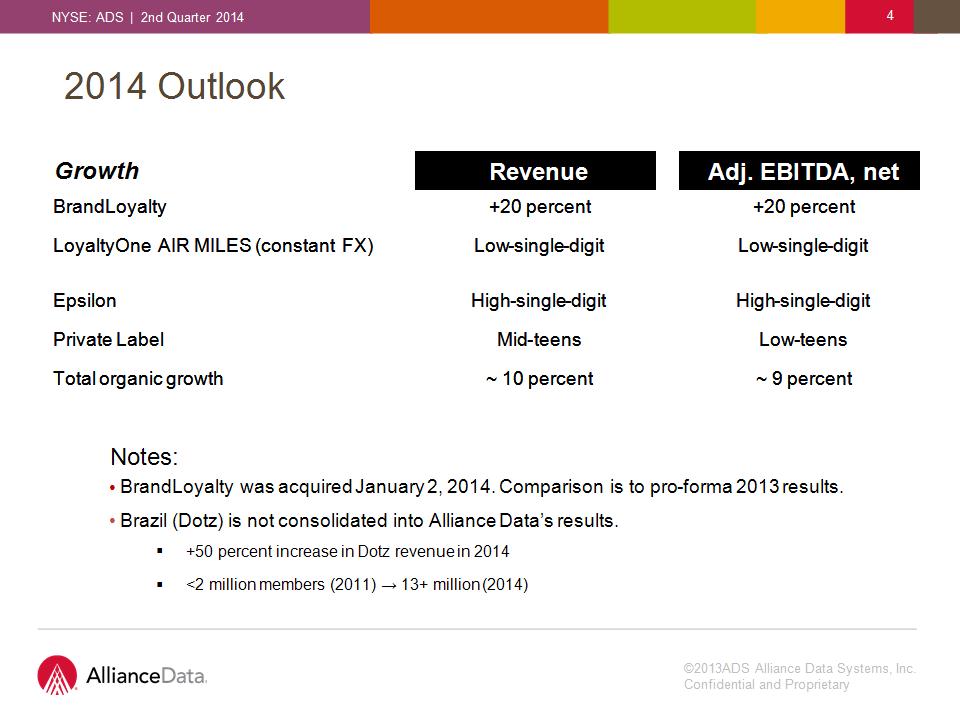
©2013ADS Alliance Data Systems, Inc. Confidential and Proprietary NYSE: ADS | 2nd Quarter 2014 * 2014 Outlook Notes: BrandLoyalty was acquired January 2, 2014. Comparison is to pro-forma 2013 results. Brazil (Dotz) is not consolidated into Alliance Data’s results. +50 percent increase in Dotz revenue in 2014 <2 million members (2011) → 13+ million (2014) Growth Revenue Adj. EBITDA, net BrandLoyalty +20 percent +20 percent LoyaltyOne AIR MILES (constant FX) Low-single-digit Low-single-digit Epsilon High-single-digit High-single-digit Private Label Mid-teens Low-teens Total organic growth ~ 10 percent ~ 9 percent

©2013ADS Alliance Data Systems, Inc. Confidential and Proprietary NYSE: ADS | 2nd Quarter 2014 * * 1st quarter average Weak Canadian dollar is a headwind – expected FX rates of $0.91 vs. $0.97 last year drag of $55 million to revenue and 17 cents to core EPS Revenue guidance increased $110 million due to stronger expected performances at BrandLoyalty, Epsilon and Private Label. Core EPS guidance increased by $0.05. 2012 2012 2013 2013 2014 2014 Avg. Share Price $130 $192 $270* $270* Revenue $3,641 +15% $4,319 +19% $5,250 +22% Core Earnings $559 +27% $669 +20% $766 +14% Diluted Shares 64.1 66.9 62.5 Core EPS $8.71 +14% $10.01 +15% $12.25 +22% ADS 2014 Guidance ($MM, exception per share)

©2013ADS Alliance Data Systems, Inc. Confidential and Proprietary NYSE: ADS | 2nd Quarter 2014 * Safe Harbor Statement and Forward-Looking Statements This presentation may contain forward-looking statements within the meaning of Section 27A of the Securities Act of 1933, as amended, and Section 21E of the Securities Exchange Act of 1934, as amended. Such statements may use words such as “anticipate,” “believe,” “continue,” “could,” “estimate,” “expect,” “intend,” “predict,” “project,” “would” and similar expressions as they relate to us or our management. When we make forward-looking statements, we are basing them on our management’s beliefs and assumptions, using information currently available to us. Although we believe that the expectations reflected in the forward-looking statements are reasonable, these forward-looking statements are subject to risks, uncertainties and assumptions, including those discussed in our filings with the Securities and Exchange Commission. If one or more of these or other risks or uncertainties materialize, or if our underlying assumptions prove to be incorrect, actual results may vary materially from what we projected. Any forward-looking statements contained in this presentation reflect our current views with respect to future events and are subject to these and other risks, uncertainties and assumptions relating to our operations, results of operations, growth strategy and liquidity. We have no intention, and disclaim any obligation, to update or revise any forward-looking statements, whether as a result of new information, future results or otherwise, except as required by law. “Safe Harbor” Statement under the Private Securities Litigation Reform Act of 1995: Statements in this presentation regarding Alliance Data Systems Corporation’s business which are not historical facts are “forward-looking statements” that involve risks and uncertainties. For a discussion of such risks and uncertainties, which could cause actual results to differ from those contained in the forward-looking statements, see “Risk Factors” in the Company’s Annual Report on Form 10-K for the most recently ended fiscal year. Risk factors may be updated in Item 1A in each of the Company’s Quarterly Reports on Form 10-Q for each quarterly period subsequent to the Company’s most recent Form 10-K.

©2013ADS Alliance Data Systems, Inc. Confidential and Proprietary NYSE: ADS | 2nd Quarter 2014 * Financial Measures In addition to the results presented in accordance with generally accepted accounting principles, or GAAP, the Company presents financial measures that are non-GAAP measures, such as constant currency financial measures, adjusted EBITDA, adjusted EBITDA margin, adjusted EBITDA net of funding costs and non-controlling interest, core earnings and core earnings per diluted share (core EPS). The Company believes that these non-GAAP financial measures, viewed in addition to and not in lieu of the Company’s reported GAAP results, provide useful information to investors regarding the Company’s performance and overall results of operations. These metrics are an integral part of the Company’s internal reporting to measure the performance of reportable segments and the overall effectiveness of senior management. Reconciliations to comparable GAAP financial measures are available on the Company’s website. The financial measures presented are consistent with the Company’s historical financial reporting practices. Core earnings and core earnings per diluted share represent performance measures and are not intended to represent liquidity measures. The non-GAAP financial measures presented herein may not be comparable to similarly titled measures presented by other companies, and are not identical to corresponding measures used in other various agreements or public filings.