Attached files
| file | filename |
|---|---|
| 8-K - FORM 8-K - PUBLIC SERVICE ELECTRIC & GAS CO | d720369d8k.htm |
| EX-99.1 - EX-99.1 - PUBLIC SERVICE ELECTRIC & GAS CO | d720369dex991.htm |
Exhibit 99

|
Investor News | NYSE: PEG | ||
| For further information, contact: | ||||
| Ø Kathleen A. Lally, Vice President – Investor Relations |
Phone: 973-430-6565 | |||
| Ø Carlotta Chan, Manager - Investor Relations |
Phone: 973-430-6596 | |||
May 1, 2014
PSEG ANNOUNCES 2014 FIRST QUARTER RESULTS
$0.76 PER SHARE OF NET INCOME
$1.01 PER SHARE OF OPERATING EARNINGS
Company Maintains 2014 Operating Earnings Guidance of $2.55 - $2.75 Per Share
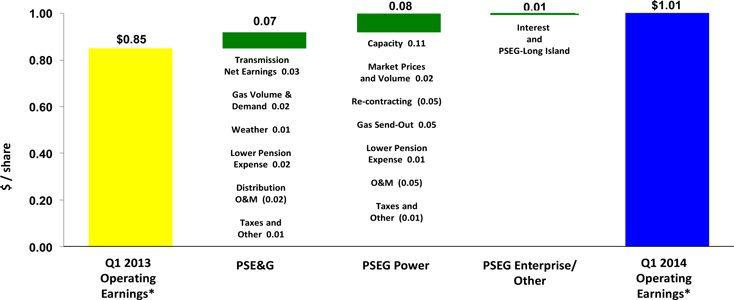
Public Service Enterprise Group (PSEG) reported today Net Income for the first quarter of 2014 of $386 million, or $0.76 per share as compared to Net Income of $320 million, or $0.63 per share, in the first quarter of 2013. Operating Earnings for the first quarter of 2014 were $515 million, or $1.01 per share, compared to Operating Earnings for the first quarter of 2013 of $433 million, or $0.85 per share.
“I’m extremely pleased with PSEG’s results for the first quarter” said Ralph Izzo, chairman, president and chief executive officer. He went on to say “our strong earnings demonstrated the ability of our business model to perform for our customers and shareholders. The diversity of PSEG Power’s fuel mix and dispatch flexibility supported the needs of customers and allowed Power to capture margin during the extreme weather conditions experienced this winter. Power is enhancing its position in the market through economic investments in capacity uprates; and, the increased capital investment in our stable, regulated business continues to drive earnings growth and improvement in reliability at PSE&G as it also transforms the profile of our company. This year, operating earnings from PSE&G are expected to represent over 50% of forecast operating earnings as we expand our investment in critical infrastructure projects.”
PSEG believes that the non-GAAP financial measure of “Operating Earnings” provides a consistent and comparable measure of performance of its businesses to help shareholders understand performance trends. Operating Earnings excludes gains or losses associated with Nuclear Decommissioning Trust (NDT), Mark-to-Market (MTM) accounting, and other material one-time items. The table below provides a reconciliation of PSEG’s Net Income to Operating Earnings (a non-GAAP measure) for the first quarter. See Attachment 10 for a complete list of items excluded from Net Income in the determination of Operating Earnings.
PSEG CONSOLIDATED EARNINGS (unaudited)
First Quarter Comparative Results
2014 and 2013
| Income | Diluted Earnings | |||||||||||||||
| ($millions) | Per Share | |||||||||||||||
| 2014 | 2013 | 2014 | 2013 | |||||||||||||
| Operating Earnings |
$ | 515 | $ | 433 | $ | 1.01 | $ | 0.85 | ||||||||
| Reconciling Items |
(129 | ) | (113 | ) | (0.25 | ) | (0.22 | ) | ||||||||
|
|
|
|
|
|
|
|
|
|||||||||
| Net Income |
$ | 386 | $ | 320 | $ | 0.76 | $ | 0.63 | ||||||||
|
|
|
|
|
|
|
|
|
|||||||||
| Avg. Shares | 508M | 507M | ||||||||||||||
“Our employees’ commitment to our strategic focus — operational excellence, financial strength and disciplined investment —provided our customers with safe, reliable power during the extreme weather conditions experienced in the first quarter, and allowed us to achieve our financial goals. PSE&G remains on course to achieve double-digit growth in earnings, as the flexibility of our merchant generation business continues to provide earnings and cash flow to finance our investment program. We had strong results in the first quarter. We are maintaining our forecast of operating earnings for the full year of $2.55 - $2.75 per share given the importance of normal weather to our third quarter and full year results.”
The following table outlines expectations for operating earnings in 2014 by subsidiary:
2014 Operating Earnings Guidance
($ millions, except EPS)
| 2014E | ||
| PSE&G |
$705 - $745 | |
| PSEG Power |
$550 - $610 | |
| PSEG Enterprise/Other |
$35 - $40 | |
| PSEG Operating Earnings |
$1,290 - $1,395 | |
| Earnings Per Share |
$2.55 - $2.75 | |
Operating Earnings Review by Subsidiary
See Attachment 5 for detail regarding the quarter-over-quarter reconciliations for each of PSEG’s businesses.
PSE&G
PSE&G reported operating earnings of $214 million ($0.42 per share) for the first quarter of 2014 compared with operating earnings of $179 million ($0.35 per share) for the first quarter of 2013.
PSE&G’s earnings for the first quarter reflect the benefit of an increase in revenue associated with an expansion of its capital investment program, an improvement in demand and a reduction in pension expense.
The Federal Energy Regulatory Commission (FERC) approved an annual increase in transmission revenue of $171 million under the company’s formula rate filing. The increase in revenue was effective on January 1, 2014. PSE&G’s expanded investment in transmission added $0.03 per share to earnings in the quarter. The winter weather, which was significantly colder than normal and colder than a year ago, influenced electric and gas demand. The impact of the colder than normal weather on electric demand added $0.01 per share to quarter-over-quarter earnings. In addition, electric weather-normalized sales experienced a slight improvement in demand as weather normalized gas deliveries continue to grow. The impact of weather on gas demand was recaptured in the weather normalization clause and didn’t impact earnings comparisons. However, the weather-normalized improvement in gas demand and volume added $0.02 per share to quarter-over-quarter earnings. Earnings also improved
by $0.01 per share in the quarter due to a reduction in the effective tax rate and other items. A decline in PSE&G’s pension expense was fully offset by an increase in operating and maintenance expense associated with weather-related repair costs.
Economic conditions in the service area are exhibiting slow but steady signs of improvement led by the housing market. On a weather-normalized basis, electric sales are estimated to have improved by 1.3% in the quarter. The improvement in electric sales was led by 2.9% growth in sales to commercial customers which may be greater than the underlying economic conditions would indicate given Sandy related adjustments to billings in the year-ago quarter. Weather normalized electric sales to residential customers are estimated to have increased by a more modest 0.6% in the first quarter. Gas deliveries continue to benefit from sustained low commodity prices and slowly recovering economic conditions. On a weather-normalized basis, gas deliveries are estimated to have increased by 3.4% in the quarter.
PSE&G’s capital program remains on schedule. PSE&G is expected to invest $2.2 billion in electric and gas infrastructure upgrades to its transmission and distribution facilities during 2014 to maintain reliability. A portion of the 500-kV Susquehanna – Roseland line was energized from the new Hopatcong switching station to Roseland earlier this year. The line is expected to be fully in-service to meet the summer peak electricity demand next year. The 230-kV North Central Reliability line and the 230-kV Burlington-Camden line are expected to be placed into service this summer.
The forecast of PSE&G’s operating earnings for 2014 remains unchanged at $705 million - $745 million. Operating earnings will be influenced by an increase in transmission revenue, an increase in the level of capital invested in solar and a reduction in pension related expenses.
PSEG Power
PSEG Power reported operating earnings of $293 million ($0.58 per share) for the first quarter of 2014 compared with operating earnings of $254 million ($0.50 per share) for the first quarter of 2013.
PSEG Power’s operating earnings in the first quarter benefited from higher capacity revenues, dispatch flexibility and the diverse fuel mix of the fleet. When combined with a strategy to maintain a net long position this allowed the fleet to benefit from an improvement in market prices and reduced the risk associated with higher costs to serve the increase in demand. Power’s firm gas transmission contracts also benefited from higher pricing and demand.
An increase in average PJM capacity prices to $242/MW-day from $153/MW-day improved quarter-over-quarter earnings by $0.11 per share. The improvement in capacity revenues more than offset lower realized prices on energy hedges which reduced quarterly earnings comparisons by $0.05 per share. Pricing on Power’s net long position was favorably influenced by the extreme cold weather conditions experienced in the quarter. Higher market prices, and an increase in output in response to an improvement in demand more than offset the cost associated with the need to meet increased demands under the full-requirements BGS contract resulting in a net improvement of $0.02 per share to Power’s quarter-over-quarter earnings. Higher prices and send-out under the BGSS contract in response to the extreme cold weather added $0.05 per share to quarter-over-quarter earnings.
Operation and maintenance expense was higher than last year. Outage related work at the fossil stations and acceleration into the first quarter of advanced gas path improvements at the Linden generation station more than offset a reduction in pension expense and reduced quarter-over-quarter earnings comparisons by $0.04 per share. Other miscellaneous items reduced earnings by $0.01 per share.
Power has discovered that it incorrectly calculated certain components of its cost-based bids for certain generating units in the PJM energy market, with resulting over-collection of revenues related to its fossil fleet. Power has notified FERC, PJM and the PJM Independent Market Monitor on this issue. This issue is still under review, and we are unable to estimate the ultimate impact or predict any resulting penalties or other costs associated with the matter at this time. The company recognized a liability in the quarter related to this matter.
The extreme market conditions experienced during the first quarter improved economic dispatch and highlighted the benefits of the fleet’s dispatch flexibility and diverse fuel mix. The nuclear fleet operated at an average capacity factor of 100% producing 8 TWh of output, 55% of generation, in line with year-ago levels. Production from the combined cycle gas fleet (CCGT) was affected by lower gas availability at the Bethlehem, NY facility, and a decision to extend an outage at the Linden plant to complete the capacity uprate work. The CCGTs accounted for 23% of the fleet’s output in the quarter, or 3.4 TWh of generation. Output from the coal stations as well as the steam and peaking units increased in response to an improvement in demand, providing 3.1 TWh, or, 22% of generation.
Power has increased its forecast of output for the full year to 56 – 58 TWh from 53 – 55 TWh. The revised forecast reflects the increase in output during the first quarter and an improvement in the economic dispatch of the fleet and assumes only normal weather for the remainder of the year. Approximately 70% - 75% of anticipated production for the period April – December 2014 is hedged at an average price of $49 per MWh. Power has also increased its forecast of economic generation in 2015 and 2016 to 54 – 56 TWh from 53 – 55 TWh. For 2015, Power has hedged 50% - 55% of its forecast generation at an average price of $51 per MWh; for 2016, Power has hedged 25% - 30% of its forecast generation at an average price of $51 per MWh. The hedge data for 2014 and 2015 continues to assume BGS volumes represent 11 TWh in 2014 and 10 TWh in 2015.
Power’s operating earnings for 2014 are forecast at $550 - $610 million. Results for the remainder of the year will be influenced by a decline in the average price received on our PJM capacity to $166/MW-day on June 1, 2014 from the historically high level of $242/MW-day and a decline in the average price of energy hedges. O&M is expected to compare favorably given a reduction in pension expense and the absence of major outage-related work.
PSEG Enterprise/Other
PSEG Enterprise/Other reported operating earnings of $8 million ($0.01 per share) for the first quarter of 2014 compared with breakeven operating results during the first quarter of 2013. Results reflect a steady contribution to earnings from the lease portfolio, and the start-up of PSEG-Long Island’s 12-year contract to operate the distribution and transmission assets of the Long Island Power Authority.
The forecast of PSEG Enterprise/Other full year operating earnings for 2014 is unchanged at $35 million - $40 million.
Credit Facilities
In April 2014, PSEG and Power amended their respective 5- year credit agreements ending in 2017, extending the expiration dates from March 2017 to April 2019. PSEG has credit facilities amounting to $1.0 billion; Power’s credit facilities total $2.7 billion. Of these amounts, PSEG’s $500 million and Power’s $1.6 billion facilities will now mature in 2019. PSE&G maintains a 5-year credit facility amounting to $600 million which expires in March 2018. Total credit capacity was $4.3 billion as of March 31, 2014.
Forward Looking Statement
Certain of the matters discussed in this report about our and our subsidiaries’ future performance, including, without limitation, future revenues, earnings, strategies, prospects, consequences and all other statements that are not purely historical constitute “forward-looking statements” within the meaning of the Private Securities Litigation Reform Act of 1995. Such forward-looking statements are subject to risks and uncertainties, which could cause actual results to differ materially from those anticipated. Such statements are based on management’s beliefs as well as assumptions made by and information currently available to management. When used herein, the words “anticipate,” “intend,” “estimate,” “believe,” “expect,” “plan,” “should,” “hypothetical,” “potential,” “forecast,” “project,” variations of such words and similar expressions are intended to identify forward-looking statements. Factors that may cause actual results to differ are often presented with the forward-looking statements themselves. Other factors that could cause actual results to differ materially from those contemplated in any forward-looking statements made by us herein are discussed in filings we make with the United States Securities and Exchange Commission (SEC), including our Annual Report on Form 10-K and subsequent reports on Form 10-Q and Form 8-K and available on our website: http://www.pseg.com. These factors include, but are not limited to:
| • | adverse changes in the demand for or the price of the capacity and energy that we sell into wholesale electricity markets, |
| • | adverse changes in energy industry law, policies and regulation, including market structures and a potential shift away from competitive markets toward subsidized market mechanisms, transmission planning and cost allocation rules, including rules regarding how transmission is planned and who is permitted to build transmission in the future, and reliability standards, |
| • | any inability of our transmission and distribution businesses to obtain adequate and timely rate relief and regulatory approvals from federal and state regulators, |
| • | changes in federal and state environmental regulations and enforcement that could increase our costs or limit our operations, |
| • | changes in nuclear regulation and/or general developments in the nuclear power industry, including various impacts from any accidents or incidents experienced at our facilities or by others in the industry, that could limit operations of our nuclear generating units, |
| • | actions or activities at one of our nuclear units located on a multi-unit site that might adversely affect our ability to continue to operate that unit or other units located at the same site, |
| • | any inability to balance our energy obligations, available supply and risks, |
| • | any deterioration in our credit quality or the credit quality of our counterparties, |
| • | availability of capital and credit at commercially reasonable terms and conditions and our ability to meet cash needs, |
| • | changes in the cost of, or interruption in the supply of, fuel and other commodities necessary to the operation of our generating units, |
| • | delays in receipt of necessary permits and approvals for our construction and development activities, |
| • | delays or unforeseen cost escalations in our construction and development activities, |
| • | any inability to achieve, or continue to sustain, our expected levels of operating performance, |
| • | any equipment failures, accidents, severe weather events or other incidents that impact our ability to provide safe and reliable service to our customers, and any inability to obtain sufficient coverage or recover proceeds of insurance with respect to such events, |
| • | acts of terrorism, cybersecurity attacks or intrusions that could adversely impact our businesses, |
| • | increases in competition in energy supply markets as well as competition for certain transmission projects, |
| • | any inability to realize anticipated tax benefits or retain tax credits, |
| • | challenges associated with recruitment and/or retention of a qualified workforce, |
| • | adverse performance of our decommissioning and defined benefit plan trust fund investments and changes in funding requirements, and |
| • | changes in technology, such as distributed generation and micro grids, and greater reliance on these technologies and changes in customer behaviors, including energy efficiency, net-metering and demand response. |
All of the forward-looking statements made in this report are qualified by these cautionary statements and we cannot assure you that the results or developments anticipated by management will be realized or even if realized, will have the expected consequences to, or effects on, us or our business prospects, financial condition or results of operations. Readers are cautioned not to place undue reliance on these forward-looking statements in making any investment decision. Forward-looking statements made in this report apply only as of the date of this report. While we may elect to update forward-looking statements from time to time, we specifically disclaim any obligation to do so, even if internal estimates change, unless otherwise required by applicable securities laws.
The forward-looking statements contained in this report are intended to qualify for the safe harbor provisions of Section 27A of the Securities Act of 1933, as amended, and Section 21E of the Securities Exchange Act of 1934, as amended.
Attachment 1
PUBLIC SERVICE ENTERPRISE GROUP INCORPORATED
Operating Earnings and Per Share Results by Subsidiary
(Unaudited)
| Three Months Ended March 31, |
||||||||
| 2014 | 2013 | |||||||
| Earnings Results ($ Millions) |
||||||||
| PSEG Power |
$ | 293 | $ | 254 | ||||
| PSE&G |
214 | 179 | ||||||
| PSEG Enterprise/Other |
8 | — | ||||||
|
|
|
|
|
|||||
| Operating Earnings |
$ | 515 | $ | 433 | ||||
|
|
|
|
|
|||||
| Reconciling Items(a) |
(129 | ) | (113 | ) | ||||
|
|
|
|
|
|||||
| Net Income |
$ | 386 | $ | 320 | ||||
|
|
|
|
|
|||||
| Fully Diluted Average Shares Outstanding (in Millions) |
508 | 507 | ||||||
|
|
|
|
|
|||||
| Per Share Results (Diluted) |
||||||||
| PSEG Power |
$ | 0.58 | $ | 0.50 | ||||
| PSE&G |
0.42 | 0.35 | ||||||
| PSEG Enterprise/Other |
0.01 | — | ||||||
|
|
|
|
|
|||||
| Operating Earnings |
$ | 1.01 | $ | 0.85 | ||||
|
|
|
|
|
|||||
| Reconciling Items(a) |
(0.25 | ) | (0.22 | ) | ||||
|
|
|
|
|
|||||
| Net Income |
$ | 0.76 | $ | 0.63 | ||||
|
|
|
|
|
|||||
| (a) | See Attachment 10 for details of items excluded from Net Income to compute Operating Earnings. |
Attachment 2
PUBLIC SERVICE ENTERPRISE GROUP INCORPORATED
Consolidating Statements of Operations
(Unaudited, $ Millions)
| Three Months Ended March 31, 2014 | ||||||||||||||||
| PSEG | PSEG Enterprise/ Other (a) |
PSEG Power |
PSE&G | |||||||||||||
| OPERATING REVENUES |
$ | 3,223 | $ | (622 | ) | $ | 1,700 | $ | 2,145 | |||||||
| OPERATING EXPENSES |
||||||||||||||||
| Energy Costs |
1,356 | (733 | ) | 1,044 | 1,045 | |||||||||||
| Operation and Maintenance |
856 | 92 | 302 | 462 | ||||||||||||
| Depreciation and Amortization |
306 | 7 | 72 | 227 | ||||||||||||
|
|
|
|
|
|
|
|
|
|||||||||
| Total Operating Expenses |
2,518 | (634 | ) | 1,418 | 1,734 | |||||||||||
|
|
|
|
|
|
|
|
|
|||||||||
| OPERATING INCOME |
705 | 12 | 282 | 411 | ||||||||||||
| Income from Equity Method Investments |
4 | — | 4 | — | ||||||||||||
| Other Income and (Deductions) |
36 | (1 | ) | 23 | 14 | |||||||||||
| Other Than Temporary Impairments |
(2 | ) | — | (2 | ) | — | ||||||||||
| Interest Expense |
(97 | ) | 3 | (32 | ) | (68 | ) | |||||||||
|
|
|
|
|
|
|
|
|
|||||||||
| INCOME BEFORE INCOME TAXES |
646 | 14 | 275 | 357 | ||||||||||||
| Income Tax Benefit (Expense) |
(260 | ) | (6 | ) | (111 | ) | (143 | ) | ||||||||
|
|
|
|
|
|
|
|
|
|||||||||
| NET INCOME |
$ | 386 | $ | 8 | $ | 164 | $ | 214 | ||||||||
|
|
|
|
|
|
|
|
|
|||||||||
| OPERATING EARNINGS |
$ | 515 | $ | 8 | $ | 293 | $ | 214 | ||||||||
| Reconciling Items Excluded from Net Income (b) |
(129 | ) | — | (129 | ) | — | ||||||||||
|
|
|
|
|
|
|
|
|
|||||||||
| NET INCOME |
$ | 386 | $ | 8 | $ | 164 | $ | 214 | ||||||||
|
|
|
|
|
|
|
|
|
|||||||||
| Three Months Ended March 31, 2013 | ||||||||||||||||
| PSEG | PSEG Enterprise/ Other (a) |
PSEG Power |
PSE&G | |||||||||||||
| OPERATING REVENUES |
$ | 2,786 | $ | (660 | ) | $ | 1,451 | $ | 1,995 | |||||||
| OPERATING EXPENSES |
||||||||||||||||
| Energy Costs |
1,155 | (672 | ) | 860 | 967 | |||||||||||
| Operation and Maintenance |
710 | — | 283 | 427 | ||||||||||||
| Depreciation and Amortization |
290 | 9 | 66 | 215 | ||||||||||||
| Taxes Other Than Income Taxes |
21 | — | — | 21 | ||||||||||||
|
|
|
|
|
|
|
|
|
|||||||||
| Total Operating Expenses |
2,176 | (663 | ) | 1,209 | 1,630 | |||||||||||
|
|
|
|
|
|
|
|
|
|||||||||
| OPERATING INCOME |
610 | 3 | 242 | 365 | ||||||||||||
| Income from Equity Method Investments |
2 | (1 | ) | 3 | — | |||||||||||
| Other Income and (Deductions) |
32 | 1 | 19 | 12 | ||||||||||||
| Other Than Temporary Impairments |
(2 | ) | — | (2 | ) | — | ||||||||||
| Interest Expense |
(102 | ) | 1 | (30 | ) | (73 | ) | |||||||||
|
|
|
|
|
|
|
|
|
|||||||||
| INCOME BEFORE INCOME TAXES |
540 | 4 | 232 | 304 | ||||||||||||
| Income Tax Benefit (Expense) |
(220 | ) | (4 | ) | (91 | ) | (125 | ) | ||||||||
|
|
|
|
|
|
|
|
|
|||||||||
| NET INCOME |
$ | 320 | $ | — | $ | 141 | $ | 179 | ||||||||
|
|
|
|
|
|
|
|
|
|||||||||
| OPERATING EARNINGS |
$ | 433 | $ | — | $ | 254 | $ | 179 | ||||||||
| Reconciling Items Excluded from Net Income (b) |
(113 | ) | — | (113 | ) | — | ||||||||||
|
|
|
|
|
|
|
|
|
|||||||||
| NET INCOME |
$ | 320 | $ | — | $ | 141 | $ | 179 | ||||||||
|
|
|
|
|
|
|
|
|
|||||||||
| (a) | Includes activities at Energy Holdings, PSEG Long Island and the Parent as well as intercompany eliminations. |
| (b) | See Attachment 10 for details of items excluded from Net Income to compute Operating Earnings. |
Attachment 3
PUBLIC SERVICE ENTERPRISE GROUP INCORPORATED
Capitalization Schedule
(Unaudited, $ Millions)
| March 31, 2014 |
December 31, 2013 |
|||||||
| DEBT |
||||||||
| Long-Term Debt |
$ | 8,130 | $ | 8,131 | ||||
| Securitization Debt |
442 | 496 | ||||||
| Project Level, Non-Recourse Debt |
16 | 16 | ||||||
|
|
|
|
|
|||||
| Total Debt |
8,588 | 8,643 | ||||||
| STOCKHOLDERS’ EQUITY |
||||||||
| Common Stock |
4,856 | 4,861 | ||||||
| Treasury Stock |
(626 | ) | (615 | ) | ||||
| Retained Earnings |
7,656 | 7,457 | ||||||
| Accumulated Other Comprehensive Loss |
(87 | ) | (95 | ) | ||||
|
|
|
|
|
|||||
| Total Common Stockholders’ Equity |
11,799 | 11,608 | ||||||
| Noncontrolling Interests—Equity Investments |
1 | 1 | ||||||
|
|
|
|
|
|||||
| Total Equity |
11,800 | 11,609 | ||||||
|
|
|
|
|
|||||
| Total Capitalization |
$ | 20,388 | $ | 20,252 | ||||
|
|
|
|
|
|||||
Attachment 4
PUBLIC SERVICE ENTERPRISE GROUP INCORPORATED
CONDENSED CONSOLIDATED STATEMENTS OF CASH FLOWS
(Unaudited, $ Millions)
| Three Months Ended March 31, | ||||||||
| 2014 | 2013 | |||||||
| CASH FLOWS FROM OPERATING ACTIVITIES |
||||||||
| Net Income |
$ | 386 | $ | 320 | ||||
| Adjustments to Reconcile Net Income to Net Cash Flows From Operating Activities |
730 | 557 | ||||||
|
|
|
|
|
|||||
| NET CASH PROVIDED BY OPERATING ACTIVITIES |
1,116 | 877 | ||||||
|
|
|
|
|
|||||
| NET CASH USED IN INVESTING ACTIVITIES |
(629 | ) | (733 | ) | ||||
|
|
|
|
|
|||||
| NET CASH USED IN FINANCING ACTIVITIES |
(325 | ) | (103 | ) | ||||
|
|
|
|
|
|||||
| Net Change in Cash and Cash Equivalents |
162 | 41 | ||||||
| Cash and Cash Equivalents at Beginning of Period |
493 | 379 | ||||||
|
|
|
|
|
|||||
| Cash and Cash Equivalents at End of Period |
$ | 655 | $ | 420 | ||||
|
|
|
|
|
|||||
Attachment 5
PUBLIC SERVICE ENTERPRISE GROUP INCORPORATED
Quarter-over-Quarter EPS Reconciliation
March 31, 2014 vs. March 31, 2013
(Unaudited)
PSEG EPS Reconciliation – Q1 2014 versus Q1 2013
| * | See Attachment 10 for Items excluded from Net Income to reconcile to Operating Earnings. |
Attachment 6
PSEG POWER LLC
Generation Measures*
(Unaudited)
| GWhr Breakdown | ||||||||
| Three Months Ended March 31, |
||||||||
| 2014 | 2013 | |||||||
| Nuclear—NJ |
5,527 | 5,588 | ||||||
| Nuclear—PA |
2,522 | 2,549 | ||||||
|
|
|
|
|
|||||
| Total Nuclear |
8,049 | 8,137 | ||||||
| Fossil—Coal/Natural Gas—NJ** |
532 | 479 | ||||||
| Fossil—Coal—PA |
1,381 | 1,419 | ||||||
| Fossil—Coal—CT |
628 | 309 | ||||||
|
|
|
|
|
|||||
| Total Coal |
2,541 | 2,207 | ||||||
| Fossil—Oil & Natural Gas—NJ |
3,168 | 2,888 | ||||||
| Fossil—Oil & Natural Gas—NY |
567 | 878 | ||||||
| Fossil—Oil & Natural Gas—CT |
240 | 47 | ||||||
|
|
|
|
|
|||||
| Total Oil & Natural Gas |
3,975 | 3,813 | ||||||
|
|
|
|
|
|||||
| 14,565 | 14,157 | |||||||
| % Generation by Fuel Type |
||||||||
| Three Months Ended March 31, |
||||||||
| 2014 | 2013 | |||||||
| Nuclear—NJ |
38 | % | 39 | % | ||||
| Nuclear—PA |
17 | % | 18 | % | ||||
|
|
|
|
|
|||||
| Total Nuclear |
55 | % | 57 | % | ||||
| Fossil—Coal/Natural Gas—NJ** |
4 | % | 4 | % | ||||
| Fossil—Coal—PA |
9 | % | 10 | % | ||||
| Fossil—Coal—CT |
4 | % | 2 | % | ||||
|
|
|
|
|
|||||
| Total Coal |
17 | % | 16 | % | ||||
| Fossil—Oil & Natural Gas—NJ |
22 | % | 21 | % | ||||
| Fossil—Oil & Natural Gas—NY |
4 | % | 6 | % | ||||
| Fossil—Oil & Natural Gas—CT |
2 | % | 0 | % | ||||
|
|
|
|
|
|||||
| Total Oil & Natural Gas |
28 | % | 27 | % | ||||
|
|
|
|
|
|||||
| 100 | % | 100 | % | |||||
| * | Excludes Solar and Kalaeloa |
| ** | Includes Pumped Storage. Pumped Storage accounted for <1% of total generation for the three months ended March 31, 2014 and 2013. Also includes natural gas fuel switching intervals. |
Attachment 7
PUBLIC SERVICE ELECTRIC & GAS COMPANY
Retail Sales and Revenues
(Unaudited)
March 31, 2014
Electric Sales and Revenues
| Sales (millions kWh) |
Three Months Ended |
Change vs. 2013 |
||||||
| Residential |
3,311 | 5.8 | % | |||||
| Commercial & Industrial |
6,876 | 2.6 | % | |||||
| Street Lighting |
91 | -0.3 | % | |||||
| Interdepartmental |
3 | 11.6 | % | |||||
|
|
|
|||||||
| Total |
10,281 | 3.6 | % | |||||
|
|
|
|||||||
| Revenue (in millions) |
||||||||
| Residential |
$ | 511 | 8.8 | % | ||||
| Commercial & Industrial |
486 | 11.4 | % | |||||
| Street Lighting |
18 | -2.5 | % | |||||
| Other Operating Revenues* |
125 | 19.1 | % | |||||
|
|
|
|||||||
| Total |
$ | 1,140 | 10.7 | % | ||||
|
|
|
|||||||
| Weather Data |
Three Months Ended |
Change vs. 2013 |
||||||
| THI Hours—Actual |
0 | 0.0 | % | |||||
| THI Hours—Normal |
29 | |||||||
| * | Primarily sales of Non-Utility Generator energy to PJM and Transmission related revenues. |
Attachment 8
PUBLIC SERVICE ELECTRIC & GAS COMPANY
Retail Sales and Revenues
(Unaudited)
March 31, 2014
Gas Sold and Transported
| Sales (millions therms)* |
Three Months Ended |
Change vs. 2013 |
||||||
| Firm Sales |
||||||||
| Residential Sales |
828 | 18.3 | % | |||||
| Commercial & Industrial |
517 | 17.4 | % | |||||
|
|
|
|||||||
| Total Firm Sales |
1,345 | 17.9 | % | |||||
|
|
|
|||||||
| Non-Firm Sales |
||||||||
| Commercial & Industrial |
551 | 134.8 | % | |||||
|
|
|
|||||||
| Total Non-Firm Sales |
551 | |||||||
|
|
|
|||||||
| Total Sales |
1,896 | 37.8 | % | |||||
|
|
|
|||||||
| Revenue ($ millions) |
||||||||
| Residential Sales—Firm |
$ | 265 | -14.8 | % | ||||
| Commercial & Industrial—Firm Sales |
174 | 46.9 | % | |||||
| Non-Firm Sales |
15 | 15.4 | % | |||||
| Other Operating Revenues** |
44 | 5.2 | % | |||||
|
|
|
|||||||
| Total |
$ | 498 | 2.8 | % | ||||
|
|
|
|||||||
| Gas Transported |
$ | 507 | 5.4 | % | ||||
| Weather Data |
Three Months Ended |
Change vs. 2013 |
||||||
| Degree Days—Actual |
2,968 | 16.4 | % | |||||
| Degree Days—Normal |
2,511 | |||||||
| * | CSG rate included in non-firm sales |
| ** | Primarily Appliance Service. |
Attachment 9
PUBLIC SERVICE ENTERPRISE GROUP INCORPORATED
Statistical Measures
(Unaudited)
| Three Months Ended March 31, |
||||||||
| 2014 | 2013 | |||||||
| Weighted Average Common Shares Outstanding (000’s) |
||||||||
| Basic |
506,077 | 505,942 | ||||||
| Diluted |
507,831 | 507,220 | ||||||
| Stock Price at End of Period |
$ | 38.14 | $ | 34.34 | ||||
| Dividends Paid per Share of Common Stock |
$ | 0.37 | $ | 0.36 | ||||
| Dividend Payout Ratio* |
54.0 | % | 59.0 | % | ||||
| Dividend Yield |
3.9 | % | 4.2 | % | ||||
| Price/Earnings Ratio* |
13.9 | 14.1 | ||||||
| Rate of Return on Average Common Equity* |
12.3 | % | 11.5 | % | ||||
| Book Value per Common Share |
$ | 23.32 | $ | 21.64 | ||||
| Market Price as a Percent of Book Value |
164 | % | 159 | % | ||||
| Total Shareholder Return |
20.3 | % | 13.5 | % | ||||
| * | Calculation based on Operating Earnings for the 12 month period ended. |
Attachment 10
PUBLIC SERVICE ENTERPRISE GROUP INCORPORATED
| Reconciling Items, net of tax | Three Months Ended March 31, |
Year Ended December 31, |
||||||||||||||
| 2014 | 2013 | 2013 | 2012 | |||||||||||||
| (Unaudited) | ||||||||||||||||
| Earnings Impact ($ Millions) | ||||||||||||||||
| Operating Earnings |
$ | 515 | $ | 433 | $ | 1,309 | $ | 1,236 | ||||||||
| Gain (Loss) on Nuclear Decommissioning Trust (NDT) Fund Related Activity (PSEG Power) |
9 | 9 | 40 | 52 | ||||||||||||
| Gain (Loss) on Mark-to-Market (MTM)(a) (PSEG Power) |
(132 | ) | (105 | ) | (74 | ) | (10 | ) | ||||||||
| Lease Related Activity (PSEG Enterprise/Other) |
— | — | — | 36 | ||||||||||||
| Storm O&M, net of insurance recoveries (PSEG Power) |
(6 | ) | (17 | ) | (32 | ) | (39 | ) | ||||||||
|
|
|
|
|
|
|
|
|
|||||||||
| Net Income |
$ | 386 | $ | 320 | $ | 1,243 | $ | 1,275 | ||||||||
|
|
|
|
|
|
|
|
|
|||||||||
| Fully Diluted Average Shares Outstanding (in Millions) |
508 | 507 | 508 | 507 | ||||||||||||
| Per Share Impact (Diluted) | ||||||||||||||||
| Operating Earnings |
$ | 1.01 | $ | 0.85 | $ | 2.58 | $ | 2.44 | ||||||||
| Gain (Loss) on NDT Fund Related Activity (PSEG Power) |
0.02 | 0.02 | 0.08 | 0.10 | ||||||||||||
| Gain (Loss) on MTM(a) (PSEG Power) |
(0.26 | ) | (0.21 | ) | (0.14 | ) | (0.02 | ) | ||||||||
| Lease Related Activity (PSEG Enterprise/Other) |
— | — | — | 0.07 | ||||||||||||
| Storm O&M, net of insurance recoveries (PSEG Power) |
(0.01 | ) | (0.03 | ) | (0.07 | ) | (0.08 | ) | ||||||||
|
|
|
|
|
|
|
|
|
|||||||||
| Net Income |
$ | 0.76 | $ | 0.63 | $ | 2.45 | $ | 2.51 | ||||||||
|
|
|
|
|
|
|
|
|
|||||||||
| (a) | Includes the financial impact from positions with forward delivery months. |