Attached files
| file | filename |
|---|---|
| 8-K - FORM 8-K - ASTORIA FINANCIAL CORP | v376808_8k.htm |
Investor Presentation First Quarter Ended March 31, 2014 NYSE: AF
2 Forward Looking Statement This presentation may contain a number of forward - looking statements within the meaning of Section 27 A of the Securities Act of 1933 , as amended, and Section 21 E of the Securities Exchange Act of 1934 , as amended . These statements may be identified by the use of the words “anticipate,” “believe,” “could,” “estimate,” “expect,” “intend,” “may,” “outlook,” “plan,” “potential,” “predict,” “project,” “should,” “will,” “would,” and similar terms and phrases, including references to assumptions . Forward - looking statements are based on various assumptions and analyses made by us in light of our management’s experience and perception of historical trends, current conditions and expected future developments, as well as other factors we believe are appropriate under the circumstances . These statements are not guarantees of future performance and are subject to risks, uncertainties and other factors (many of which are beyond our control) that could cause actual results to differ materially from future results expressed or implied by such forward - looking statements . These factors include, without limitation, the following : the timing and occurrence or non - occurrence of events may be subject to circumstances beyond our control ; there may be increases in competitive pressure among financial institutions or from non - financial institutions ; changes in the interest rate environment may reduce interest margins or affect the value of our investments ; changes in deposit flows, loan demand or real estate values may adversely affect our business ; changes in accounting principles, policies or guidelines may cause our financial condition to be perceived differently ; general economic conditions, either nationally or locally in some or all areas in which we do business, or conditions in the real estate or securities markets or the banking industry may be less favorable than we currently anticipate ; legislative or regulatory changes, including the implementation of the Dodd - Frank Wall Street Reform and Consumer Protection Act of 2010 and any actions regarding foreclosures, may adversely affect our business ; enhanced supervision and examination by the Office of the Comptroller of the Currency, the Board of Governors of the Federal Reserve System, and the Consumer Financial Protection Bureau ; effects of changes in existing U . S . government or government - sponsored mortgage programs ; technological changes may be more difficult or expensive than we anticipate ; success or consummation of new business initiatives may be more difficult or expensive than we anticipate ; or litigation or other matters before regulatory agencies, whether currently existing or commencing in the future, may be determined adverse to us or may delay occurrence or non - occurrence of events longer than we anticipate . We have no obligation to update any forward - looking statements to reflect events or circumstances after the date of this document .
3 Corporate Profile NYSE: AF • With assets of $15.7 billion, Astoria Financial is the holding company for Astoria Federal Savings and is the fifth largest publicly traded thrift holding company in the country. • Established in 1888, Astoria Federal, with deposits totaling $9.7 billion, is the second largest thrift depository in New York. • 20 consecutive years of core profitability as a public company (1 ) • Stable and healthy credit metrics throughout the crisis • Clean, well capitalized balance sheet (1) Refers to net income recalculated to exclude net realized gains and losses on securities, amortization of intangibles and impairment of goodwill, and other nonrecurring items. Core profitability is a non - GAAP financial measure .
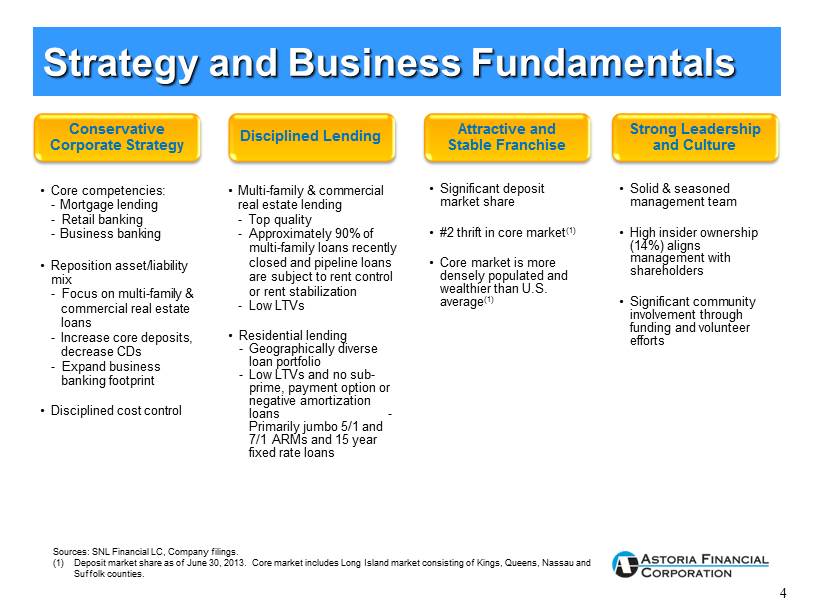
4 Strategy and Business Fundamentals Conservative Corporate Strategy • Core competencies: - Mortgage lending - Retail banking - Business banking • Reposition asset/liability mix - Focus on multi - family & commercial real estate loans - Increase core deposits, decrease CDs - Expand business banking footprint • Disciplined cost control Disciplined Lending • Multi - family & commercial real estate lending - Top quality - Approximately 90% of multi - family loans recently closed and pipeline loans are subject to rent control or rent stabilization - Low LTVs • Residential lending - Geographically diverse loan portfolio - Low LTVs and no sub - prime, payment option or negative amortization loans - Primarily jumbo 5/1 and 7/1 ARMs and 15 year fixed rate loans Attractive and Stable Franchise • Significant deposit market share • #2 thrift in core market (1) • Core market is more densely populated and wealthier than U.S. average (1) Strong Leadership and Culture • Solid & seasoned management team • High insider ownership (14%) aligns management with shareholders • Significant community involvement through funding and volunteer efforts Sources: SNL Financial LC, Company filings. (1) Deposit market share as of June 30, 2013. Core market includes Long Island market consisting of Kings, Queens, Nassau and Suffolk counties .
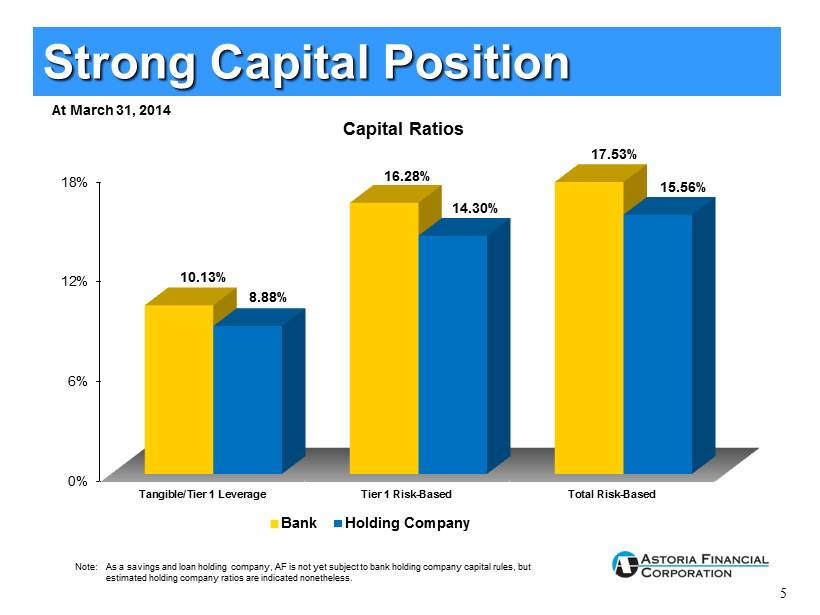
5 Strong Capital Position 0% 6% 12% 18% Tangible/Tier 1 Leverage Tier 1 Risk-Based Total Risk-Based 10.13% 16.28% 17.53% 8.88% 14.30% 15.56% Bank Holding Company At March 31, 2014 Note: As a savings and loan holding company, AF is not yet subject to bank holding company capital rules, but estimated holding company ratios are indicated nonetheless. Capital Ratios
6 Multi - family/Commercial Real Estate Portfolio • $4.2 billion portfolio, or 34% of total loan portfolio ─ 1Q14 originations of $218.0 million, with a weighted average LTV at origination of approximately 54% and weighted average debt service coverage ratio of approximately 1.72, all in footprint • Focus on rent controlled, rent stabilized apartments in New York City ─ Approximately 70% of multi - family portfolio originated prior to 2011, and approximately 90% of originated and pipeline loans since 2011, are subject to rent control or rent stabilization ─ Pipeline of approximately $448 million at March 31, 2014 with weighted average coupon of approximately 3.48%. MF/CRE loan portfolio growing to a larger percentage of the total loan portfolio; grew to 34% of total loans at March 31, 2014 from 33% at December 31, 2013 and 26% from March 31, 2013.
7 Residential Mortgage Lending • $7.8 billion portfolio ─ Primarily prime, jumbo 5/1 and 7/1 hybrid ARMs and 15 year fixed rate loans ─ No sub - prime, payment option or negative amortization ARM lending ─ Weighted average LTV (1) on total residential loan portfolio <60% ─ 1Q14 originations of $98.3 million with a weighted average LTV at origination of approximately 69% • Multiple delivery channels provide flexibility & efficiency ─ Retail (2 ) ─ Commissioned brokers (2) ─ Third party originators (2) • Geographically diversified portfolio ─ Reduces lending concentrations (1) LTV ratios are based on current principal balances and original appraised values. (2) All loans underwritten to Astoria’s stringent standards .
8 Leading Retail Banking Franchise • $9.7 billion in deposits, 86 banking branch locations ─ Low cost/stable source of funds – weighted average rate: 0.53% ─ L ow cost core deposits * totaled $6.7 billion, or 68% of total deposits; up from 67% of total deposits at December 31, 2013 and 64% of total deposits at March 31, 2013 ─ 57% of households that have a retail CD account also have a low cost checking, savings or money market account relationship • 92% of depositors, with $8.9 billion in deposits, live within 5 miles of a branch • Banking branches with high average deposits contribute to franchise value ─ Long Island Offices (82) – Nassau (28), Suffolk (25), Queens (17), Brooklyn (12) – Average Deposits of $114 Million ─ Westchester Offices (3) – Average Deposits of $129 Million ─ New York Office (1) – Opened March 31, 2014 • Multiple delivery channels ─ ATM’s, telephone, Internet and mobile banking * Core deposits include savings, money market and checking accounts
9 Retail Banking Philosophy • Consultative approach to helping consumers achieve financial health and well - being • Pro - active sales culture – PEAK Process • Focus on customer service – High customer satisfaction – Favorably positioned against competition • Community involvement – Support over 700 local organizations and not - for - profit agencies Astoria Federal is an integral part of the fabric of the communities it serves
10 Business Banking Expansion Business deposits grew $40.0 million, or 6%, from year - end 2013 to $690.1 million at March 31, 2014. • Business Banking Group headed by Executive Vice President & Managing Director with more than 30 years of experience in the NY business banking market • More than 50% of Astoria Federal’s 86 branches are headed by experienced commercial bankers • 40 employees currently supporting the business at March 31, 2014, up from 21 at year - end 2012 • Opened a business banking office in mid - town Manhattan during 3Q13 • Opened our first full - service branch in Manhattan on March 31, 2014. • Plan to open two more full - service branches in 2H14 and five more by the end of 2016 in prime locations within our market to better serve our business banking clients
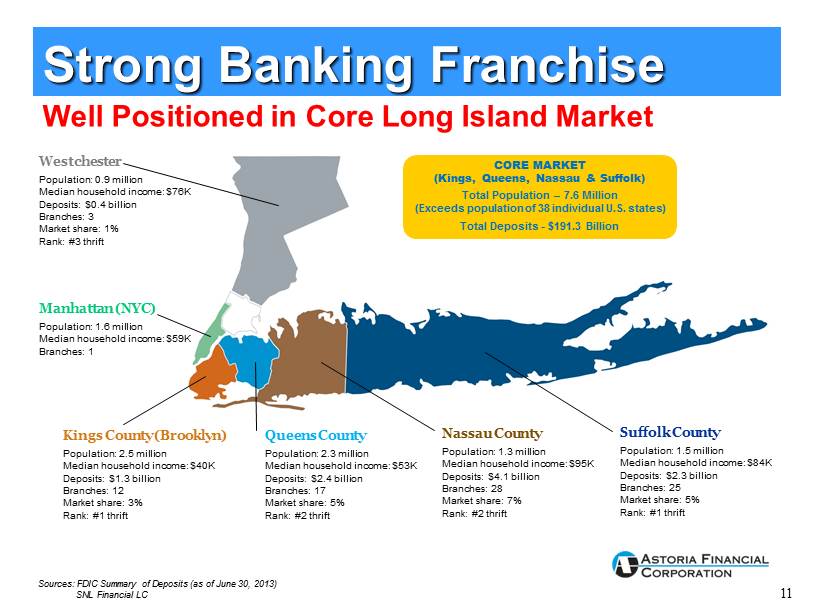
11 CORE MARKET (Kings, Queens, Nassau & Suffolk) Total Population – 7.6 Million (Exceeds population of 38 individual U.S. states) Total Deposits - $191.3 Billion Sources: FDIC Summary of Deposits (as of June 30, 2013) SNL Financial LC Kings County (Brooklyn) Population: 2.5 million Median household income: $40K Deposits: $1.3 billion Branches: 12 Market share: 3% Rank: #1 thrift Queens County Population: 2.3 million Median household income: $53K Deposits: $ 2.4 billion Branches: 17 Market share: 5% Rank: #2 thrift Nassau County Population: 1.3 million Median household income: $ 95K Deposits: $ 4.1 billion Branches: 28 Market share: 7% Rank: #2 thrift Suffolk County Population: 1.5 million Median household income: $ 84K Deposits: $ 2.3 billion Branches: 25 Market share: 5% Rank: #1 thrift Well Positioned in Core Long Island Market Strong Banking Franchise Manhattan (NYC) Population: 1.6 million Median household income: $59K Branches : 1 Westchester Population: 0.9 million Median household income: $76K Deposits: $0.4 billion Branches: 3 Market share: 1% Rank: #3 thrift
12 • Balance Sheet Growth • Asset Quality • Interest Rate Risk • Balance Sheet Repositioning Current Focus
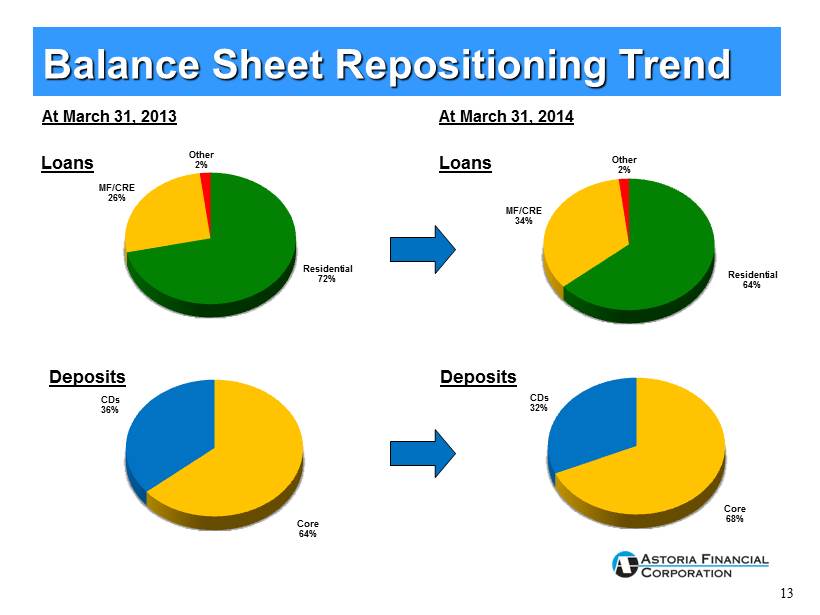
13 At March 31, 2013 Loans Loans At March 31, 2014 Balance Sheet Repositioning Trend Deposits Deposits Residential 72% MF/CRE 26% Other 2% Core 64% CDs 36% Core 68% CDs 32% Residential 64% MF/CRE 34% Other 2%
14 • Balance Sheet Growth • Asset Quality • Interest Rate Risk • Balance Sheet Growth Current Focus • Balance Sheet Repositioning
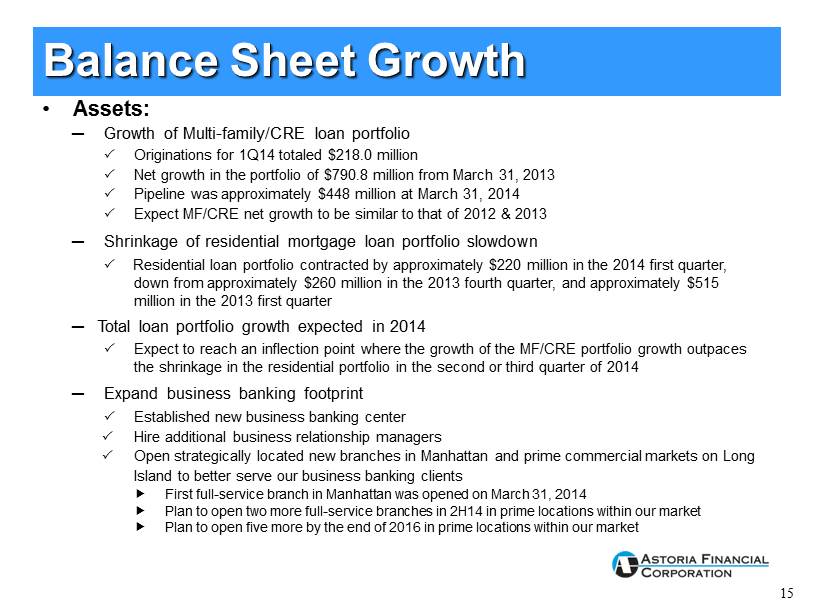
15 Balance Sheet Growth • Assets: ─ Growth of Multi - family/CRE loan portfolio O riginations for 1Q14 totaled $218.0 million Net growth in the portfolio of $790.8 million from March 31, 2013 Pipeline was approximately $448 million at March 31, 2014 Expect MF/CRE net growth to be similar to that of 2012 & 2013 ─ Shrinkage of residential mortgage loan portfolio slowdown Residential loan portfolio contracted by approximately $220 million in the 2014 first quarter, down from approximately $260 million in the 2013 fourth quarter, and approximately $515 million in the 2013 first quarter ─ Total loan portfolio growth expected in 2014 Expect to reach an inflection point where the growth of the MF/CRE portfolio growth outpaces the shrinkage in the residential portfolio in the second or third quarter of 2014 ─ Expand business banking footprint Established new business banking center Hire additional business relationship managers Open strategically located new branches in Manhattan and prime commercial markets on Long Island to better serve our business banking clients First full - service branch in Manhattan was opened on March 31, 2014 Plan to open two more full - service branches in 2H14 in prime locations within our market Plan to open five more by the end of 2016 in prime locations within our market
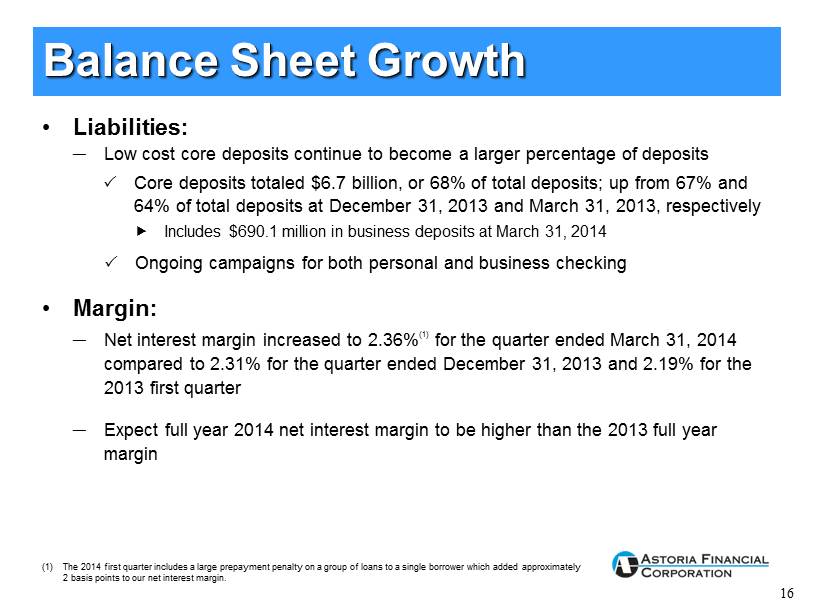
16 Balance Sheet Growth • Liabilities: ─ Low cost core deposits continue to become a larger percentage of deposits Core deposits totaled $6.7 billion, or 68% of total deposits; up from 67% and 64% of total deposits at December 31, 2013 and March 31, 2013, respectively Includes $690.1 million in business deposits at March 31, 2014 Ongoing campaigns for both personal and business checking • Margin: ─ Net interest margin increased to 2.36% (1) for the quarter ended March 31, 2014 compared to 2.31% for the quarter ended December 31, 2013 and 2.19% for the 2013 first quarter ─ Expect full year 2014 net interest margin to be higher than the 2013 full year margin (1) The 2014 first quarter includes a large prepayment penalty on a group of loans to a single borrower which added approximately 2 basis points to our net interest margin.
17 • Balance Sheet Growth • Asset Quality • Interest Rate Risk • Asset Quality Current Focus • Balance Sheet Repositioning
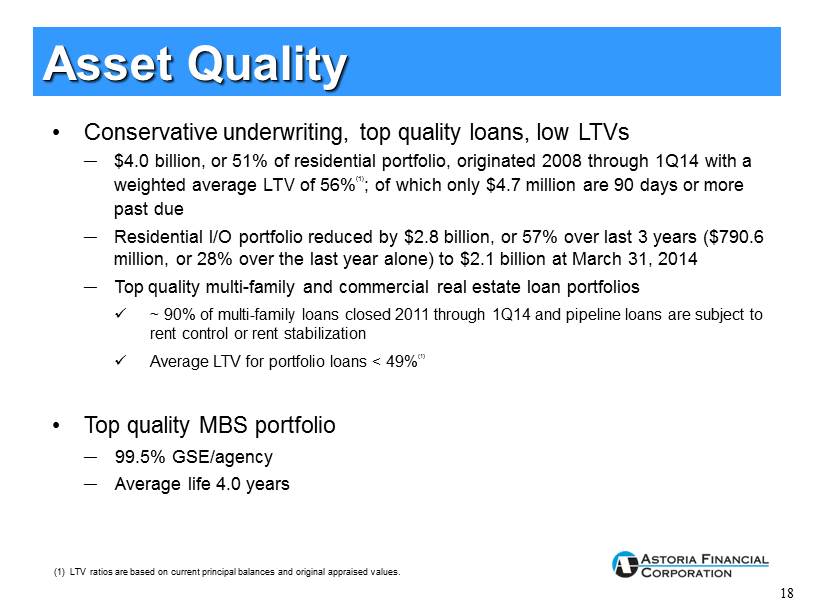
18 Asset Quality • Conservative underwriting, top quality loans, low LTVs ─ $4.0 billion, or 51% of residential portfolio, originated 2008 through 1Q14 with a weighted average LTV of 56% ( 1) ; of which only $4.7 million are 90 days or more past due ─ Residential I/O portfolio reduced by $2.8 billion, or 57% over last 3 years ($790.6 million, or 28% over the last year alone) to $2.1 billion at March 31, 2014 ─ Top quality multi - family and commercial real estate loan portfolios x ~ 90% of multi - family loans closed 2011 through 1Q14 and pipeline loans are subject to rent control or rent stabilization x Average LTV for portfolio loans < 49% ( 1) • Top quality MBS portfolio ─ 99.5% GSE/agency ─ Average life 4.0 years (1) LTV ratios are based on current principal balances and original appraised values .
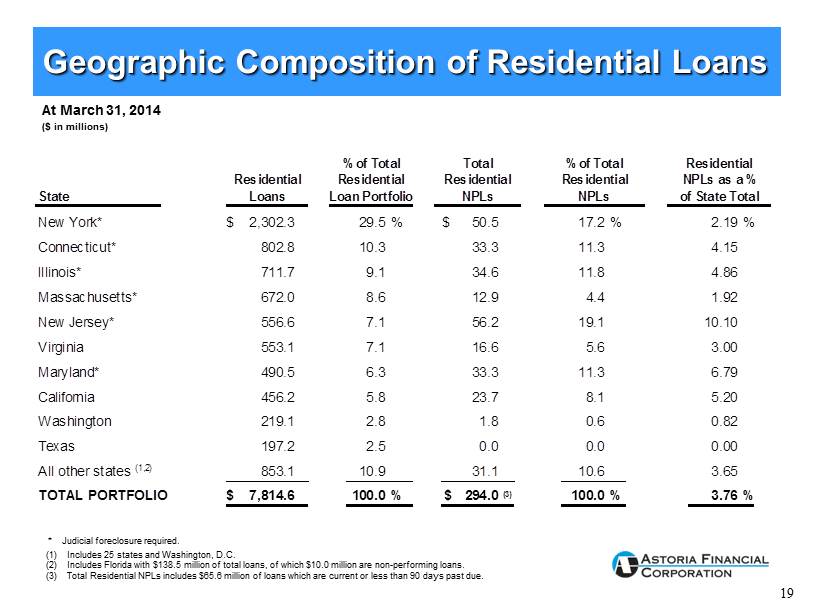
19 % of Total Total % of Total Residential Residential Residential Residential NPLs as a % State Loan Portfolio NPLs NPLs of State Total New York* $ 2,302.3 29.5% $ 50.5 17.2% 2.19% Connecticut* 802.8 10.3 33.3 11.3 4.15 Illinois* 711.7 9.1 34.6 11.8 4.86 Massachusetts* 672.0 8.6 12.9 4.4 1.92 New Jersey* 556.6 7.1 56.2 19.1 10.10 Virginia 553.1 7.1 16.6 5.6 3.00 Maryland* 490.5 6.3 33.3 11.3 6.79 California 456.2 5.8 23.7 8.1 5.20 Washington 219.1 2.8 1.8 0.6 0.82 Texas 197.2 2.5 0.0 0.0 0.00 All other states (1,2) 853.1 10.9 31.1 10.6 3.65 TOTAL PORTFOLIO $ 7,814.6 100.0% $ 294.0 (3) 100.0% 3.76% Residential Loans ($ in millions) At March 31, 2014 (1) Includes 25 states and Washington, D.C. (2) Includes Florida with $138.5 million of total loans, of which $10.0 million are non - performing loans. (3) Total Residential NPLs includes $65.6 million of loans which are current or less than 90 days past due. * Judicial foreclosure required . Geographic Composition of Residential Loans
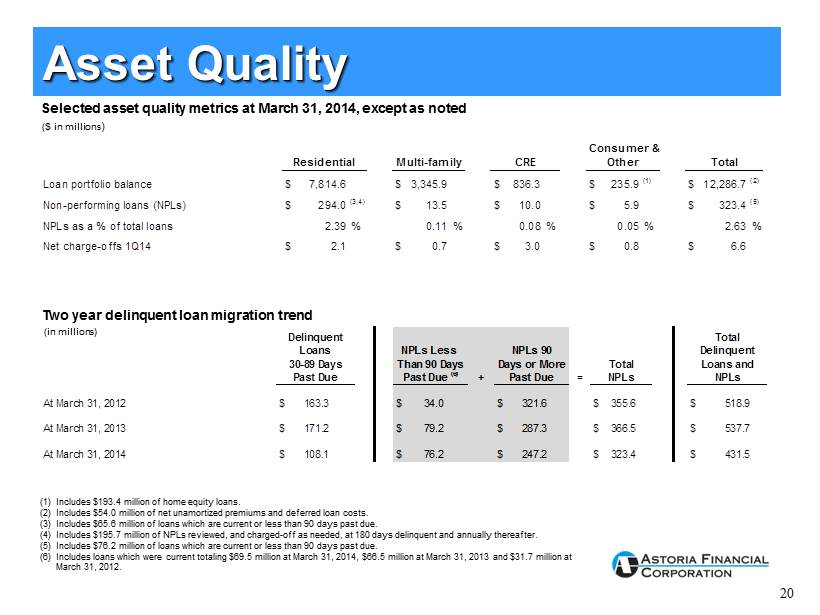
20 Asset Quality (1) Includes $193.4 million of home equity loans. (2) Includes $54.0 million of net unamortized premiums and deferred loan costs. (3) Includes $65.6 million of loans which are current or less than 90 days past due. (4) Includes $195.7 million of NPLs reviewed, and charged - off as needed, at 180 days delinquent and annually thereafter. (5) Includes $76.2 million of loans which are current or less than 90 days past due. (6) Includes loans which were current totaling $69.5 million at March 31, 2014, $66.5 million at March 31, 2013 and $31.7 mi lli on at March 31, 2012. Consumer & Multi-family Loan portfolio balance $ 7,814.6 $ 3,345.9 $ 836.3 $ 235.9 (1) $ 12,286.7 (2) Non-performing loans (NPLs) $ 294.0 (3,4) $ 13.5 $ 10.0 $ 5.9 $ 323.4 (5) NPLs as a % of total loans 2.39% 0.11% 0.08% 0.05% 2.63% Net charge-offs 1Q14 $ 2.1 $ 0.7 $ 3.0 $ 0.8 $ 6.6 Other Residential TotalCRE + = At March 31, 2012 $ 163.3 $ 34.0 $ 321.6 $ 355.6 $ 518.9 343.3 207.2 At March 31, 2013 $ 171.2 $ 79.2 $ 287.3 $ 366.5 $ 537.7 142.4 163.9 At March 31, 2014 $ 108.1 $ 76.2 $ 247.2 $ 323.4 $ 431.5 Past Due (6) Past Due NPLs Total Delinquent Loans and NPLs Total Delinquent Loans 30-89 Days Past Due NPLs 90 Days or More NPLs Less Than 90 Days Selected asset quality metrics at March 31, 2014, except as noted ($ in millions ) Two year delinquent loan migration trend (in millions)
21 • Balance Sheet Growth • Asset Quality • Interest Rate Risk • Interest Rate Risk Current Focus • Balance Sheet Repositioning
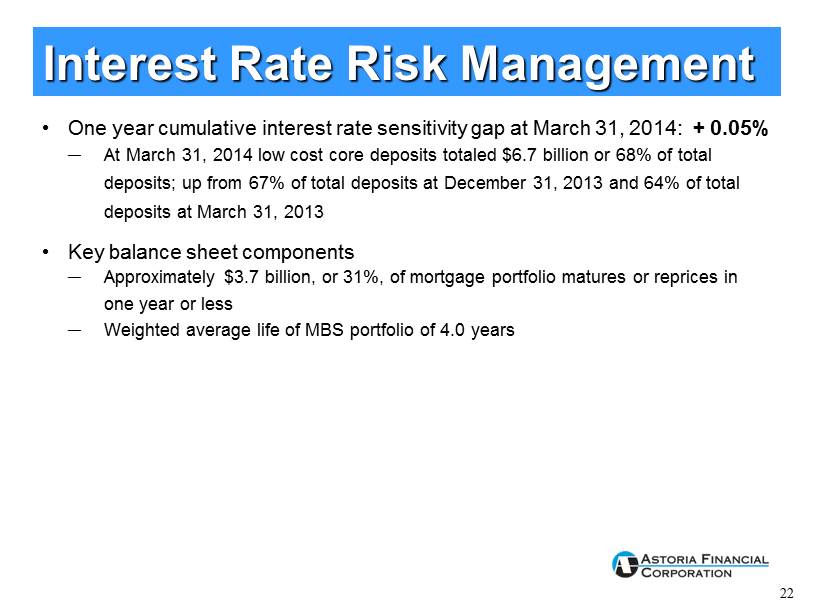
22 • One year cumulative interest rate sensitivity gap at March 31, 2014: + 0.05% ─ At March 31, 2014 low cost core deposits totaled $6.7 billion or 68% of total deposits; up from 67% of total deposits at December 31, 2013 and 64% of total deposits at March 31, 2013 • Key balance sheet components ─ Approximately $3.7 billion, or 31%, of mortgage portfolio matures or reprices in one year or less ─ Weighted average life of MBS portfolio of 4.0 years Interest Rate Risk Management
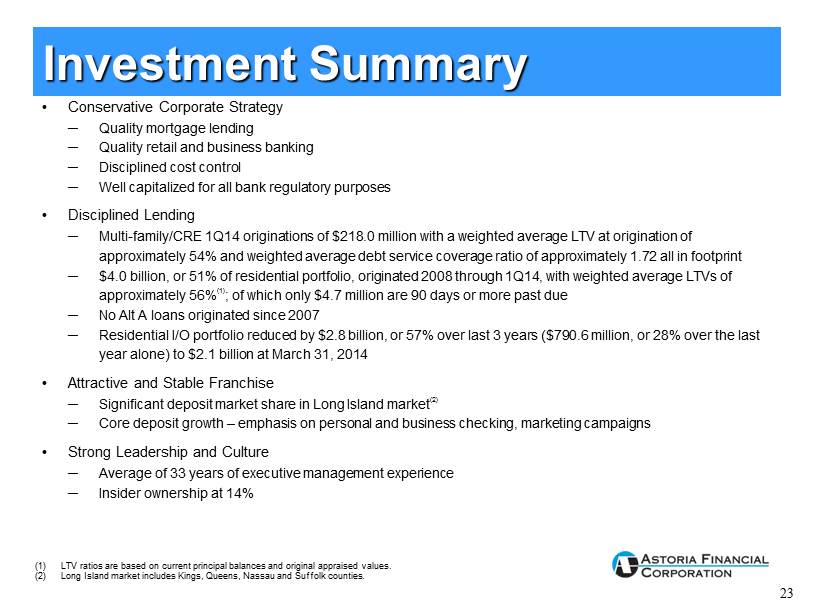
23 • Conservative Corporate Strategy ─ Quality mortgage lending ─ Quality retail and business banking ─ Disciplined cost control ─ Well capitalized for all bank regulatory purposes • Disciplined Lending ─ Multi - family/CRE 1Q14 originations of $218.0 million with a weighted average LTV at origination of approximately 54 % and weighted average debt service coverage ratio of approximately 1.72 all in footprint ─ $4.0 billion, or 51% of residential portfolio, originated 2008 through 1Q14, with weighted average LTVs of approximately 56% (1) ; of which only $4.7 million are 90 days or more past due ─ No Alt A loans originated since 2007 ─ Residential I/O portfolio reduced by $ 2.8 billion, or 57% over last 3 years ($790.6 million, or 28% over the last year alone) to $ 2.1 billion at March 31, 2014 • Attractive and Stable Franchise ─ Significant deposit market share in Long Island market (2) ─ Core deposit growth – emphasis on personal and business checking, marketing campaigns • Strong Leadership and Culture ─ Average of 33 years of executive management experience ─ Insider ownership at 14% (1) LTV ratios are based on current principal balances and original appraised values. (2) Long Island market includes Kings, Queens, Nassau and Suffolk counties. Investment Summary

24 Addendum
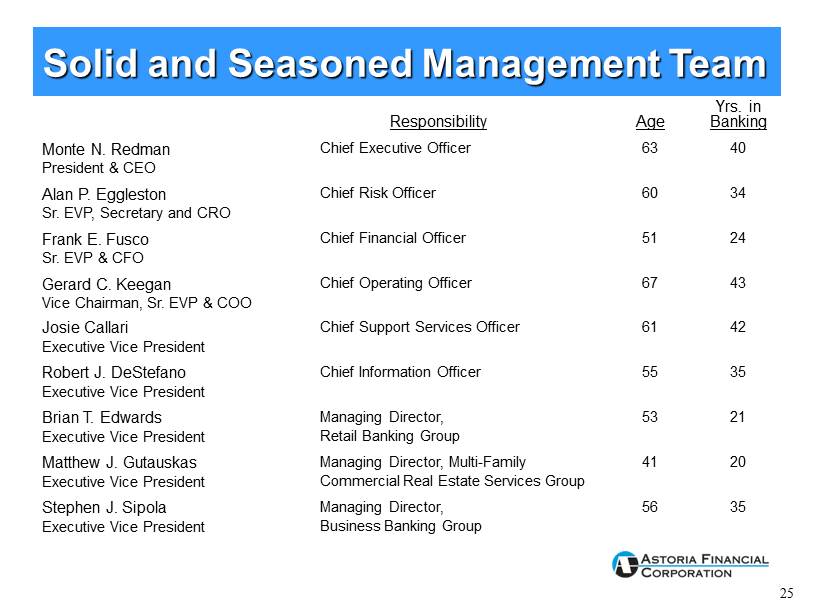
25 Solid and Seasoned Management Team Responsibility Age Yrs. in Banking Monte N. Redman President & CEO Chief Executive Officer 63 40 Alan P. Eggleston Sr. EVP, Secretary and CRO Chief Risk Officer 60 34 Frank E. Fusco Sr. EVP & CFO Chief Financial Officer 51 24 Gerard C. Keegan Vice Chairman, Sr. EVP & COO Chief Operating Officer 67 43 Josie Callari Executive Vice President Chief Support Services Officer 61 42 Robert J. DeStefano Executive Vice President Chief Information Officer 55 35 Brian T. Edwards Executive Vice President Managing Director, Retail Banking Group 53 21 Matthew J. Gutauskas Executive Vice President Managing Director, Multi - Family Commercial Real Estate Services Group 41 20 Stephen J. Sipola Executive Vice President Managing Director, Business Banking Group 56 35
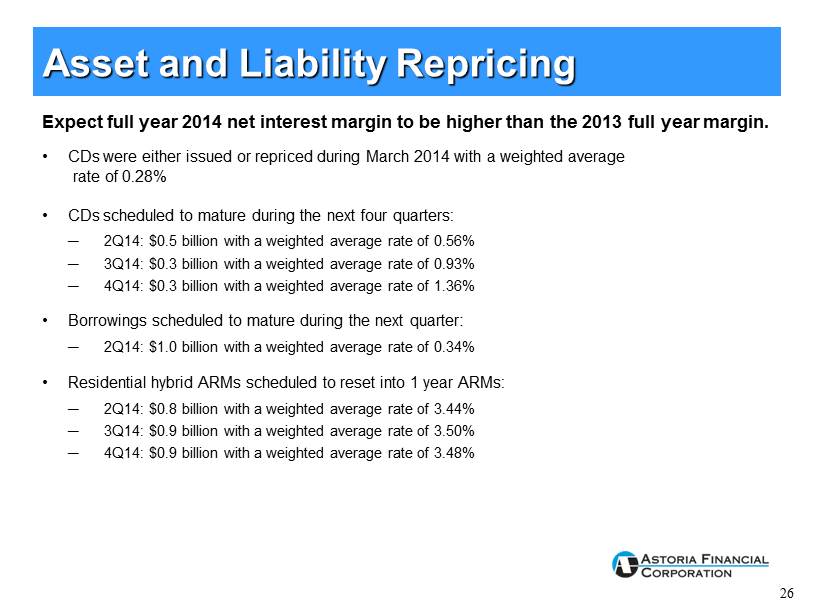
26 Asset and Liability Repricing Expect full year 2014 net interest margin to be higher than the 2013 full year margin. • CDs were either issued or repriced during March 2014 with a weighted average rate of 0.28% • CDs scheduled to mature during the next four quarters: ─ 2Q14: $0.5 billion with a weighted average rate of 0.56% ─ 3Q14: $0.3 billion with a weighted average rate of 0.93% ─ 4Q14 : $0.3 billion with a weighted average rate of 1.36% • Borrowings scheduled to mature during the next quarter : ─ 2Q14: $1.0 billion with a weighted average rate of 0.34% • Residential hybrid ARMs scheduled to reset into 1 year ARMs: ─ 2Q14: $0.8 billion with a weighted average rate of 3.44% ─ 3Q14 : $0.9 billion with a weighted average rate of 3.50% ─ 4Q14 : $0.9 billion with a weighted average rate of 3.48%
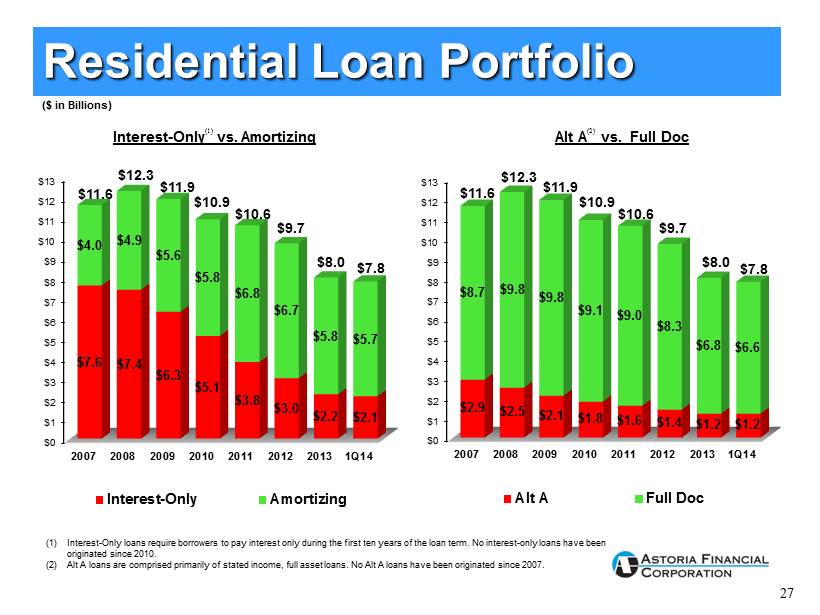
27 ($ in Billions ) $0 $1 $2 $3 $4 $5 $6 $7 $8 $9 $10 $11 $12 $13 2007 2008 2009 2010 2011 2012 2013 1Q14 $7.6 $7.4 $6.3 $5.1 $3.8 $3.0 $2.2 $2.1 $4.0 $4.9 $5.6 $5.8 $6.8 $6.7 $5.8 $5.7 $11.6 $12.3 $11.9 $10.9 $10.6 $9.7 $8.0 $7.8 Interest-Only Amortizing $0 $1 $2 $3 $4 $5 $6 $7 $8 $9 $10 $11 $12 $13 2007 2008 2009 2010 2011 2012 2013 1Q14 $2.9 $2.5 $2.1 $1.8 $1.6 $1.4 $1.2 $1.2 $8.7 $9.8 $9.8 $9.1 $9.0 $8.3 $6.8 $6.6 $11.6 $12.3 $11.9 $10.9 $10.6 $9.7 $8.0 $7.8 Alt A Full Doc (1) Interest - Only loans require borrowers to pay interest only during the first ten years of the loan term. No interest - only loans h ave been originated since 2010. (2) Alt A loans are comprised primarily of stated income, full asset loans. No Alt A loans have been originated since 2007. Interest - Only (1) vs . Amortizing Alt A (2 ) vs. Full Doc Residential Loan Portfolio
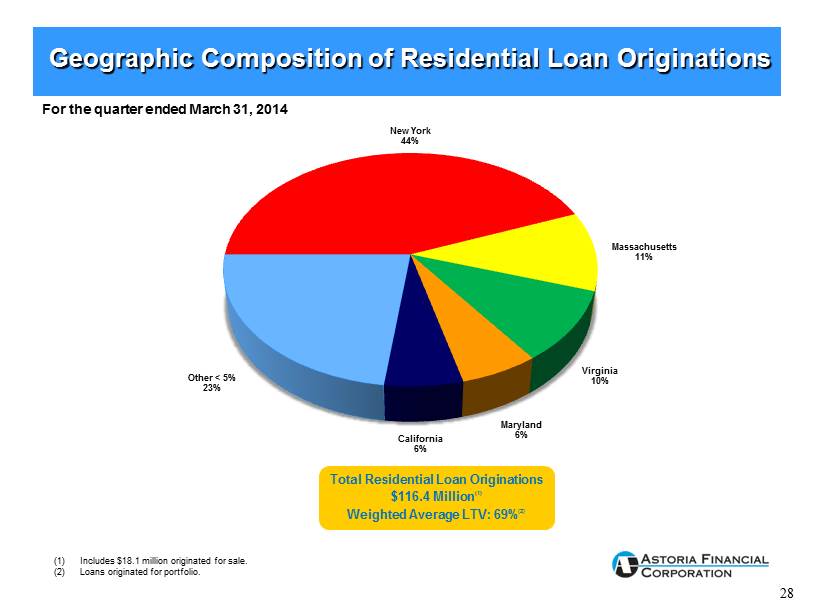
28 Geographic Composition of Residential Loan Originations New York 44% Massachusetts 11% Virginia 10% Maryland 6% California 6% Other < 5% 23% For the quarter ended March 31, 2014 Total Residential Loan Originations $116.4 Million (1) Weighted Average LTV: 69% (2) (1) Includes $18.1 million originated for sale. (2) Loans originated for portfolio.
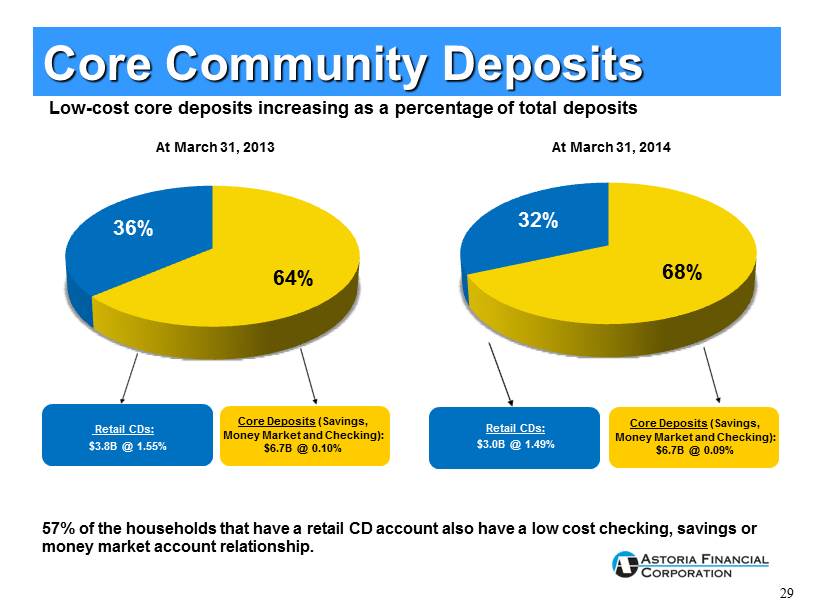
29 64% 36% 68% 32% Core Deposits (Savings , Money Market and Checking): $6.7B @ 0.09% Retail CDs: $3.0B @ 1.49% At March 31, 2013 Core Community Deposits 57% of the households that have a retail CD account also have a low cost checking, savings or money market account relationship. Core Deposits (Savings, Money Market and Checking): $6.7B @ 0.10% Retail CDs: $3.8B @ 1.55% At March 31, 2014 Low - cost core deposits increasing as a percentage of total deposits
30 P erformance based on E nthusiasm, A ctions and K nowledge “Sales Oriented and Service Obsessed” • A “needs” based approach to sales rather than “product” based approach • Highly interactive program – daily and weekly meetings create a focus that is shared throughout the branch network • Incentives for strong performance, both individual and team Sales – PEAK Process
31 Customer Satisfaction Key Findings : Favorably Positioned Against Competitors • 77% of Astoria customers are highly satisfied • 75% of Astoria customers are highly likely to recommend Astoria to friend/family member • Astoria customers are 30% more likely to net increase their deposit relationship than are competitor customers • Satisfaction with the branch is by far the strongest driver of overall satisfaction – 85% of Astoria customers are highly satisfied with quality of branch service Survey results are based on a 2010 Independent Customer Satisfaction Survey.
32 Key Initiatives • Education First ─ Supports lifelong learning, promotes savings and provides meaningful financial solutions to improve the way our customers live and the neighborhoods we serve • Neighborhood Outreach ─ Through funding and volunteer efforts, supports over 700 community - based organizations and not - for - profit agencies that enrich the communities within our market area ─ Reinforces community involvement by promoting neighborhood news and events in our local community branches • Results/Recognition ─ Seven consecutive “Outstanding” Community Reinvestment Act ratings by our primary banking regulator Astoria Federal is an integral part of the fabric of the communities it serves Community Involvement
33 Contact Information Web site: www.astoriafederal.com Email: ir@astoriafederal.com Telephone: (516) 327 - 7869 Address: Astoria Financial Corporation Attn: Investor Relations One Astoria Federal Plaza Lake Success, NY 11042