Attached files
| file | filename |
|---|---|
| 8-K - FORM 8-K - SEALED AIR CORP/DE | d716125d8k.htm |
| EX-99.1 - EX-99.1 - SEALED AIR CORP/DE | d716125dex991.htm |
| Exhibit 99.2
|
Sealed Air
Re-imagine TM
First Quarter 2014
Earnings Conference Call Supplement
(Unaudited Results)
|
|
Safe Harbor and Regulation G Statement
This presentation contains “forward-looking statements” within the meaning of the Private Securities Litigation Reform Act of
1995. Forward-looking statements can be identified by such words as “anticipates,” “believes,” “plan,” “assumes,” “could,”
“estimates,” “expects,” “intends,” “may,” “plans to,” “will” and similar expressions. These statements reflect our beliefs and
expectations as to future events and trends affecting our business, our consolidated financial position and our results of
operations. Examples of these forward-looking statements include expectations regarding our anticipated effective income
tax rate, the potential cash tax benefits associated with the W. R. Grace & Co. Settlement agreement (as defined in the
Company’s Annual Report on Form 10-K), potential volume, revenue and operating growth for future periods, expectations
and assumptions associated with our restructuring programs, availability and pricing of raw materials, success of our growth
initiatives, economic conditions, and the success of pricing actions. A variety of factors may cause actual results to differ
materially from these expectations, including general domestic and international economic and political conditions, changes in
our raw material and energy costs, credit ratings, the success of restructuring plans, currency translation and devaluation
effects, the competitive environment, the effects of animal and food-related health issues, environmental matters, and
regulatory actions and legal matters. For more extensive information, see “Risk Factors” and “Cautionary Notice Regarding
Forward-Looking Statements,” which appear in our most recent Annual Report on Form 10-K, as filed with the Securities and
Exchange Commission, and as revised and updated by our Quarterly Reports on Form 10-Q and Current Reports on Form 8-
K. While we may elect to update these forward-looking statements at some point in the future, we specifically disclaim any
obligation to do so, whether as a result of new information, future events, or otherwise.
Our management uses non-U.S. GAAP financial measures to evaluate the Company’s performance, which exclude items we
consider unusual or special items. We believe the use of such financial measures and information may be useful to investors.
We believe that the use of non-U.S. GAAP measures helps investors to gain a better understanding of core operating results
and future prospects, consistent with how management measures and forecasts the Company’s performance, especially
when comparing such results to previous periods or forecasts. Please see Sealed Air’s April 30, 2014 earnings press release
for important information about the use of non-U.S. GAAP financial measures relevant to this presentation, including
applicable reconciliations to U.S. GAAP financial measures.
2
|
|
Sealed Air
Re-imagine TM
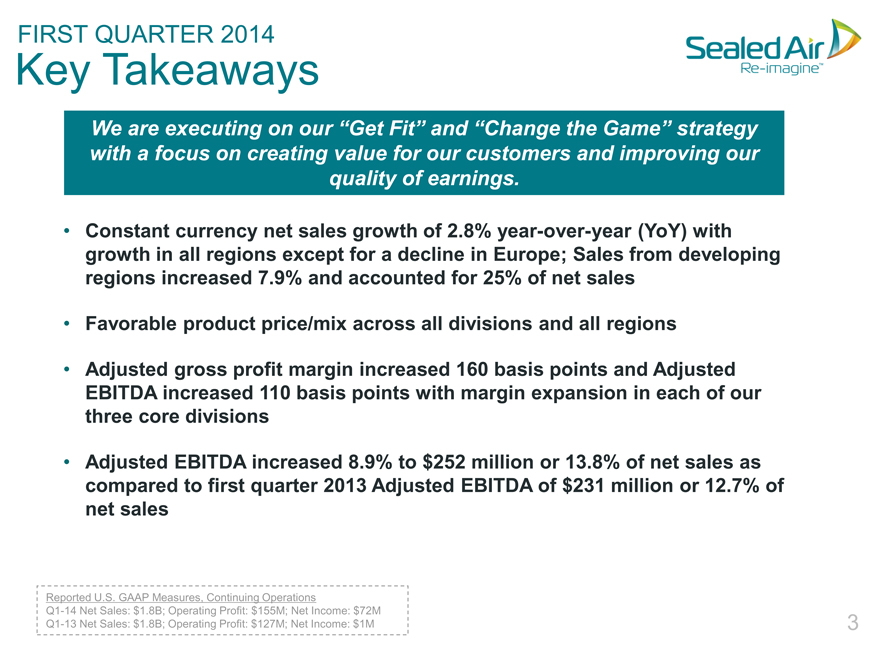
FIRST QUARTER 2014
Key Takeaways
We are executing on our “Get Fit” and “Change the Game” strategy with a focus on creating value for our customers and improving our quality of earnings.
Constant currency net sales growth of 2.8% year-over-year (YoY) with growth in all regions except for a decline in Europe; Sales from developing regions increased 7.9% and accounted for 25% of net sales
Favorable product price/mix across all divisions and all regions
Adjusted gross profit margin increased 160 basis points and Adjusted EBITDA increased 110 basis points with margin expansion in each of our three core divisions
Adjusted EBITDA increased 8.9% to $252 million or 13.8% of net sales as compared to first quarter 2013 Adjusted EBITDA of $231 million or 12.7% of net sales
Reported U.S. GAAP Measures, Continuing Operations
Q1-14 Net Sales: $1.8B; Operating Profit: $155M; Net Income: $72M Q1-13 Net Sales: $1.8B; Operating Profit: $127M; Net Income: $1M
3
|
|
Sealed Air
Re-imagine TM
FIRST QUARTER 2014
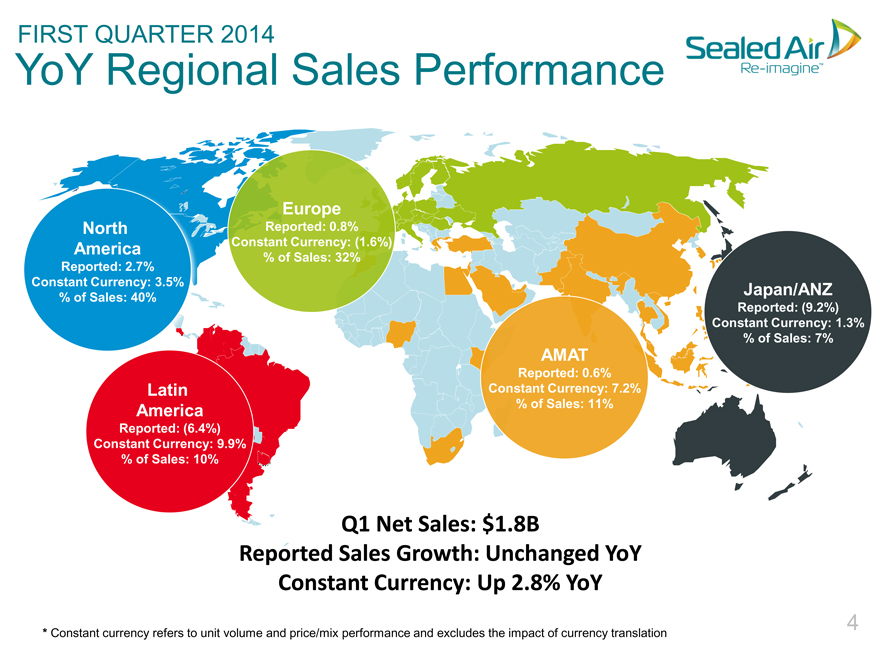
YoY Regional Sales Performance
Europe
North Reported: 0.8%
America Constant Currency: (1.6%)
% of Sales: 32%
Reported: 2.7%
Constant Currency: 3.5% Japan/ANZ
% of Sales: 40%
Reported: (9.2%)
Constant Currency: 1.3%
% of Sales: 7%
AMAT
Reported: 0.6%
Latin Constant Currency: 7.2%
America% of Sales: 11%
Reported: (6.4%)
Constant Currency: 9.9%
% of Sales: 10%
Q1 Net Sales: $1.8B
Reported Sales Growth: Unchanged YoY
Constant Currency: Up 2.8% YoY
* Constant currency refers to unit volume and price/mix performance and excludes the impact of currency translation 4
|
|
Sealed Air
Re-imagine TM
FIRST QUARTER 2014
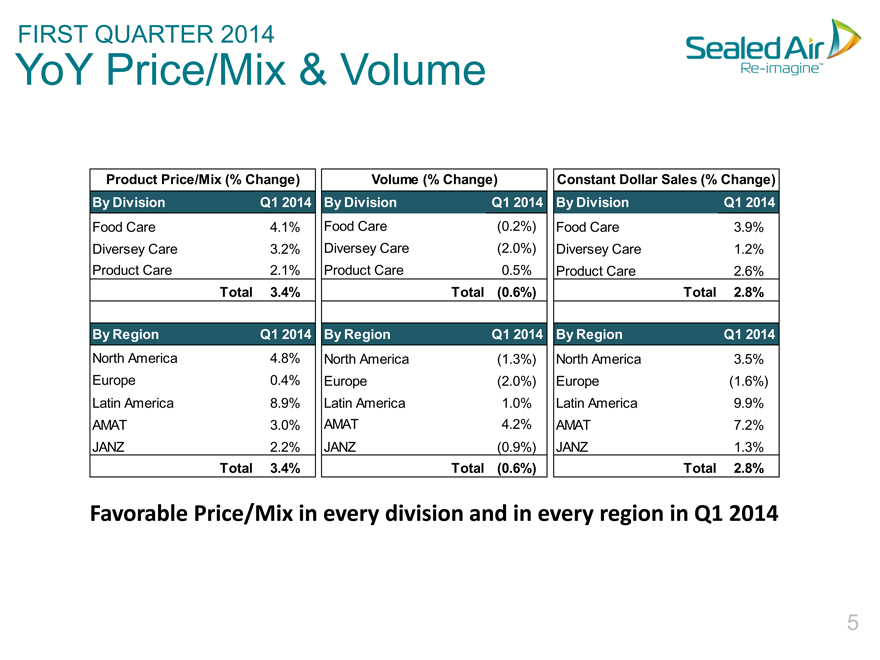
YoY Price/Mix & Volume
Product Price/Mix (% Change) Volume (% Change) Constant Dollar Sales (% Change)
By Division Q1 2014 By Division Q1 2014 By Division Q1 2014
Food Care 4.1% Food Care(0.2%) Food Care 3.9%
Diversey Care 3.2% Diversey Care(2.0%) Diversey Care 1.2%
Product Care 2.1% Product Care 0.5% Product Care 2.6%
Total 3.4% Total(0.6%) Total 2.8%
By Region Q1 2014 By Region Q1 2014 By Region Q1 2014
North America 4.8% North America(1.3%) North America 3.5%
Europe 0.4% Europe(2.0%) Europe(1.6%)
Latin America 8.9% Latin America 1.0% Latin America 9.9%
AMAT 3.0% AMAT 4.2% AMAT 7.2%
JANZ 2.2% JANZ(0.9%) JANZ 1.3%
Total 3.4% Total(0.6%) Total 2.8%
Favorable Price/Mix in every division and in every region in Q1 2014
5
|
|
Sealed Air
Re-imagine TM
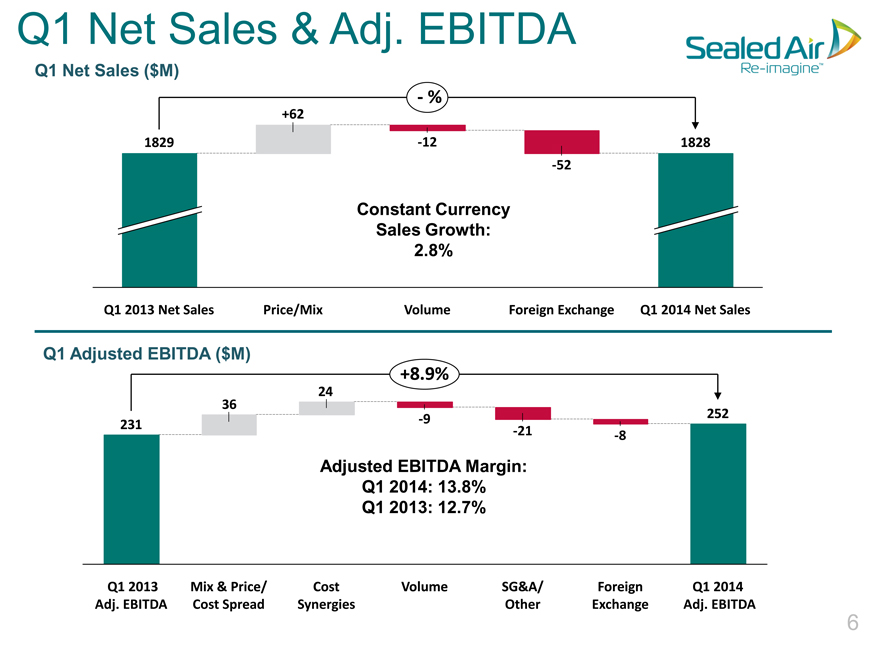
Q1 Net Sales & Adj. EBITDA
Q1 Net Sales ($M)
—%
+62
1829 -12 1828
-52
Constant Currency
Sales Growth:
2.8%
Q1 2013 Net Sales Price/Mix Volume Foreign Exchange Q1 2014 Net Sales
Q1 Adjusted EBITDA ($M)
+8.9%
24
36
-9 252
231
-21 -8
Adjusted EBITDA Margin:
Q1 2014: 13.8%
Q1 2013: 12.7%
Q1 2013 Mix & Price/ Cost Volume SG&A/ Foreign Q1 2014
Adj. EBITDA Cost Spread Synergies Other Exchange Adj. EBITDA
6
|
|
Sealed Air
Re-imagine TM
FAVORABLE PRICE/MIX & MARGIN EXPANSION
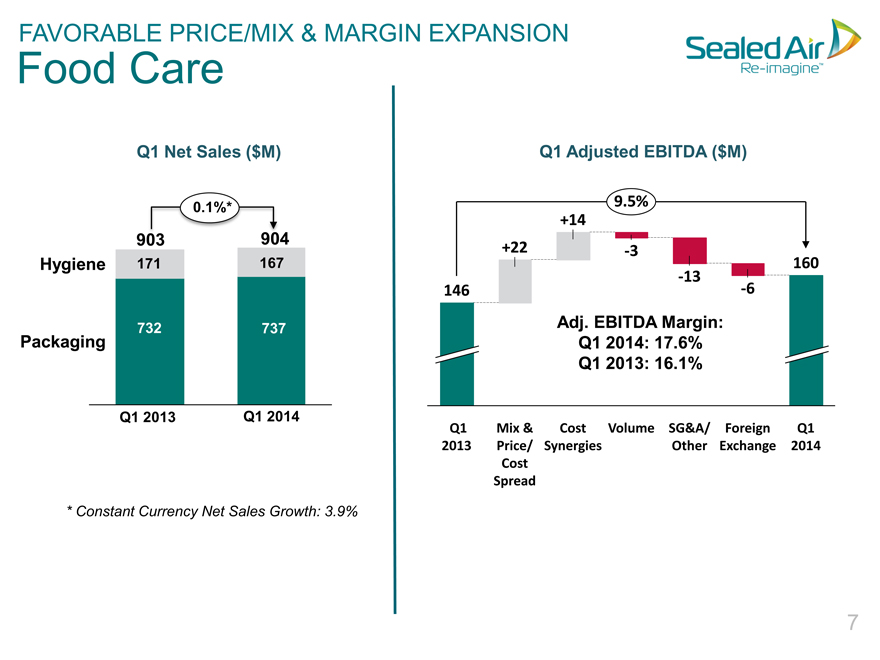
Food Care
Q1 Net Sales ($M)
0.1%*
Hygiene 171 167
732 737
Packaging
Q1 2013 Q1 2014
* Constant Currency Net Sales Growth: 3.9%
Q1 Adjusted EBITDA ($M)
9.5%
+14
+22 -3
160
-13
146 -6
Adj. EBITDA Margin:
Q1 2014: 17.6%
Q1 2013: 16.1%
Q1 Mix & Cost Volume SG&A/ Foreign Q1
2013 Price/ Synergies Other Exchange 2014
Cost
Spread
7
|
|
Sealed Air
Re-imagine TM
CUSTOMER MIX IMPROVING / MARGIN EXPANSION
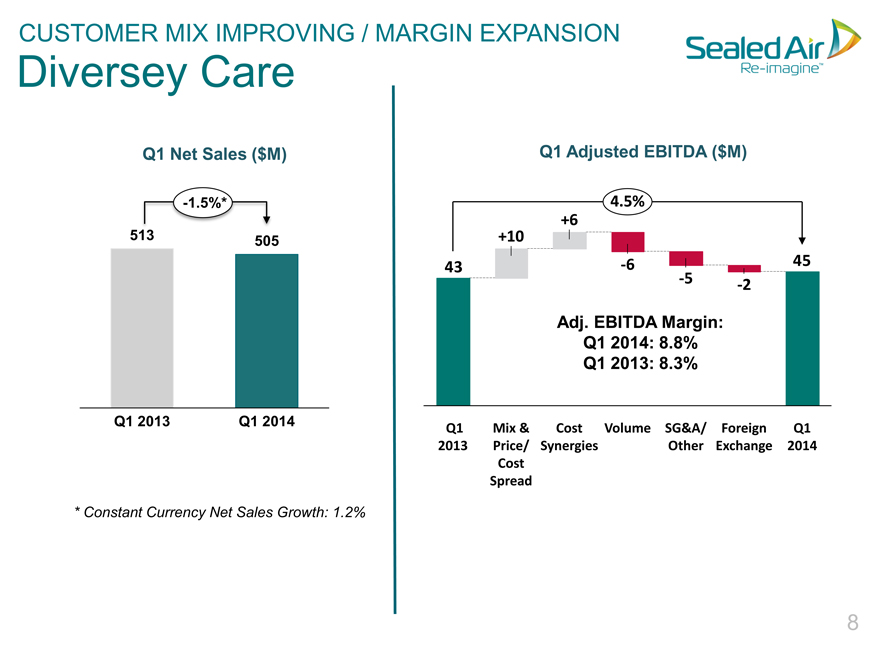
Diversey Care
Q1 Net Sales ($M)
-1.5%*
513 505
Q1 2013 Q1 2014
* Constant Currency Net Sales Growth: 1.2%
Q1 Adjusted EBITDA ($M)
4.5%
+6
+10
43 -6 45
-5 -2
Adj. EBITDA Margin:
Q1 2014: 8.8%
Q1 2013: 8.3%
Q1 Mix & Cost Volume SG&A/ Foreign Q1
2013 Price/ Synergies Other Exchange 2014
Cost
Spread
8
|
|
Sealed Air
Re-imagine TM
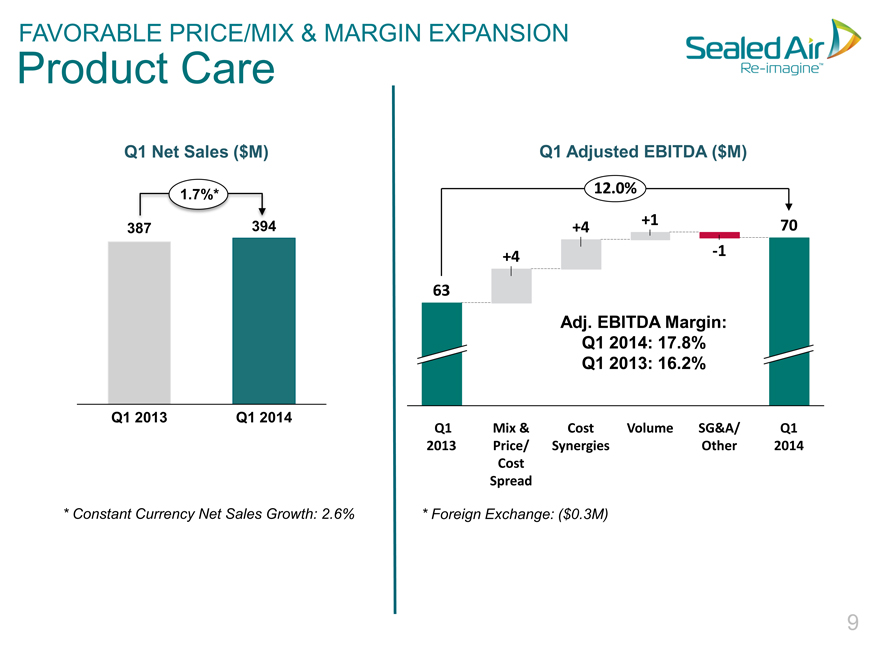
FAVORABLE PRICE/MIX & MARGIN EXPANSION
Product Care
Q1 Net Sales ($M)
1.7%*
387
Q1 2013 Q1 2014
* Constant Currency Net Sales Growth: 2.6%
Q1 Adjusted EBITDA ($M)
12.0%
+4 +1 70
+4 -1
63
Adj. EBITDA Margin:
Q1 2014: 17.8%
Q1 2013: 16.2%
Q1 Mix & Cost Volume SG&A/ Q1
2013 Price/ Synergies Other 2014
Cost
Spread
* Foreign Exchange: ($0.3M)
9
|
|
Sealed Air
Re-imagine TM
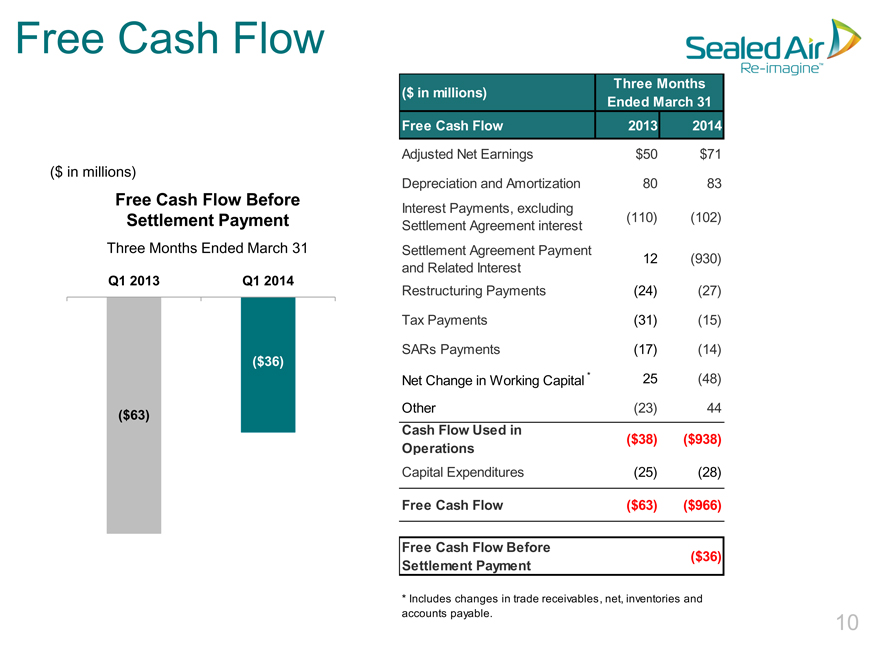
Free Cash Flow
($ in millions)
Free Cash Flow Before
Settlement Payment
Three Months Ended March 31
Q1 2013 Q1 2014
($36)
($63)
Three Months
($ in millions)
Ended March 31
Free Cash Flow 2013 2014
Adjusted Net Earnings $50 $71
Depreciation and Amortization 80 83
Interest Payments, excluding
Settlement Agreement interest(110)(102)
Settlement Agreement Payment 12(930)
and Related Interest
Restructuring Payments(24)(27)
Tax Payments(31)(15)
SARs Payments(17)(14)
Net Change in Working Capital * 25(48)
Other(23) 44
Cash Flow Used in
($38)($938)
Operations
Capital Expenditures(25)(28)
Free Cash Flow($63)($966)
Free Cash Flow Before
($36)
Settlement Payment
* Includes changes in trade receivables, net, inventories and
accounts payable. 10
|
|
Sealed Air
Re-imagine TM
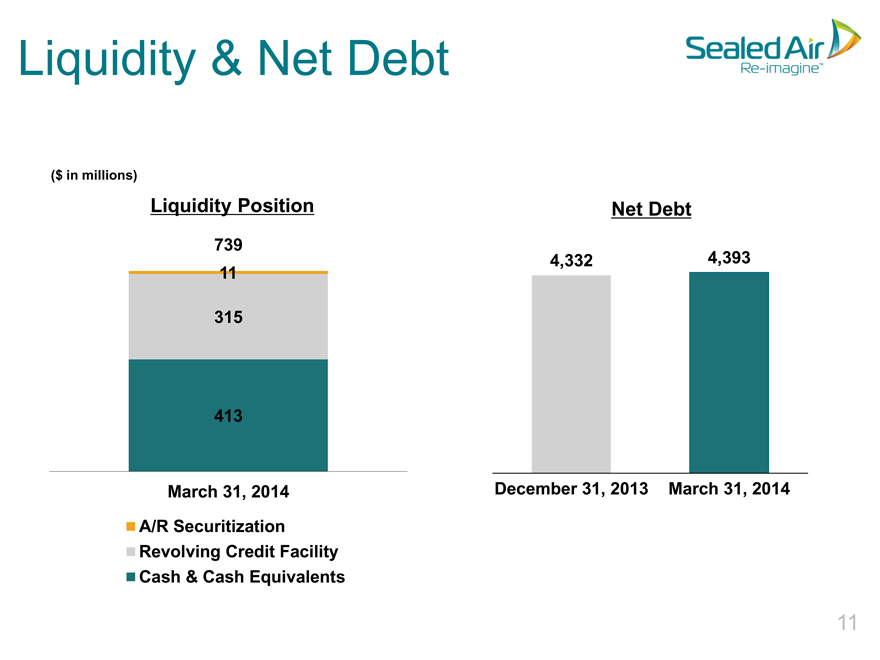
Liquidity & Net Debt
($ in millions)
Liquidity Position Net Debt
739
4,332 4,393
| 11 |
|
315
413
March 31, 2014 December 31, 2013 March 31, 2014
A/R Securitization
Revolving Credit Facility
Cash & Cash Equivalents
| 11 |
|
|
|

Sealed Air
Re-imagine TM
2014 Outlook
Net Sales: Approx. $7.7B
(Organic growth offset by rationalization and more than 2% unfavorable FX)
Adjusted EBITDA: High-end of $1.05B—$1.07B
(D&A: $315M; Interest Expense: $295M)
Adjusted EPS: $1.50 – $1.60
(Anticipated tax rate of approx. 27%)
Free Cash Flow: Increased to Approx. $425M
(Assumes: Approx. $170M capex, $150M cash restructuring and $280M cash interest expense)
Note: Adjusted EBITDA, EPS and D&A guidance excludes the impact of special items.
12
|
|
Q&A
Earnings Conference Call
First Quarter 2014
|
|
Appendix
|
|
Sealed Air
Re-imagine TM
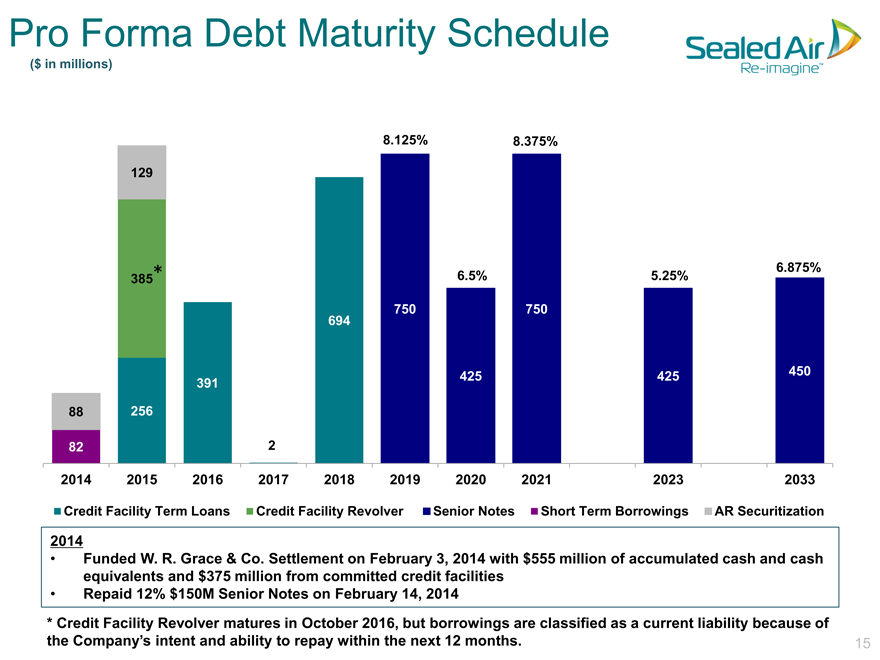
Pro Forma Debt Maturity Schedule
($ in millions)
8.125% 8.375%
129
385 * 6.5% 5.25% 6.875%
750 750
694
425 425 450
391
88 256
82 2
2014 2015 2016 2017 2018 2019 2020 2021 2023 2033
Credit Facility Term Loans Credit Facility Revolver Senior Notes Short Term Borrowings AR Securitization
2014
Funded W. R. Grace & Co. Settlement on February 3, 2014 with $555 million of accumulated cash and cash
equivalents and $375 million from committed credit facilities
Repaid 12% $150M Senior Notes on February 14, 2014
* Credit Facility Revolver matures in October 2016, but borrowings are classified as a current liability because of
the Company’s intent and ability to repay within the next 12 months. 15