Attached files
| file | filename |
|---|---|
| EX-31.A - EXHIBIT 31 (A) - POTASH CORP OF SASKATCHEWAN INC | d706867dex31a.htm |
| EX-31.B - EXHIBIT 31 (B) - POTASH CORP OF SASKATCHEWAN INC | d706867dex31b.htm |
| EX-32 - EXHIBIT 32 - POTASH CORP OF SASKATCHEWAN INC | d706867dex32.htm |
| EX-95 - EXHIBIT 95 - POTASH CORP OF SASKATCHEWAN INC | d706867dex95.htm |
| 10-Q - FORM 10-Q COURTESY PDF - POTASH CORP OF SASKATCHEWAN INC | d706867d10q1.pdf |
UNITED STATES SECURITIES AND EXCHANGE COMMISSION
Washington, D.C. 20549
Form 10-Q
| þ | QUARTERLY REPORT PURSUANT TO SECTION 13 OR 15(d) OF THE SECURITIES EXCHANGE ACT OF 1934 |
For the Quarterly Period Ended March 31, 2014
OR
| ¨ | TRANSITION REPORT PURSUANT TO SECTION 13 OR 15(d) OF THE SECURITIES EXCHANGE ACT OF 1934 |
Commission File Number 1-10351
Potash Corporation of Saskatchewan Inc.
(Exact name of registrant as specified in its charter)
| Canada | N/A | |
| (State or other jurisdiction of incorporation or organization) |
(I.R.S. Employer Identification No.) | |
| 122 — 1st Avenue South Saskatoon, Saskatchewan, Canada (Address of principal executive offices) |
S7K 7G3 (Zip Code) | |
306-933-8500
(Registrant’s telephone number, including area code)
Indicate by check mark whether the registrant (1) has filed all reports required to be filed by Sections 13 or 15(d) of the Securities Exchange Act of 1934 during the preceding 12 months (or for such shorter period that the registrant was required to file such reports), and (2) has been subject to such filing requirements for the past 90 days.
Yes þ No ¨
Indicate by check mark whether the registrant has submitted electronically and posted on its corporate Web site, if any, every Interactive Data File required to be submitted and posted pursuant to Rule 405 of Regulation S-T during the preceding 12 months (or for such shorter period that the registrant was required to submit and post such files).
Yes ¨ No ¨
Indicate by check mark whether the registrant is a large accelerated filer, an accelerated filer, a non-accelerated filer, or a smaller reporting company. See the definitions of “large accelerated filer,” “accelerated filer” and “smaller reporting company” in Rule 12b-2 of the Exchange Act. (Check one):
| Large accelerated filer þ | Accelerated filer ¨ | Non-accelerated filer ¨ | Smaller reporting company ¨ | |||
| (Do not check if a smaller reporting company) |
Indicate by check mark whether the registrant is a shell company (as defined in Exchange Act Rule 12b-2).
Yes ¨ No þ
As at April 10, 2014, Potash Corporation of Saskatchewan Inc. had 845,857,381 Common Shares outstanding.
Part I. Financial Information
Item 1. Financial Statements
Potash Corporation of Saskatchewan Inc.
Condensed Consolidated Statements of Financial Position
(in millions of US dollars)
(unaudited)
| As at | March 31, 2014 |
December 31, 2013 |
||||||
| Assets |
||||||||
| Current assets |
||||||||
| Cash and cash equivalents |
$ | 533 | $ | 628 | ||||
| Receivables |
905 | 752 | ||||||
| Inventories (Note 2) |
716 | 728 | ||||||
| Prepaid expenses and other current assets |
60 | 81 | ||||||
| 2,214 | 2,189 | |||||||
| Non-current assets |
||||||||
| Property, plant and equipment |
12,209 | 12,233 | ||||||
| Investments in equity-accounted investees |
1,310 | 1,276 | ||||||
| Available-for-sale investments (Note 3) |
1,734 | 1,722 | ||||||
| Other assets |
371 | 401 | ||||||
| Intangible assets |
138 | 137 | ||||||
| Total Assets |
$ | 17,976 | $ | 17,958 | ||||
| Liabilities |
||||||||
| Current liabilities |
||||||||
| Short-term debt and current portion of long-term debt (Note 4) |
$ | 496 | $ | 967 | ||||
| Payables and accrued charges |
1,054 | 1,104 | ||||||
| Current portion of derivative instrument liabilities |
39 | 42 | ||||||
| 1,589 | 2,113 | |||||||
| Non-current liabilities |
||||||||
| Long-term debt (Note 4) |
3,709 | 2,970 | ||||||
| Derivative instrument liabilities |
123 | 129 | ||||||
| Deferred income tax liabilities |
2,046 | 2,013 | ||||||
| Pension and other post-retirement benefit liabilities |
415 | 410 | ||||||
| Asset retirement obligations and accrued environmental costs |
583 | 557 | ||||||
| Other non-current liabilities and deferred credits |
140 | 138 | ||||||
| Total Liabilities |
8,605 | 8,330 | ||||||
| Shareholders’ Equity |
||||||||
| Share capital (Note 5) |
1,611 | 1,600 | ||||||
| Contributed surplus |
230 | 219 | ||||||
| Accumulated other comprehensive income |
730 | 673 | ||||||
| Retained earnings |
6,800 | 7,136 | ||||||
| Total Shareholders’ Equity |
9,371 | 9,628 | ||||||
| Total Liabilities and Shareholders’ Equity |
$ | 17,976 | $ | 17,958 | ||||
(See Notes to the Condensed Consolidated Financial Statements)
| 1 | PotashCorp 2014 First Quarter Quarterly Report on Form 10-Q |
Potash Corporation of Saskatchewan Inc.
Condensed Consolidated Statements of Income
(in millions of US dollars except per-share amounts)
(unaudited)
| Three Months Ended March 31 | ||||||||
| 2014 | 2013 | |||||||
| Sales (Note 6) |
$ | 1,680 | $ | 2,100 | ||||
| Freight, transportation and distribution |
(166 | ) | (149 | ) | ||||
| Cost of goods sold |
(949 | ) | (1,084 | ) | ||||
| Gross Margin |
565 | 867 | ||||||
| Selling and administrative expenses |
(68 | ) | (66 | ) | ||||
| Provincial mining and other taxes |
(54 | ) | (63 | ) | ||||
| Share of earnings of equity-accounted investees |
33 | 80 | ||||||
| Dividend income |
69 | — | ||||||
| Impairment of available-for-sale investment (Note 3) |
(38 | ) | — | |||||
| Other income (expenses) |
24 | (1 | ) | |||||
| Operating Income |
531 | 817 | ||||||
| Finance costs |
(47 | ) | (35 | ) | ||||
| Income Before Income Taxes |
484 | 782 | ||||||
| Income taxes (Note 7) |
(144 | ) | (226 | ) | ||||
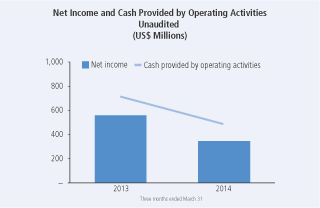
| Net Income |
$ | 340 | $ | 556 | ||||
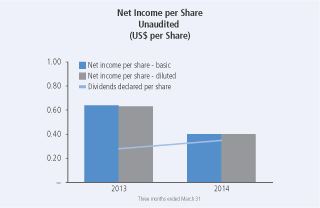
| Net Income per Share (Note 8) |
||||||||
| Basic |
$ | 0.40 | $ | 0.64 | ||||
| Diluted |
$ | 0.40 | $ | 0.63 | ||||
| Dividends Declared per Share |
$ | 0.35 | $ | 0.28 | ||||
(See Notes to the Condensed Consolidated Financial Statements)
| PotashCorp 2014 First Quarter Quarterly Report on Form 10-Q | 2 |
Potash Corporation of Saskatchewan Inc.
Condensed Consolidated Statements of Comprehensive Income
(in millions of US dollars)
(unaudited)
| Three Months Ended March 31 | ||||||||
| (Net of related income taxes) | 2014 | 2013 | ||||||
| Net Income |
$ | 340 | $ | 556 | ||||
| Other comprehensive income |
||||||||
| Items that have been or may be subsequently reclassified to net income: |
||||||||
| Available-for-sale investments(1) |
||||||||
| Net fair value gain during the period |
50 | 186 | ||||||
| Cash flow hedges |
||||||||
| Net fair value loss during the period(2) |
(1 | ) | — | |||||
| Reclassification to income of net loss(3) |
6 | 11 | ||||||
| Other |
2 | — | ||||||
| Other Comprehensive Income |
57 | 197 | ||||||
| Comprehensive Income |
$ | 397 | $ | 753 | ||||
| (1) | Available-for-sale investments are comprised of shares in Israel Chemicals Ltd. and Sinofert Holdings Limited. |
| (2) | Cash flow hedges are comprised of natural gas derivative instruments and were net of income taxes of $1 (2013 — $NIL). |
| (3) | Net of income taxes of $(4) (2013 — $(6)). |
(See Notes to the Condensed Consolidated Financial Statements)
| 3 | PotashCorp 2014 First Quarter Quarterly Report on Form 10-Q |
Potash Corporation of Saskatchewan Inc.
Condensed Consolidated Statements of Cash Flow
(in millions of US dollars)
(unaudited)
| Three Months Ended March 31 | ||||||||
| 2014 | 2013 | |||||||
| Operating Activities |
||||||||
| Net income |
$ | 340 | $ | 556 | ||||
| Adjustments to reconcile net income to cash provided by operating activities |
||||||||
| Depreciation and amortization |
176 | 154 | ||||||
| Share-based compensation |
15 | 16 | ||||||
| Net undistributed earnings of equity-accounted investees |
(31 | ) | (77 | ) | ||||
| Impairment of available-for-sale investment (Note 3) |
38 | — | ||||||
| Provision for deferred income tax |
46 | 102 | ||||||
| Pension and other post-retirement benefits |
9 | (31 | ) | |||||
| Other long-term liabilities and miscellaneous |
9 | 16 | ||||||
| Subtotal of adjustments |
262 | 180 | ||||||
| Changes in non-cash operating working capital |
||||||||
| Receivables |
(158 | ) | (104 | ) | ||||
| Inventories |
20 | 47 | ||||||
| Prepaid expenses and other current assets |
18 | 1 | ||||||
| Payables and accrued charges |
57 | 58 | ||||||
| Subtotal of changes in non-cash operating working capital |
(63 | ) | 2 | |||||
| Cash provided by operating activities |
539 | 738 | ||||||
| Investing Activities |
||||||||
| Additions to property, plant and equipment |
(224 | ) | (496 | ) | ||||
| Other assets and intangible assets |
(2 | ) | (5 | ) | ||||
| Cash used in investing activities |
(226 | ) | (501 | ) | ||||
| Financing Activities |
||||||||
| Proceeds from long-term debt obligations |
737 | — | ||||||
| Repayment of long-term debt obligations |
— | (250 | ) | |||||
| (Repayment of) proceeds from short-term debt obligations |
(470 | ) | 211 | |||||
| Dividends |
(293 | ) | (177 | ) | ||||
| Repurchase of common shares |
(396 | ) | — | |||||
| Issuance of common shares |
14 | 2 | ||||||
| Cash used in financing activities |
(408 | ) | (214 | ) | ||||
| (Decrease) Increase in Cash and Cash Equivalents |
(95 | ) | 23 | |||||
| Cash and Cash Equivalents, Beginning of Period |
628 | 562 | ||||||
| Cash and Cash Equivalents, End of Period |
$ | 533 | $ | 585 | ||||
| Cash and cash equivalents comprised of: |
||||||||
| Cash |
$ | 134 | $ | 103 | ||||
| Short-term investments |
399 | 482 | ||||||
| $ | 533 | $ | 585 | |||||
| Supplemental cash flow disclosure |
||||||||
| Interest paid |
$ | 24 | $ | 9 | ||||
| Income taxes paid |
$ | 50 | $ | 55 | ||||
(See Notes to the Condensed Consolidated Financial Statements)
| PotashCorp 2014 First Quarter Quarterly Report on Form 10-Q | 4 |
Potash Corporation of Saskatchewan Inc.
Condensed Consolidated Statements of Changes in Equity
(in millions of US dollars)
(unaudited)
| Accumulated Other Comprehensive Income | ||||||||||||||||||||||||||||||||
| Share Capital |
Contributed Surplus |
Net unrealized gain on available-for- sale investments |
Net loss on derivatives designated as cash flow hedges |
Other | Total Accumulated Other Comprehensive Income |
Retained Earnings |
Total Equity(1) |
|||||||||||||||||||||||||
| Balance — December 31, 2013 |
$ | 1,600 | $ | 219 | $ | 780 | $ | (105 | ) | $ | (2 | ) | $ | 673 | $ | 7,136 | $ | 9,628 | ||||||||||||||
| Net income |
— | — | — | — | — | — | 340 | 340 | ||||||||||||||||||||||||
| Other comprehensive income |
— | — | 50 | 5 | 2 | 57 | — | 57 | ||||||||||||||||||||||||
| Share repurchase (Note 5) |
(21 | ) | (1 | ) | — | — | — | — | (377 | ) | (399 | ) | ||||||||||||||||||||
| Dividends declared |
— | — | — | — | — | — | (299 | ) | (299 | ) | ||||||||||||||||||||||
| Effect of share-based compensation including issuance of common shares |
22 | 12 | — | — | — | — | — | 34 | ||||||||||||||||||||||||
| Shares issued for dividend reinvestment plan |
10 | — | — | — | — | — | — | 10 | ||||||||||||||||||||||||
| Balance — March 31, 2014 |
$ | 1,611 | $ | 230 | $ | 830 | $ | (100 | ) | $ | — | $ | 730 | $ | 6,800 | $ | 9,371 | |||||||||||||||
| Balance — December 31, 2012 |
$ | 1,543 | $ | 299 | $ | 1,539 | $ | (138 | ) | $ | (2 | ) | $ | 1,399 | $ | 6,671 | $ | 9,912 | ||||||||||||||
| Net income |
— | — | — | — | — | — | 556 | 556 | ||||||||||||||||||||||||
| Other comprehensive income |
— | — | 186 | 11 | — | 197 | — | 197 | ||||||||||||||||||||||||
| Dividends declared |
— | — | — | — | — | — | (242 | ) | (242 | ) | ||||||||||||||||||||||
| Effect of share-based compensation including issuance of common shares |
3 | 12 | — | — | — | — | — | 15 | ||||||||||||||||||||||||
| Shares issued for dividend reinvestment plan |
4 | — | — | — | — | — | — | 4 | ||||||||||||||||||||||||
| Balance — March 31, 2013 |
$ | 1,550 | $ | 311 | $ | 1,725 | $ | (127 | ) | $ | (2 | ) | $ | 1,596 | $ | 6,985 | $ | 10,442 | ||||||||||||||
| (1) | All equity transactions were attributable to common shareholders. |
(See Notes to the Condensed Consolidated Financial Statements)
| 5 | PotashCorp 2014 First Quarter Quarterly Report on Form 10-Q |
Potash Corporation of Saskatchewan Inc.
Notes to the Condensed Consolidated Financial Statements
For the Three Months Ended March 31, 2014
(in millions of US dollars except as otherwise noted)
(unaudited)
Standards, amendments and interpretations effective and applied
The International Accounting Standards Board (“IASB”) and International Financial Reporting Interpretations Committee (“IFRIC”) have issued the following standards and amendments or interpretations to existing standards that were effective and applied by the company.
| Standard | Description | Impact | ||
| Amendments to IAS 32, Offsetting Financial Assets and Financial Liabilities | Issued as part of the IASB’s offsetting project, amendments clarify certain items regarding offsetting financial assets and financial liabilities. | Adopted retrospectively effective January 1, 2014 with no change to the company’s consolidated financial statements. | ||
| Amendments to IAS 36, Recoverable Amount Disclosures for Non-Financial Assets | Amendments were issued that clarify disclosure requirements for the recoverable amount of an asset or CGU. | Adopted retrospectively effective January 1, 2014 with no change to the company’s consolidated financial statements. | ||
| IFRIC 21, Levies | Provides guidance on when to recognize a liability for a levy imposed by a government. | Adopted retrospectively effective January 1, 2014 with no change to the company’s consolidated financial statements. |
Standards, amendments and interpretations not yet effective and not applied
The IASB and IFRIC have issued the following standards and amendments or interpretations to existing standards that were not yet effective and not applied at March 31, 2014. The company does not anticipate early adoption of these standards at this time.
| Standard | Description | Impact | Effective Date(1) | |||
| Amendments to IAS 19, Employee Benefits | Issued to simplify the accounting for employee or third-party contributions to defined benefit plans that are independent of the number of years of employee service. | The company is reviewing the standard to determine the potential impact, if any. | July 1, 2014, applied retrospectively. |
| (1) | Effective date for annual periods beginning on or after the stated date. |
| PotashCorp 2014 First Quarter Quarterly Report on Form 10-Q | 6 |
| Standard | Description | Impact | Effective Date(1) | |||
| IFRS 9, Financial Instruments | Initially issued guidance on the classification and measurement of financial assets. Additional guidance was issued on the classification and measurement of financial liabilities. Additional amendments were issued which introduce a new hedge accounting model and modify the requirements for transition from IAS 39 to IFRS 9. | The company is reviewing the standard to determine the potential impact, if any. | January 1, 2018 (tentative). |
| (1) | Effective date for annual periods beginning on or after the stated date. |
2. Inventories
| March 31, 2014 |
December 31, 2013 |
|||||||
| Finished products |
$ | 335 | $ | 340 | ||||
| Intermediate products |
90 | 85 | ||||||
| Raw materials |
81 | 101 | ||||||
| Materials and supplies |
210 | 202 | ||||||
| $ | 716 | $ | 728 | |||||
3. Available-for-Sale Investments
The company assesses at the end of each reporting period whether there is objective evidence of impairment. A significant or prolonged decline in the fair value of the investment below its cost would be evidence that the asset is impaired. If objective evidence of impairment exists, the impaired amount (i.e., the unrealized loss) is recognized in net income; any subsequent reversals would be recognized in other comprehensive income (“OCI”) and would not flow back into net income. Any subsequent decline in fair value below the carrying amount at the impairment date would represent a further impairment to be recognized in net income.
During 2012, the company concluded its investment in Sinofert Holdings Limited (“Sinofert”) was impaired due to the significance by which fair value was below cost. As a result, an impairment loss of $341 was recognized in net income during 2012. At March 31, 2014, the company concluded its investment in Sinofert was further impaired due to the fair value declining below the carrying amount of $238 at the previous impairment date. As a result, an impairment loss of $38 was recognized in net income during the three months ended March 31, 2014. The fair value was determined through the market value of Sinofert shares on the Hong Kong Stock Exchange.
Changes in fair value, and related accounting, for the company’s investment in Sinofert since December 31, 2013 were as follows:
| Impact of Unrealized Loss on: | ||||||||||||||||
| Fair Value | Unrealized Loss |
OCI and AOCI | Net Income and Retained Earnings |
|||||||||||||
| Balance — December 31, 2013 |
$ | 254 | $ | (325 | ) | $ | 16 | $ | (341 | ) | ||||||
| Decrease in fair value and recognition of impairment |
(54 | ) | (54 | ) | (16 | ) | (38 | ) | ||||||||
| Balance — March 31, 2014 |
$ | 200 | $ | (379 | ) | $ | — | $ | (379 | ) | ||||||
4. Long-Term Debt
On March 7, 2014, the company closed the issuance of $750 of 3.625 percent senior notes due March 15, 2024. The senior notes were issued under a US shelf registration statement.
On March 7, 2014, the company issued a notice of redemption for all of its outstanding $500 of 5.250 percent senior notes due May 15, 2014. On April 7, 2014, the company completed the redemption of all $500 of the senior notes at a redemption price of 100.497 percent of the principal amount of the notes redeemed plus accrued interest.
| 7 | PotashCorp 2014 First Quarter Quarterly Report on Form 10-Q |
5. Share Capital
Authorized
The company is authorized to issue an unlimited number of common shares without par value and an unlimited number of first preferred shares. The common shares are not redeemable or convertible. The first preferred shares may be issued in one or more series with rights and conditions to be determined by the Board of Directors. No first preferred shares have been issued.
Issued
| Number of Common Shares |
Consideration | |||||||
| Balance — December 31, 2013 |
856,116,325 | $ | 1,600 | |||||
| Issued under option plans |
1,140,850 | 22 | ||||||
| Issued for dividend reinvestment plan |
321,006 | 10 | ||||||
| Repurchased |
(11,722,000 | ) | (21 | ) | ||||
| Balance — March 31, 2014 |
845,856,181 | $ | 1,611 | |||||
Share Repurchase Program
On July 24, 2013, the company’s Board of Directors authorized a share repurchase program of up to 5 percent of PotashCorp’s outstanding common shares (up to $2,000 of its outstanding common shares) through a normal course issuer bid. Shares may be repurchased from time to time on the open market commencing August 2, 2013 through August 1, 2014 at prevailing market prices. The timing and amount of purchases under the program are dependent upon the availability and alternative uses of capital, market conditions, applicable US and Canadian regulations and other factors.
Under this program, the company repurchased for cancellation 11,722,000 common shares during the three months ended March 31, 2014, at a cost of $399 and an average price per share of $34.00. The repurchase resulted in a reduction of share capital of $21, and the excess of net cost over the average book value of the shares was recorded as a reduction of contributed surplus of $1 and a reduction of retained earnings of $377.
6. Segment Information
The company has three reportable operating segments: potash, nitrogen and phosphate. These reportable operating segments are differentiated by the chemical nutrient contained in the product that each produces. Inter-segment sales are made under terms that approximate market value. The accounting policies of the segments are the same as those described in Note 1 and are measured in a manner consistent with that of the financial statements. The company’s operating segments have been determined based on reports reviewed by the Chief Executive Officer, its chief operating decision-maker, that are used to make strategic decisions.
| Three Months Ended March 31, 2014 | ||||||||||||||||||||
| Potash | Nitrogen | Phosphate | All Others | Consolidated | ||||||||||||||||
| Sales — third party |
$ | 671 | $ | 581 | $ | 428 | $ | — | $ | 1,680 | ||||||||||
| Freight, transportation and distribution — third party |
(86 | ) | (31 | ) | (49 | ) | — | (166 | ) | |||||||||||
| Net sales — third party |
585 | 550 | 379 | — | ||||||||||||||||
| Cost of goods sold — third party |
(285 | ) | (323 | ) | (341 | ) | — | (949 | ) | |||||||||||
| Margin (cost) on inter-segment sales(1) |
— | 12 | (12 | ) | — | — | ||||||||||||||
| Gross margin |
300 | 239 | 26 | — | 565 | |||||||||||||||
| Depreciation and amortization |
(52 | ) | (42 | ) | (78 | ) | (4 | ) | (176 | ) | ||||||||||
| Assets |
9,365 | 2,247 | 2,444 | 3,920 | 17,976 | |||||||||||||||
| Cash flows for additions to property, plant and equipment |
124 | 67 | 31 | 2 | 224 | |||||||||||||||
| (1) | Inter-segment net sales were $25. |
| PotashCorp 2014 First Quarter Quarterly Report on Form 10-Q | 8 |
| Three Months Ended March 31, 2013 | ||||||||||||||||||||
| Potash | Nitrogen | Phosphate | All Others | Consolidated | ||||||||||||||||
| Sales — third party |
$ | 885 | $ | 659 | $ | 556 | $ | — | $ | 2,100 | ||||||||||
| Freight, transportation and distribution — third party |
(71 | ) | (25 | ) | (53 | ) | — | (149 | ) | |||||||||||
| Net sales — third party |
814 | 634 | 503 | — | ||||||||||||||||
| Cost of goods sold — third party |
(310 | ) | (381 | ) | (393 | ) | — | (1,084 | ) | |||||||||||
| Margin (cost) on inter-segment sales(1) |
— | 18 | (18 | ) | — | — | ||||||||||||||
| Gross margin |
504 | 271 | 92 | — | 867 | |||||||||||||||
| Depreciation and amortization |
(41 | ) | (38 | ) | (71 | ) | (4 | ) | (154 | ) | ||||||||||
| Assets |
8,826 | 2,256 | 2,546 | 5,035 | 18,663 | |||||||||||||||
| Cash flows for additions to property, plant and equipment |
349 | 45 | 65 | 37 | 496 | |||||||||||||||
| (1) | Inter-segment net sales were $45. |
7. Income Taxes
A separate estimated average annual effective tax rate was determined for each taxing jurisdiction and applied individually to the interim period pre-tax income of each jurisdiction.
| Three Months Ended March 31 | ||||||||
| 2014 | 2013 | |||||||
| Income tax expense |
$ | 144 | $ | 226 | ||||
| Actual effective tax rate on ordinary earnings |
27% | 27% | ||||||
| Actual effective tax rate including discrete items |
30% | 29% | ||||||
| Discrete tax adjustments that impacted the tax rate |
$ | 2 | $ | 19 | ||||
Significant items to note include the following:
| Ÿ | In first-quarter 2014, a non-tax deductible impairment of the company’s available-for-sale investment in Sinofert was recorded. This increased the actual effective tax rate including discrete items by 2 percent. |
| Ÿ | In first-quarter 2013, a tax expense of $15 was recorded to adjust the 2012 income tax provision. |
Income tax balances within the condensed consolidated statements of financial position were comprised of the following:
| Income Tax Assets (Liabilities) | Statements of Financial Position Location | March 31, 2014 |
December 31, 2013 |
|||||||
| Current income tax assets |
||||||||||
| Current |
Receivables | $ | 86 | $ | 90 | |||||
| Non-current |
Other assets | 125 | 126 | |||||||
| Deferred income tax assets |
Other assets | 8 | 21 | |||||||
| Total income tax assets |
$ | 219 | $ | 237 | ||||||
| Current income tax liabilities |
||||||||||
| Current |
Payables and accrued charges | $ | (38 | ) | $ | (3 | ) | |||
| Non-current |
Other non-current liabilities and deferred credits | (137 | ) | (135 | ) | |||||
| Deferred income tax liabilities |
Deferred income tax liabilities | (2,046 | ) | (2,013 | ) | |||||
| Total income tax liabilities |
$ | (2,221 | ) | $ | (2,151 | ) | ||||
| 9 | PotashCorp 2014 First Quarter Quarterly Report on Form 10-Q |
8. Net Income per Share
Net income per share was calculated on the following weighted average number of shares:
| Three Months Ended March 31 |
||||||||
| 2014 | 2013 | |||||||
| Basic |
852,919,000 | 865,056,000 | ||||||
| Diluted |
859,675,000 | 876,672,000 | ||||||
Diluted net income per share was calculated based on the weighted average number of shares issued and outstanding during the period, incorporating the following adjustments. The denominator was: (1) increased by the total of the additional common shares that would have been issued assuming exercise of all stock options with exercise prices at or below the average market price for the period; and (2) decreased by the number of shares that the company could have repurchased if it had used the assumed proceeds from the exercise of stock options to repurchase them on the open market at the average share price for the period. For performance-based stock option plans, the number of contingently issuable common shares included in the calculation was based on the number of shares, if any, that would be issuable if the end of the reporting period were the end of the performance period and the effect were dilutive.
Options excluded from the calculation of diluted net income per share due to the options’ exercise prices being greater than the average market price of common shares were as follows:
| Three Months Ended March 31, 2014 | ||
| Weighted average number of options |
5,030,350 | |
| Performance Option Plan years excluded, in whole or in part |
2008 through 2012 |
9. Financial Instruments
Fair Value
Estimated fair values for financial instruments are designed to approximate amounts at which the instruments could be exchanged in a current arm’s-length transaction between knowledgeable willing parties. The valuation policies and procedures for financial reporting purposes are determined by the company’s finance department.
Due to their short-term nature, the fair value of cash and cash equivalents, receivables, short-term debt, and payables and accrued charges was assumed to approximate carrying value. The company’s derivative instruments and investments in Israel Chemicals Ltd. (“ICL”) and Sinofert were carried at fair value. The fair value of derivative instruments that are not traded in an active market (such as natural gas swaps and foreign currency derivatives) was determined using valuation techniques. The company used a variety of methods and made assumptions that were based on market conditions existing at each reporting date.
The fair value of foreign currency derivatives was determined using quoted forward exchange rates (Level 2) at the statements of financial position dates.
| PotashCorp 2014 First Quarter Quarterly Report on Form 10-Q | 10 |
The fair value of the company’s senior notes at March 31, 2014 reflected the yield valuation based on observed market prices (Level 1), which ranged from 0.62 percent to 4.74 percent (December 31, 2013 — 0.50 percent to 5.25 percent). The fair value of the company’s other long-term debt instruments approximated carrying value. Presented below is a comparison of the fair value of the company’s senior notes to their carrying values.
| March 31, 2014 | December 31, 2013 | |||||||||||||||
|
Carrying Amount of Liability |
Fair Value of Liability |
Carrying Amount of Liability |
Fair Value of Liability |
|||||||||||||
| Long-term debt senior notes |
$ | 4,250 | $ | 4,605 | $ | 3,500 | $ | 3,791 | ||||||||
The following table presents the company’s fair value hierarchy for financial assets and financial liabilities carried at fair value on a recurring basis.
| Fair Value Measurements at Reporting Date Using: | ||||||||||||||||
| Carrying Amount of Asset (Liability) |
Quoted Prices in Active Markets for Identical Assets (Level 1)(1) |
Significant Other (Level 2)(1,2) |
Significant (Level 3)(2) |
|||||||||||||
| March 31, 2014 |
||||||||||||||||
| Derivative instrument assets |
||||||||||||||||
| Natural gas derivatives |
$ | 10 | $ | — | $ | (1 | ) | $ | 11 | |||||||
| Investments in ICL and Sinofert |
1,734 | 1,734 | — | — | ||||||||||||
| Derivative instrument liabilities |
||||||||||||||||
| Natural gas derivatives |
(162 | ) | — | (17 | ) | (145 | ) | |||||||||
| December 31, 2013 |
||||||||||||||||
| Derivative instrument assets |
||||||||||||||||
| Natural gas derivatives |
$ | 8 | $ | — | $ | — | $ | 8 | ||||||||
| Investments in ICL and Sinofert |
1,722 | 1,722 | — | — | ||||||||||||
| Derivative instrument liabilities |
||||||||||||||||
| Natural gas derivatives |
(170 | ) | — | (21 | ) | (149 | ) | |||||||||
| Foreign currency derivatives |
(1 | ) | — | (1 | ) | — | ||||||||||
| (1) | During the three months ended March 31, 2014 and twelve months ended December 31, 2013, there were no transfers between Level 1 and Level 2. |
| (2) | During the three months ended March 31, 2014, there were no transfers into or out of Level 3. During the twelve months ended December 31, 2013, there were no transfers into Level 3 and $14 of losses was transferred out of Level 3 into Level 2 as (due to the passage of time) the terms of certain natural gas derivatives now matured within 36 months. The company’s policy is to recognize transfers at the end of the reporting period. |
| 11 | PotashCorp 2014 First Quarter Quarterly Report on Form 10-Q |
The following table presents a reconciliation of the beginning and ending balances of the company’s fair value measurements using significant unobservable inputs (Level 3):
| Natural Gas Derivatives | ||||||||
| Three Months Ended March 31, 2014 |
Twelve Months Ended December 31, 2013 |
|||||||
| Balance, beginning of period |
$ | (141 | ) | $ | (191 | ) | ||
| Total (losses) gains (realized and unrealized) before income taxes |
||||||||
| Included in net income (cost of goods sold) |
(5 | ) | (27 | ) | ||||
| Included in other comprehensive income |
4 | 27 | ||||||
| Purchases |
— | — | ||||||
| Sales |
— | — | ||||||
| Issues |
— | — | ||||||
| Settlements |
8 | 36 | ||||||
| Transfers of losses out of Level 3 |
— | 14 | ||||||
| Balance, end of period |
$ | (134 | ) | $ | (141 | ) | ||
| Gains (losses) for the period included in net income (cost of goods sold) were: |
||||||||
| Change in unrealized gains (losses) relating to instruments still held at the reporting date |
$ | — | $ | — | ||||
| Total losses (realized and unrealized) |
(5 | ) | (27 | ) | ||||
| PotashCorp 2014 First Quarter Quarterly Report on Form 10-Q | 12 |
| 13 | PotashCorp 2014 First Quarter Quarterly Report on Form 10-Q |
| PotashCorp 2014 First Quarter Quarterly Report on Form 10-Q | 14 |
Key Performance Drivers — Performance Compared to Targets
Through our integrated value model, we set, evaluate and refine our goals and priorities to drive improvements that benefit all those impacted by our business. We demonstrate our accountability by tracking and reporting our progress against targets related to each goal. Our long-term goals and 2014 targets are set out on pages 40 to 50 of our 2013 Annual Integrated Report. A summary of our progress against selected goals and representative annual targets is set out below.
| Goal | Representative 2014 Annual Target |
Performance to March 31, 2014 | ||
| Create superior long-term shareholder value. | Exceed total shareholder return performance for our sector and the DAXglobal Agribusiness Index. | PotashCorp’s total shareholder return was 11 percent in the first three months of 2014 compared to our sector’s weighted average return (based on market capitalization) of 6 percent and the DAXglobal Agribusiness Index weighted average return (based on market capitalization) of 1 percent. | ||
| Be the supplier of choice to the markets we serve. | Reduce domestic potash net rail cycle time through the Chicago corridor by 10 percent in 2014, compared to 2011 levels. | Severe and prolonged winter weather throughout Canada and the United States, combined with increased rail shipments for grain and other commodities, impacted service for all rail customers. Our first quarter 2014 net rail cycle time through the Chicago corridor was 49 percent above the benchmark 2011 first quarter and 48 percent above the average of the prior three first quarter periods. We are seeing service improvements in the second quarter but backlogs persist for all rail shippers and we do not anticipate a quick return to historical net cycle times. | ||
| Attract and retain talented, motivated and productive employees who are committed to our long-term goals. | Fill 75 percent of senior staff openings with qualified internal candidates. | The percentage of senior staff positions filled internally in the first three months of 2014 was 100 percent. | ||
| Achieve no harm to people. | Achieve zero life-altering injuries at our sites. | Tragically, we had a fatality at our Cory potash facility during the first quarter of 2014. | ||
|
Reduce total site recordable injury rate to 0.95 (per 200,000 hours worked) or lower. |
During the first three months of 2014, total site recordable injury rate was 1.06. | |||
| Achieve no damage to the environment. | Reduce total reportable incidents (releases, permit excursions and spills) by 15 percent from 2013 levels. | Annualized total reportable incidents were up 18 percent during the first three months of 2014 compared to 2013 annual levels. Compared to the first three months of 2013, total reportable incidents were down 29 percent. |
| 15 | PotashCorp 2014 First Quarter Quarterly Report on Form 10-Q |
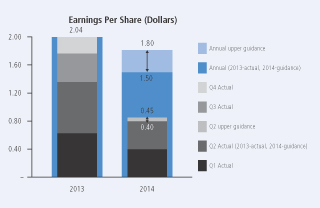
Earnings Guidance — First Quarter 2014
| Company Guidance | Actual Results | |||||
| Earnings per share |
$ 0.30 – $ 0.35 | $ | 0.40 | |||
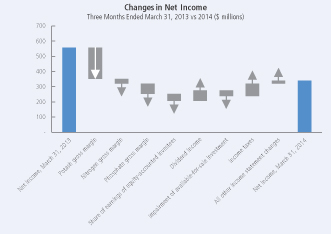
Overview of Actual Results
| Three Months Ended March 31 | ||||||||||||||||
| Dollars (millions) — except per-share amounts | 2014 | 2013 | Change | % Change | ||||||||||||
| Sales |
$ | 1,680 | $ | 2,100 | $ | (420 | ) | (20 | ) | |||||||
| Gross margin |
565 | 867 | (302 | ) | (35 | ) | ||||||||||
| Operating income |
531 | 817 | (286 | ) | (35 | ) | ||||||||||
| Net income |
340 | 556 | (216 | ) | (39 | ) | ||||||||||
| Net income per share — diluted |
0.40 | 0.63 | (0.23 | ) | (37 | ) | ||||||||||
| Other comprehensive income |
57 | 197 | (140 | ) | (71 | ) | ||||||||||
| PotashCorp 2014 First Quarter Quarterly Report on Form 10-Q | 16 |
Statement of Financial Position
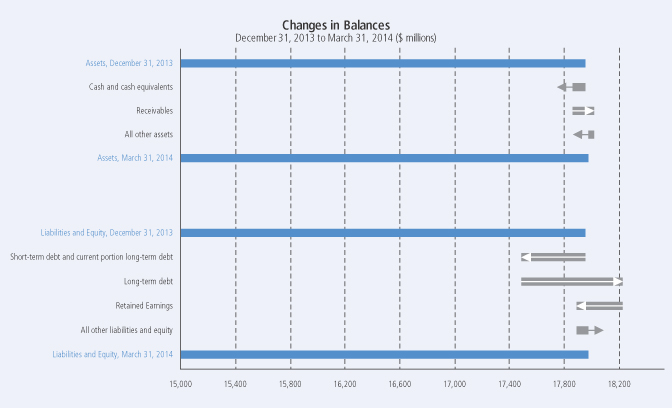
The most significant contributors to the changes in our statements of financial position were as follows(1):
| (1) | Direction of arrows refers to increase or decrease. |
| Liabilities |
Equity | |
|
i Short-term debt and current portion of long-term debt declined due to a decrease in our outstanding commercial paper.
h Long-term debt was higher as a result of the issuance of $750 million in senior notes in the first quarter of 2014. |
h Equity was impacted by net income and other comprehensive income (both discussed in more detail above), dividends declared and common shares repurchased for cancellation (see Note 5 to the financial statements in this Form 10-Q) during the first three months of 2014. |
Cash and cash equivalents held in certain foreign subsidiaries were $13 million at March 31, 2014, down from $480 million at December 31, 2013 as a result of a repatriation of funds in the first quarter of 2014. There are no current plans to repatriate the funds at March 31, 2014 in a taxable manner.
| 17 | PotashCorp 2014 First Quarter Quarterly Report on Form 10-Q |
Potash
Potash Financial Performance
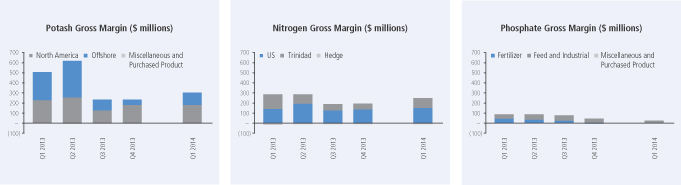
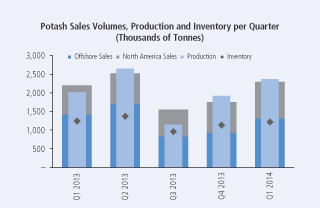
| Three Months Ended March 31 | ||||||||||||||||||||||||||||||||||||
| Dollars (millions) | Tonnes (thousands) | Average per Tonne(1) | ||||||||||||||||||||||||||||||||||
| 2014 | 2013 | % Change | 2014 | 2013 | % Change | 2014 | 2013 | % Change | ||||||||||||||||||||||||||||
| Manufactured product |
||||||||||||||||||||||||||||||||||||
| Net sales |
||||||||||||||||||||||||||||||||||||
| North America |
$ | 291 | $ | 331 | (12 | ) | 988 | 794 | 24 | $ | 295 | $ | 417 | (29 | ) | |||||||||||||||||||||
| Offshore |
287 | 477 | (40 | ) | 1,323 | 1,432 | (8 | ) | $ | 217 | $ | 333 | (35 | ) | ||||||||||||||||||||||
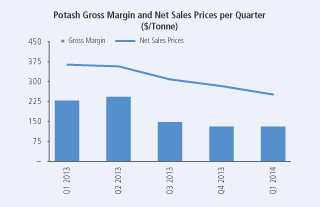
| 578 | 808 | (28 | ) | 2,311 | 2,226 | 4 | $ | 250 | $ | 363 | (31 | ) | ||||||||||||||||||||||||
| Cost of goods sold |
(274 | ) | (304 | ) | (10 | ) | $ | (119 | ) | $ | (136 | ) | (13 | ) | ||||||||||||||||||||||
| Gross margin |
304 | 504 | (40 | ) | $ | 131 | $ | 227 | (42 | ) | ||||||||||||||||||||||||||
|
Other miscellaneous and purchased product gross margin(2) |
(4 | ) | — | n/m | ||||||||||||||||||||||||||||||||
| Gross Margin |
$ | 300 | $ | 504 | (40 | ) | $ | 130 | $ | 227 | (43 | ) | ||||||||||||||||||||||||
| n/m | = not meaningful |
| (1) | Rounding differences may occur due to the use of whole dollars in per-tonne calculations. |
| (2) | Comprised of net sales of $7 million (2013 — $6 million) less cost of goods sold of $11 million (2013 — $6 million). |
| PotashCorp 2014 First Quarter Quarterly Report on Form 10-Q | 18 |
Potash gross margin variance attributable to:
| Three Months Ended March 31 2014 vs. 2013 |
||||||||||||||||
| Change in Prices/Costs |
||||||||||||||||
| Dollars (millions) | Change in Sales Volumes |
Net Sales |
Cost of Goods Sold |
Total | ||||||||||||
| Manufactured product |
||||||||||||||||
| North America |
$ | 64 | $ | (121 | ) | $ | 11 | $ | (46 | ) | ||||||
| Offshore |
(27 | ) | (152 | ) | 25 | (154 | ) | |||||||||
| Change in market mix |
(13 | ) | 12 | 1 | — | |||||||||||
| Total manufactured product |
$ | 24 | $ | (261 | ) | $ | 37 | (200 | ) | |||||||
| Other miscellaneous and purchased product |
(4 | ) | ||||||||||||||
| Total |
$ | (204 | ) | |||||||||||||
|
|
|
Offshore sales to major markets, by percentage of sales volumes, were as follows:
| Three Months Ended March 31 | ||||||||||||||||||||||||
| By Canpotex | From New Brunswick | |||||||||||||||||||||||
| 2014 | 2013 | % Change | 2014 | 2013 | % Change | |||||||||||||||||||
| Other Asian countries(1) |
47 | 39 | 21 | — | — | — | ||||||||||||||||||
| Latin America |
27 | 27 | — | 100 | 100 | — | ||||||||||||||||||
| China |
16 | 25 | (36 | ) | — | — | — | |||||||||||||||||
| India |
3 | 3 | — | — | — | — | ||||||||||||||||||
| Oceania, Europe and Other |
7 | 6 | 17 | — | — | — | ||||||||||||||||||
| 100 | 100 | 100 | 100 | |||||||||||||||||||||
| (1) | All Asian countries except China and India. |
| 19 | PotashCorp 2014 First Quarter Quarterly Report on Form 10-Q |
The most significant contributors to the change in total gross margin quarter over quarter were as follows(1):
| (1) | Direction of arrows refers to impact on gross margin. |
| Net Sales Prices | Sales Volumes | Cost of Goods Sold | ||
| i Potash prices began to trend upward in key markets as the quarter progressed, but the sharp decline during the second half of 2013 weighed on realizations. As a result, our first-quarter average realized potash price was well below the same period last year. |
h North American totals were higher as we leveraged our extensive warehousing and distribution capabilities to meet strong demand.
i Our offshore sales volumes fell as delayed Chinese and Indian contracts and rail constraints limited shipments. |
h Two shutdown weeks were taken in 2014 as a result of the fatality at Cory while 16 shutdown weeks were taken in 2013 to match production with demand and for expansion-related activities.
h The Canadian dollar weakened relative to the US dollar, reducing cost of goods sold. |
Potash Non-Financial Performance
| Three Months Ended March 31 | ||||||||||||||
| 2014 | 2013 | % Change | ||||||||||||
| Production |
KCl tonnes produced (thousands) |
2,395 | 2,025 | 18 | ||||||||||
| Safety |
Total site recordable injury rate |
1.34 | 1.43 | (6 | ) | |||||||||
| Life-altering injuries |
1 | — | n/m | |||||||||||
| Employee |
Percentage of senior staff positions filled internally |
100% | —% | n/m | ||||||||||
| Environmental |
Waste (000’s tonnes) |
4,500 | 4,504 | — | ||||||||||
| Environmental incidents |
4 | 6 | (33 | ) | ||||||||||
| n/m | = not meaningful |
| PotashCorp 2014 First Quarter Quarterly Report on Form 10-Q | 20 |
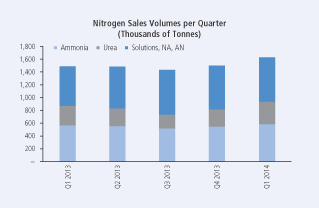
Nitrogen
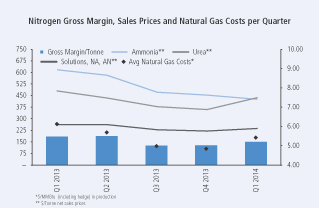
Nitrogen Financial Performance
| Three Months Ended March 31 | ||||||||||||||||||||||||||||||||||||
| Dollars (millions) | Tonnes (thousands) | Average per Tonne(1) | ||||||||||||||||||||||||||||||||||
| 2014 | 2013 | % Change | 2014 | 2013 | % Change | 2014 | 2013 | % Change | ||||||||||||||||||||||||||||
| Manufactured product(2) |
||||||||||||||||||||||||||||||||||||
| Net sales |
||||||||||||||||||||||||||||||||||||
| Ammonia |
$ | 246 | $ | 342 | (28 | ) | 583 | 559 | 4 | $ | 422 | $ | 613 | (31 | ) | |||||||||||||||||||||
| Urea |
150 | 145 | 3 | 348 | 305 | 14 | $ | 433 | $ | 476 | (9 | ) | ||||||||||||||||||||||||
| Solutions, Nitric acid, Ammonium nitrate |
164 | 161 | 2 | 698 | 622 | 12 | $ | 234 | $ | 259 | (10 | ) | ||||||||||||||||||||||||
| 560 | 648 | (14 | ) | 1,629 | 1,486 | 10 | $ | 344 | $ | 436 | (21 | ) | ||||||||||||||||||||||||
| Cost of goods sold |
(324 | ) | (380 | ) | (15 | ) | $ | (199 | ) | $ | (255 | ) | (22 | ) | ||||||||||||||||||||||
| Gross margin |
236 | 268 | (12 | ) | $ | 145 | $ | 181 | (20 | ) | ||||||||||||||||||||||||||
| Other miscellaneous and purchased product gross margin(3) |
3 | 3 | — | |||||||||||||||||||||||||||||||||
| Gross Margin |
$ | 239 | $ | 271 | (12 | ) | $ | 147 | $ | 182 | (19 | ) | ||||||||||||||||||||||||
| (1) | Rounding differences may occur due to the use of whole dollars in per-tonne calculations. |
| (2) | Includes inter-segment ammonia sales, comprised of: net sales $25 million, cost of goods sold $12 million and 48,000 sales tonnes (2013 — net sales $31 million, cost of goods sold $13 million and 46,000 sales tonnes). Inter-segment profits are eliminated on consolidation. |
| (3) | Comprised of third-party and inter-segment sales, including: third-party net sales $15 million less cost of goods sold $11 million (2013 — net sales $17 million less cost of goods sold $14 million) and inter-segment net sales $NIL less cost of goods sold $1 million (2013 — net sales $14 million less cost of goods sold $14 million). Inter-segment profits are eliminated on consolidation. |
Nitrogen gross margin variance attributable to:
| Three Months Ended March 31 2014 vs. 2013 |
||||||||||||||||
| Change in Prices/Costs |
||||||||||||||||
| Dollars (millions) | Change in Sales Volumes |
Net Sales |
Cost of Goods Sold |
Total | ||||||||||||
| Manufactured product |
||||||||||||||||
| Ammonia |
$ | 13 | $ | (111 | ) | $ | 33 | $ | (65 | ) | ||||||
| Urea |
12 | (15 | ) | 4 | 1 | |||||||||||
| Solutions, NA, AN |
— | (17 | ) | 42 | 25 | |||||||||||
| Hedge |
— | — | 7 | 7 | ||||||||||||
| Change in product mix |
7 | (7 | ) | — | — | |||||||||||
| Total manufactured product |
$ | 32 | $ | (150 | ) | $ | 86 | (32 | ) | |||||||
| Other miscellaneous and purchased product |
— | |||||||||||||||
| Total |
$ | (32 | ) | |||||||||||||
| 21 | PotashCorp 2014 First Quarter Quarterly Report on Form 10-Q |
|
|
| Three Months Ended March 31 | ||||||||||||||||
| Sales Tonnes (thousands) |
Price per Tonne | |||||||||||||||
| 2014 | 2013 | 2014 | 2013 | |||||||||||||
| Fertilizer |
577 | 410 | $ | 370 | $ | 453 | ||||||||||
| Industrial and Feed |
1,052 | 1,076 | $ | 330 | $ | 430 | ||||||||||
| 1,629 | 1,486 | $ | 344 | $ | 436 | |||||||||||
The most significant contributors to the change in total gross margin quarter over quarter were as follows(1):
| (1) | Direction of arrows refers to impact on gross margin. |
| Net Sales Prices | Cost of Goods Sold | |
| i Ammonia prices fell from historically high levels in the first quarter of 2013, which was affected by strong demand and supply challenges in key producing regions. |
h Average costs, including our hedge position, for natural gas used as feedstock in production decreased 11 percent. Costs for natural gas used as feedstock in Trinidad production fell 29 percent (contract price indexed, in part, to Tampa ammonia prices) while our US spot costs for natural gas increased 40 percent. Including losses on our hedge position, US gas prices rose 22 percent.
h The cost of goods sold variance for ammonia and urea mainly reflected decreased costs for natural gas used as feedstock in Trinidad production exceeding increased US natural gas costs, but to a greater extent in ammonia than in urea.
h The cost of goods sold variance was better for solutions, nitric acid and ammonium nitrate due mainly to the impact of costs associated with Geismar in 2013 that did not repeat in 2014. |
Nitrogen Non-Financial Performance
| Three Months Ended March 31 | ||||||||||||||
| 2014 | 2013 | % Change | ||||||||||||
| Production |
N tonnes produced (thousands) |
833 | 723 | 15 | ||||||||||
| Safety |
Total site recordable injury rate |
0.49 | 0.50 | (2 | ) | |||||||||
| Employee |
Percentage of senior staff positions filled internally |
100% | 100% | — | ||||||||||
| Environmental |
Greenhouse gas emissions (CO2 equivalent tonnes/tonne of product) |
2.2 | 2.2 | — | ||||||||||
| Environmental incidents |
1 | 1 | — | |||||||||||
Production
The increase in production was mainly due to the restart of ammonia production at Geismar late in the first quarter of 2013.
| PotashCorp 2014 First Quarter Quarterly Report on Form 10-Q | 22 |
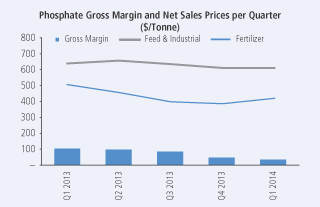
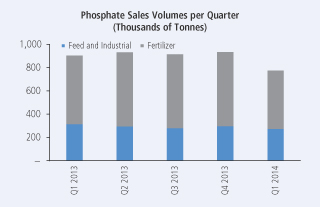
Phosphate
Phosphate Financial Performance
| Three Months Ended March 31 | ||||||||||||||||||||||||||||||||||||
| Dollars (millions) | Tonnes (thousands) | Average per Tonne(1) | ||||||||||||||||||||||||||||||||||
| 2014 | 2013 | % Change | 2014 | 2013 | % Change | 2014 | 2013 | % Change | ||||||||||||||||||||||||||||
| Manufactured product |
||||||||||||||||||||||||||||||||||||
| Net sales |
||||||||||||||||||||||||||||||||||||
| Fertilizer |
$ | 210 | $ | 297 | (29 | ) | 502 | 590 | (15 | ) | $ | 417 | $ | 503 | (17 | ) | ||||||||||||||||||||
| Feed and Industrial |
165 | 199 | (17 | ) | 272 | 313 | (13 | ) | $ | 608 | $ | 635 | (4 | ) | ||||||||||||||||||||||
| 375 | 496 | (24 | ) | 774 | 903 | (14 | ) | $ | 484 | $ | 549 | (12 | ) | |||||||||||||||||||||||
| Cost of goods sold |
(351 | ) | (407 | ) | (14 | ) | $ | (453 | ) | $ | (451 | ) | — | |||||||||||||||||||||||
| Gross margin |
24 | 89 | (73 | ) | $ | 31 | $ | 98 | (68 | ) | ||||||||||||||||||||||||||
| Other miscellaneous and purchased product gross margin(2) |
2 | 3 | (33 | ) | ||||||||||||||||||||||||||||||||
| Gross Margin |
$ | 26 | $ | 92 | (72 | ) | $ | 34 | $ | 102 | (67 | ) | ||||||||||||||||||||||||
| (1) | Rounding differences may occur due to the use of whole dollars in per-tonne calculations. |
| (2) | Comprised of net sales of $4 million (2013 — $7 million) less cost of goods sold of $2 million (2013 — $4 million). |
Phosphate gross margin variance attributable to:
| Three Months Ended March 31 2014 vs. 2013 |
||||||||||||||||
| Change in Prices/Costs |
||||||||||||||||
| Dollars (millions) | Change in Sales Volumes |
Net Sales |
Cost of Goods Sold |
Total | ||||||||||||
| Manufactured product |
||||||||||||||||
| Fertilizer |
$ | (25 | ) | $ | (44 | ) | $ | 23 | $ | (46 | ) | |||||
| Feed and Industrial |
(18 | ) | (8 | ) | 7 | (19 | ) | |||||||||
| Change in product mix |
(2 | ) | 2 | — | — | |||||||||||
| Total manufactured product |
$ | (45 | ) | $ | (50 | ) | $ | 30 | (65 | ) | ||||||
| Other miscellaneous and purchased product |
(1 | ) | ||||||||||||||
| Total |
$ | (66 | ) | |||||||||||||
| 23 | PotashCorp 2014 First Quarter Quarterly Report on Form 10-Q |
|
|
The most significant contributors to the change in total gross margin quarter over quarter were as follows(1):
| (1) | Direction of arrows refers to impact on gross margin. |
| Net Sales Prices | Sales Volumes | Cost of Goods Sold | ||||||||||||
|
i |
Weaker fertilizer market conditions through the second half of 2013 weighed on our first-quarter 2014 realizations. | i | Volumes fell as weather-related production issues reduced operating rates across all our facilities and constrained our sales for the quarter. | h
|
|
|
Sulfur costs were down 36 percent and ammonia costs were down 25 percent, reducing our cost of goods sold. | |||||||
| i | Depreciation was higher due to accelerated depreciation as a result of operational changes announced in the fourth quarter of 2013. | |||||||||||||
Phosphate Non-Financial Performance
| Three Months Ended March 31 | ||||||||||||||
| 2014 | 2013 | % Change | ||||||||||||
| Production |
P2O5 tonnes produced (thousands) |
369 | 499 | (26 | ) | |||||||||
|
P2O5 operating rate percentage |
62% | 84% | (26 | ) | ||||||||||
| Safety |
Total site recordable injury rate |
1.42 | 0.47 | 202 | ||||||||||
| Employee |
Percentage of senior staff positions filled internally |
100% | 50% | 100 | ||||||||||
| Environmental |
Water usage (m3 per tonne of product) |
30 | 31 | (3 | ) | |||||||||
| Recycled water used in operations (percentage) |
94 | 94 | — | |||||||||||
| Environmental incidents |
— | — | — | |||||||||||
| PotashCorp 2014 First Quarter Quarterly Report on Form 10-Q | 24 |
Other Expenses and Income
| Three Months Ended March 31 | ||||||||||||||||
| Dollars (millions) | 2014 | 2013 | Change | % Change | ||||||||||||
| Selling and administrative expenses |
$ | (68) | $ | (66) | $ | (2) | 3 | |||||||||
| Provincial mining and other taxes |
(54) | (63) | 9 | (14) | ||||||||||||
| Share of earnings of equity-accounted investees |
33 | 80 | (47) | (59) | ||||||||||||
| Dividend income |
69 | — | 69 | n/m | ||||||||||||
| Impairment of available-for-sale investment |
(38) | — | (38) | n/m | ||||||||||||
| Other income (expenses) |
24 | (1) | 25 | n/m | ||||||||||||
| Finance costs |
(47) | (35) | (12) | 34 | ||||||||||||
| Income taxes |
(144) | (226) | 82 | (36) | ||||||||||||
n/m = not meaningful
For the first quarter, income taxes decreased due to lower ordinary earnings before taxes and fewer discrete tax adjustments. Effective tax rates and discrete items were as follows:
| Three Months Ended March 31 |
||||||||
| Dollars (millions), except percentage amounts | 2014 | 2013 | ||||||
| Actual effective tax rate on ordinary earnings |
27% | 27% | ||||||
| Actual effective tax rate including discrete items |
30% | 29% | ||||||
| Discrete tax adjustments that impacted the rate |
$2 | $19 | ||||||
| 25 | PotashCorp 2014 First Quarter Quarterly Report on Form 10-Q |
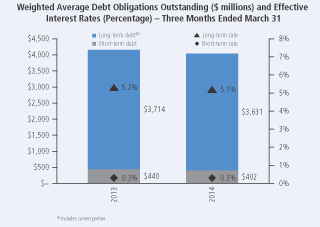
Liquidity and Capital Resources
Cash Requirements
Contractual Obligations and Other Commitments
Our contractual obligations and other commitments detailed on pages 84 and 85 of our 2013 Annual Integrated Report summarize certain of our liquidity and capital resource requirements, excluding obligations that have original maturities of less than one year, planned (but not legally committed) capital expenditures or potential share repurchases. The issuance of $750 million of 3.625 percent senior notes due March 15, 2024 during the first quarter of 2014 increased our long-term debt obligations and estimated annual interest payments of $27 million on long-term debt obligations in our contractual obligations and other commitments table referenced above. On April 7, 2014, the company completed the early redemption of all its outstanding $500 million of 5.250 percent senior notes due May 15, 2014.
Capital Expenditures
Based on anticipated exchange rates, during 2014 we expect to incur capital expenditures, including capitalized interest, of approximately $550 million for opportunity capital and approximately $620 million to sustain operations at existing levels and for major repairs and maintenance (including plant turnarounds).
Page 62 of our 2013 Annual Integrated Report outlines key potash construction projects and their expected total cost, as well as the impact of these projects on capacity expansion/debottlenecking and any expected remaining spending on each project still in progress. The most significant of these potash projects(1) on which funds are expected to be spent in 2014, excluding capitalized interest, are outlined in the table below:
| CDN Dollars (millions) | 2014 Forecast | Total Forecast(2) | Started | Expected Completion(3) (Description) |
Forecasted Remaining Spending (after 2014)(2) |
|||||||||||||
| New Brunswick |
$ | 110 | $ | 2,160 | 2007 | 2014 (mine shaft and mill) | $ | 260 | ||||||||||
| Rocanville, Saskatchewan |
$ | 190 | $ | 2,810 | 2008 | 2015 (mine shaft and mill) | $ | 40 | ||||||||||
| (1) | The expansion at each of these projects is discussed in the technical report for such project filed on SEDAR in accordance with National Instrument 43-101 Standards of Disclosure for Mineral Projects. |
| (2) | Amounts are based on the most recent forecast amounts approved by the Board of Directors, and are subject to change based on project timelines and costs. |
| (3) | Excludes ramp-up time. We expect these projects will be fully ramped up by the end of 2015, subject to market conditions. |
In 2013, we began an expansion of ammonia production at our Lima, Ohio plant. We are investing approximately $190 million through the fourth quarter of 2015 ($100 million in 2014) to increase our capacity in ammonia (88,000 tons) and urea (80,000 tons).
We anticipate that all capital spending will be financed by internally generated cash flows supplemented, if and as necessary, by borrowing from existing financing sources.
Sources and Uses of Cash
Cash flows from operating, investing and financing activities, as reflected in the unaudited interim condensed consolidated statements of cash flow, are summarized in the following table:
| Three Months Ended March 31 | ||||||||||||||||
| Dollars (millions) | 2014 | 2013 | Change | % Change | ||||||||||||
| Cash provided by operating activities |
$ | 539 | $ | 738 | $ | (199 | ) | (27 | ) | |||||||
| Cash used in investing activities |
(226 | ) | (501 | ) | 275 | (55 | ) | |||||||||
| Cash used in financing activities |
(408 | ) | (214 | ) | (194 | ) | 91 | |||||||||
| (Decrease) increase in cash and cash equivalents |
$ | (95 | ) | $ | 23 | $ | (118 | ) | n/m | |||||||
| n/m | = not meaningful |
| PotashCorp 2014 First Quarter Quarterly Report on Form 10-Q | 26 |
| 27 | PotashCorp 2014 First Quarter Quarterly Report on Form 10-Q |
Quarterly Financial Highlights
| Dollars (millions), except per-share amounts |
March 31, 2014 |
December 31, 2013 |
September 30, 2013 |
June 30, 2013 |
March 31, 2013 |
December 31, 2012 |
September 30, 2012 |
June 30, 2012 |
||||||||||||||||||||||||
| Sales |
$ | 1,680 | $ | 1,541 | $ | 1,520 | $ | 2,144 | $ | 2,100 | $ | 1,642 | $ | 2,143 | $ | 2,396 | ||||||||||||||||
| Gross margin |
565 | 460 | 484 | 979 | 867 | 586 | 927 | 1,199 | ||||||||||||||||||||||||
| Net income |
340 | 230 | 356 | 643 | 556 | 421 | 645 | 522 | ||||||||||||||||||||||||
| Net income per share — basic(1) |
0.40 | 0.27 | 0.41 | 0.74 | 0.64 | 0.49 | 0.75 | 0.61 | ||||||||||||||||||||||||
| Net income per share — diluted(1) |
0.40 | 0.26 | 0.41 | 0.73 | 0.63 | 0.48 | 0.74 | 0.60 | ||||||||||||||||||||||||
| (1) | Net income per share for each quarter has been computed based on the weighted average number of shares issued and outstanding during the respective quarter, including the dilutive number of shares assumed for the diluted earnings per share computation; therefore, as the number of shares varies each period, quarterly amounts may not add to the annual total. |
| Certain aspects of our business can be impacted by seasonal factors. Fertilizers are sold primarily for spring and fall application in both Northern and Southern Hemispheres. However, planting conditions and the timing of customer purchases will vary each year and fertilizer sales can be expected to shift from one quarter to another. Most feed and industrial sales are by contract and are more evenly distributed throughout the year. |
| PotashCorp 2014 First Quarter Quarterly Report on Form 10-Q | 28 |
| 29 | PotashCorp 2014 First Quarter Quarterly Report on Form 10-Q |
| PotashCorp 2014 First Quarter Quarterly Report on Form 10-Q | 30 |
| 31 | PotashCorp 2014 First Quarter Quarterly Report on Form 10-Q |
| PotashCorp 2014 First Quarter Quarterly Report on Form 10-Q | 32 |
Part II. Other Information
Item 1. Legal Proceedings
For a description of certain other legal and environmental proceedings, see Note 11 to the unaudited interim condensed consolidated financial statements included in Part I of this Quarterly Report on Form 10-Q.
Item 2. Unregistered Sales of Equity Securities and Use of Proceeds
Issuer Purchases of Equity Securities
The following table provides information about company purchases of equity securities that are registered by the company pursuant to Section 12 of the Exchange Act during the quarter ended March 31, 2014:
| Period | (a) Total Number of Shares Purchased |
(b) Average Price Paid per Share(1) |
(c) Total Number of Part of Publicly Announced |
(d) Maximum Number of Shares that May Yet Be Purchased Under the Program(2) |
||||||||||||
| January 1, 2014 — January 31, 2014 |
314,000 | $ | 31.23 | 314,000 | 28,886,892 | |||||||||||
| February 1, 2014 — February 28, 2014 |
5,024,000 | $ | 33.25 | 5,024,000 | 23,862,892 | |||||||||||
| March 1, 2014 — March 31, 2014 |
6,384,000 | $ | 34.73 | 6,384,000 | 17,478,892 | |||||||||||
| Total |
11,722,000 | $ | 34.00 | 11,722,000 | 17,478,892 | |||||||||||
| (1) | Average price paid per share includes cash paid for commissions. |
| (2) | On July 24, 2013, the company’s Board of Directors authorized a share repurchase program of up to 5 percent of PotashCorp’s outstanding common shares (up to $2,000 million of its outstanding common shares) through a normal course issuer bid. Shares may be repurchased from time to time on the open market commencing on August 2, 2013 through August 1, 2014 at prevailing market prices. Shareholders may obtain a copy of the notice filed with the Toronto Stock Exchange, without charge, by contacting the Corporate Secretary. |
Item 6. Exhibits
(a) Exhibits
| Incorporated By Reference (File No. 001-10351, unless otherwise indicated) | ||||||||||
| Exhibit Number |
Description of Document | Form | Filing Date/Period End Date |
Exhibit Number (if different) | ||||||
| 3(a) | Articles of Continuance of the registrant dated May 15, 2002. | 10-Q | 6/30/2002 | |||||||
| 3(b) | Bylaws of the registrant effective May 15, 2002. | 10-Q | 6/30/2002 | |||||||
| 33 | PotashCorp 2014 First Quarter Quarterly Report on Form 10-Q |
| Incorporated By Reference (File No. 001-10351, unless otherwise indicated) | ||||||||||
| Exhibit Number |
Description of Document | Form | Filing Date/Period End Date |
Exhibit Number (if different) | ||||||
| 4(a) | Indenture dated as of February 27, 2003, between the registrant and U.S. Bank National Association, as successor to The Bank of Nova Scotia Trust Company of New York. | 10-K | 12/31/2002 | 4(c) | ||||||
| 4(b) | Form of Note relating to the registrant’s offering of $500,000,000 principal amount of 5.875% Notes due December 1, 2036. | 8-K | 11/30/2006 | 4(a) | ||||||
| 4(c) | Form of Note relating to the registrant’s offering of $500,000,000 principal amount of 6.50% Notes due May 15, 2019. | 8-K | 5/1/2009 | 4(b) | ||||||
| 4(d) | Form of Note relating to the registrant’s offering of $500,000,000 principal amount of 3.75% Notes due September 30, 2015. | 8-K | 9/25/2009 | 4(a) | ||||||
| 4(e) | Form of Note relating to the registrant’s offering of $500,000,000 principal amount of 4.875% Notes due March 30, 2020. | 8-K | 9/25/2009 | 4(b) | ||||||
| 4(f) | Form of Note relating to the registrant’s offering of $750,000,000 principal amount of 3.625% Notes due March 15, 2024. | 8-K | 3/7/2014 | 4(a) | ||||||
| 4(g) | Revolving Term Credit Facility Agreement between the Bank of Nova Scotia and other financial institutions and the registrant dated December 11, 2009. | 8-K | 12/15/2009 | 4(a) | ||||||
| 4(h) | Revolving Term Credit Facility First Amending Agreement between the Bank of Nova Scotia and other financial institutions and the registrant dated September 23, 2011. | 8-K | 9/26/2011 | 4(a) | ||||||
| 4(i) | Revolving Term Credit Facility Second Amending Agreement between the Bank of Nova Scotia and other financial institutions and the registrant dates as of May 24, 2013. | 8-K | 5/28/2013 | 4(a) | ||||||
| 4(j) | Form of Note relating to the registrant’s offering of $500,000,000 principal amount of 3.25% Notes due December 1, 2017. | 8-K | 11/29/2010 | 4(a) | ||||||
| 4(k) | Form of Note relating to the registrant’s offering of $500,000,000 principal amount of 5.625% Notes due December 1, 2040. | 8-K | 11/29/2010 | 4(b) | ||||||
| 4(l) | Agreement of Resignation, Appointment and Acceptance, dated as of June 25, 2013, by and among the registrant, The Bank of Nova Scotia Trust Company of New York and U.S. Bank National Association. | 8-K | 6/27/2013 | 4(a) | ||||||
The registrant hereby undertakes to file with the Securities and Exchange Commission, upon request, copies of any constituent instruments defining the rights of holders of long-term debt of the registrant or its subsidiaries that have not been filed herewith because the amounts represented thereby are less than 10% of the total assets of the registrant and its subsidiaries on a consolidated basis.
| Incorporated By Reference (File No. 001-10351, unless otherwise indicated) | ||||||||||
| Exhibit Number |
Description of Document | Form | Filing Date/Period End Date |
Exhibit Number (if different) | ||||||
| 10(a) | Consolidated, Restated and Amended Canpotex Shareholders’ Agreement, Eighth Memorandum of Agreement dated January 1, 2014 between Agrium Inc., Mosaic Canada Crop Nutrition, LP, by its general partner, 4379934 Canada Ltd., the registrant and Canpotex Limited. |
10-K | 12/31/2013 | |||||||
| 10(b) | Consolidated, Restated and Amended Producer Agreement, Eighth Memorandum of Agreement dated January 1, 2014 between Canpotex Limited, Agrium Inc., Mosaic Canada Crop Nutrition, LP, by its general partner, 4379934 Canada Ltd. and the registrant. |
10-K | 12/31/2013 | |||||||
| 10(c) | Short-Term Incentive Plan of the registrant effective January 1, 2000, as amended. | 8-K | 3/13/2012 | 10(a) | ||||||
| 10(d) | Resolution and Forms of Agreement for Supplemental Executive Retirement Income Plan, for officers and key employees of the registrant. | 10-K | 12/31/1995 | 10(o) | ||||||
| 10(e) | Amending Resolution and revised forms of agreement regarding Supplemental Retirement Income Plan of the registrant. | 10-Q | 6/30/1996 | 10(x) | ||||||
| 10(f) | Amended and restated Supplemental Executive Retirement Income Plan of the registrant and text of amendment to existing supplemental income plan agreements. | 10-Q | 9/30/2000 | 10(mm) | ||||||
| PotashCorp 2014 First Quarter Quarterly Report on Form 10-Q | 34 |
| Incorporated By Reference (File No. 001-10351, unless otherwise indicated) | ||||||||||
| Exhibit Number |
Description of Document | Form | Filing Date/Period End Date |
Exhibit Number (if different) | ||||||
| 10(g) | Amendment, dated February 23, 2009, to the amended and restated Supplemental Executive Retirement Income Plan. | 10-K | 12/31/2008 | 10(r) | ||||||
| 10(h) | Amendment, dated December 29, 2010, to the amended and restated Supplemental Executive Retirement Income Plan. | 10-K | 12/31/2010 | 10(r) | ||||||
| 10(i) | Form of Letter of amendment to existing supplemental income plan agreements of the registrant. | 10-K | 12/31/2002 | 10(cc) | ||||||
| 10(j) | Amended and restated agreement dated February 20, 2007, between the registrant and William J. Doyle concerning the Supplemental Executive Retirement Income Plan. | 10-K | 12/31/2006 | 10(s) | ||||||
| 10(k) | Amendment, dated December 24, 2008, to the amended and restated agreement, dated February 20, 2007, between the registrant and William J. Doyle concerning the Supplemental Executive Retirement Income Plan. | 10-K | 12/31/2008 | 10(u) | ||||||
| 10(l) | Amendment, dated February 23, 2009, to the amended and restated agreement, dated February 20, 2007, between the registrant and William J. Doyle concerning the Supplemental Executive Retirement Income Plan. | 10-K | 12/31/2008 | 10(v) | ||||||
| 10(m) | Amendment, dated February 23, 2009, to the amended and restated agreement, dated August 2, 1996, between the registrant and Wayne R. Brownlee concerning the Supplemental Executive Retirement Income Plan. | 10-K | 12/31/2008 | 10(w) | ||||||
| 10(n) | Amendment, dated December 29, 2010, to the amended and restated agreement, dated February 20, 2007, between the registrant and William J. Doyle concerning the Supplemental Executive Retirement Income Plan. | 10-K | 12/31/2010 | 10(y) | ||||||
| 10(o) | Amendment, dated December 29, 2010, to the amended and restated agreement, dated August 2, 1996, between the registrant and Wayne R. Brownlee concerning the Supplemental Executive Retirement Income Plan. | 10-K | 12/31/2010 | 10(z) | ||||||
| 10(p) | Supplemental Retirement Agreement dated December 24, 2008, between the registrant and Stephen F. Dowdle. | 10-K | 12/31/2011 | 10(bb) | ||||||
| 10(q) | Supplemental Retirement Benefits Plan for U.S. Executives dated effective January 1, 1999. | 10-Q | 6/30/2002 | 10(aa) | ||||||
| 10(r) | Amendment No. 1, dated December 24, 2008, to the Supplemental Retirement Plan for U.S. Executives. | 10-K | 12/31/2008 | 10(z) | ||||||
| 10(s) | Amendment No. 2, dated February 23, 2009, to the Supplemental Retirement Plan for U.S. Executives. | 10-K | 12/31/2008 | 10(aa) | ||||||
| 10(t) | Amendment No. 3, dated December 2, 2013, to the Supplemental Retirement Plan for U.S. Executives. | 10-K | 12/31/2013 | |||||||
| 10(u) | Amendment No. 4, dated February 25, 2014 to the Supplemental Retirement Plan for U.S. Executives. | 10-K | 12/31/2013 | |||||||
| 10(v) | Forms of Agreement dated December 30, 1994, between the registrant and certain officers of the registrant. | 10-K | 12/31/1995 | 10(p) | ||||||
| 10(w) | Amendment, dated December 31, 2010, to the Agreement, dated December 30, 1994 between the registrant and William J. Doyle. | 10-K | 12/31/2010 | 10(ff) | ||||||
| 10(x) | Form of Agreement of Indemnification dated August 8, 1995, between the registrant and certain officers and directors of the registrant. | 10-K | 12/31/1995 | 10(q) | ||||||
| 10(y) | Resolution and Form of Agreement of Indemnification dated January 24, 2001. | 10-K | 12/31/2000 | 10(ii) | ||||||
| 10(z) | Resolution and Form of Agreement of Indemnification dated July 21, 2004. | 10-Q | 6/30/2004 | 10(ii) | ||||||
| 10(aa) | Chief Executive Officer Medical and Dental Benefits. | 10-K | 12/31/2010 | 10(jj) | ||||||
| 10(bb) | The Potash Corporation of Saskatchewan Inc. Deferred Share Unit Plan for Non-Employee Directors. | 10-Q | 3/31/2012 | 10(ll) | ||||||
| 10(cc) | Potash Corporation of Saskatchewan Inc. 2005 Performance Option Plan and Form of Option Agreement, as amended. | 10-Q | 3/31/2005 | 10(nn) | ||||||
| 35 | PotashCorp 2014 First Quarter Quarterly Report on Form 10-Q |
| Incorporated By Reference (File No. 001-10351, unless otherwise indicated) | ||||||||||
| Exhibit Number |
Description of Document | Form | Filing Date/Period End Date |
Exhibit Number (if different) | ||||||
| 10(dd) | Potash Corporation of Saskatchewan Inc. 2006 Performance Option Plan and Form of Option Agreement, as amended. | 10-Q | 3/31/2006 | |||||||
| 10(ee) | Potash Corporation of Saskatchewan Inc. 2007 Performance Option Plan and Form of Option Agreement. | 10-Q | 3/31/2007 | |||||||
| 10(ff) | Potash Corporation of Saskatchewan Inc. 2008 Performance Option Plan and Form of Option Agreement. | 10-Q | 3/31/2008 | |||||||
| 10(gg) | Potash Corporation of Saskatchewan Inc. 2009 Performance Option Plan and Form of Option Agreement. | 10-Q | 3/31/2009 | 10(mm) | ||||||
| 10(hh) | Potash Corporation of Saskatchewan Inc. 2010 Performance Option Plan and Form of Option Agreement. | 8-K | 5/7/2010 | 10.1 | ||||||
| 10(ii) | Potash Corporation of Saskatchewan Inc. 2011 Performance Option Plan and Form of Option Agreement. | 8-K | 5/13/2011 | 10(a) | ||||||
| 10(jj) | Potash Corporation of Saskatchewan Inc. 2012 Performance Option Plan and Form of Option Agreement. | 8-K | 5/18/2012 | 10(a) | ||||||
| 10(kk) | Potash Corporation of Saskatchewan Inc. 2013 Performance Option Plan and Form of Option Agreement. | 8-K | 5/17/2013 | 10(a) | ||||||
| 10(ll) | Medium-Term Incentive Plan of the registrant effective January 1, 2012. | 10-K | 12/31/2011 | 10(uu) | ||||||
| 31(a) | Certification pursuant to Section 302 of the Sarbanes-Oxley Act of 2002. | |||||||||
| 31(b) | Certification pursuant to Section 302 of the Sarbanes-Oxley Act of 2002. | |||||||||
| 32 | Certification pursuant to Section 906 of the Sarbanes-Oxley Act of 2002. | |||||||||
| 95 | Information concerning mine safety violations or other regulatory matters required by Section 1503(a) of the Dodd-Frank Wall Street Reform and Consumer Protection Act. | |||||||||
| PotashCorp 2014 First Quarter Quarterly Report on Form 10-Q | 36 |
Signatures
Pursuant to the requirements of the Securities Exchange Act of 1934, the registrant has duly caused this report to be signed on its behalf by the undersigned, thereunto duly authorized.
| POTASH CORPORATION OF SASKATCHEWAN INC. | ||||
| April 29, 2014 | By: | /s/ JOSEPH PODWIKA | ||
| Joseph Podwika | ||||
| Senior Vice President, General Counsel and Secretary | ||||
| April 29, 2014 | By: | /s/ WAYNE R. BROWNLEE | ||
| Wayne R. Brownlee | ||||
| Executive Vice President, Treasurer and Chief Financial Officer (Principal Financial and Accounting Officer) | ||||
| 37 | PotashCorp 2014 First Quarter Quarterly Report on Form 10-Q |
EXHIBIT INDEX
| Incorporated By Reference (File No. 001-10351, unless otherwise indicated) | ||||||||||
| Exhibit Number |
Description of Document | Form | Filing Date/Period End Date |
Exhibit Number (if different) | ||||||
| 3(a) | Articles of Continuance of the registrant dated May 15, 2002. | 10-Q | 6/30/2002 | |||||||
| 3(b) | Bylaws of the registrant effective May 15, 2002. | 10-Q | 6/30/2002 | |||||||
| 4(a) | Indenture dated as of February 27, 2003, between the registrant and U.S. Bank National Association, as successor to The Bank of Nova Scotia Trust Company of New York. | 10-K | 12/31/2002 | 4(c) | ||||||
| 4(b) | Form of Note relating to the registrant’s offering of $500,000,000 principal amount of 5.875% Notes due December 1, 2036. | 8-K | 11/30/2006 | 4(a) | ||||||
| 4(c) | Form of Note relating to the registrant’s offering of $500,000,000 principal amount of 6.50% Notes due May 15, 2019. | 8-K | 5/1/2009 | 4(b) | ||||||
| 4(d) | Form of Note relating to the registrant’s offering of $500,000,000 principal amount of 3.75% Notes due September 30, 2015. | 8-K | 9/25/2009 | 4(a) | ||||||
| 4(e) | Form of Note relating to the registrant’s offering of $500,000,000 principal amount of 4.875% Notes due March 30, 2020. | 8-K | 9/25/2009 | 4(b) | ||||||
| 4(f) | Form of Note relating to the registrant’s offering of $750,000,000 principal amount of 3.625% Notes due March 15, 2024. | 8-K | 3/7/2014 | 4(a) | ||||||
| 4(g) | Revolving Term Credit Facility Agreement between the Bank of Nova Scotia and other financial institutions and the registrant dated December 11, 2009. | 8-K | 12/15/2009 | 4(a) | ||||||
| 4(h) | Revolving Term Credit Facility First Amending Agreement between the Bank of Nova Scotia and other financial institutions and the registrant dated September 23, 2011. | 8-K | 9/26/2011 | 4(a) | ||||||
| 4(i) | Revolving Term Credit Facility Second Amending Agreement between the Bank of Nova Scotia and other financial institutions and the registrant dates as of May 24, 2013. | 8-K | 5/28/2013 | 4(a) | ||||||
| 4(j) | Form of Note relating to the registrant’s offering of $500,000,000 principal amount of 3.25% Notes due December 1, 2017. | 8-K | 11/29/2010 | 4(a) | ||||||
| 4(k) | Form of Note relating to the registrant’s offering of $500,000,000 principal amount of 5.625% Notes due December 1, 2040. | 8-K | 11/29/2010 | 4(b) | ||||||
| 4(l) | Agreement of Resignation, Appointment and Acceptance, dated as of June 25, 2013, by and among the registrant, The Bank of Nova Scotia Trust Company of New York and U.S. Bank National Association. | 8-K | 6/27/2013 | 4(a) | ||||||
The registrant hereby undertakes to file with the Securities and Exchange Commission, upon request, copies of any constituent instruments defining the rights of holders of long-term debt of the registrant or its subsidiaries that have not been filed herewith because the amounts represented thereby are less than 10% of the total assets of the registrant and its subsidiaries on a consolidated basis.
| Incorporated By Reference (File No. 001-10351, unless otherwise indicated) | ||||||||||
| Exhibit Number |
Description of Document | Form | Filing Date/Period End Date |
Exhibit Number (if different) | ||||||
| 10(a) | Consolidated, Restated and Amended Canpotex Shareholders’ Agreement, Eighth Memorandum of Agreement dated January 1, 2014 between Agrium Inc., Mosaic Canada Crop Nutrition, LP, by its general partner, 4379934 Canada Ltd., the registrant and Canpotex Limited. |
10-K | 12/31/2013 | |||||||
| 10(b) | Consolidated, Restated and Amended Producer Agreement, Eighth Memorandum of Agreement dated January 1, 2014 between Canpotex Limited, Agrium Inc., Mosaic Canada Crop Nutrition, LP, by its general partner, 4379934 Canada Ltd. and the registrant. |
10-K | 12/31/2013 | |||||||
| 10(c) | Short-Term Incentive Plan of the registrant effective January 1, 2000, as amended. | 8-K | 3/13/2012 | 10(a) | ||||||
| 10(d) | Resolution and Forms of Agreement for Supplemental Executive Retirement Income Plan, for officers and key employees of the registrant. | 10-K | 12/31/1995 | 10(o) | ||||||
| 10(e) | Amending Resolution and revised forms of agreement regarding Supplemental Retirement Income Plan of the registrant. | 10-Q | 6/30/1996 | 10(x) | ||||||
| 10(f) | Amended and restated Supplemental Executive Retirement Income Plan of the registrant and text of amendment to existing supplemental income plan agreements. | 10-Q | 9/30/2000 | 10(mm) | ||||||
| 10(g) | Amendment, dated February 23, 2009, to the amended and restated Supplemental Executive Retirement Income Plan. | 10-K | 12/31/2008 | 10(r) | ||||||
| 10(h) | Amendment, dated December 29, 2010, to the amended and restated Supplemental Executive Retirement Income Plan. | 10-K | 12/31/2010 | 10(r) | ||||||
| 10(i) | Form of Letter of amendment to existing supplemental income plan agreements of the registrant. | 10-K | 12/31/2002 | 10(cc) | ||||||
| 10(j) | Amended and restated agreement dated February 20, 2007, between the registrant and William J. Doyle concerning the Supplemental Executive Retirement Income Plan. | 10-K | 12/31/2006 | 10(s) | ||||||
| 10(k) | Amendment, dated December 24, 2008, to the amended and restated agreement, dated February 20, 2007, between the registrant and William J. Doyle concerning the Supplemental Executive Retirement Income Plan. | 10-K | 12/31/2008 | 10(u) | ||||||
| 10(l) | Amendment, dated February 23, 2009, to the amended and restated agreement, dated February 20, 2007, between the registrant and William J. Doyle concerning the Supplemental Executive Retirement Income Plan. | 10-K | 12/31/2008 | 10(v) | ||||||
| 10(m) | Amendment, dated February 23, 2009, to the amended and restated agreement, dated August 2, 1996, between the registrant and Wayne R. Brownlee concerning the Supplemental Executive Retirement Income Plan. | 10-K | 12/31/2008 | 10(w) | ||||||
| 10(n) | Amendment, dated December 29, 2010, to the amended and restated agreement, dated February 20, 2007, between the registrant and William J. Doyle concerning the Supplemental Executive Retirement Income Plan. | 10-K | 12/31/2010 | 10(y) | ||||||
| 10(o) | Amendment, dated December 29, 2010, to the amended and restated agreement, dated August 2, 1996, between the registrant and Wayne R. Brownlee concerning the Supplemental Executive Retirement Income Plan. | 10-K | 12/31/2010 | 10(z) | ||||||
| 10(p) | Supplemental Retirement Agreement dated December 24, 2008, between the registrant and Stephen F. Dowdle. | 10-K | 12/31/2011 | 10(bb) | ||||||
| 10(q) | Supplemental Retirement Benefits Plan for U.S. Executives dated effective January 1, 1999. | 10-Q | 6/30/2002 | 10(aa) | ||||||
| 10(r) | Amendment No. 1, dated December 24, 2008, to the Supplemental Retirement Plan for U.S. Executives. | 10-K | 12/31/2008 | 10(z) | ||||||
| 10(s) | Amendment No. 2, dated February 23, 2009, to the Supplemental Retirement Plan for U.S. Executives. | 10-K | 12/31/2008 | 10(aa) | ||||||
| 10(t) | Amendment No. 3, dated December 2, 2013, to the Supplemental Retirement Plan for U.S. Executives. | 10-K | 12/31/2013 | |||||||
| 10(u) | Amendment No. 4, dated February 25, 2014 to the Supplemental Retirement Plan for U.S. Executives. | 10-K | 12/31/2013 | |||||||
| Incorporated By Reference (File No. 001-10351, unless otherwise indicated) | ||||||||||
| Exhibit Number |
Description of Document | Form | Filing Date/Period End Date |
Exhibit Number (if different) | ||||||
| 10(v) | Forms of Agreement dated December 30, 1994, between the registrant and certain officers of the registrant. | 10-K | 12/31/1995 | 10(p) | ||||||
| 10(w) | Amendment, dated December 31, 2010, to the Agreement, dated December 30, 1994 between the registrant and William J. Doyle. | 10-K | 12/31/2010 | 10(ff) | ||||||
| 10(x) | Form of Agreement of Indemnification dated August 8, 1995, between the registrant and certain officers and directors of the registrant. | 10-K | 12/31/1995 | 10(q) | ||||||
| 10(y) | Resolution and Form of Agreement of Indemnification dated January 24, 2001. | 10-K | 12/31/2000 | 10(ii) | ||||||
| 10(z) | Resolution and Form of Agreement of Indemnification dated July 21, 2004. | 10-Q | 6/30/2004 | 10(ii) | ||||||
| 10(aa) | Chief Executive Officer Medical and Dental Benefits. | 10-K | 12/31/2010 | 10(jj) | ||||||
| 10(bb) | The Potash Corporation of Saskatchewan Inc. Deferred Share Unit Plan for Non-Employee Directors. | 10-Q | 3/31/2012 | 10(ll) | ||||||
| 10(cc) | Potash Corporation of Saskatchewan Inc. 2005 Performance Option Plan and Form of Option Agreement, as amended. | 10-Q | 3/31/2005 | 10(nn) | ||||||
| 10(dd) | Potash Corporation of Saskatchewan Inc. 2006 Performance Option Plan and Form of Option Agreement, as amended. | 10-Q | 3/31/2006 | |||||||
| 10(ee) | Potash Corporation of Saskatchewan Inc. 2007 Performance Option Plan and Form of Option Agreement. | 10-Q | 3/31/2007 | |||||||
| 10(ff) | Potash Corporation of Saskatchewan Inc. 2008 Performance Option Plan and Form of Option Agreement. | 10-Q | 3/31/2008 | |||||||
| 10(gg) | Potash Corporation of Saskatchewan Inc. 2009 Performance Option Plan and Form of Option Agreement. | 10-Q | 3/31/2009 | 10(mm) | ||||||
| 10(hh) | Potash Corporation of Saskatchewan Inc. 2010 Performance Option Plan and Form of Option Agreement. | 8-K | 5/7/2010 | 10.1 | ||||||
| 10(ii) | Potash Corporation of Saskatchewan Inc. 2011 Performance Option Plan and Form of Option Agreement. | 8-K | 5/13/2011 | 10(a) | ||||||
| 10(jj) | Potash Corporation of Saskatchewan Inc. 2012 Performance Option Plan and Form of Option Agreement. | 8-K | 5/18/2012 | 10(a) | ||||||
| 10(kk) | Potash Corporation of Saskatchewan Inc. 2013 Performance Option Plan and Form of Option Agreement. | 8-K | 5/17/2013 | 10(a) | ||||||
| 10(ll) | Medium-Term Incentive Plan of the registrant effective January 1, 2012. | 10-K | 12/31/2011 | 10(uu) | ||||||
| 31(a) | Certification pursuant to Section 302 of the Sarbanes-Oxley Act of 2002. | |||||||||
| 31(b) | Certification pursuant to Section 302 of the Sarbanes-Oxley Act of 2002. | |||||||||
| 32 | Certification pursuant to Section 906 of the Sarbanes-Oxley Act of 2002. | |||||||||
| 95 | Information concerning mine safety violations or other regulatory matters required by Section 1503(a) of the Dodd-Frank Wall Street Reform and Consumer Protection Act. | |||||||||