Attached files
| file | filename |
|---|---|
| 8-K - FORM 8-K - STAAR SURGICAL CO | v376167_8k.htm |
| EX-99.1 - EXHIBIT 99.1 - STAAR SURGICAL CO | v376167_ex99-1.htm |

1 NASDAQ: STAA Q1 2014 Results – Investor Presentation From the American Society of Cataract and Refractive Surgery Meeting April 28, 2014

Forward - Looking Statements All statements in this presentation that are not statements of historical fact are forward - looking statements, including stateme nts about any of the following: any projections of earnings, revenue, sales, profit margins, cash, effective tax rate or any other financial items; the plans, strategies, an d o bjectives of management for future operations or prospects for achieving such plans; metrics for 2014; statements regarding new or improved products, including but not limited to, expectations for success of new or improved products in the U.S. or international markets or government approval of new products (including the TICL in the U.S.); future economic conditions or size of market opportunities; expected IOL backorder position; expected costs of Monrovia facility expansion; expected costs and savings fro m b usiness consolidation plans and the timetable for those plans; statements of belief, including as to achieving 2014 growth plans or metrics; expected regulatory activities an d approvals, product launches, and any statements of assumptions underlying any of the foregoing. Important additional factors that could cause actual results to diff er materially from those indicated by such forward - looking statements are set forth in the company’s Annual Report on Form 10 - K for the year ended January 3, 2014, under the caption “Risk Factors,” which is on file with the Securities and Exchange Commission and available in the “Investor Information” section of the company’s website unde r t he heading “SEC Filings.” These statements are based on expectations and assumptions as of the date of this press release and are subject to numerous r isk s and uncertainties, which could cause actual results to differ materially from those described in the forward - looking statements. The risks and uncertainties include the fol lowing: our limited capital resources and limited access to financing; the negative effect of unstable global economic conditions on sales of products, especially products suc h a s the ICL used in non - reimbursed elective procedures; the challenge of managing our foreign subsidiaries; backlog or supply delays as we prepare for our manufacturing fac ility consolidation; the risk of unfavorable changes in currency exchange rate; the discretion of regulatory agencies to approve or reject new or improved products, or to re quire additional actions before approval (including but not limited FDA requirements regarding the TICL); unexpected costs or delays that could reduce or eliminate the expected benefits of our consolidation plans; the risk that research and development efforts will not be successful or may be delayed in delivering for launch; the purchas ing patterns of our distributors carrying inventory in the market; the willingness of surgeons and patients to adopt a new product and procedure; patterns of Visian ICL use that ha ve typically limited our penetration of the refractive procedure market, and a general decline in the demand for refractive surgery particularly in the U.S. and the Asia Pa cific region, which STAAR believes has resulted from both concerns about the safety and effectiveness of laser procedures and current economic conditions. The Visian Toric ICL and the Visian ICL with CentraFLOW are not yet approved for sale in the United States. In addition, to supplement the GAAP numbers, this presentation includes supplemental non - GAAP financial information, which STAAR believes investors will find helpful in understanding its operating performance. “Adjusted Net Income” excludes the following items that are included in “Net Income (L oss)” as calculated in accordance with U.S. generally accepted accounting principles (“GAAP”): manufacturing consolidation expenses, gain or loss on foreign currency tran sactions, Spain distribution transition cost, the fair value adjustment of outstanding warrants issued in 2007, stock - based compensation expenses and FDA TICL Panel expenses. A table reconciling the GAAP information to the non - GAAP information is included in our financial release which can be found in our Form 8 - K filed on April 28, 2014 and also available on our website. 2

Agenda 2014 Metric Update Barry G. Caldwell Chief Executive Officer Q1 Key Financial Results Steve Brown Chief Financial Officer Operational Updates Barry G. Caldwell Chief Executive Officer 3 Q&A Session Your Questions
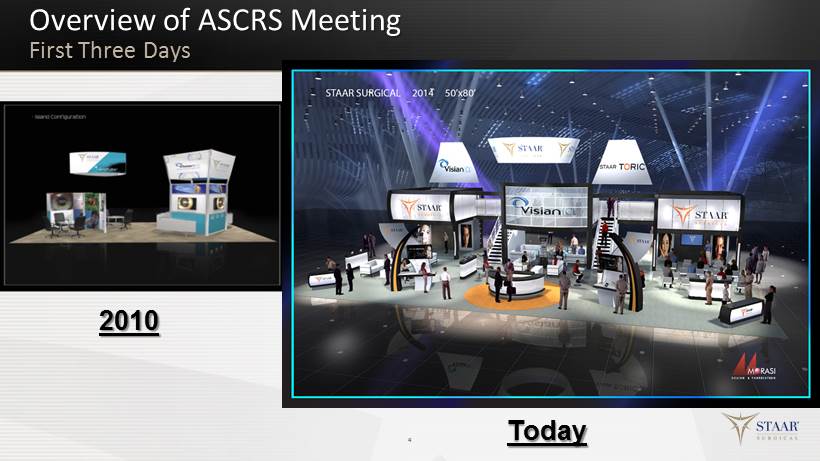
Overview of ASCRS Meeting First Three Days 4 2010 Today
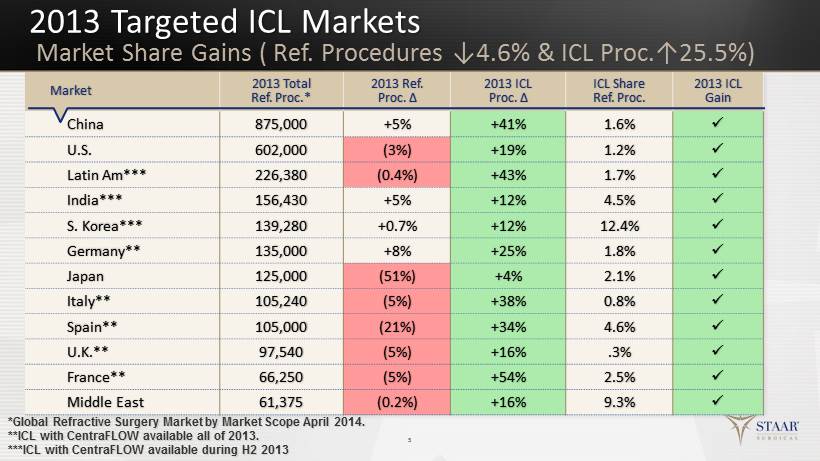
2013 Targeted ICL Markets 5 Market 2013 Total Ref. Proc.* 2013 Ref. Proc. ∆ 2013 ICL Proc. ∆ ICL Share Ref. Proc. 2013 ICL Gain China 875,000 +5% +41% 1.6% x U.S. 602,000 (3%) +19% 1.2% x Latin Am*** 226,380 (0.4%) +43% 1.7% x India*** 156,430 +5% +12% 4.5% x S. Korea*** 139,280 +0.7% +12% 12.4% x Germany** 135,000 +8% +25% 1.8% x Japan 125,000 (51%) +4% 2.1% x Italy** 105,240 (5%) +38% 0.8% x Spain** 105,000 (21%) +34% 4.6% x U.K.** 97,540 (5%) +16% .3% x France** 66,250 (5%) +54% 2.5% x Middle East 61,375 (0.2%) +16% 9.3% x *Global Refractive Surgery Market by Market Scope April 2014. **ICL with CentraFLOW available all of 2013. ***ICL with CentraFLOW available during H2 2013 Market Share Gains ( Ref. Procedures ↓4.6% & ICL Proc.↑25.5%)

Key Operating Metrics for 2014 Annual Metrics 6 2014 Operating Metrics Q1 Q2 Q3 Q4 Revenue Growth of 8% to 10% ICL Revenue Growth of 20% GM Expansion of 300 bps GAAP Profitable Full Year Complete Mfg. Consolidation Mid - Year

Key Operating Metrics for 2014 Revenue Growth 7 2014 Operating Metrics Q1 Revenue Growth of 8% to 10% ICL Revenue Growth of 20% GM Expansion of 300 bps GAAP Profitable Full Year Complete Mgr. Consolidation Mid - Year
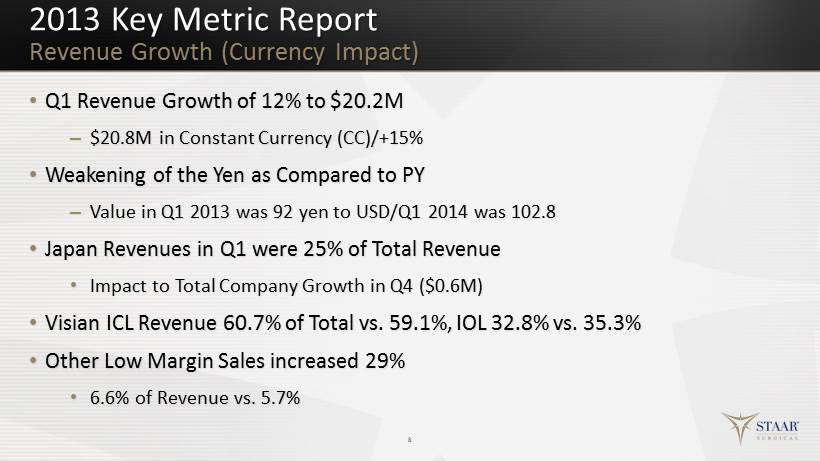
2013 Key Metric Report Revenue Growth (Currency Impact) • Q1 Revenue Growth of 12% to $20.2M – $20.8M in Constant Currency (CC )/+15% • Weakening of the Yen as Compared to PY – Value in Q1 2013 was 92 yen to USD/Q1 2014 was 102.8 • Japan Revenues in Q1 were 25% of Total Revenue • Impact to Total Company Growth in Q4 ($ 0 .6M ) • Visian ICL Revenue 60.7% of Total vs. 59.1%, IOL 32.8% vs. 35.3% • Other Low Margin Sales increased 29% • 6.6% of Revenue vs. 5.7% 8
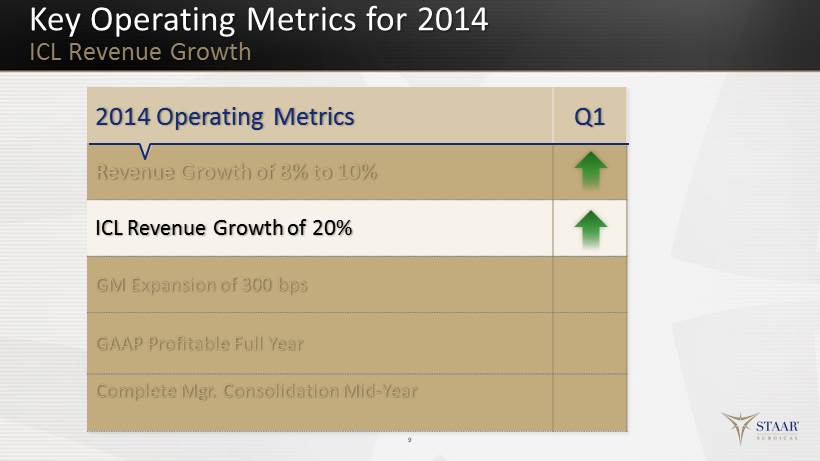
Key Operating Metrics for 2014 ICL Revenue Growth 9 2014 Operating Metrics Q1 Revenue Growth of 8% to 10% ICL Revenue Growth of 20% GM Expansion of 300 bps GAAP Profitable Full Year Complete Mgr. Consolidation Mid - Year
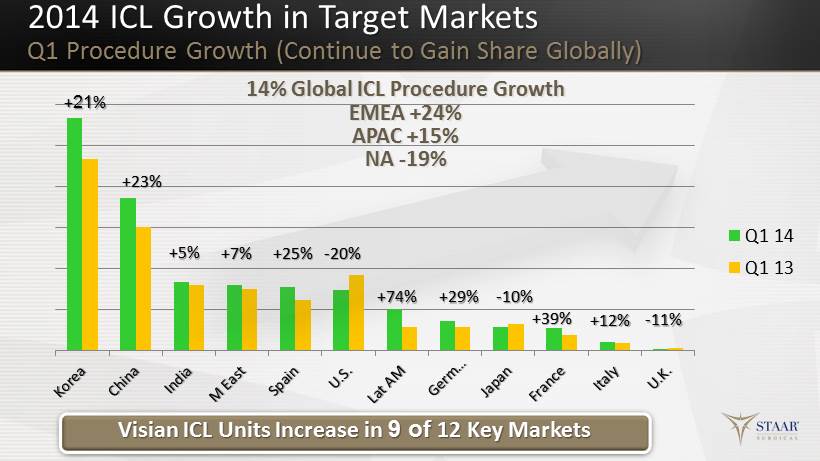
Q1 14 Q1 13 Visian ICL Units Increase in 9 of 12 Key Markets 2014 ICL Growth in Target Markets Q1 Procedure Growth (Continue to Gain Share Globally) + 21 % +23% + 5 % + 7 % - 20% +74 % +29% - 10% +39% +12% - 11% +25% 14% Global ICL Procedure Growth EMEA + 24% APAC + 15% NA - 19%
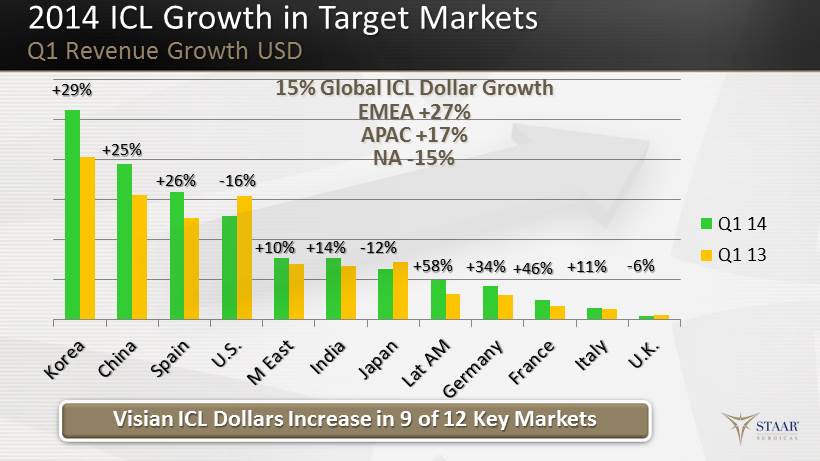
Q1 14 Q1 13 Visian ICL Dollars Increase in 9 of 12 Key Markets 2014 ICL Growth in Target Markets Q1 Revenue Growth USD +26% +29% +25 % - 16% + 10% - 12% +14 % +46% + 34% + 58% - 6% + 11% 15% Global ICL Dollar Growth EMEA +27% APAC +17% NA - 15%

2014 Key Metric Report Revenue Growth (IOL Growth) • Q1 Sales Were $6.6M , Increase of $0.3M or 4% – In CC $7.1M or 12% Increase – Negative Impact of Foreign Exchange was $0.5M • IOL Units Increased 16% in the Quarter – +22% in Japan Driven by Preloaded Silicone IOLs – +59% in Europe Driven by KS IOLs • Approximately $ 0.5M Backorders Remain for Europe • Supply of KS IOLs Looks Much More Promising for 2014 – Starting Rebuilding IOL Consignments in Japan during Quarter – May Look to Expand to New Markets in Europe the Second Half 12

Japan U.S. EMEA China Total Q1 14 Q1 13 Revenue in CC +$748k or 12% Increase 2014 IOL Growth Q1 IOL Revenue Growth USD +2% / +15% - 6% +64% - 46 % +4% / +12%
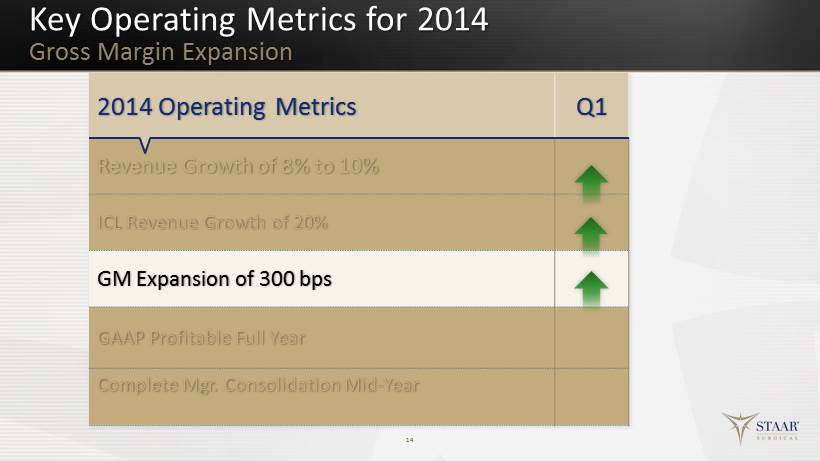
Key Operating Metrics for 2014 Gross Margin Expansion 14 2014 Operating Metrics Q1 Revenue Growth of 8% to 10% ICL Revenue Growth of 20% GM Expansion of 300 bps GAAP Profitable Full Year Complete Mgr. Consolidation Mid - Year
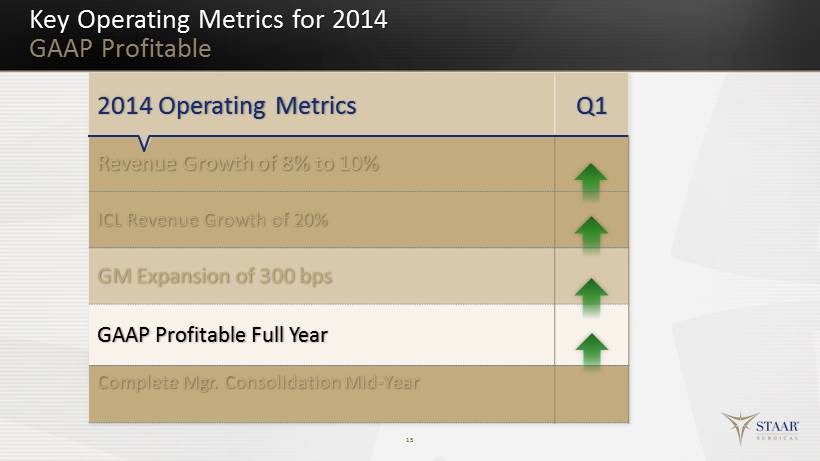
Key Operating Metrics for 2014 GAAP Profitable 15 2014 Operating Metrics Q1 Revenue Growth of 8% to 10% ICL Revenue Growth of 20% GM Expansion of 300 bps GAAP Profitable Full Year Complete Mgr. Consolidation Mid - Year

Key Operating Metrics for 2014 GAAP Profitable 16 2014 Operating Metrics Q1 Revenue Growth of 8% to 10% ICL Revenue Growth of 20% GM Expansion of 300 bps GAAP Profitable Full Year Complete Mfg. Consolidation Mid - Year
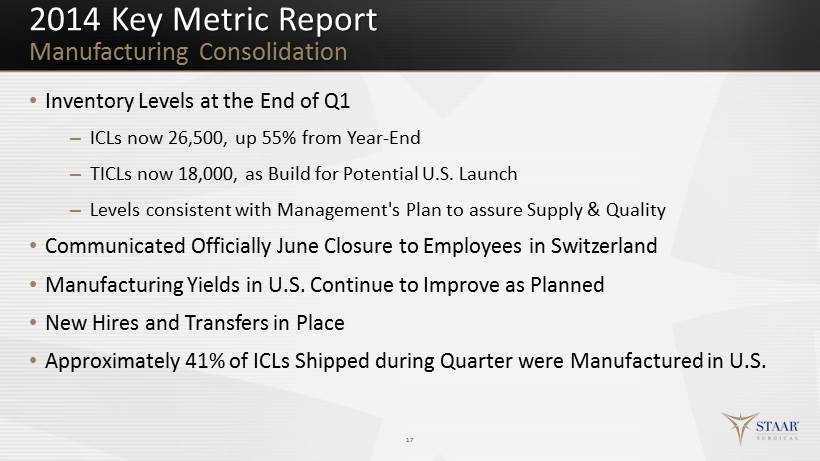
2014 Key Metric Report Manufacturing Consolidation • Inventory Levels at the End of Q1 – ICLs now 26,500, up 55% from Year - End – TICLs now 18,000, as Build for Potential U.S. Launch – Levels consistent with Management's Plan to assure Supply & Quality • Communicated Officially June Closure to Employees in Switzerland • Manufacturing Yields in U.S. Continue to Improve as Planned • New Hires and Transfers in Place • Approximately 41% of ICLs Shipped during Quarter were Manufactured in U.S. 17
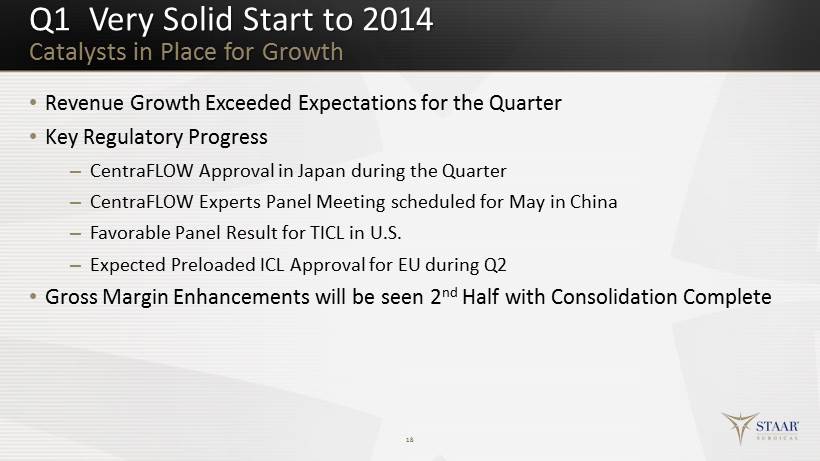
Q1 Very Solid Start to 2014 Catalysts in Place for Growth • Revenue Growth Exceeded Expectations for the Quarter • Key Regulatory Progress – CentraFLOW Approval in Japan during the Quarter – CentraFLOW Experts Panel Meeting scheduled for May in China – Favorable Panel Result for TICL in U.S . – Expected Preloaded ICL Approval for EU during Q2 • Gross Margin Enhancements will be seen 2 nd Half with Consolidation Complete 18

Q4 Key Financial Results Topics to Discuss • GAAP and non - GAAP P&L • Gross Margin Expansion Plan • Operating Expenses • Tax Provisions for the Year 19
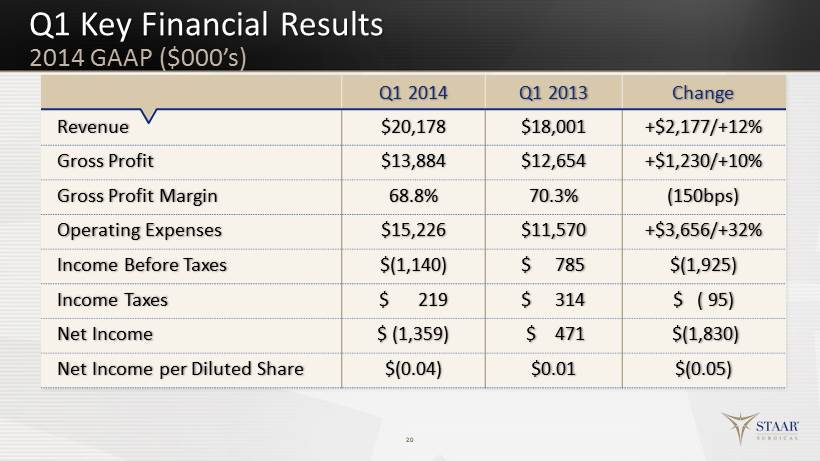
Q1 Key Financial Results 20 Q1 2014 Q1 2013 Change Revenue $20,178 $18,001 +$2,177/+12% Gross Profit $13,884 $12,654 +$1,230/+10% Gross Profit Margin 68.8% 70.3% (150bps) Operating Expenses $15,226 $11,570 +$3,656/+32% Income Before Taxes $(1,140) $ 785 $(1,925) Income Taxes $ 219 $ 314 $ ( 95) Net Income $ ( 1,359) $ 471 $(1,830) Net Income per Diluted Share $(0.04) $0.01 $(0.05) 2014 GAAP ($000’s )
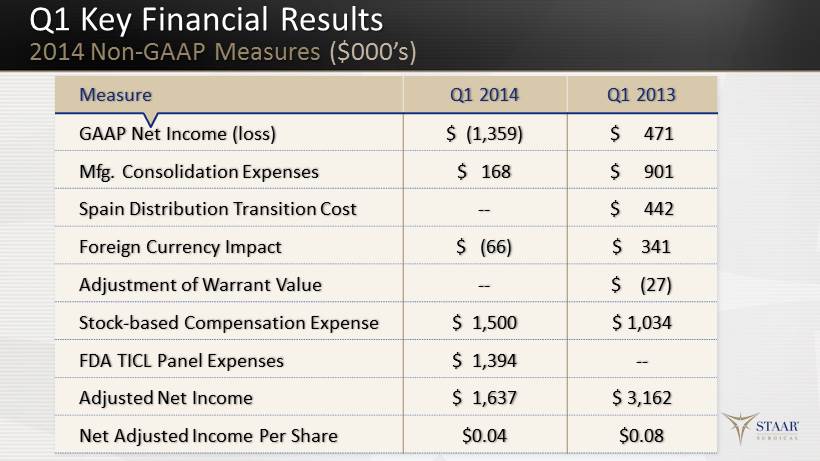
Q1 Key Financial Results 2014 Non - GAAP Measures ($000’s) 21 Measure Q1 2014 Q1 2013 GAAP Net Income (loss) $ (1,359) $ 471 Mfg. Consolidation Expenses $ 168 $ 901 Spain Distribution Transition Cost -- $ 442 Foreign Currency Impact $ (66) $ 341 Adjustment of Warrant Value -- $ ( 27 ) Stock - based Compensation Expense $ 1,500 $ 1,034 FDA TICL Panel Expenses $ 1,394 -- Adjusted Net Income $ 1,637 $ 3,162 Net Adjusted Income Per Share $0.04 $0.08
Gross Margin Expansion How we get There from Here? • Additional Cost Associated with Start Up Costs for ICLs in U.S. • Approximately a 140 bps impact • Negative Impact from Increased Low Margin Other Sales – Preloaded Injectors sold to Third Party for use in their IOL line – Margins still to run about 30% and Increased 34% during the Quarter – Approximately a 90 bps impact • Decreased Average Selling Prices on IOLs declined due to geographic mix – Approximately a 77 bps impact • Increased Average Selling Prices on ICLs had a positive impact • Expect this to Continue and Expand D uring the Year 22

Operating Expenses Q1 Expenses Higher than Expected • Cost of FDA Panel Meeting for TICL • $1.4M without Costs of Employees and Travel • Basically had to Pay for Two Panel Meetings during the Quarter due to Postponement • G&A Increased by $1.4M • Primarily Driven by Compensation and Recruiting Costs • Sales and Marketing Increased by $0.9M • Some of Increase Related to Anticipated Launch of TICL in U.S. 23

Tax Provisions for 2014 How the Year Should Progress • Income Tax Provision of $219k for Q1 2014 vs. $314k for Q1 2013 • Tax Benefits from Manufacturing Consolidation being Partially Realized During the Year • The Tax Provision for the Year is Projected on an Annual Basis • Expected to be Approximately 30% • It can be Higher or Lower in Interim Periods though averaging 30% for the Year 24

2014 Key Financial Results Outlook • Gross Margin Expected to Show Recovery • H2 Should provide Expansion due to Consolidation • Increased Supply of the KS IOL Product will Drive Sales into Higher Gross Margin Markets • Gross Margins would also Benefit from the TICL when approved for commercialization • Lower Gross Margin Injector will Continue to be a Drag on Overall Gross Margins • Operating Expenses • G&A Increases Expected to be Minimized • Continue to Invest in Sales and Marketing for Revenue Growth • FDA Panel Costs were One Time • Tax Provision for the Year • Some Potential Upside 25

Expanded Market Opportunities TICL Opportunity in U.S. • National Health and Nutrition Survey (NHANES; 1999 - 2004) – Myopia Prevalence 33.1% ( - 1.0D or higher) – Astigmatism Prevalence 36.2% (cylinder of 1.0D or higher) • Market Scope >100k Refractive Procedures >1.0D Astigmatism • In Markets Where B oth ICL and TICL Available: – Approximately 50% of Revenue and 40% of Units are TICL, Europe higher • Direct Pricing Model Suggests an Additional $200 for TICL • Potential TICL Approval I mpact to U.S. Market – Assuming U.S. Follows Patterns of other Markets Total ICL Sales S hould D ouble in First Y ear of Launch – How much Actual P ent Up Demand in the Market 26 Sources: Global Refractive Surgery Market by Market Scope January 2013 and Vitale, et al. Arch Ophthalmol . 2008;126(8):1111 - 1119. .

Expanded Market Opportunities TICL Opportunity in U.S. • Average Patient in TICL Study Trial was - 9.37D of myopia and 1.95D of astigmatism 27
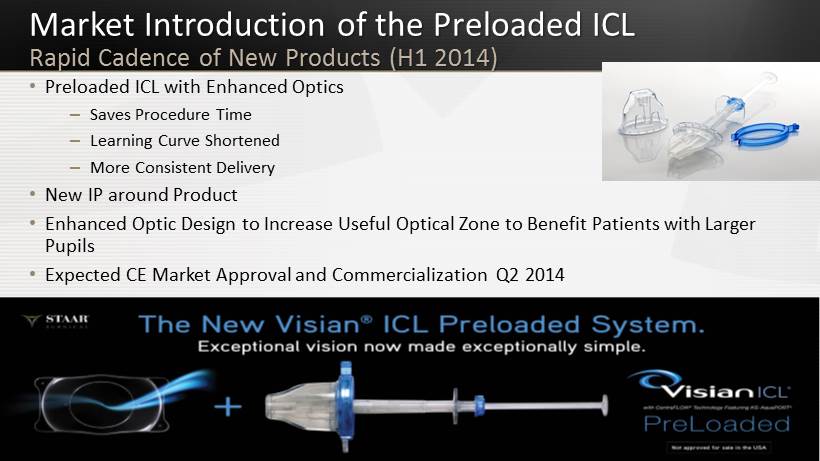
Market Introduction of the Preloaded ICL Rapid Cadence of New Products (H1 2014) 28 • Preloaded ICL with Enhanced Optics – Saves Procedure Time – Learning Curve Shortened – More Consistent Delivery • New IP around Product • Enhanced Optic Design to Increase U seful O ptical Z one to Benefit P atients with Larger Pupils • Expected CE Market Approval and Commercialization Q2 2014
V6 ICL Next in Line (V6a ICL) Rapid Cadence of New Products • Differentiates ICL for Myopic P atients N earing Age 40 Who Will Need Near & Intermediate Adds • Goal To Add Near - Vision Enhancement Capability – Treats the Early Onset and Progression of Presbyopia – Adds ≈2.0 Diopters of Near While Providing Good Intermediate • Increases ICL’s Advantages over LASIK and No Decision – Common Perception: “My LASIK has Worn Out” • Should Drive Adoption Further Down the Myopic Diopter Curve where Greater Opportunity Exists • Target Availability in EU Early 2015 29 Source: The Global Presbyopia Surgery Market by Market Scope October 2013.
V6 ICL Next in Line (V6b ICL) Rapid Cadence of New Products • Targets New Market : Presbyopic Patients A ge 40 and Above – Solution to the Need for Permanent N ear & Intermediate V ision E nhancement – 100% of Population over Approximately A ge 50 Affected (Estimated 1.8 Billion Are Challenged with Presbyopia, 3.6 Billion Eyes ) • Goal To Treat Presbyopia W hile M aintaining N atural Lens – Utilizes Proven Platform of the ICL (>425,000 successful implants) • Expands the Market for ICL to Potentially the “Most E xciting S egment of Vision C orrection ” • Clinical Trials Likely Needed to Increase the Approved A ge Range • Estimated Date to Market 12 Months after V6a 30 Source: The Global Presbyopia Surgery Market by Market Scope October 2013.
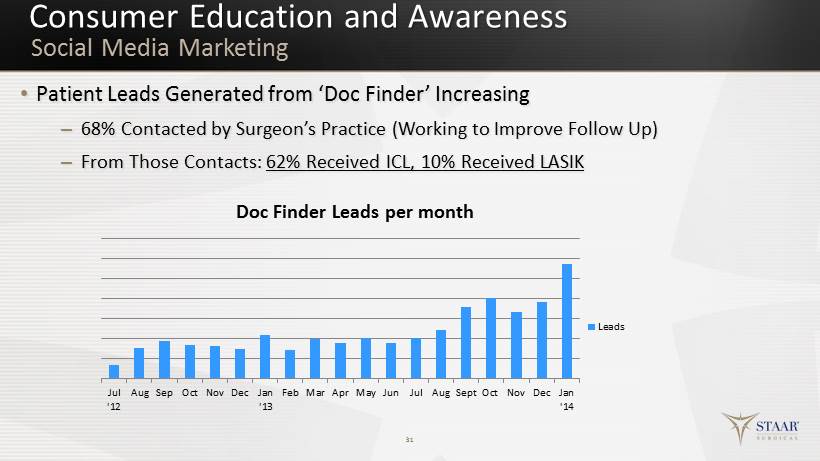
Consumer Education and Awareness • Patient Leads G enerated from ‘Doc Finder’ Increasing – 68% Contacted by Surgeon’s Practice (Working to Improve Follow Up) – From Those Contacts: 62% Received ICL, 10% Received LASIK 31 Social Media Marketing Jul '12 Aug Sep Oct Nov Dec Jan '13 Feb Mar Apr May Jun Jul Aug Sept Oct Nov Dec Jan '14 Doc Finder Leads per month Leads
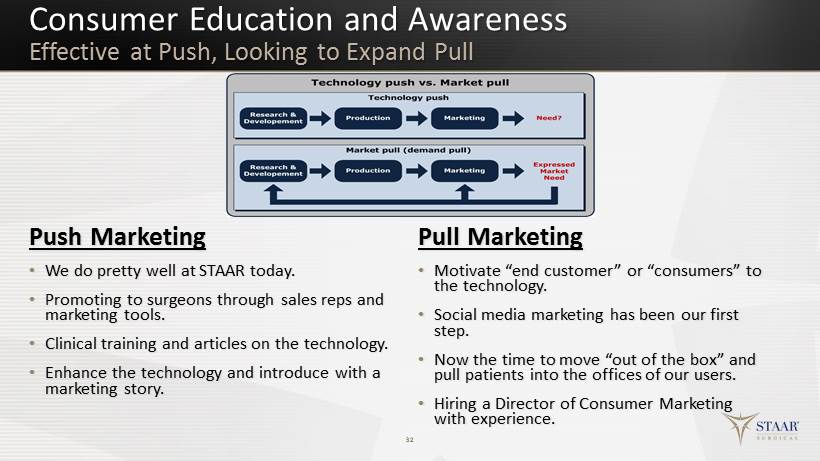
Consumer Education and Awareness Effective at Push, Looking to Expand Pull Push Marketing • We do pretty well at STAAR today. • Promoting to surgeons through sales reps and marketing tools. • Clinical training and articles on the technology. • Enhance the technology and introduce with a marketing story. Pull Marketing • Motivate “end customer” or “consumers” to the technology. • Social media marketing has been our first step. • Now the time to move “out of the box” and pull patients into the offices of our users. • Hiring a Director of Consumer Marketing with experience. 32
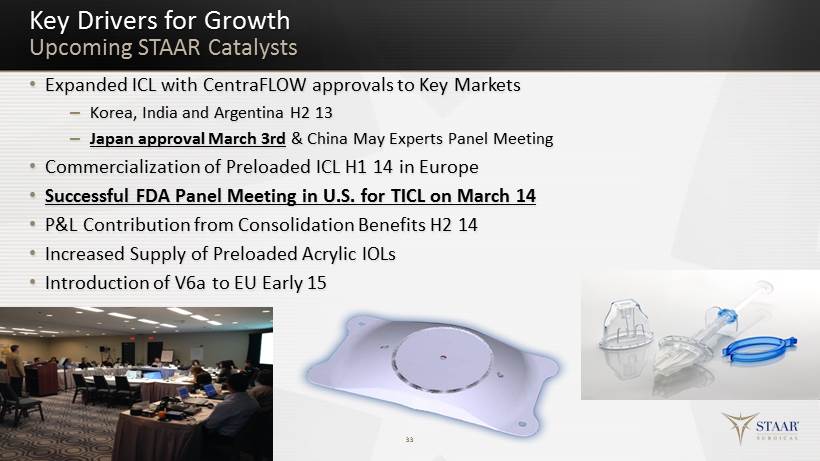
• Expanded ICL with CentraFLOW approvals to Key Markets – Korea, India and Argentina H2 13 – Japan approval March 3rd & China May Experts Panel Meeting • Commercialization of Preloaded ICL H1 14 in Europe • Successful FDA Panel Meeting in U.S. for TICL on March 14 • P&L Contribution from Consolidation Benefits H2 14 • Increased Supply of Preloaded Acrylic IOLs • Introduction of V6a to EU E arly 15 33 Key Drivers for Growth Upcoming STAAR Catalysts

Upcoming Investor Meetings • May 7 th at Deutsche Bank Healthcare Conference in Boston • May 15 th at Bank of America Conference in Las Vegas • May 29 th at Benchmark Conference in Milwaukee • June 2 nd at Jefferies Healthcare Conference in New York City • Our Annual Shareholders Meeting in Monrovia on June 9 th • We Expect to Report our Q2 Results on July 30 th 34

Thank You YOUR QUESTIONS PLEASE 35

36 NASDAQ: STAA Q1 2014 Results – Investor Presentation From the American Society of Cataract and Refractive Surgery Meeting April 28, 2014