Attached files
| file | filename |
|---|---|
| 8-K - FORM 8-K - FARMERS NATIONAL BANC CORP /OH/ | d716349d8k.htm |
Exhibit 99.1

| 1 Investor Presentation March 31, 2014 |

| 2 Disclosure Statement Forward-Looking Statements This presentation contains forward-looking statements within the meaning of the Private Securities Litigation Reform Act of 1995. Forward-looking statements express management's current expectations, forecasts of future events or long-term-goals and, by their nature, are subject to assumptions, risks and uncertainties. Actual results could differ materially from those indicated. Farmers National Banc Corp. ("Farmers") refers you to its periodic reports and registration statements filed with the Securities and Exchange Commission, including its Annual Report on Form 10-K for the year ended December 31, 2013 and Quarterly Report on Form 10-Q for the period ended September 30, 2013 which have been filed with the Securities and Exchange Commission and are available on Farmers' website (www.farmersbankgroup.com) and on the Securities and Exchange Commission's website (www.sec.gov), for additional discussion of these assumptions, risks and uncertainties. Forward-looking statements are not guarantees of future performance and should not be relied upon as representing management's views as of any subsequent date. Farmers undertakes no obligation to update forward-looking statements, whether as a result of new information, future events or otherwise, except as may be required by law. Use of Non-GAAP Financial Measures This presentation contains certain financial information determined by methods other than in accordance with accounting principles generally accepted in the United States ("GAAP"). These non-GAAP financial measures include "Core Deposits" and "Pre-tax, Pre-provision Earnings". Farmers believes that these non-GAAP financial measures provide both management and investors a more complete understanding of the Company's deposit profile and profitability. These non-GAAP financial measures are supplemental and are not a substitute for any analysis based on GAAP financial measures. Because not all companies use the same calculation of "Core Deposits" and "Pre-tax, Pre- provision Earnings", this presentation may not be comparable to other similarly titled measures as calculated by other companies. |

| 3 Overview NASDAQ: FMNB Headquarters: Canfield, Ohio Stock Price: (3-31-14) $7.68 Market Cap: $144.24 million Dividend (yield): $0.12 (1.56%) 2013 Year-end Highlights 2013 Year-end Highlights Revenue $49.0 million Net Income $7.8 million Net Income per Diluted Share $0.41 Book Value $6.02 Total Assets $1.14 billion Total Deposits $915.2 million Cash Dividends $2.2 million |

| 4 Who We Are Leading community bank in Ohio with deposit market share in the top ten in the core counties in which we operate Founded over 126 years ago 18 branches and 18 ATMs Sound franchise with many opportunities for growth Profitable throughout cycle and growing tangible book value per share Diversified and growing revenue streams Compelling valuation: 1.35x of tangible book value 14.00x LTM pre-tax pre-provision earnings (excludes security gains) 1.56% dividend yield |

| 5 Note: Deposit data as of June 30, 2012 Source: SNL * Began Operations in Stark County in 2010 Opportunity for growth with approximately 10.60% deposit market share in the Mahoning Valley Large regional competitors lack focus - Community competitors inwardly focused Attractive Deposit Franchise - Deposit Market Share by MSA & County Stark Top 10 Stark Top 10 Stark Top 10 Stark Top 10 Stark Top 10 2013 Rank Company Branches Dep. ($000) Market Share 1 Firstmerit Bank, NA 17 1,498,826 26.28 2 The Huntington National Bank 27 1,407,877 24.69 3 JP Morgan Chase Bank NA 13 714,458 12.53 4 RBS Citizens, NA 14 597,938 10.49 5 KeyBank NA 14 592,547 10.39 6 PNC Bank, NA 10 308,807 5.42 7 Consumers National Bank 7 158,722 2.78 8 Premier Bank & Trust, NA 2 136,036 2.39 9 Fifth Third Bank 5 77,251 1.35 17 Farmers National Bank of Canfield 1 5,831 0.10 Total for Institutions in the Market 128 5,702,735 100.00 Columbiana Top 10 Columbiana Top 10 Columbiana Top 10 Columbiana Top 10 Columbiana Top 10 2013 Rank Company Branches Dep. ($M) Market Share 1 Huntington National Bank 11 332,137 24.33 2 Home Savings and Loan Co. of Youngstown 7 300,436 22.01 3 Farmers National Bank of Canfield 4 139,339 10.21 4 PNC Bank NA 6 131,503 9.63 5 JPMorgan Chase Bank NA 3 110,192 8.07 6 Consumers National Bank 3 96,574 7.07 7 1st National Community Bank 4 95,650 7.01 8 CFBank 2 67,433 4.94 9 RBS Citizens NA 1 44,982 3.30 10 KeyBank NA 1 44,512 3.26 Total for Institutions in the Market 44 1,365,054 100.00 Mahoning Top 10 Mahoning Top 10 Mahoning Top 10 Mahoning Top 10 Mahoning Top 10 2013 Rank Company Branches Dep. ($M) Market Share 1 Huntington National Bank 21 1,277,106 29.63 2 Home Savings and Loan Co. of Youngstown 10 742,041 17.22 3 Farmers National Bank of Canfield 8 541,721 12.57 4 PNC Bank NA 9 523,107 12.14 5 First Place Bank 12 433,595 10.06 6 JPMorgan Chase Bank NA 7 380,824 8.84 7 First National Bank of Pennsylvania 5 203,826 4.73 8 RBS Citizens NA 3 92,181 2.14 9 KeyBank National Association 4 76,756 1.78 10 Cortland Savings and Banking Co. 2 37,406 0.87 Total for Institutions in the Market 82 4,309,664 100.00 Trumbull Top 10 Trumbull Top 10 Trumbull Top 10 Trumbull Top 10 Trumbull Top 10 2013 Rank Company Branches Dep. ($M) Market Share 1 Huntington National Bank 16 582,383 20.71 2 First Place Bank 7 580,513 20.64 3 JPMorgan Chase Bank NA 10 394,104 14.01 4 Cortland Savings and Banking Co. 7 344,040 12.23 5 PNC Bank NA 7 261,382 9.29 6 Farmers National Bank of Canfield 7 218,783 7.78 7 Home Savings and Loan Co. of Youngstown 4 129,590 4.61 8 First National Bank of Pennsylvania 3 86,765 3.09 9 Home FS&LA of Niles 1 63,073 2.24 10 The Middlefield Banking Company 1 48,388 1.72 Total for Institutions in the Market 68 2,812,155 100.00 |
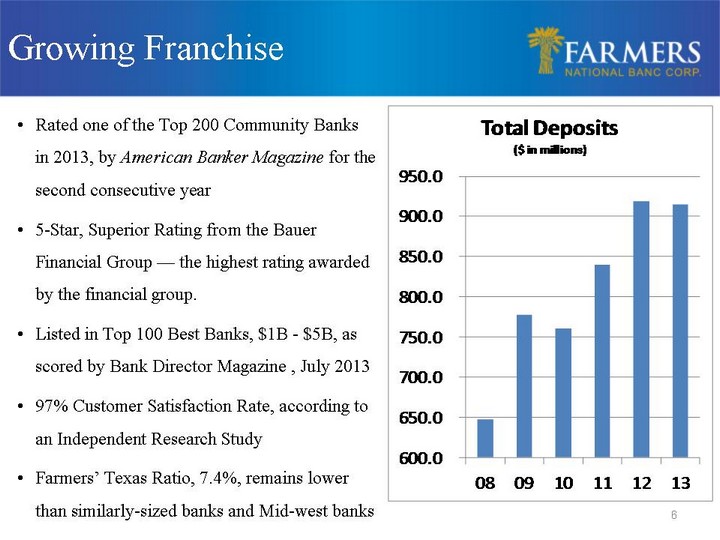
| 6 Rated one of the Top 200 Community Banks in 2013, by American Banker Magazine for the second consecutive year 5-Star, Superior Rating from the Bauer Financial Group - the highest rating awarded by the financial group. Listed in Top 100 Best Banks, $1B - $5B, as scored by Bank Director Magazine , July 2013 97% Customer Satisfaction Rate, according to an Independent Research Study Farmers' Texas Ratio, 7.4%, remains lower than similarly-sized banks and Mid-west banks Growing Franchise |

| 7 Increasing Shareholder Value Stable Dividend Policy Always paid a quarterly cash dividend Current yield 1.56% Dividend payout in 2013 was 28.9% of net income Stock Up 82% Since '08 |
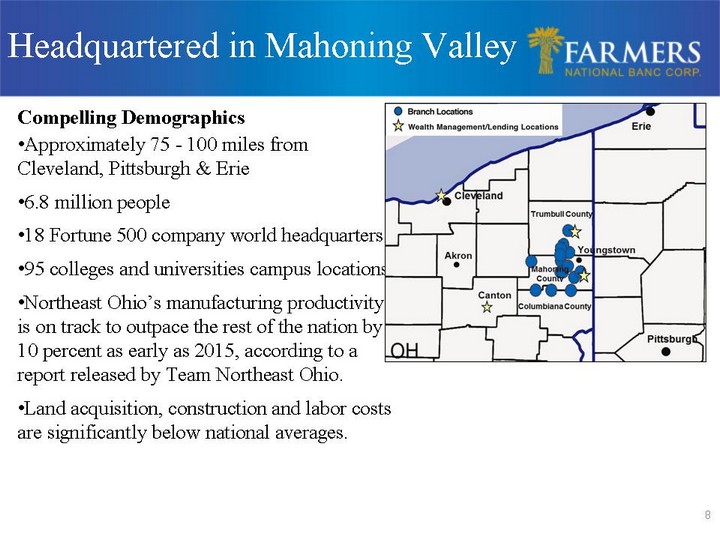
| 8 Headquartered in Mahoning Valley Compelling Demographics Approximately 75 - 100 miles from Cleveland, Pittsburgh & Erie 6.8 million people 18 Fortune 500 company world headquarters 95 colleges and universities campus locations Northeast Ohio's manufacturing productivity is on track to outpace the rest of the nation by 10 percent as early as 2015, according to a report released by Team Northeast Ohio. Land acquisition, construction and labor costs are significantly below national averages. |

| 9 Source: Regional Chamber, Youngstown-Warren, Ohio Metropolitan Profile ,Valley Leads in Industrial Job Growth in NE Ohio, The Vindicator ,Ohio's Economic Impact Study - September, 2011 & 2012 Industrial Growth Returning to the Valley Steelmaker Vallourec's $650 million expansion - 350 jobs created. ($57 million Finishing Plant) Exterran $13 million plant - Approximately 100 jobs will be created once production begins. General Motors announced in August 2012 a three-year commitment and an investment of more than $200 million to manufacture the all- new Chevrolet Cruze at the Lordstown Assembly Plant, retaining about 4,500 jobs in the Valley Pennant Midstream, LLC constructing $300 million pipeline and natural gas processing plant in eastern Mahoning County. The Hickory Bend Pipeline System and associated cryogenic gas- processing plant is expected to be operational by the end of 2013. Regional Growth Opportunities |

| 10 Source: Regional Chamber, Youngstown-Warren, Ohio Metropolitan Profile ,Valley Leads in Industrial Job Growth in NE Ohio, The Vindicator ,Ohio's Economic Impact Study - September, 2011 & 2012 Growing Interest in Utica Gas Formation Development From 4th Quarter 2013, 352 wells reported production. 45 wells awaiting infrastructure completion and reported no production. Compared to linked quarter, oil production is up 8% to 104,000 barrels and natural gas is up 28% to 9.5 million Mcf. Ohio's Natural Gas/Crude Oil Exploration Production Industry and the Utica Gas Formation impact: Jobs (204,000 created or supported by 2015) Income (Economic Output will increase by over $22 billion by 2015) Regional Growth Opportunities |
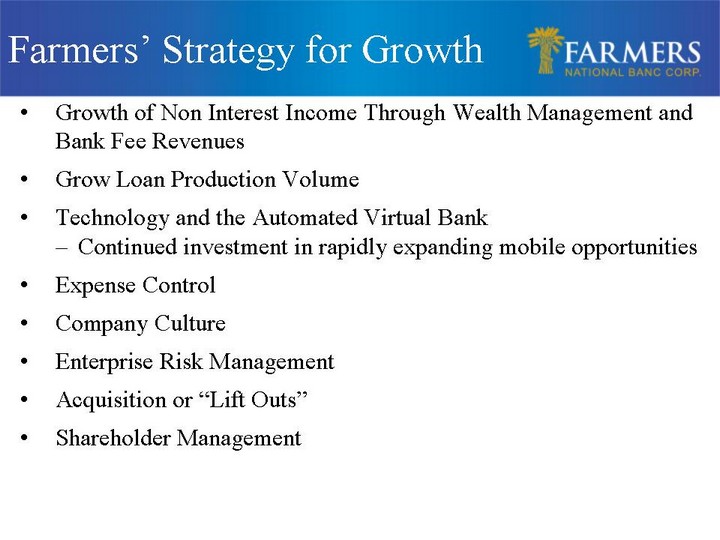
| Farmers' Strategy for Growth Growth of Non Interest Income Through Wealth Management and Bank Fee Revenues Grow Loan Production Volume Technology and the Automated Virtual Bank Continued investment in rapidly expanding mobile opportunities Expense Control Company Culture Enterprise Risk Management Acquisition or "Lift Outs" Shareholder Management |
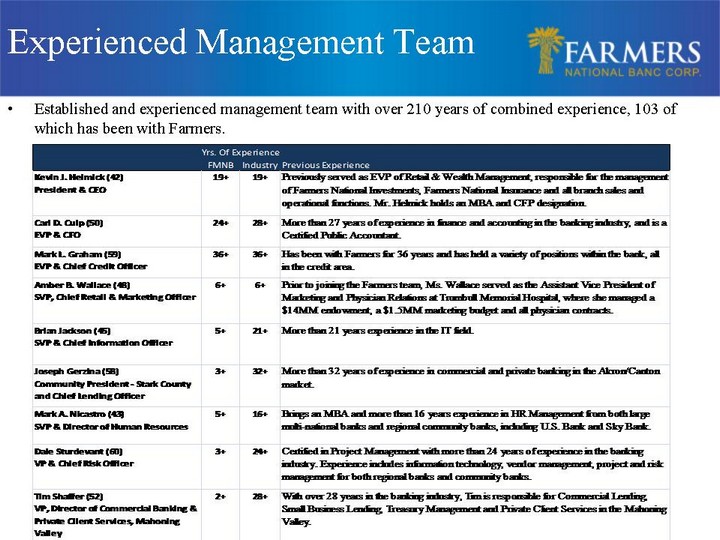
| Established and experienced management team with over 210 years of combined experience, 103 of which has been with Farmers. Experienced Management Team |
| Competitive Landscape Regulatory and Competitive Landscape Significant Competition for Customer's Share of Wallet Consolidation of Banks in Ohio and Nationally Increasing Regulatory Concerns Economic Challenges Strategy for Profitability Strong Capital Position Strong Asset Quality Loan Growth Diversifying Revenue Stream Controlling Non-interest Expenses |
| 14 Focus for Growth Continued organic growth in current markets Growth opportunities in new markets with Private Banking, Trust and Investments Targeted acquisitions include fee-based business and banks Target Metrics for Acquisition Accretive to earnings near term (excluding one-time charges) Manageable initial tangible book value dilution recoverable near term Growth of fee revenue to 30+% of total revenue A compelling IRR in low double digits Must enhance shareholder value Must sustain our culture Not materially change our investment merits Sustain our TCE and regulatory ratios Growth Focus and Target Metrics |

| The Health of Our Wealth Wealth Management Creates Fee-based Income Fee Income 2009: 14.5% of total gross income Noninterest income excluding security gains Fee Income 2013: 26.7% of total gross income Noninterest income excluding security gains Wealth Management Build-out Timeline 2000 Farmers National Investments 2009 Farmers Trust Company 2010 Farmers National Insurance 2012 Private Client Services 2013 National Associates, Inc. |

| 16 Butler Wick Trust Company Acquisition Acquired for cash on March 31, 2009 Only locally owned trust company in the Mahoning Valley Rebranded to Farmers Trust Company Trust assets increased approximately 78% since acquisition Contributed $5.7 million to non-interest income in 2013 National Associates, Inc. Acquisition Acquired on July 1, 2013 from owner for cash and stock A leading independent consultant to retirement plans. Offers actuarial, plan design, compliance and administrative services Located in Cleveland, Ohio 200 retirement plans with assets under administration of $500 million Acquisitions to Enhance Fee-Based Revenue |
| 17 High net interest margin which has exceeded Midwest banks1 peer average 3.56% 1Q 2014 3.58% Year-end 2013 Strong record of profitability 125 consecutive quarters of profitability Average ROAA and ROAE from 2009 through 2013 of 0.79% and 8.32%, respectively ROAA impacted by investment into new markets and services such as private client services Continue to invest in operations to support ongoing growth, yet maintain a strong balance sheet Historical Operating Results 1 Selected Capital & Credit Quality Banks with Assets $800 Million - $2.0 Billion; No TARP; TCE / TA >= 7.0%; NPAs / Assets < 2.5% and Positive LTM Net Income Source: SNL Financial |

| Corporate Efficiencies Profit Improvement Committee (PIC) Branch Efficiencies Closing of Leetonia and Warren Branches Customer accounts transferred to Columbiana and Eastwood Minimal account loss Elimination of Assistant Manager Position Checking Account Fee/Service Charge Adjustments Fees and service charges had not been adjusted since 2003 Created an additional $200,000 from September to December in income and $36,000 in savings |

| 19 125 consecutive quarters of profitability Net income per diluted share for three months ended March 31, 2014 was $0.12, an increase of 9% compared to $0.11 for the first quarter, 2013 Efficiency ratio for the first quarter improved to 69.87%, compared to 72.57% for the same quarter in 2013 Loans increased 5.7% since March 31, 2013 Non-performing assets to total assets remain at low levels, 0.76% at March 31, 2014 Continued Strong Results - Overview of 1Q 2014 |

| 20 Growing and Diverse Revenue Stream Note: Revenue defined as net interest income plus non-interest income. Excludes $860m net gain on securities (CHART) (CHART) (CHART) |

| 21 Diverse loan mix No national lending No sub-prime lending Farmers' practice is to lend primarily within its market area Less than 2% of loan portfolio is participations purchased Less than 4% of loan portfolio is construction loans Loan Portfolio Mix - March 31, 2014 Overview of Loan Portfolio Note: Dollars in thousands (CHART) (CHART) (CHART) |
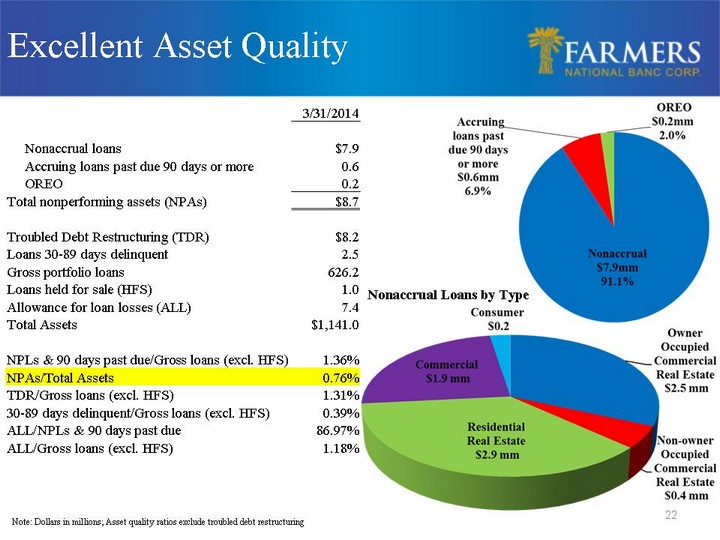
| 22 Excellent Asset Quality Note: Dollars in millions; Asset quality ratios exclude troubled debt restructuring 3/31/2014 Nonaccrual loans $7.9 Accruing loans past due 90 days or more 0.6 OREO 0.2 Total nonperforming assets (NPAs) $8.7 Troubled Debt Restructuring (TDR) $8.2 Loans 30-89 days delinquent 2.5 Gross portfolio loans 626.2 Loans held for sale (HFS) 1.0 Allowance for loan losses (ALL) 7.4 Total Assets $1,141.0 NPLs & 90 days past due/Gross loans (excl. HFS) 1.36% NPAs/Total Assets 0.76% TDR/Gross loans (excl. HFS) 1.31% 30-89 days delinquent/Gross loans (excl. HFS) 0.39% ALL/NPLs & 90 days past due 86.97% ALL/Gross loans (excl. HFS) 1.18% Nonaccrual Loans by Type (CHART) (CHART) |

| 23 Supplemental Information |

| 24 GAAP to Non-GAPP Reconciliation Reconciliation of Common Stockholders' Equity to Tangible Common Equity Reconciliation of Common Stockholders' Equity to Tangible Common Equity Reconciliation of Common Stockholders' Equity to Tangible Common Equity Reconciliation of Common Stockholders' Equity to Tangible Common Equity March 31, Dec. 31, Sept. 30, June 30, March 31, 2014 2013 2013 2013 2013 Stockholders' Equity $117,323 $113,007 $112,524 $114,316 $120,576 Less Goodwill and other intangibles 10,151 10,343 10,546 5,836 5,934 Tangible Common Equity $107,172 $102,664 $101,978 $108,480 $114,642 Reconciliation of Total Assets to Tangible Assets Reconciliation of Total Assets to Tangible Assets March 31, Dec. 31, Sept. 30, June 30, March 31, 2014 2013 2013 2013 2013 Total Assets $1,141,000 $1,137,326 $1,148,119 $1,123,489 $1,143,099 Less Goodwill and other intangibles 10,151 10,343 10,546 5,836 5,934 Tangible Assets $1,130,849 $1,126,983 $1,137,573 $1,117,653 $1,137,165 Reconciliation of Income Before Taxes to Pre-Tax, Pre-Provision Income Reconciliation of Income Before Taxes to Pre-Tax, Pre-Provision Income Reconciliation of Income Before Taxes to Pre-Tax, Pre-Provision Income Reconciliation of Income Before Taxes to Pre-Tax, Pre-Provision Income For the Three Months Ended For the Three Months Ended For the Three Months Ended For the Three Months Ended For the Three Months Ended March 31, Dec. 31, Sept. 30, June 30, March 31, 2014 2013 2013 2013 2013 Income before income taxes $2,818 $2,936 $1,755 $2,272 $2,500 Provision for loan losses 330 525 340 170 255 Pre-tax, pre-provision income $3,148 $3,461 $2,095 $2,442 $2,755 |

| 25 Consolidated Statements of Income Consolidated Statements of Income For the Three Months Ended For the Three Months Ended For the Three Months Ended For the Three Months Ended For the Three Months Ended March 31, Dec. 31, Sept. 30, June 30, March 31, 2014 2013 2013 2013 2013 Total interest income $10,063 $10,298 $10,122 $10,273 $10,266 Total interest expense 1,207 1,257 1,274 1,234 1,298 Net interest income 8,856 9,041 8,848 9,039 8,968 Provision for loan losses 330 525 340 170 255 Other income 3,433 3,641 4,173 3,225 2,875 Other expense 9,141 9,221 10,926 9,822 9,088 Income before income taxes 2,818 2,936 1,755 2,272 2,500 Income taxes 627 641 143 404 495 Net income $2,191 $2,295 $1,612 $1,868 $2,005 |

| 26 Consolidated Statements of Financial Condition Consolidated Statements of Financial Condition Consolidated Statements of Financial Condition March 31, Dec. 31, Sept. 30, June 30, March 31, 2014 2013 2013 2013 2013 Assets Cash and cash equivalents $29,333 $27,513 $40,303 $26,587 $57,312 Securities available for sale 427,625 422,985 438,127 443,833 439,540 Loans held for sale 1,026 158 1,016 4,612 4,330 Loans 626,186 630,684 611,349 596,838 592,520 Less allowance for loan losses 7,387 7,568 7,369 7,590 7,508 Net Loans 618,799 623,116 603,980 589,248 585,012 Other assets 64,217 63,554 64,693 59,209 56,905 Total Assets $1,141,000 $1,137,326 $1,148,119 $1,123,489 $1,143,099 Liabilities and Stockholders' Equity Deposits $923,033 $915,216 $903,410 $901,886 $915,855 Other interest-bearing liabilities 92,815 101,439 118,322 101,589 101,659 Other liabilities 7,829 7,664 13,863 5,698 5,009 Total liabilities 1,023,677 1,024,319 1,035,595 1,009,173 1,022,523 Stockholders' Equity 117,323 113,007 112,524 114,316 120,576 Total Liabilities and Stockholders' Equity $1,141,000 $1,137,326 $1,148,119 $1,123,489 $1,143,099 |