Attached files
| file | filename |
|---|---|
| 8-K - 8-K - SAExploration Holdings, Inc. | v374267_8k.htm |
| EX-99.2 - EX-99.2 - SAExploration Holdings, Inc. | v374267_ex99-2.htm |
| EX-99.1 - EX-99.1 - SAExploration Holdings, Inc. | v374267_ex99-1.htm |
Exhibit 99.3

NASDAQ: SAEX NEW YORK, NY IPAA OGIS NEW YORK CONFERENCE

This presentation includes certain forward - looking statements, including statements regarding future financial performance, future growth and future acquisitions . These statements are based on SAE’s current expectations or beliefs and are subject to uncertainty and changes in circumstances . Actual results may vary materially from those expressed or implied by the statements herein due to changes in economic, business, competitive and/or regulatory factors, and other risks and uncertainties affecting the operation of SAE’s business . These risks, uncertainties and contingencies include : fluctuations in the levels of exploration and development activity in the oil and gas industry ; intense industry competition ; a limited number of customers ; the need to manage rapid growth ; delays , reductions or cancellations of service contracts ; operational disruptions due to seasonality, weather or other external factors ; crew productivity ; the availability of capital resources ; substantial international business exposing SAE to currency fluctuations and global factors, including economic, political and military uncertainties ; the need to comply with diverse and complex laws and regulations ; and other factors set forth in SAE’s filings with the Securities and Exchange Commission . The information set forth herein should be read in light of such risks . Except as required by law, SAE is not under any obligation to, and expressly disclaims any obligation to, update or alter its forward - looking statements, whether as a result of new information, future events, changes in assumptions or otherwise . Safe Harbor 2 NASDAQ: SAEX

History and Experience Founded in 2006 in Peru Executive management with an average of 30 + years of seismic experience each Rapid organic growth through international expansion and customer retention Top - Tier Customers Reduce customer exploration risks with dedication to safety and efficiency Utilize expertise in logistics to provide a full range of 2 D, 3 D and 4 D land and shallow water marine seismic services in geographically complex and challenging regions No multi - client library – 100 % of revenue is fully contracted and proprietary Strategy and Purpose Approximately 98 % of FY 2013 revenue was earned outside of the Lower 48 Operations in some of the most prolific oil producing regions of the world Focus on underdeveloped markets in South America, Southeast Asia and Africa, along with key operations in Alaska and Canada International Leverage Majority of clients are large, well established IOCs and NOCs Average relationship is 5 - 6 years Growing Backlog Backlog of $ 292 million as of December 31 , 2013 $ 475 million of total bids outstanding as of December 31 , 2013 Company Overview 3 NASDAQ: SAEX

Full Service Logistics and Seismic Provider 4 NASDAQ: SAEX Program Design Planning & Permitting Camp Services & Infrastructure Survey & Line Cutting Drilling Recording & Processing On average, approximately 80% of SAE’s revenues are earned through high - margin logistics - related activities performed in - house Typical Project Characteristics Program design and planning usually starts up to a year in advance On average, projects tend to last 3 – 6 months in duration, but can last multiple years Crew size is often up to 3,000 skilled laborers hired from local communities Ability to increase and control efficiencies with logistical services, as opposed to commoditized recording and processing activities Less susceptible to cancellation due to long - term nature of very expensive development programs, compared to more volatile, commodity - price driven short - term projects typical of the Lower 48

International Leverage 5 NASDAQ: SAEX SAE was built on the expertise and ability to operate in the most geographically complex and logistically challenging resource - producing regions of the world Very large reservoirs in relatively unexplored regions R elationships and expertise necessary to work with local governments and communities Recently awarded first project in Brazil Significant market share in Peru and Colombia with Brazil holding most near - term growth potential SOUTH AMERICA NAM is a mature 3D market Substantial market share in Alaska with major operations in Cook Inlet and North Slope Awarded 4 new projects in Alaska during Q4 2013 and Q1 2014 Entered Mexico through agreement with COMESA NORTH AMERICA Significant untapped markets Projects are logistically complex and fit well within SAE’s niche Tremendous opportunities in Ethiopia and Chad with new and prior customers AFRICA Abundant shallow - water marine opportunities Recently completed complex shallow - water project in Malaysia Actively working with long standing customers on new bids SOUTHEAST ASIA Expansion Markets

16% < 4% 80% 3 - 5% 12% 8% 40% 7 - 10% 25 - 30% $723 billion market $18 - 21 billion market Exploration Geophysics Development Data Library Sales Data Processing Land Equipment Land Acquisition Services Marine Equipment Marine Acquisition Services Market Opportunity 6 NASDAQ: SAEX Historical E&P Capex vs. Production Oil is becoming increasingly difficult and expensive to find Global E&P capex in 2014 is projected to reach $ 723 billion, of which $ 18 - 21 billion represents anticipated seismic spending The land acquisition services segment of the seismic market is estimated to account for between $ 5 to $ 6 billion of total E&P capex Source: Barclays 2014 Annual E&P Spending Survey; Management’s estimates Projected 2014 Global E&P Capex

Strategic Positioning 7 NASDAQ: SAEX Source: Barclays 2014 Annual E&P Spending Survey; BP Statistical Review June 2013 2014 Global E&P Spending by Region SAE strategically targets specific markets based on logistical complexity and client relationships SAE’s international markets account for over $ 400 billion of projected E&P spending and more than 44 % of the world’s oil reserves IOCs and NOCs have led the charge, enabling SAE to prosper from sound market positioning 2014 Est. E&P Spend = $723 billion YE 2012 Global Proved Oil Reserves 22% 78% U.S. Domestic International 22% 78% U.S. Domestic International 2014 Est . International E&P Spend = $567 billion 48% 20% 13% 8% 8% 3% Middle East SAM NAM Europe / Eurasia Africa Asia Pacific 1,669 billion barrels of oil $43m $115m $19m $84m $124m $40m $60m $50m $25m Canada Supermajors NAM Independents Latin America Asia, Australia, India Middle East Russia Europe Africa Other 22% 78% U.S. Domestic International

$0 $50 $100 $150 $200 $250 $300 $350 Q4 12 Q1 13 Q2 13 Q3 13 Q4 13 Millions Historical Backlog Adjusted Historical Backlog When adjusted to reflect the removal of $ 114 million of paused revenue beginning in Q 4 2012 , the resulting growth in backlog is over 158 % from $ 113 million at YE 2012 to $ 292 million at YE 2013 Smaller tack - on projects are taken with little notice in an effort to maintain optimal crew utilization and smooth out short - term delays and may not be reflected in the backlog Strength In Backlog 8 NASDAQ: SAEX Historical Backlog with Adjusted Growth (1)(2) Contracted Backlog = $292 million Current Backlog and Bids Outstanding (2) Backlog Realization Expectations Backlog $292 million Bids O/S $475 million (1) Historical backlog retroactively adjusted to reflect resulting growth apart from $114 million of paused revenue in Alaska da ting back to Q4 2012 that was removed during Q4 2013 (2) Backlog and Bids Outstanding are as of December 31, 2013, unless stated otherwise Note: Backlog only consists of committed work secured through a signed contract or letter of intent $114m of paused revenue removed from backlog 89% 11% 2014 2015 SAM SAM NAM SE Asia Africa SAM NAM SE Asia Africa

$8.8 $21.7 $41.7 $11.1 $15.0 $0 $10 $20 $30 $40 $50 2010 2011 2012 2013 2014E Millions Capital Expenditures 9 NASDAQ: SAEX Historical & Projected Equipment - Related Capital Spending During 2011 and 2012 , SAE invested approximately $ 63 million in new equipment, transforming its equipment profile from mostly rental to roughly 50 % ownership, with the goal of increasing profitability Minimal growth capex required to fulfill current backlog Existing equipment is mostly new with limited maintenance capex SAE will consider additional capex investments on a case - by - case basis Available liquidity will only be utilized when expected to be accretive to earnings 2 - year capex program to increase return on equipment and lower rental expense

Financial Summary 10 NASDAQ: SAEX Annual Revenue and Gross Margin (1) Annual Modified EBITDA and Margins Balance Sheet Summary (1) Gross Margin excludes direct operating expenses related to depreciation of $14.8 million, $11.4 million, $3.8 million, and $3.3 million in FY 2013, 2012, 2011 and 2010, respectively; Gross Profit and Gross Margin exclude $4.5 million and $2.7 million of direct operating expenses related to dep rec iation expense for Q4 2013 and 2012, respectively. ($ in millions) 12/31/2013 12/31/2012 12/31/2011 Cash and Equivalents $ 17.4 $ 15.7 $ 5.0 Working Capital 27.1 27.7 (18.6) P, P & E, net 64.6 70.5 41.1 Long-Term Debt 92.3 78.5 - Capital Leases 1.1 1.9 2.6 Stockholders' Equity 10.9 24.1 13.6 Q4 2013 Comparative Performance (1) 5.9% 19.2% 15.4% 31.2% Modified EBITDA Margin Gross margin excl. depr. 0% 5% 10% 15% 20% 25% 30% 35% Q4 2012 Q4 2013 5.9% 19.2% 15.4% 31.2% Modified EBITDA Margin Gross margin excl. depr. 0% 5% 10% 15% 20% 25% 30% 35% Q4 2012 Q4 2013 $2.7 $8.8 $45.7 $10.9 $22.0 $70.7 $0 $10 $20 $30 $40 $50 $60 $70 $80 Modified EBITDA Gross Profit Excl. Depr. Revenue Millions Q4 2012 Q4 2013 $133.8 $180.8 $257.4 $245.3 16% 18% 22% 24% 5% 10% 15% 20% 25% 30% $0 $50 $100 $150 $200 $250 $300 2010 2011 2012 2013 Millions SAM NAM SE Asia Gross Margin Excl. Depr. $14.5 $18.5 $30.9 $25.1 11% 10% 12% 10% 0% 5% 10% 15% 20% 25% 30% $0 $5 $10 $15 $20 $25 $30 $35 2010 2011 2012 2013 Millions Modified EBITDA Modified EBITDA Margin

Quality, Health, Safety & Environment (“QHSE”) 11 NASDAQ: SAEX Historical Lost - Time Injury (LTIF) & Total Recordable Case (TRCF) Frequencies vs OGP Targets SAE maintains an industry - leading quality, health, safety and environmental program Internal QHSE requirements are more stringent than industry standards, despite operating in some of the harshest environments in the world Recently surpassed 22 million exposure hours, or more than 620 consecutive days, without incurring a single lost - time injury 0.00 0.68 0.00 0.40 0.80 1.20 1.60 2.00 Apr-13 May-13 Jun-13 Jul-13 Aug-13 Sep-13 Oct-13 Nov-13 Dec-13 Jan-14 Feb-14 Mar-14 TRCF - LTIF SAE LTIF - Rolling SAE TRCF - Rolling OGP LTIF (Annualized) OGP TRCF (Annualized)

Positive Progress 12 NASDAQ: SAEX Future Expectations Expect solid results in 2014 fueled by increasing international exploration spending Significant growth potential and expansion opportunities in the shallow - water market Continued focus on improving margins by capturing additional efficiencies, notably within logistical services Resilient Backlog New Project Awards During last two quarters, announced 10 new project awards – four in Alaska and six in South America – aggregately valued at $ 262 million Recently awarded first project in Brazil ; set to start in late Q 2 2014 E xpectation of first project award in Africa during 2014 Actively bidding numerous shallow - water marine opportunities with long - standing customers in Southeast Asia, Alaska and Africa Signed strategic agreement with COMESA to jointly pursue opportunities in Mexico Warrant Exchange Recently completed exchange offer of one common share for ten warrants in an effort to simplify capital structure and reduce overhang Approximately 14 . 4 million warrants were tendered, or roughly 96 % of all outstanding warrants, resulting in approximately 1 . 4 million new shares Contracted backlog of $ 292 million as of December 31 , 2013 , a 11 % increase over Q 3 2013 backlog of $ 264 million $ 475 million of total bids outstanding as of December 31 , 2013 Resiliency in backlog and business development efforts is reflected by ability to capture new opportunities quickly

Investor Contact Ryan Abney Vice President, Capital Markets and Investor Relations (281) 258 - 4409 rabney@saexploration.com Contacts 13 NASDAQ: SAEX SAE Canada 3333 8th Street SE, 3rd Floor Calgary, AB T2G 3A4 O : (403) 776 - 1950 SAE Alaska 8240 Sandlewood Pl, Suite 102 Anchorage, AK 99507 O : (907) 522 - 4499 SAE Houston 1160 Dairy Ashford, Suite 160 Houston, TX 77079 O : (281) 258 - 4400 SAE Peru Francisco Masias 544, Of 301 San Isidro, Lima 27 O : (511) 221 - 5209 SAE Colombia Calle 93 No 14 - 20, Of 709 Bogota , Colombia O : (571) 593 - 6800 SAE Bolivia Av. Iberica , Calle 3 Oeste No 11 Barrio Las Palmas, Bolivia O : (591) 3 358 - 7575 SAE Brazil Av. Almirante Barroso No 02, 6th Fl Rio de Janeiro, Centro 20031 - 001 O : (55) 21 3553 - 5104 SAE Malaysia Suite 22.01A, Level 22 Menara Citibank 165, Jalan Ampang 50450 Kuala Lumpur SAE Australia 6/33 Pembroke Street Carina, Brisbane Queensland 4152 O : (61) 7 3194 - 2491 SAE New Zealand 9 Swans Rd , Bell Block 4315 Taranaki , New Zealand O : (64) 06 755 - 4485

Appendix

Executive Management 15 NASDAQ: SAEX Jeff Hastings Executive Chairman Brian Beatty President and CEO Brent Whiteley CFO and GC President and owner of Fairweather Geophysical, which successfully maintained significant market share of Alaskan seismic market during each year of operation Following the acquisition of Fairweather by Veritas DGC in 2000 , Mr . Hastings retained his role as head of the Alaskan Division for Veritas and then CGGVeritas following its acquisition of Veritas DGC Mr . Hastings was instrumental in assisting SAE in successfully expanding its operations into Alaska’s Cook Inlet and North Slope Years Experience 35+ Founded SAE in 2006 after establishing and maintaining Veritas DGC’s South American operations, where he ran operations for over 15 years Began career in seismic field management in 1980 with Veritas DGC Successfully led SAE’s expansion into Canada through its acquisition of Datum Exploration Joined SAE in 2011 as Chief Operating Officer and General Counsel, later transitioning to the role of Chief Financial Officer and General Counsel Following more than 10 years in private law, Mr . Whiteley joined Veritas DGC as its Assistant General Counsel . After earning his MBA in 2006 , Mr . Whiteley assumed the role of Senior Vice President in charge of all operations for CGGVeritas ’ Land Acquisition business in the Americas 30+ 20+

(1) Excludes $ 2 , 860 and $ 213 of amortization of loan issuance costs which are included in depreciation and amortization in the fiscal years ended December 31 , 2013 and 2012 , respectively, and $ 383 and $ 213 of amortization of loan issuance costs which are included in depreciation and amortization in the three months ended December 31 , 2013 and 2012 . (2) Principally the cost associated with financing costs, share - based compensation expense related to the accelerated vesting of former SAE’s restricted shares in connection with the merger, and costs associated with the merger . (3) Principally the cost associated with financing costs and fees for early payment of debt . (4) Costs related to contemplated acquisitions . Note : Modified EBITDA (arrived at by taking earnings before interest, taxes, depreciation and amortization, and non - recurring expenses) is not derived in accordance with generally accepted accounting principles (“GAAP”) . EBITDA is a key metric SAE uses in evaluating its financial performance . EBITDA is considered a non - GAAP financial measure as defined by Regulation G promulgated by the SEC under the Securities Act of 1933 , as amended . SAE considers EBITDA important in evaluating its financial performance on a consistent basis across various periods . Due to the significance of non - cash and non - recurring items, EBITDA enables SAE’s Board of Directors and management to monitor and evaluate the business on a consistent basis . SAE uses EBITDA as a primary measure, among others, to analyze and evaluate financial and strategic planning decisions regarding future operating investments and potential acquisitions . The presentation of EBITDA should not be construed as an inference that SAE’s future results will be unaffected by unusual or non - recurring items or by non - cash items, such as non - cash compensation . EBITDA should be considered in addition to, rather than as a substitute for, pre - tax income, net income and cash flows from operating activities . EBITDA Reconciliation 16 NASDAQ: SAEX Fiscal year ended Three months ended December 31, December 31, ($ in thousands) 2013 2012 2011 2010 2013 2012 Net income (loss) $ (21,051) $ 9,985 $ 9,508 $ 5,821 $ 4,508 $ (5,323) Net income (loss) attributable to non-controlling interest 45 - - - 45 - Depreciation and amortization 18,956 12,470 4,110 3,493 5,320 3,282 Interest expense, net 12,396 (1) 3,573 (1) 624 674 3,876 (1) 2,102 (1) Unrealized loss from change in fair market value of notes payable 631 - - - 139 - Income tax expense (benefit) 10,495 1,444 3,319 4,500 (3,125) (783) Non-recurring expenses 3,620 (2) 3,437 (3) 964 (4) - 114 3,437 Modified EBITDA $ 25,092 $ 30,909 $ 18,525 $ 14,488 $ 10,877 $ 2,715

Unique Perspectives 17 NASDAQ: SAEX

Unique Perspectives (cont’d) 18 NASDAQ: SAEX
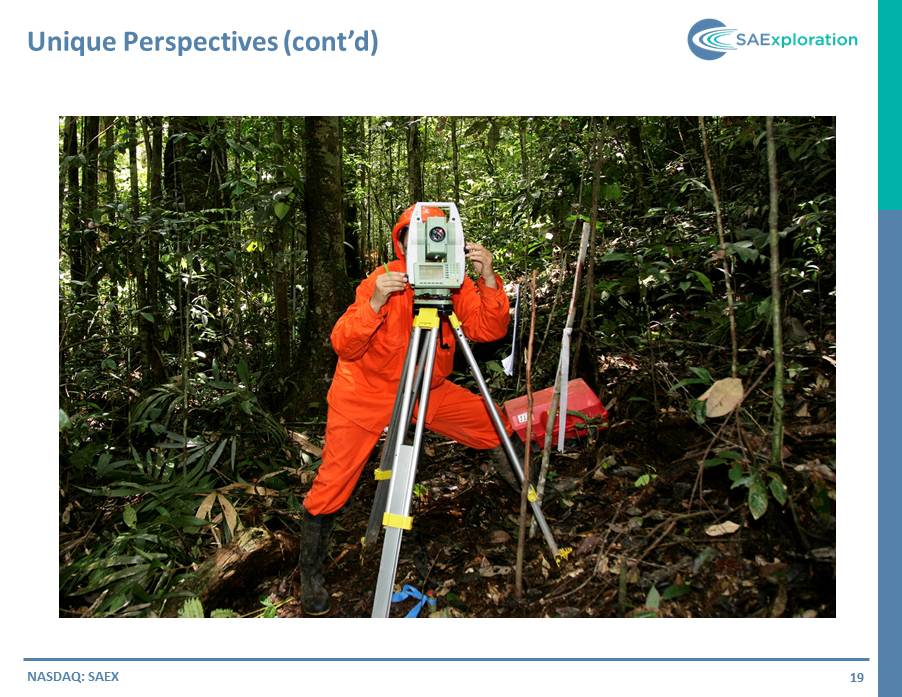
Unique Perspectives (cont’d) 19 NASDAQ: SAEX

Unique Perspectives (cont’d) 20 NASDAQ: SAEX

Unique Perspectives (cont’d) 21 NASDAQ: SAEX