Attached files
| file | filename |
|---|---|
| 8-K - FORM 8-K - MEXICO FUND INC | mf8k040414.htm |
The Mexico Fund, Inc.
Monthly Summary Report
March 2014

Prepared By:
Impulsora del Fondo México, S.C.
Investment Advisor to the Fund


The information presented in this report has been derived from the sources indicated. Neither The Mexico Fund, Inc. nor its Adviser, Impulsora del Fondo México, S.C., has independently verified or confirmed the information presented herein.
March 31, 2014
|
I. The Mexico Fund Data
|
End of Month
|
One Month Earlier
|
One Year Earlier
|
|
Total Net Assets1 (million US$)
|
$405.25
|
$385.48
|
$450.89
|
|
NAV per share
|
$27.11
|
$25.79
|
$33.69
|
|
Closing price NYSE2
|
$26.99
|
$25.98
|
$36.60
|
|
% Premium (Discount)
|
(0.44%)
|
0.74%
|
8.64%
|
|
Shares traded per month2 (composite figures)
|
1,207,009
|
1,232,844
|
2,886,724
|
|
Outstanding shares3
|
14,947,072
|
14,947,072
|
13,381,884
|
|
Shares on Short Interest Position2
|
8,626
|
29,147
|
338,861
|
|
|
Note: Past performance is no guarantee of future results.
|
II. Performance4
|
1 Month
|
3 Months
|
6 Months
|
1 Year
|
|
Market price
|
4.05%
|
-7.88%
|
-2.01%
|
-18.09%
|
|
NAV per share
|
5.12%
|
-5.21%
|
-0.03%
|
-10.55%
|
|
Bolsa IPC Index
|
5.86%
|
-5.46%
|
0.95%
|
-13.28%
|
|
MSCI Mexico Index
|
5.48%
|
-5.56%
|
0.93%
|
-12.21%
|
|
2 Years
|
3 Years
|
5 Years
|
10 Years
|
|
|
Market price
|
30.08%
|
28.97%
|
255.70%
|
305.27%
|
|
NAV per share
|
18.21%
|
16.53%
|
196.01%
|
275.23%
|
|
Bolsa IPC Index
|
0.44%
|
-1.48%
|
123.42%
|
229.23%
|
|
MSCI Mexico Index
|
2.41%
|
1.73%
|
130.17%
|
195.49%
|
|
III. The Mexican Stock Exchange
|
End of Month
|
One Month Earlier
|
One Year Earlier
|
|
Bolsa IPC Index5
|
40,461.60
|
38,782.89
|
44,077.09
|
|
Daily average of million shares traded
|
349.5
|
306.5
|
508.1
|
|
Valuation Ratios6: P/E
|
19.24
|
17.06
|
20.02
|
|
P/BV
|
1.99
|
2.58
|
3.07
|
|
EV/EBITDA
|
10.92
|
9.01
|
9.65
|
|
Market capitalization (billion US$)
|
$551.63
|
$508.83
|
$598.17
|
1 Source: Impulsora del Fondo México, S.C. (Impulsora). Impulsora utilizes the spot exchange rate, provided by Bloomberg, to calculate the Fund's Net Asset Value per share (NAV). The NAV is published every business day on the Fund’s website at www.themexicofund.com.
4 Sources: Lipper, Inc., Bloomberg and Impulsora del Fondo México, S.C. Periods ended on the last US business day of the date of this report. Performance figures for the Fund take into account the reinvestment of distributions; however, performance figures for the Bolsa Index and MSCI Mexico Index do not.
6 Source: Impulsora del Fondo México, S.C. Figures represent the average obtained from a representative sample of companies listed on the Bolsa. P/E refers to Price/Earnings, P/BV refers to Price/Book Value and EV/EBITDA refers to Enterprise Value/Earnings before Interests, Taxes, Depreciation and Amortization.
1
|
IV. The Mexican Economy
|
|||
|
End of Month
|
One Month Earlier
|
One Year Earlier
|
|
|
Treasury Bills7
|
|||
|
One month
|
3.17%
|
3.16%
|
3.98%
|
|
Six months
|
3.46%
|
3.52%
|
4.09%
|
|
One year
|
3.67%
|
3.78%
|
4.22%
|
|
Long-term Bonds
|
|||
|
Three years
|
4.80%
|
4.86%
|
4.44%
|
|
Five years
|
5.06%
|
5.09%
|
4.63%
|
|
Ten years
|
6.32%
|
N.A.
|
N.A.
|
|
20 years
|
6.89%
|
7.44%
|
5.69%
|
|
30 years
|
N.A.
|
7.43%
|
5.88%
|
|
Currency Market8
|
|||
|
Exchange Rate (Ps/US$)
|
Ps. 13.0580
|
Ps. 13.2492
|
Ps. 12.3360
|
|
Month
|
Year to Date
|
Last 12
Months |
|
|
Inflation Rates on Previous Month
|
|||
|
Consumer Price Index9 (CPI)
|
0.25%
|
1.15%
|
4.23%
|
V. Economic Comments
According to results of the monthly poll conducted during March 2014 by Mexico’s Central Bank (Banxico), economic analysts of the private sector estimate that Mexico’s gross domestic product (GDP) will increase 3.09% during 2014 and 3.92% during 2015. The inflation rate is estimated by analysts to be 3.92% for 2014 and 3.57% for 2015. The exchange rate of the peso against the dollar is expected to end 2014 at Ps. 13.01 and at Ps. 12.95 towards the end of 2015, while the interest rate for the 28-day Cetes (Treasury Bills) is estimated to be 3.49% and 4.09% for the same periods. The complete results of this and past polls are available at Banxico’s website, located at www.banxico.org.mx.
7 Monthly average of weekly auctions as published by Banco de México. N.A. means no auction for such instrument was scheduled for this month.
9 Source: Banco de México.
2
VI. Portfolio of Investments As of March 31, 2014 (Unaudited)
|
Shares
|
Percent of
|
|||||
|
Held
|
Common Stock - 91.24%
|
Value
|
Net Assets
|
|||
|
Airports
|
||||||
|
700,000
|
Grupo Aeroportuario del Sureste, S.A.B. de C.V. Series B
|
$8,584,086
|
2.12%
|
|||
|
1,500,000
|
Grupo Aeroportuario del Centro Norte, S.A.B. de C.V. Series B
|
5,448,384
|
1.34
|
|||
|
14,032,470
|
3.46
|
|||||
|
|
Beverages
|
|||||
|
1,500,000
|
Arca Continental, S.A.B. de C.V.
|
8,957,727
|
2.21
|
|||
|
3,980,000
|
Fomento Económico Mexicano, S.A.B. de C.V. Series UBD
|
37,065,998
|
9.15
|
|||
|
2,215,000
|
Organización Cultiba, S.A.B. de C.V. Series B
|
3,840,374
|
0.95
|
|||
|
49,864,099
|
12.31
|
|||||
|
|
Building Materials
|
|||||
|
27,500,000
|
Cemex, S.A.B. de C.V. Series CPO
|
34,748,813
|
8.58
|
|||
|
|
Chemical Products
|
|||||
|
4,800,000
|
Alpek, S.A.B. de C.V. Series A
|
8,553,837
|
2.11
|
|||
|
3,970,000
|
Mexichem, S.A.B. de C.V.
|
14,046,102
|
3.47
|
|||
|
22,599,939
|
5.58
|
|||||
|
|
Consumer Products
|
|||||
|
7,000,000
|
Kimberly-Clark de México, S.A.B. de C.V. Series A
|
18,741,002
|
4.62
|
|||
|
|
Energy
|
|||||
|
1,240,000
|
Infraestructura Energética Nova, S.A.B de C.V.
|
6,415,561
|
1.58
|
|||
|
|
Financial Groups
|
|||||
|
1,200,000
|
Banregio Grupo Financiero, S.A.B. de C.V. Series O
|
6,952,979
|
1.72
|
|||
|
4,650,000
|
Grupo Financiero Banorte, S.A.B. de C.V. Series O
|
31,276,574
|
7.72
|
|||
|
5,500,000
|
Grupo Financiero Santander Mexicano, S.A.B de C.V. Series B
|
13,474,115
|
3.32
|
|||
|
51,703,668
|
12.76
|
|||||
|
|
Food
|
|||||
|
1,360,000
|
Gruma, S.A.B. de C.V. Series B
|
11,247,235
|
2.78
|
|||
|
3,000,000
|
Grupo Bimbo, S.A.B. de C.V. Series A
|
8,096,186
|
2.00
|
|||
|
1,000,000
|
Grupo Herdez, S.A.B. de C.V.
|
2,969,061
|
0.73
|
|||
|
4,000,000
|
Grupo Lala, S.A.B. de C.V. Series B
|
8,322,867
|
2.05
|
|||
|
30,635,349
|
7.56
|
|||||
|
|
Holding Companies
|
|||||
|
7,400,000
|
Alfa, S.A.B. de C.V. Series A
|
18,712,513
|
4.62
|
|||
|
790,000
|
Grupo Carso, S.A.B. de C.V. Series A1
|
4,155,698
|
1.02
|
|||
|
22,868,211
|
5.64
|
|||||
|
|
Mining
|
|||||
|
10,000,000
|
Grupo México, S.A.B. de C.V. Series B
|
31,574,514
|
7.79
|
|||
|
|
Restaurants
|
|||||
|
2,500,000
|
Alsea, S.A.B. de C.V.
|
9,094,042
|
2.24
|
|||
3
|
Shares
|
Percent of
|
|||||
|
Held
|
Common Stock
|
Value
|
Net Assets
|
|||
|
Retail
|
||||||
|
1,800,000
|
El Puerto de Liverpool, S.A.B. de C.V. Series C-1
|
19,701,026
|
4.86
|
|||
|
10,570,000
|
Wal-Mart de México, S.A.B. de C.V. Series V
|
25,077,240
|
6.19
|
|||
|
44,778,266
|
11.05
|
|||||
|
Telecommunications Services
|
||||||
|
33,000,000
|
América Móvil, S.A.B. de C.V. Series L
|
32,701,792
|
8.07
|
|||
|
Total Common Stock
|
$369,757,726
|
91.24%
|
||||
|
SHORT-TERM SECURITIES – 7.40%
|
|||||
|
Principal
Amount
|
|||||
|
Repurchase Agreements
|
|||||
|
$15,824,626
|
BBVA Bancomer, S.A., 3.48%, dated 03/31/14, due 04/01/14 repurchase price $15,826,155 collateralized by Bonos del Gobierno Federal
|
15,824,626
|
3.91%
|
||
|
Time Deposits
|
|||||
|
$14,149,508
|
Comerica Bank, 0.02%, dated 03/31/14, due 04/01/14
|
14,149,508
|
3.49
|
||
|
Total Short-Term Securities
|
29,974,134
|
7.40
|
|||
|
Total Investments
|
399,731,860
|
98.64
|
|||
|
Other Assets in Excess of Liabilities
|
5,514,628
|
1.36
|
|||
|
Net Assets Equivalent to $27.11 per share on 14,947,072 shares of capital stock outstanding
|
$405,246,488
|
100.00%
|
4
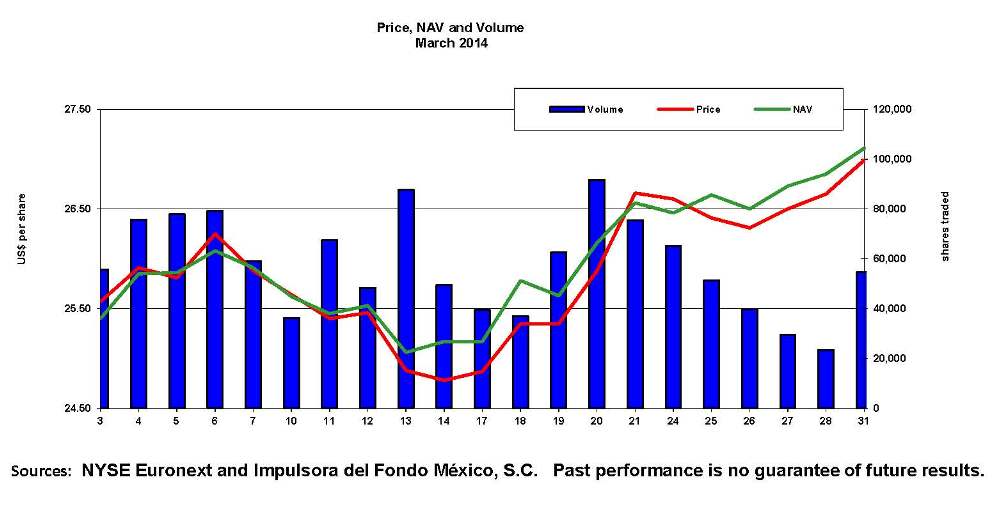
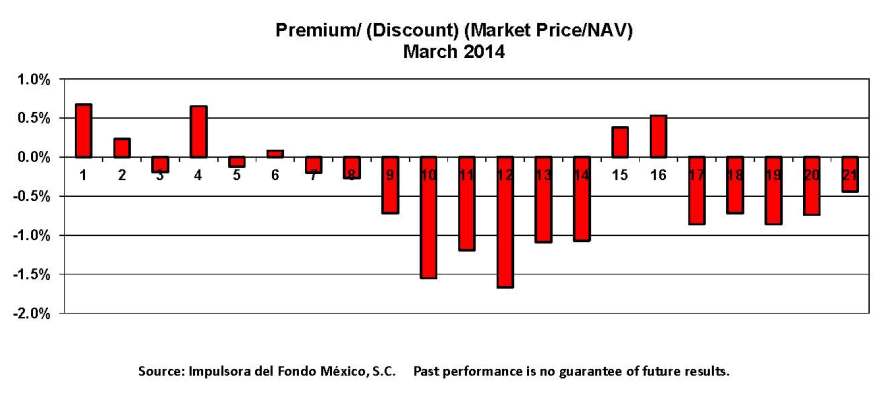
VII. The Mexico Fund, Inc. Charts
5
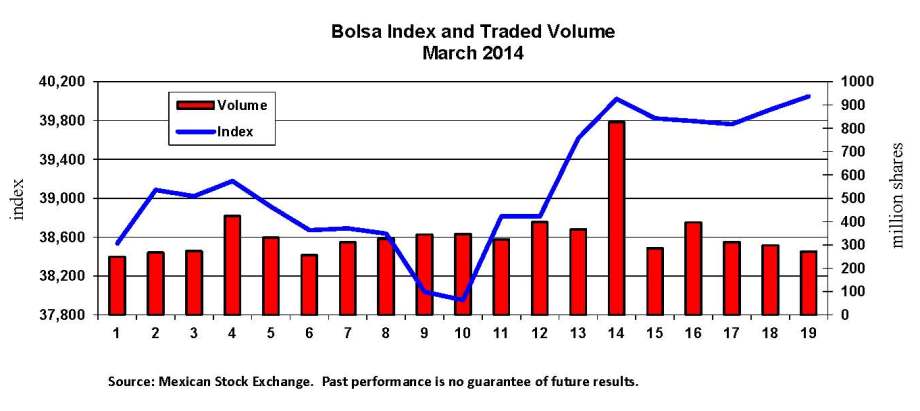
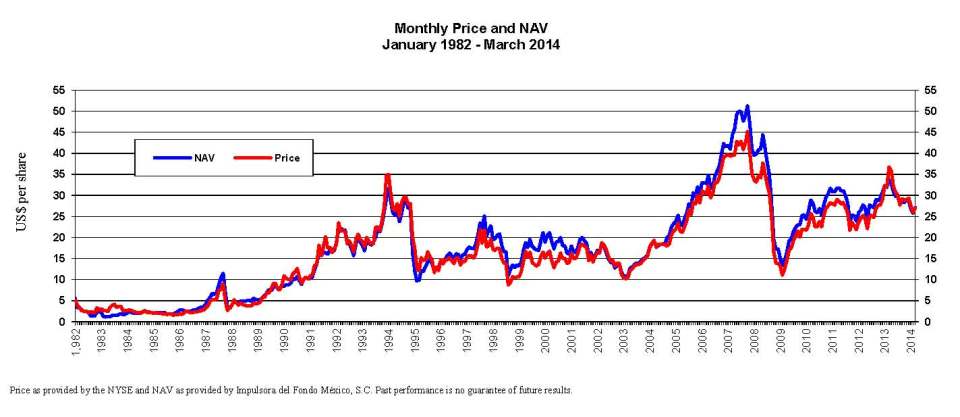
VII. The Mexico Fund, Inc. Charts (continued)
6