Attached files
| file | filename |
|---|---|
| 8-K - 8-K - SSI Investments II Ltd | c919-20140402x8k.htm |
Certain Information to Be Provided to Prospective Debt Financing Sources
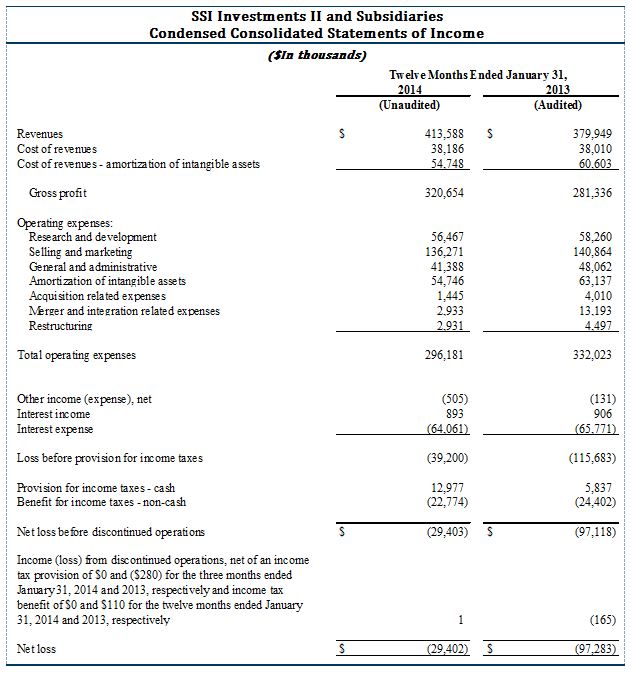
The following information was prepared by SSI Investments II Ltd. (“SSI II”) and its subsidiaries in connection with a presentation to sources of potential debt financing for the acquisition (the “Acquisition”) of the subsidiaries of SSILuxco S.a.r.l., an indirect parent company of Skillsoft Limited (“Skillsoft” or the “Company”) by funds managed by Charterhouse Capital Partners LLP.
All fiscal year 2014 financials contained herein are preliminary and are subject to the final audit.
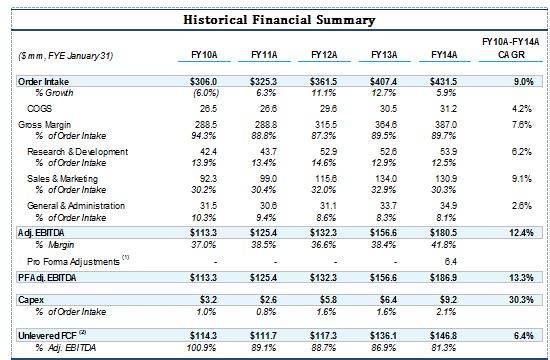
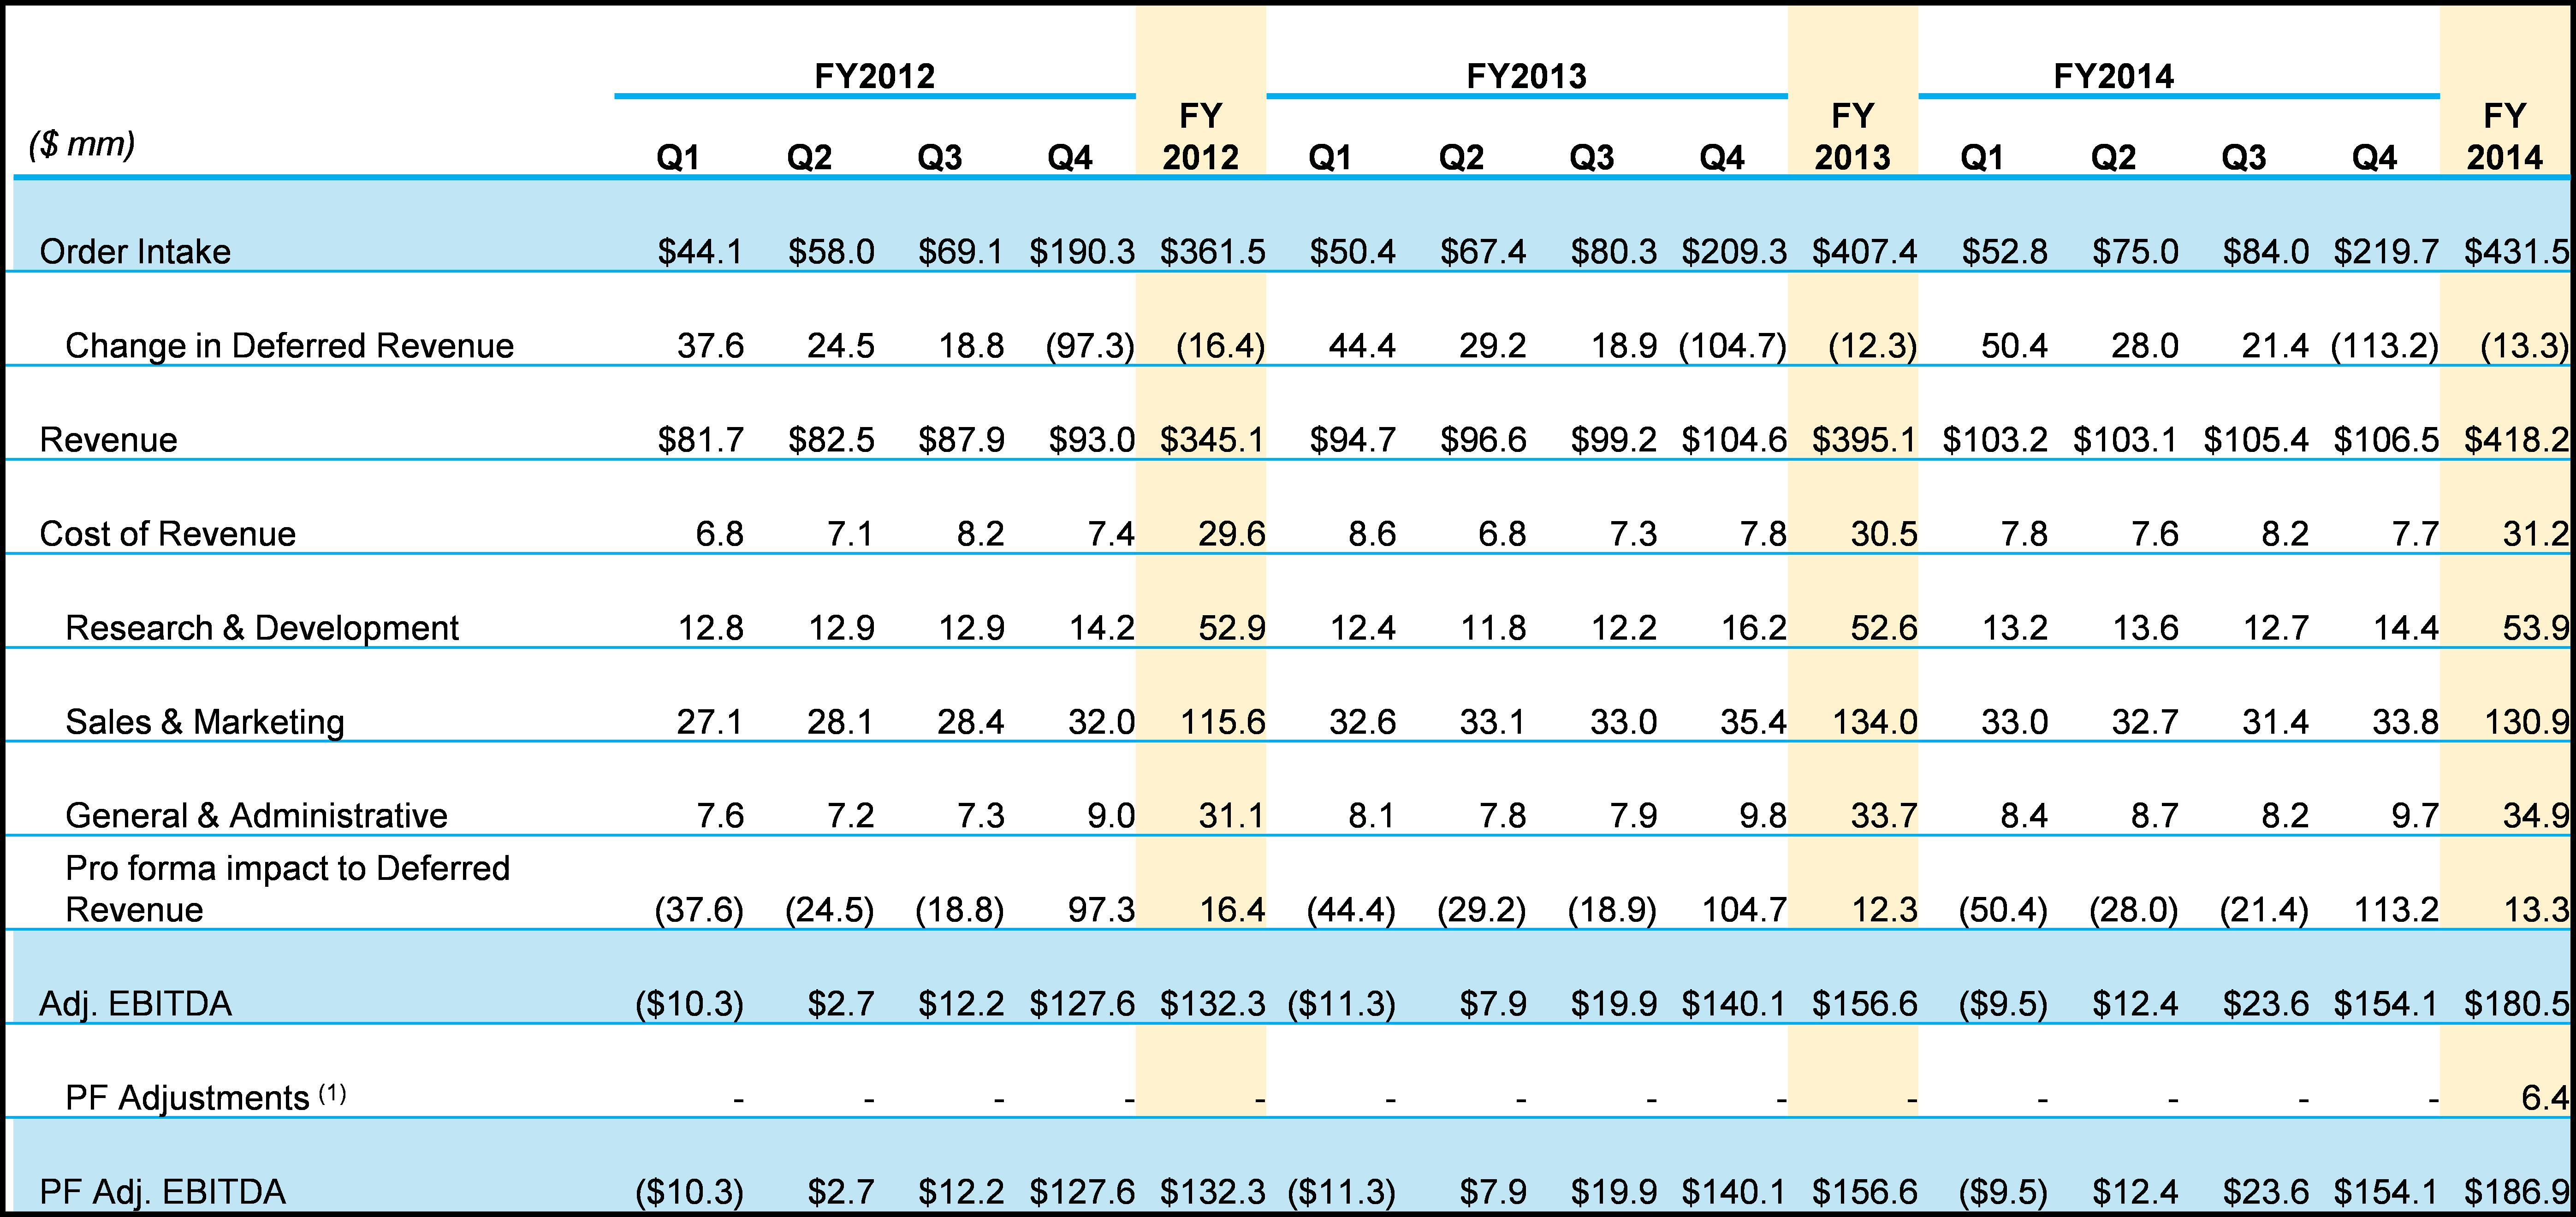
Historical Financial Summary
Order Intake represents the 12 month contract value (or less if applicable, e.g. pilot) of total orders booked in the fiscal year including new contracts, upgrades, renewals and auto-renewals related to contracts signed in previous years. This metric serves as a leading indicator of revenue trends, providing management the visibility to project the business and budget expenses accordingly. Adjusted EBITDA (“Adj. EBITDA”) reflects cash economics of the business and is adjusted to reflect non-recurring or one-time items
As used herein, EBITDA represents net income (loss) plus (i) interest expense, net of interest income, (ii) (benefit) provision for income taxes and (iii) depreciation and amortization.
Adjusted EBITDA (“Adj. EBITDA”) is calculated by adding to EBITDA, Order Intake and certain items of expense, while deducting revenues and certain items of income that the Company's management believes are not indicative of the Company's future operating performance. Items not reflected in Adjusted EBITDA include stock-based compensation, merger, acquisition and restructuring expenses, fair value adjustments related to purchase accounting and other non-recurring expenses permitted under the Company’s existing credit facility. Adjusted EBITDA, as used herein, is not consistent with the definition provided under the Company’s existing debt arrangements.
Pro-forma Adjusted EBITDA (“PF Adj. EBITDA”) represents Adjusted EBITDA plus adjustments of $6.4 million from pricing initiatives implemented Feb 1, 2014.
Order Intake, Adjusted EBITDA and PF Adj. EBITDA are not based on generally accepted accounting principles (“GAAP”).
Above amounts are shown on a non-GAAP basis.
1. PF for adjustments of $6.4MM from pricing initiatives implemented Feb 1, 2014.
2. uFCF excludes acquired working capital deficit from acquisitions in fiscal year 2012 and fiscal year2013.
Note: Reflects cash economics of the business and adjusted for stock-based compensation, merger, acquisition, and restructuring expenses, sponsor and management consulting fees, fair value adjustments related to purchase accounting, and other non-recurring expenses permitted under the Company’s existing credit facility.
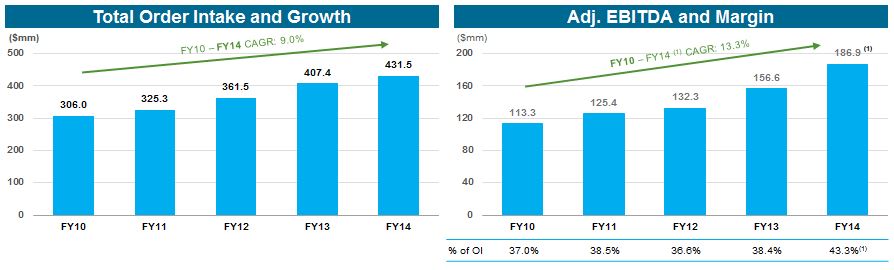
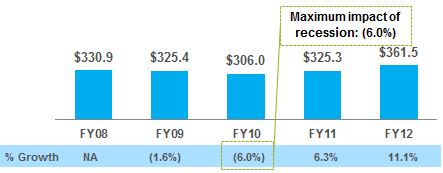
Since fiscal year 2010, Skillsoft has grown Order Intake at a Compound Annual Growth Rate (“CAGR”) of 9.0%, with a strong rebound from the fiscal year 2010 financial crisis. In fiscal year 2010, Order Intake decreased by 6% partially due to a more cautious customer spending environment related to the challenging global economic climate at the time. Despite this decrease in Order Intake, Skillsoft reported an increase of over 6% in Adjusted EBITDA as a result of cost-saving initiatives instituted in the fourth quarter of fiscal year 2009, demonstrating management’s ability to quickly adjust the cost structure during challenging economic times.
Sponsor Overview
Charterhouse Capital Partners (“Charterhouse”) is a U.K.-based private equity firm founded in 1934. Charterhouse manages private equity funds in excess of €8.0 billion and has completed over 137 transactions worth in excess of €50 billion. The firm is currently investing out of Charterhouse Capital Partners IX, a €4.0 billion fund, which had a final closing in March 2009. Charterhouse’s fund investors include blue chip institutional investors from around the world including pension funds, funds of funds, insurance companies, government agencies, banks and endowments, many of which have been investing with the firm for over 10 years.
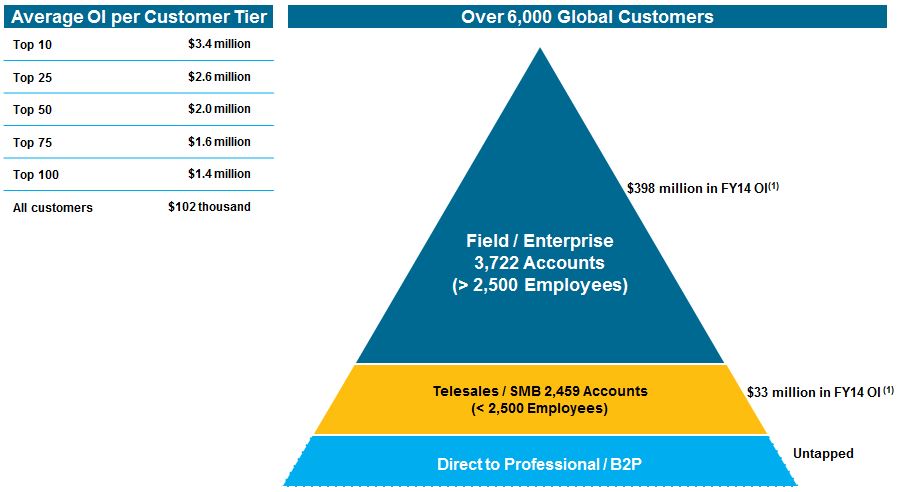
Large, Highly Diversified Customer Base with Longstanding Relationships
The Company’s products are sold to a diversified set of customers including global enterprises, government entities and small- to medium-sized businesses. Skillsoft serves more than 65% of the Fortune 500 and over 25% of the Global 2000. The Company’s worldwide customer base comprises over 6,000 organizations, with more than 19 million licensed users.
|
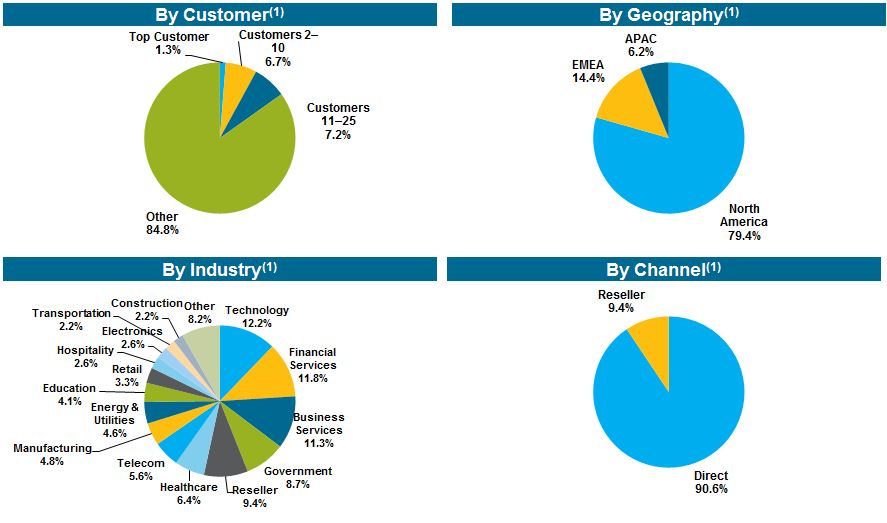
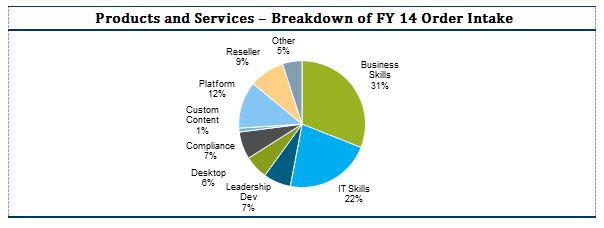
Well-Diversified Order Intake |
|
|
1. |
Fiscal year 2014 Order Intake, defined as total orders booked in the fiscal year (up to 12 months of value) plus current year renewals related to contracts signed in previous years. |
During fiscal year 2014, Skillsoft’s largest single customer accounted for less than 1.5% of Order Intake. A majority of Order Intake is from customers which have been doing business with the Company for more than five years. These longstanding relationships have provided Skillsoft with a stable revenue base.
|
Diversified Customer Base |
|
1. Excludes immaterial Order Intake from Element K discontinued operations. |
Recurring Subscription-Based Model with High Revenue Visibility
Skillsoft has exhibited strong top and bottom line performance from fiscal year 2010 to fiscal year 2014. The Company’s Order Intake has grown at a 9.0% CAGR from fiscal year 2010 to fiscal year 2014.
|
Order Intake and Adj. EBITDA |
||
|
1. |
PF for adjustments of $6.4MM from pricing initiatives implemented Feb 1, 2014. |
|
Order Intake Through the Cycle |
|
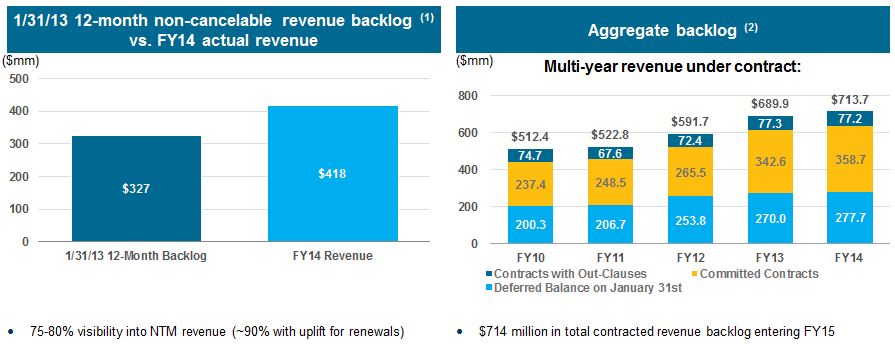
The Company’s contractual business model leads to a high degree of future revenue visibility. As of January 31, 2013, the Company’s 12-month non-cancellable backlog represented 78% of fiscal year 2014’s total revenue of $418 million. The Company’s backlog is diversified across thousands of non-cancelable contracts. The average contract size is approximately $102,000, an increase from approximately $90,000 in fiscal year 2013. Over the last six fiscal years ended January 31, each fiscal year’s backlog represented approximately 77% of the following year’s sales. This, combined with high renewal rates, generally gives the Company significant visibility into the next twelve months of revenue.
|
Contract Backlog |
|
1. |
Reflects committed backlog as of January 31, 2013 and excludes discontinued operations. |
2. Excludes totals from expiring contracts. Total fiscal year 2014 CV backlog including expiring contracts is $1,057mm.
Skillsoft’s breadth of offering, customer-centric focus and strong brand recognition have led to customer renewal rates in excess of 92% since January 31, 2007.
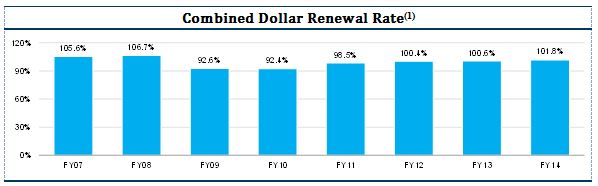
1. Combined dollar renewal rate compares existing customer contract dollars year over year; includes upgrades, downgrades and losses of prior year customers but does not include Order Intake from new customers. Excludes acquired business contract value in first year of acquisition.
High Cash Flow Conversion with Strong Deleveraging Profile
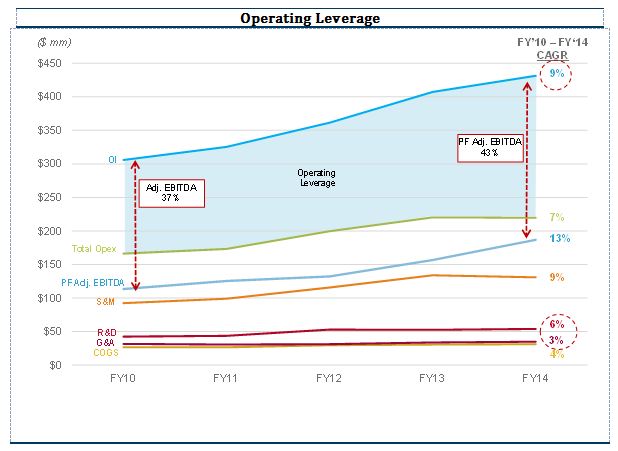
Operating Leverage
Skillsoft’s business model provides substantial operating leverage as the company is able to sell its content library to new customers with little incremental costs. As can be seen in the table below, total operating expenditures grow at a slower pace than top line Order Intake. Research and development is relatively fixed, and increases only nominally year-to-year. General and administrative is also relatively fixed as minimal investment is required to support growth and a larger installed base. Selling and marketing is largely variable, but there is some leverage due to lower commissions paid on repeat customers.
Low Capital Expenditures
The Company has small capital expenditure requirements, spending on average approximately 1.5% of Order Intake on capital expenditures from fiscal year 2009 to fiscal year 2014. The Company expenses all research and development as incurred.
Working Capital Efficiency
The Company also has experienced favorable working capital dynamics given that upfront billing collection essentially funds continued growth in the business.
Favorable Tax Profile
The Company benefits from a low cash tax rate because of its existing Net Operating Losses (“NOLs”) of $105 million. Also, 85% of taxable income is subject to the Irish corporate tax rate of 12.5%.
|
Free Cash Flow Conversion |
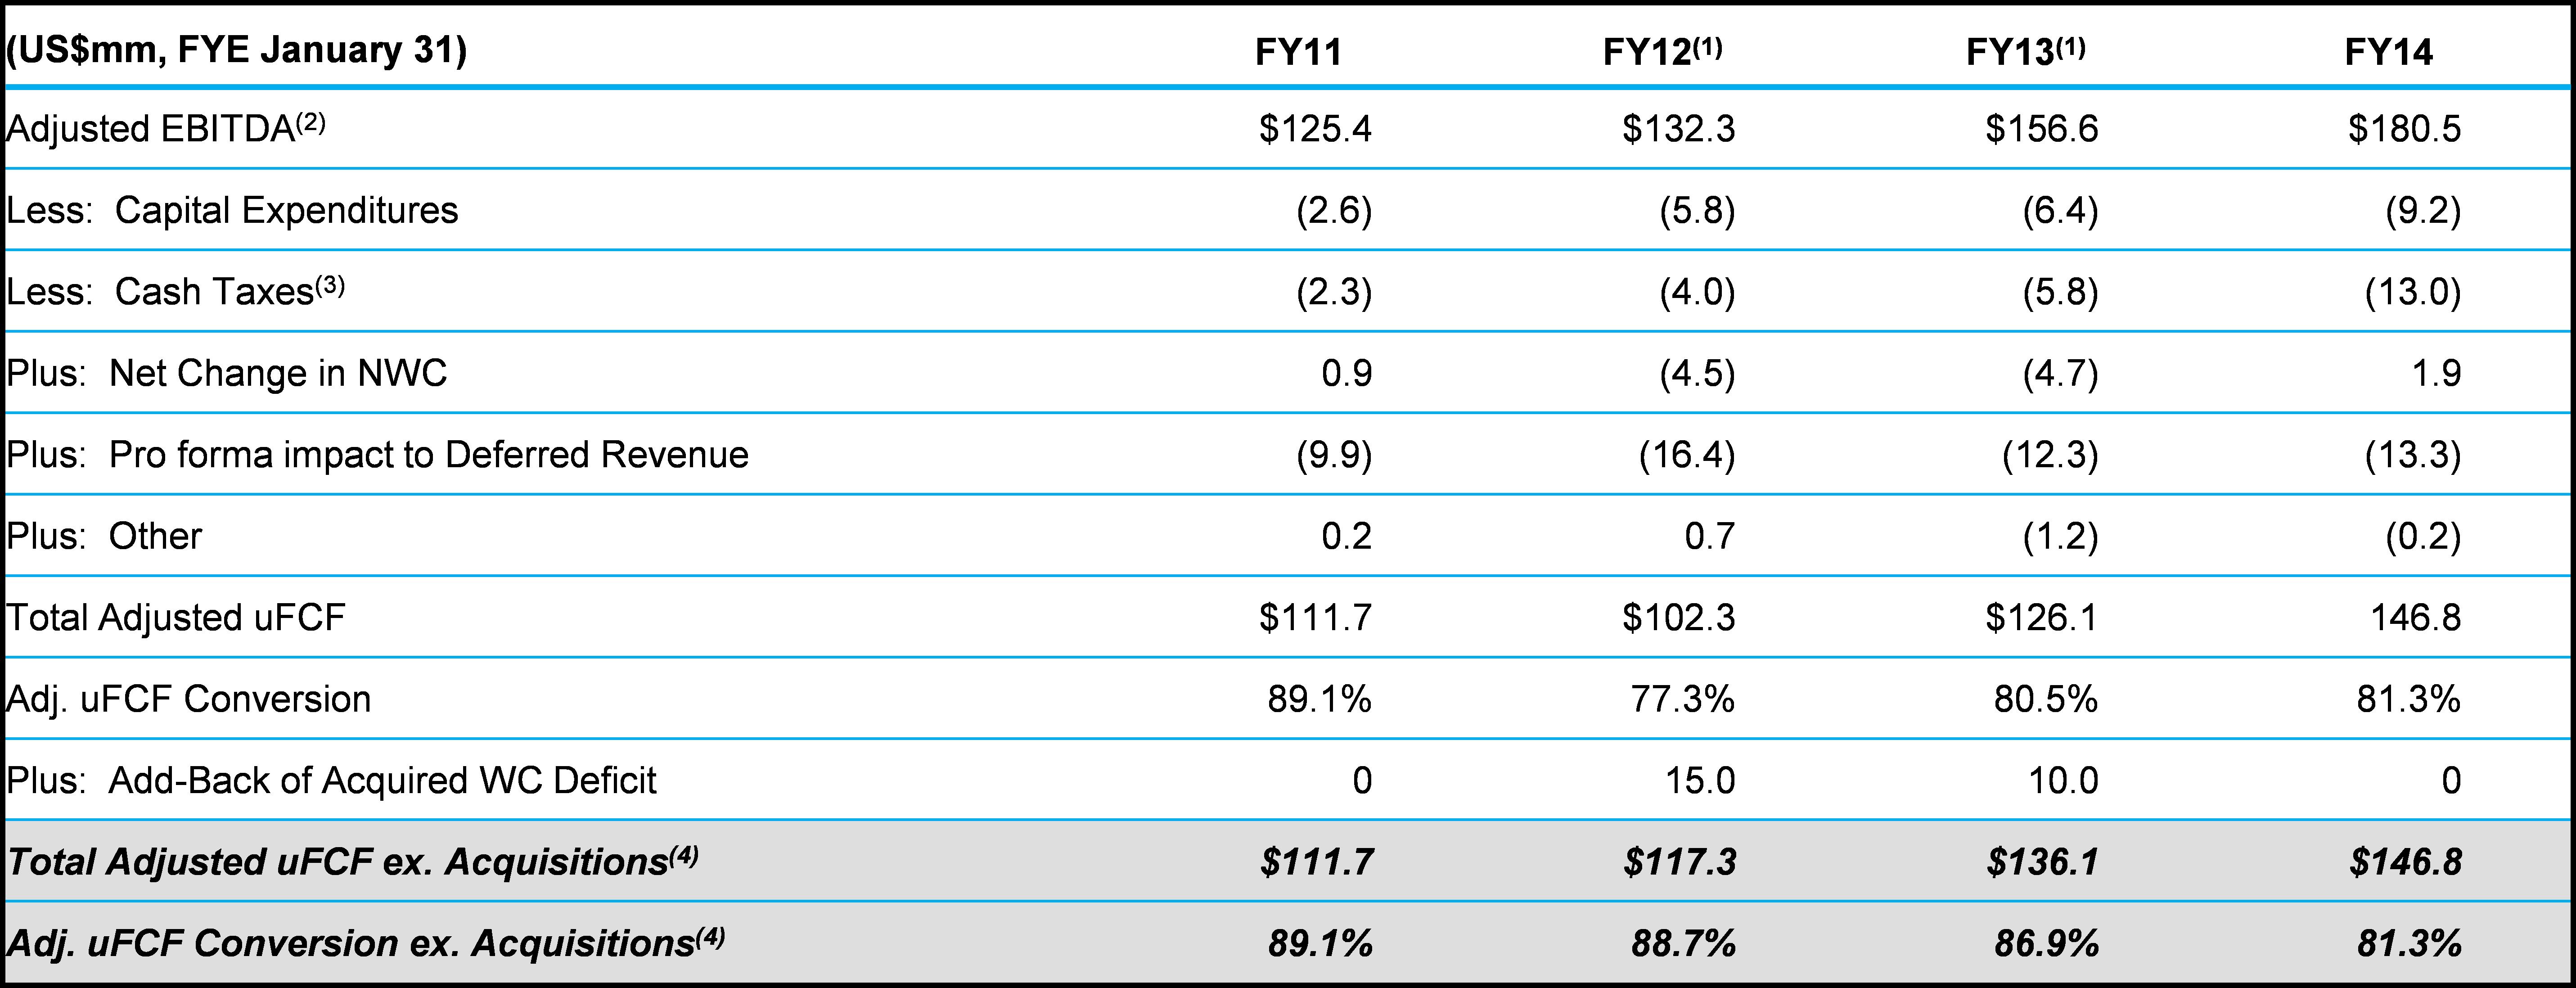
Above amounts are shown on a non-GAAP basis.
|
1. |
Fiscal year 2012 and fiscal year 2013 include the acquired working capital deficit for Element K ($15 million) and MindLeaders ($10 million), respectively. |
|
2. |
Reflects cash economics of the business and adjusted for stock-based compensation, merger, acquisition, and restructuring expenses, sponsor and management consulting fees, fair value adjustments related to purchase accounting, and other non-recurring expenses permitted under the Company’s existing credit facility. |
|
3. |
Represents actual cash taxes, including interest tax shield. |
|
4. |
uFCF conversion adjusted for acquired working capital deficit from Element K and MindLeaders in fiscal year 2012 and fiscal year 2013. |
Major Products
Skillsoft provides a comprehensive learning solution comprised of high-quality learning resources and flexible technology, designed to enable learning to sustain customers’ business success over the long term. Skillsoft’s vast content library is deployed through its world-class learning technology platform and can be broken down into the following groups below.
Historical Financials Discussion and Analysis
Skillsoft has experienced consistent growth in Order Intake from fiscal year 2010 – fiscal year 2014 of 9.0% (6% organic, with impact of acquisitions incremental in fiscal year 2012 and fiscal year 2014). While the Company has grown top line Order Intake, it has been able to expand Adj. EBITDA margins due to the natural operating leverage of the business model.
The Company’s modest capital expenditures requirements and low tax rate further contribute to the Company’s strong deleveraging profile and Adj. EBITDA to FCF conversion.
Skillsoft’s flexible cost structure allows the ability to immediately cut back on discretionary expenditures during tough macroeconomic climates. For example, despite an Order Intake decline in fiscal year 2010, Skillsoft experienced a modest aggregate impact from the recession as Adj. EBITDA margin expanded from 32.7% in fiscal year 2009 to 37.0% in fiscal 2010, as a result of cost-saving initiatives instituted in the 4th quarter of fiscal year 2009.
Fiscal Year 2014 vs. Fiscal Year 2013
Order Intake grew 5.9% to $431.5 million in fiscal year 2014 due to continued integration of recent acquisitions and continued growth in compliance and international sales.
Adj. EBITDA margin increased to 41.8% in fiscal year 2014 from 38.4% in fiscal year 2013 due to a reduction in sales and marketing, research and development and general and administration as a percentage of sales.
The increase in cost of goods sold expenses in fiscal year 2014 versus fiscal year 2013 was primarily due to an increase in royalties expense partially offset by a decrease in compensation and benefits expense.
Research and development expense increased to $53.9 million in fiscal year 2014 from $52.6 million in fiscal year 2013. This increase was primarily due to an increase in compensation and benefits expense partially offset by lower outsourced development costs.
The decrease in selling and marketing expense in fiscal year 2014 versus fiscal year 2013 was primarily due to a reduction in marketing related expenses.
The increase in general and administrative expense in fiscal year 2014 versus fiscal year 2013 was primarily due to an increase in accounting, audit and tax expense as well as an increase in compensation and benefits expense.
Taxes
As of January 31, 2014, near-term cash tax rates are offset by $105 million in Net Operating Losses available globally ($62.7 million in Ireland) and $261.6 million in amortizable tax basis ($198.8 million in Ireland). Recent FY14 cash tax amounts reflect final payment of installment gain from IP sale and a result of NOL limitations. This level of cash tax would not continue on a pro-forma basis, due to the cessation of the IP sale. The transaction is expected to further decrease taxes in the near-term (up to the next 5 years).
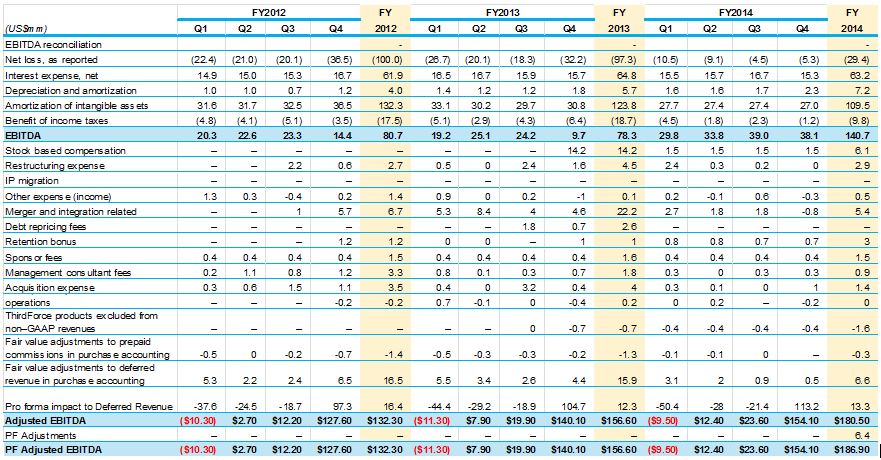
EBITDA Reconciliation
Set forth below is a reconciliation of Order Intake to Adjusted EBITDA.
|
PF Adj. EBITDA Reconciliation from Order Intake |
Above amounts are shown on a non-GAAP basis.
|
1. |
PF adjustments for fiscal year 2014 reflect pro forma impact of pricing increases implemented Feb 1, 2014 |
Note: Reflects cash economics of the business and adjusted for stock-based compensation, merger, acquisition, and restructuring expenses, sponsor and management consulting fees, fair value adjustments related to purchase accounting, and other non-recurring expenses permitted under the Company’s existing credit facility.
|
PF Adj. EBITDA Reconciliation from Net Loss, as Reported |
Note: PF adjustments for fiscal year 2014 reflect pro forma impact of pricing increases implemented Feb 1, 2014.
Note: Reflects cash economics of the business and adjusted for stock-based compensation, merger, acquisition, and restructuring expenses, sponsor and management consulting fees, fair value adjustments related to purchase accounting, and other non-recurring expenses permitted under the Company’s existing credit facility.
Explanation of Use of Non-GAAP Financial Results
In addition to reporting our audited and unaudited financial results in accordance with U.S. generally accepted accounting principles (GAAP), to assist investors we on occasion provide certain non-GAAP financial results as an alternative means to explain our periodic results.
These non-GAAP financial measures are not in accordance with, or an alternative to, financial information prepared in accordance with GAAP and may not be comparable to similar non-GAAP financial measures used by other companies. These non-GAAP measures should not be considered in isolation from, or as a substitute for, the financial results prepared in accordance with GAAP. The Company’s management uses these non-GAAP financial measures as alternative means for assessing the Company’s results of operations and believes that they may also provide useful information to the Company’s investors.