Attached files
| file | filename |
|---|---|
| 8-K - 8-K - EXA CORP | d706941d8k.htm |
 ©
Exa Corporation Confidential
Investor Presentation
Investor Presentation
April 2014
April 2014
Exhibit 99.1 |
 Safe
Harbor Statement ©
Exa Corporation Confidential
2
Today’s presentation includes forward-looking statements intended to
qualify for the Safe
Harbor
from
liability
established
by
the
Private
Securities
Litigation
Reform
Act
of 1995.These forward-looking statements, including statements regarding our
financial expectations, demand for our solutions and growth in our markets,
are subject to risks, uncertainties and other factors that could cause
actual results to differ materially from those suggested by our
forward-looking statements. These factors include, but are not
limited to, the risk factors described in our Annual Report on Form
10-K for the year ended January 31, 2014, as filed with the SEC on March
26, 2014. Forward-looking information in this presentation represents our
outlook as of
today,
and
we
do
not
undertake
any
obligation
to
update
these
forward-looking
statements.
During
today's
presentation
we
may
refer
to
our
Adjusted
EBITDA.
This
is
a
non-
GAAP financial measure that has been adjusted for certain non-cash and other
items, and that is not computed in accordance with generally accepted
accounting principles. The GAAP measure most comparable to Adjusted EBITDA
is our net income (loss). A reconciliation of our historical Adjusted
EBITDA to our net income (loss) is included in our Form 10-K filed with
the SEC. . |
 Company Overview
125+
14 of the top 15 passenger
vehicle manufacturers
EBITDA positive past 5 years
Highly recurring and visible
business model
Employees
10
HQ in Burlington, MA
Detroit, Japan, Germany,
Korea, France, China
3
©
Exa Corporation Confidential
Aerodynamics
Thermal Acoustics Leading Provider of Software
that Enables Simulation-Driven Product Design
Years of
Revenue Growth
Customers
Global
Offices
250+
10+ |
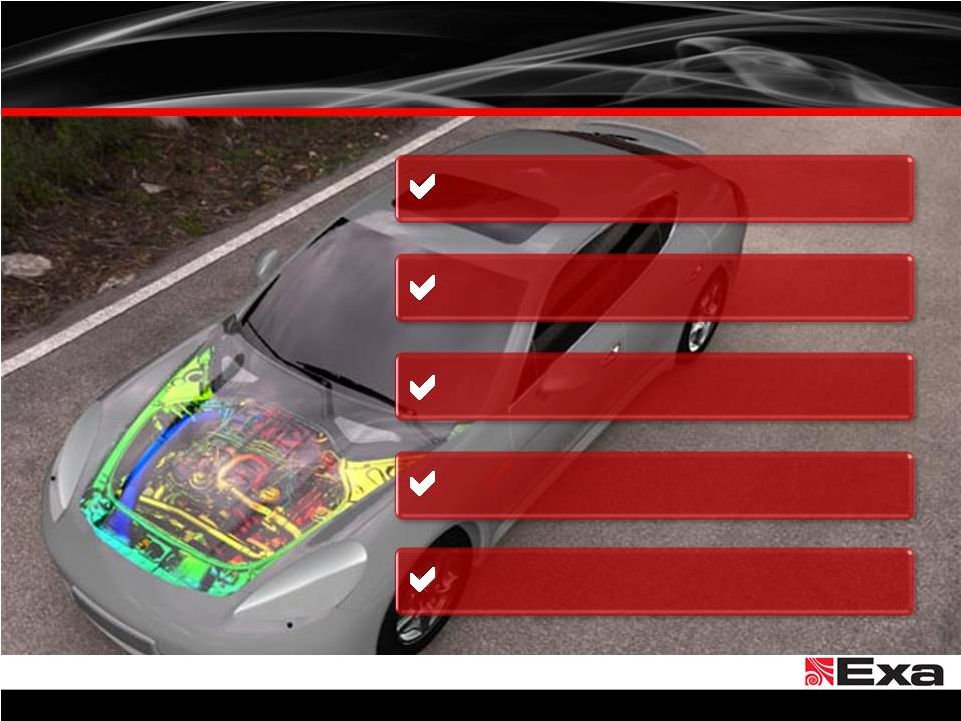
 Key
Investment Highlights ©
Exa Corporation Confidential
4
Proprietary, Market Leading Technology
Proprietary, Market Leading Technology
Tangible, Immediate Value Proposition
Tangible, Immediate Value Proposition
Growing Multi-billion Dollar Market
Growing Multi-billion Dollar Market
Opportunity in Transportation Alone
Opportunity in Transportation Alone
Top-tier Global Customers
Top-tier Global Customers
Highly-Visible, Consumption-based
Highly-Visible, Consumption-based
Licensing Model
Licensing Model
Experienced Management Team
Experienced Management Team |
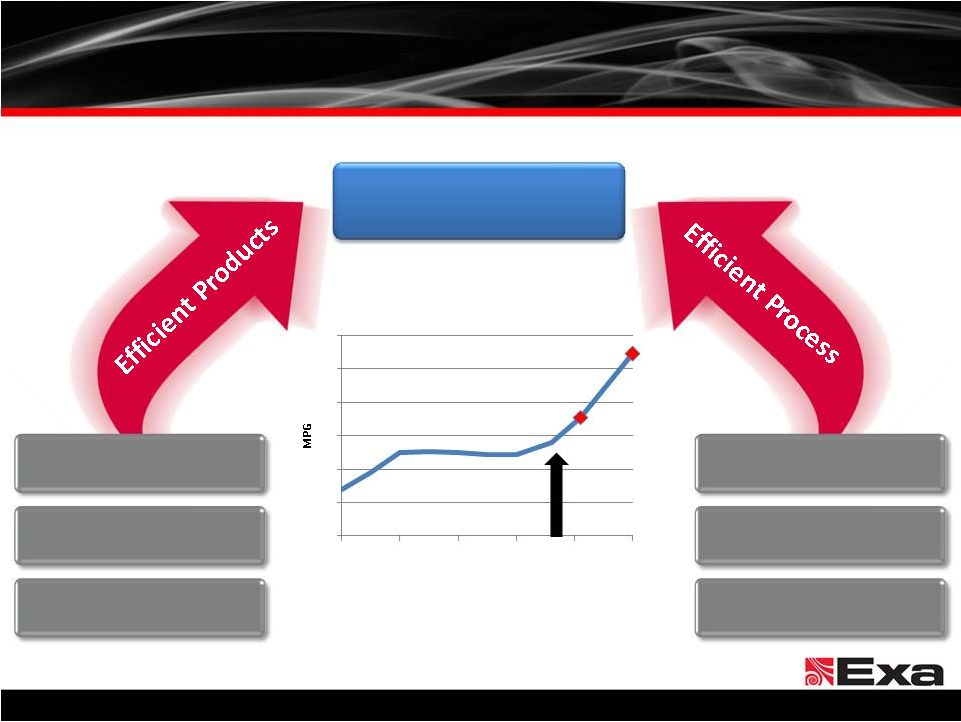 Transportation Market Requirements
©
Exa Corporation. All rights reserved.
5
Source: EPA
(1) The United States passenger car and light truck CAFE standard continues to rise to 56.2
MPG by 2025 (1)
0
10
20
30
40
50
60
1975
1985
1995
2005
2015
2025
U.S. CAFE
Simulation-based
Simulation-based
Design
Design
Aerodynamics
Aerodynamics
Weight Reduction
Weight Reduction
New Powertrains
New Powertrains
Fewer Prototypes
Fewer Prototypes
Increased Automation
Increased Automation
Faster Turnaround
Faster Turnaround
Time
Time |
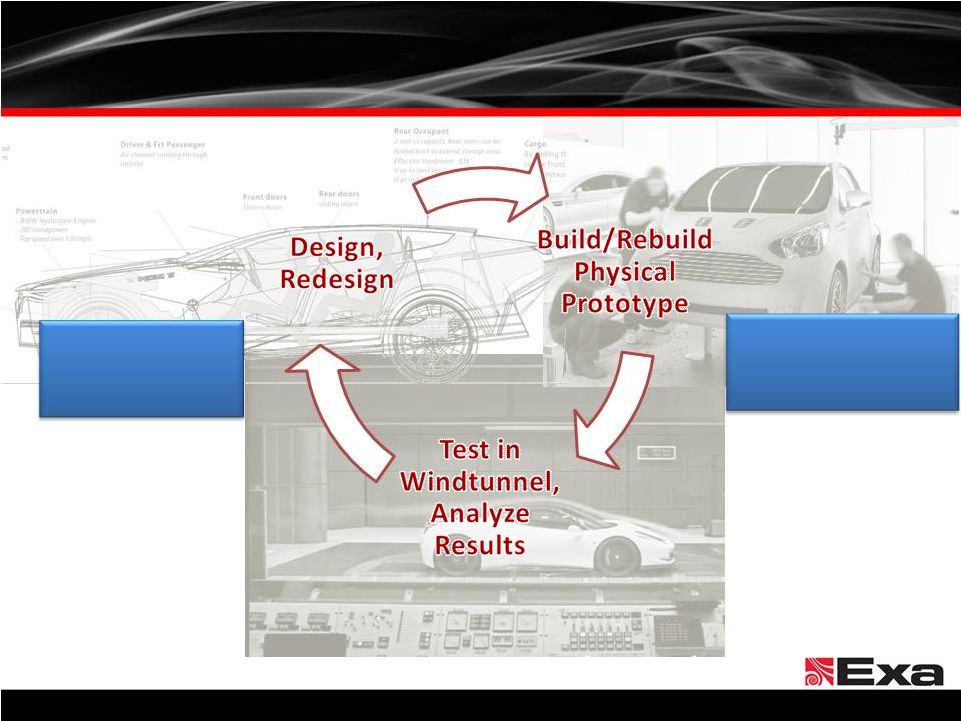 Traditional Development Process
©
Exa Corporation. All rights reserved.
6
Months
Brute-force
Brute-force
approach
approach
Expensive ($bn),
Expensive ($bn),
cumbersome
cumbersome
& time-consuming
& time-consuming |
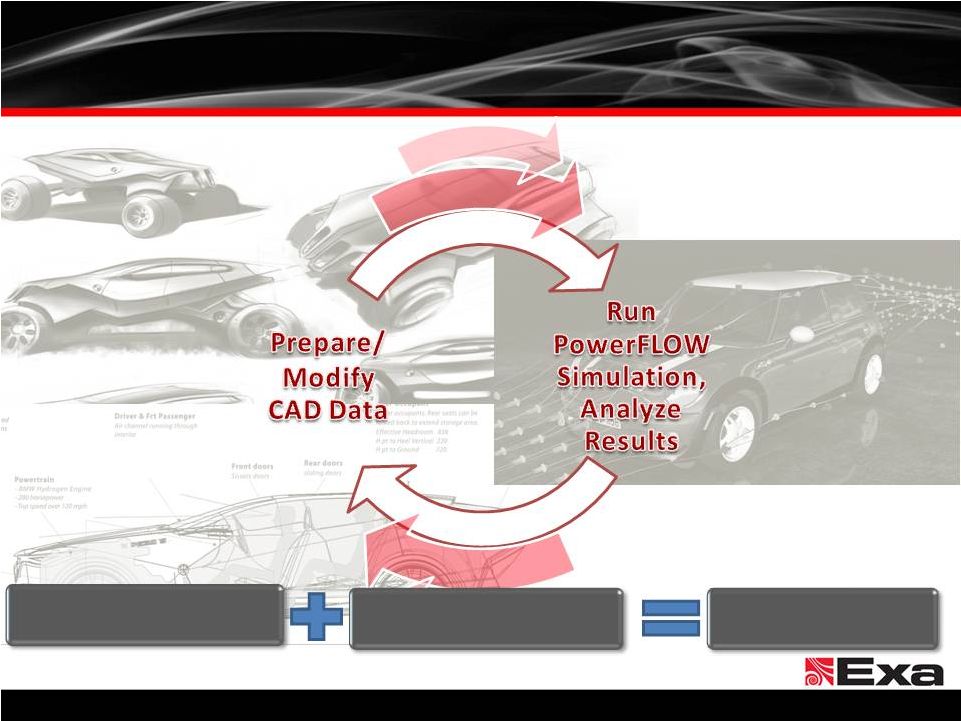 ©
Exa Corporation. All rights reserved.
7
Days
Proprietary Algorithms
Geometric Complexity
Accurate Results
Exa‘s Vehicle Development Process |
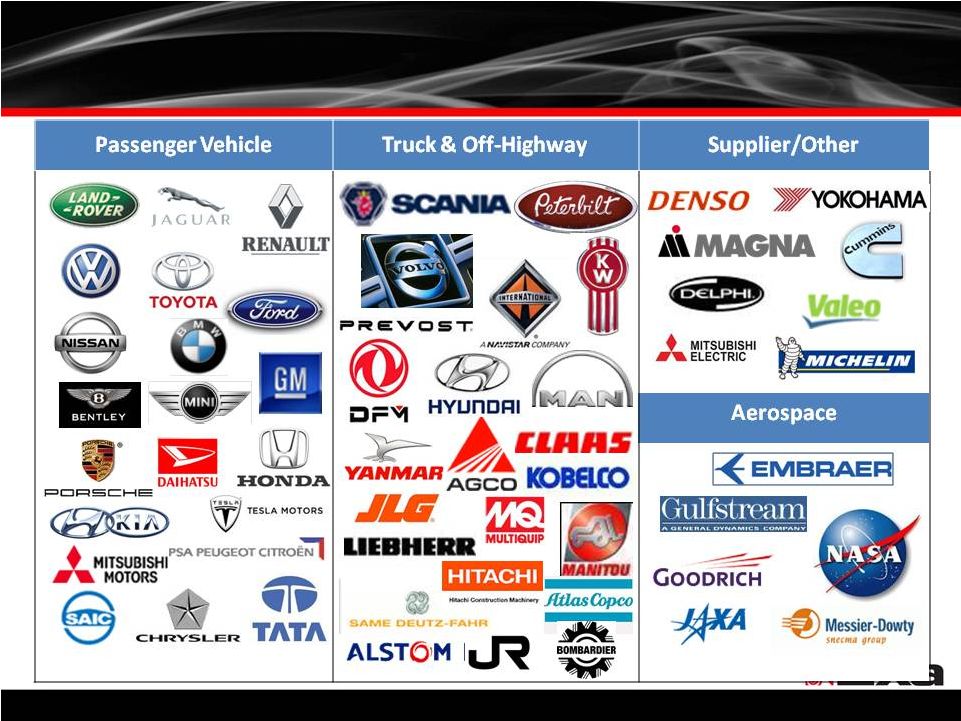 Global Customer Base
©
Exa Corporation. All rights reserved.
8 |
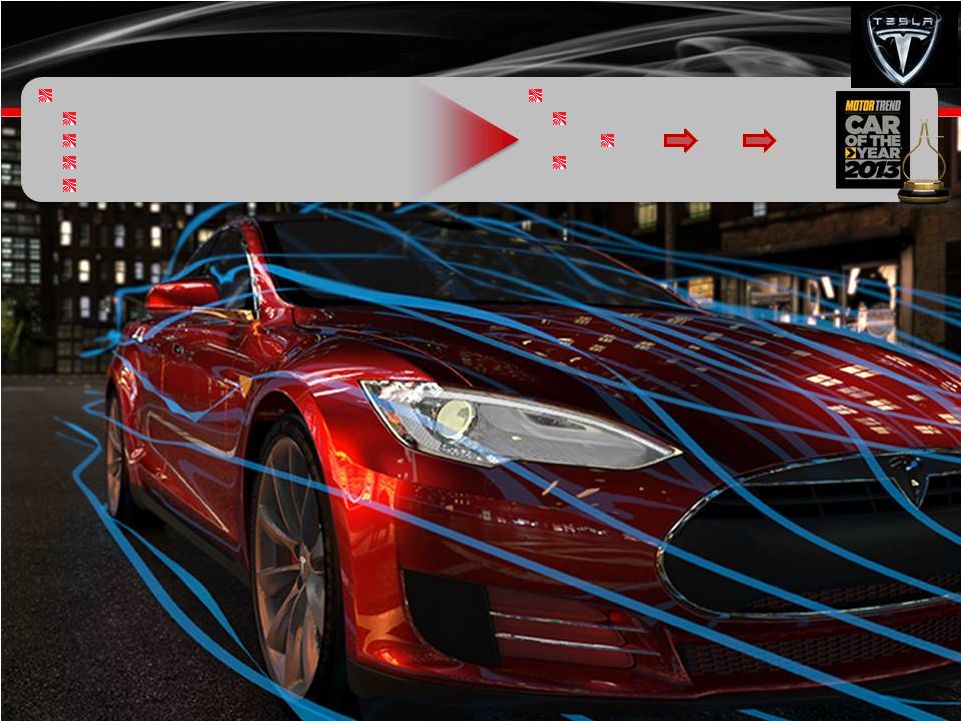 How
Tesla Uses Exa’s PowerFLOW The Problem
Develop brand new zero emissions sedan
5+2 passengers
World class design & performance
Long driving range on a single charge
9
©
Exa Corporation Confidential
The Results
265
mile
range
–
due
to
Cd
=
0.24
0.32
0.27 0.24 Reduced
wind noise |
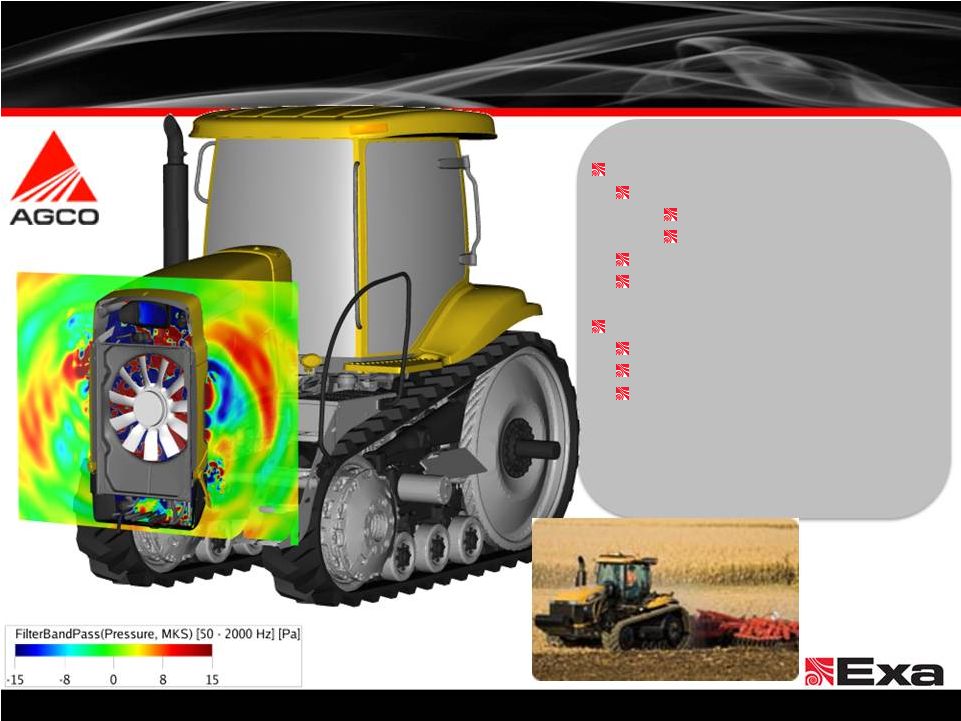 Customer Case Studies
10
©
Exa Corporation. All rights reserved.
The Challenge
Meet EPA Tier IV emissions standards
Increasing heat rejection
Requiring increased cooling
Meet New Noise Regulations
Improve Fuel Efficiency
The Results
Cooling package met cooling targets
Reduced Fan noise by 3+ dBA
Reduced HP consumption by 25+ HP |
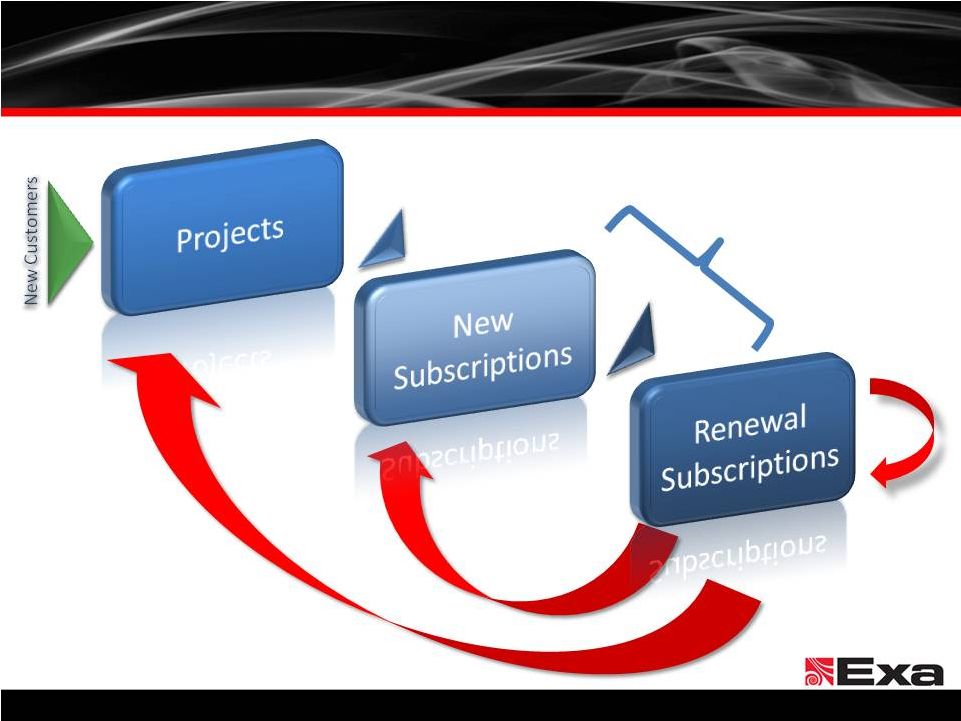 Customer Engagement Model
©
Exa Corporation Confidential
11
Annual
Annual
Renewals
Renewals
Deeper
Deeper
Deployment
Deployment
Upgrades
Upgrades
New
New
Applications
Applications
Capacity-Based Licensing
Capacity-Based Licensing
OnDemand
OnDemand
or On Premise
or On Premise |
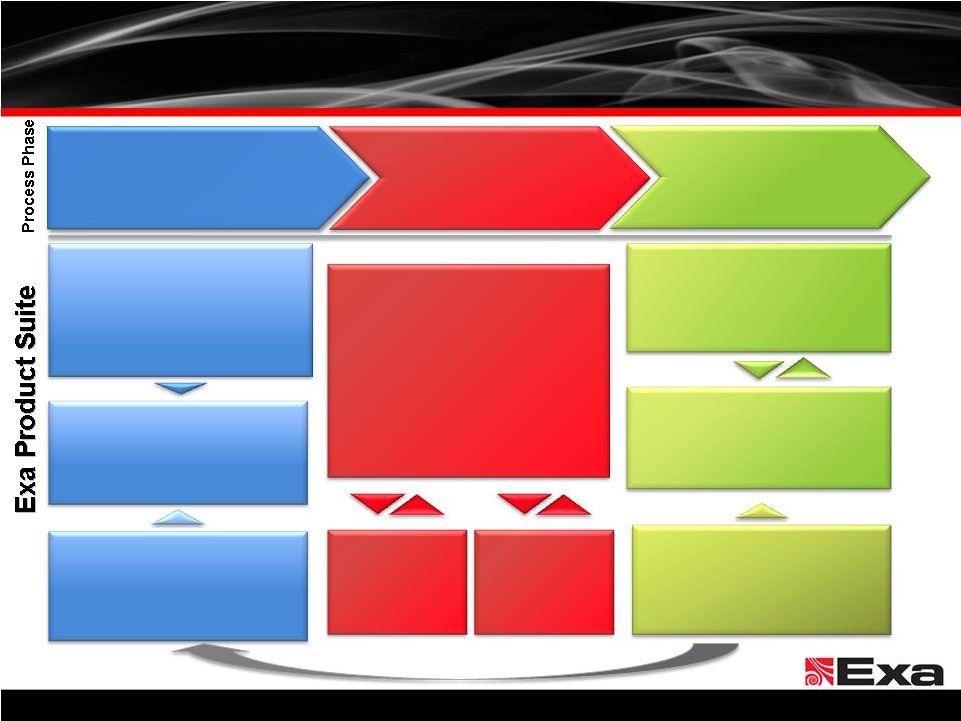 PowerFLOW Product Suite
Design Iterations
Design Iterations
12
©
Exa Corporation Confidential
Simulation Preparation
(User-based License)
(Consumption-based License)
Simulation
Simulation Analysis
(User-based License)
PowerDELTA
®
Import, sort and organize CAD model
Apply parametric mesh features
Generate surface meshes & check quality
PowerFLOW
®
Automatic fluid discretization
Automatic multi-processor
parallelized simulation
~80% of license revenue
PowerCASE
™
Set up simulation case parameters
& boundary conditions
PowerCLAY
®
Morph mesh real-time
for rapid design iteration
& optimization
PowerTHERM
®
Fully-coupled 3D
conduction
& radiation solver
PowerCOOL
®
Fully-coupled
cooling system
model
PowerINSIGHT
™
Streamline & automate the
results generation,
analysis, and reporting process
PowerVIZ
®
Analyze results and flow structures
with interactive 3D data
visualization, movies, & graphs
PowerACOUSTICS
®
Analyze and predict acoustic noise
transmission to the interior |
 ©
Exa Corporation Confidential
13
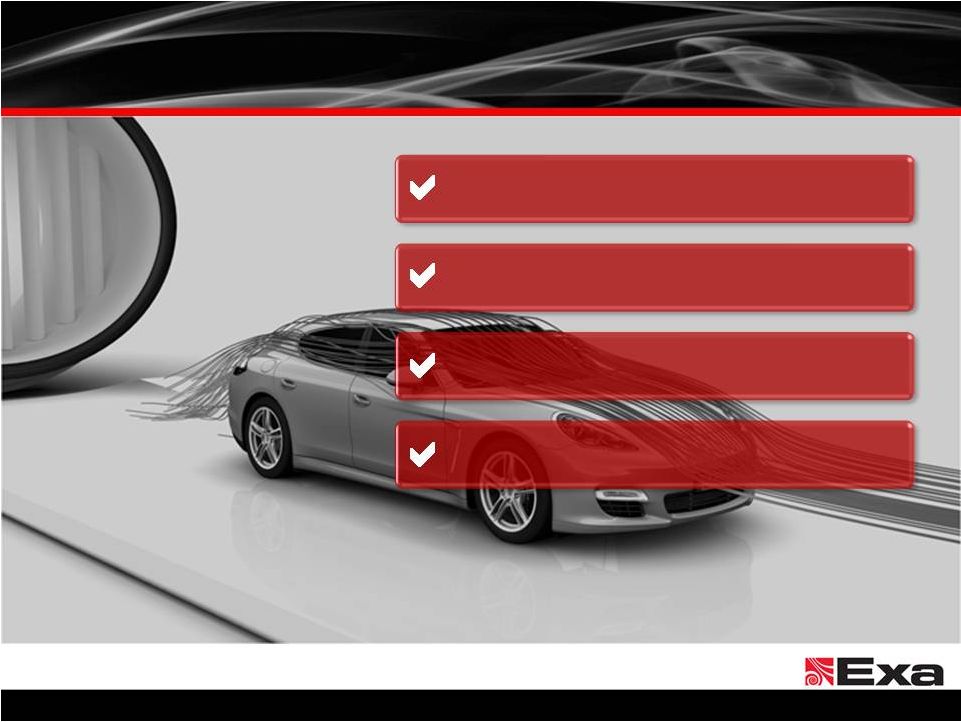
Why We Win
Highest Degree of Simulation Accuracy
Highest Degree of Simulation Accuracy
Faster Turnaround Time
Faster Turnaround Time
Deep Domain Expertise
Deep Domain Expertise
Return on Investment
Return on Investment
Differentiated Go-to-market Strategy
Differentiated Go-to-market Strategy |
 Growth Strategy
©
Exa Corporation Confidential
14
•
Migrating from
physical to digital-
based approaches
•
Identify new
applications to
address customer
needs
•
Significantly
underpenetrated
•
Adjacent markets
•
Expanding
presence in BRIC
•
Core technology is
extendable to
Aerospace, Oil &
Gas and Power
Generation
among others
•
Complementary
businesses &
technologies
Deepen Existing
Customer Base
Enable
Additional
Applications &
Solutions
Add New
Customers in
Ground
Transportation
Penetrate New
Geographies
Explore New
Verticals
Selectively
Pursue
Acquisitions |
 Key
Financial Highlights ©
Exa Corporation Confidential
15
Strong, Consistent Revenue Growth
Strong, Consistent Revenue Growth
Recurring & Predictable Business Model
Recurring & Predictable Business Model
Profitable & Cash Flow Positive
Profitable & Cash Flow Positive
Attractive Long-term Model
Attractive Long-term Model |
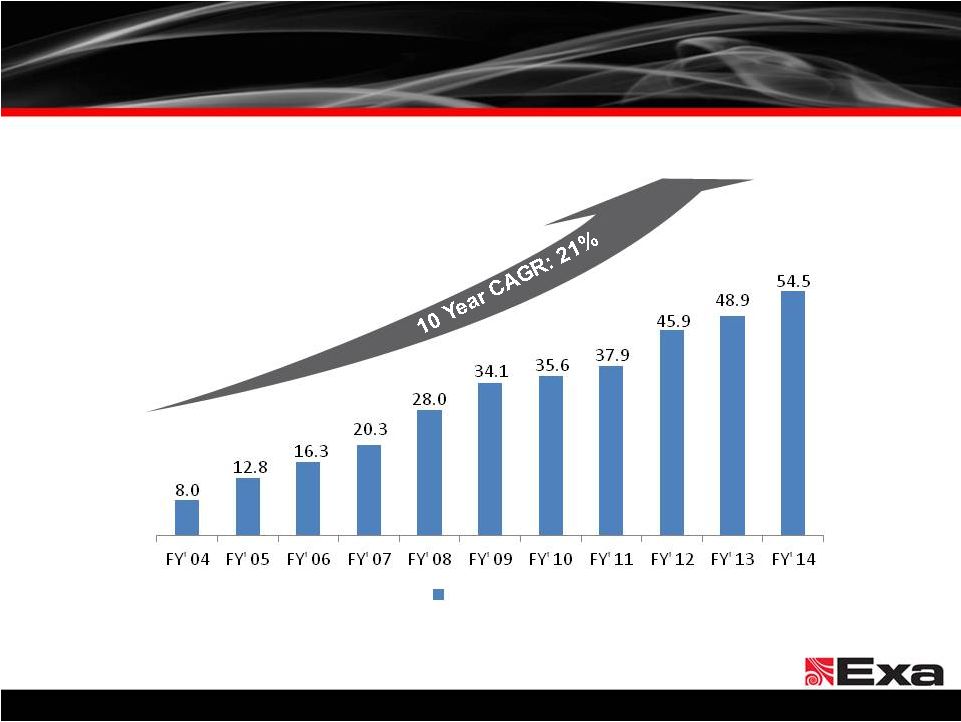 Consistent Revenue Growth
©
Exa Corporation Confidential
16
Note: We changed from a December 31 calendar year-end to a January 31st fiscal
year-end at the end of December 2006. Revenue ($M) |
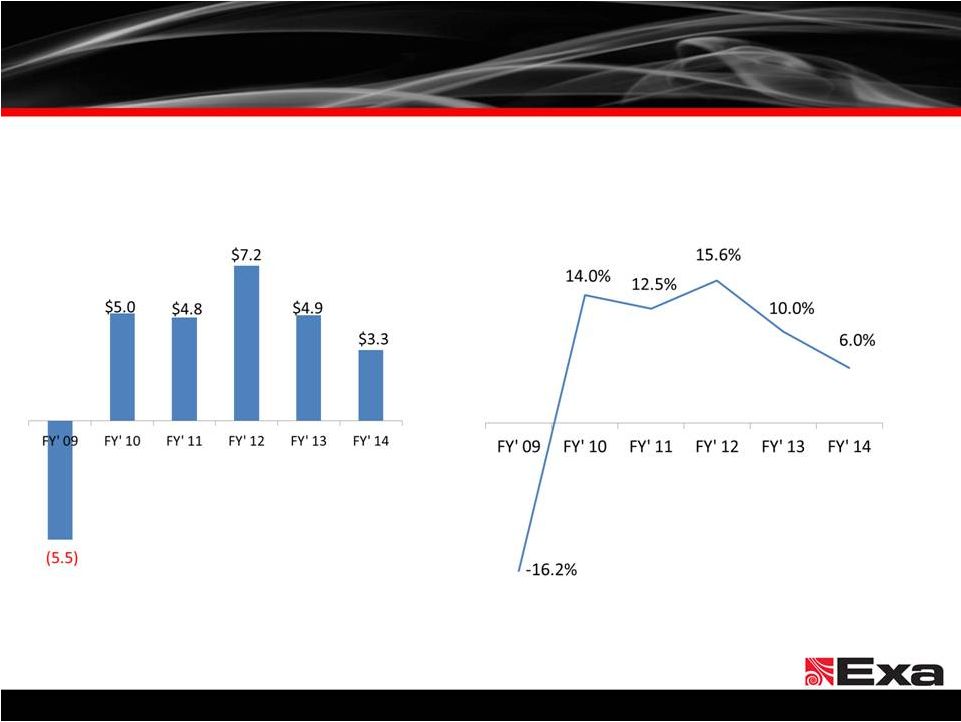 History of Profitability
17
©
Exa Corporation Confidential
Adjusted EBITDA
FYE Jan 31 (in millions)
Adjusted EBITDA Margin
FYE Jan 31
Note: Please see Appendix for detailed definition and reconciliation of Adjusted EBITDA to the
comparable GAAP financial measure of net income (loss). We define EBITDA as net
income (loss), excluding depreciation and amortization, interest expense, loss on extinguishment of debt, other income (expense), foreign
exchange gain (loss) and provision for income taxes. We define Adjusted EBITDA as EBITDA,
excluding non-cash share-based compensation expense. |
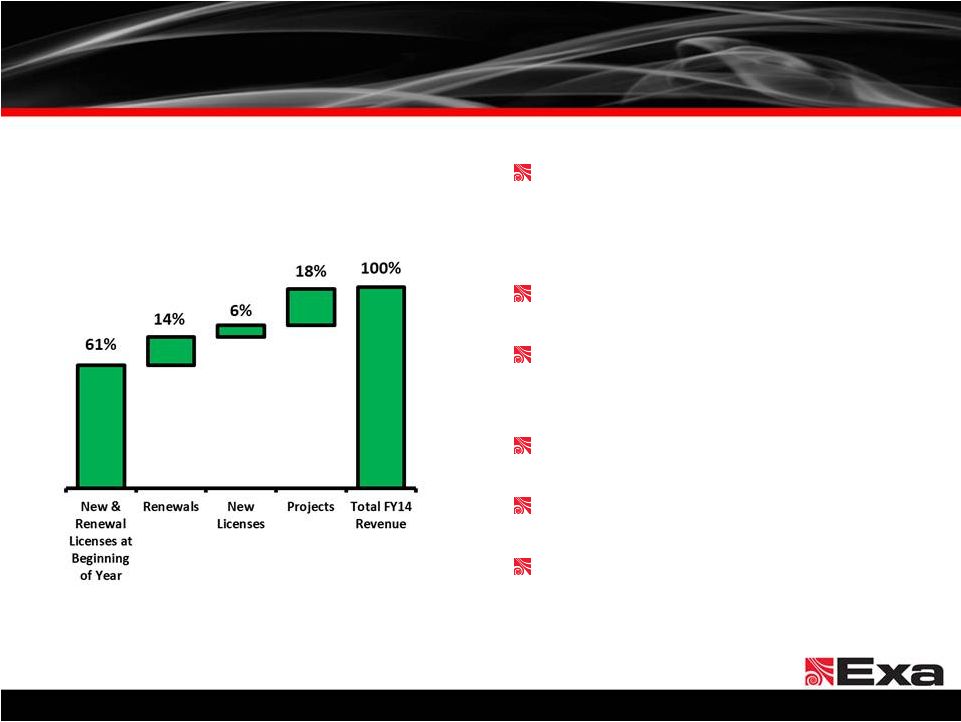 60%+ of our
annual revenue was attributable to contracts in place at
the beginning of the fiscal year
Annual consumption-based licenses
Increased consumption of simulation
capacity drives growth
Delivered on-premise or on-demand
Ratable revenue recognition
Project revenue is primarily derived
from simulation capacity
18
©
Exa Corporation Confidential
Highly Recurring & Predictable Model
Revenue Visibility
FY14 |
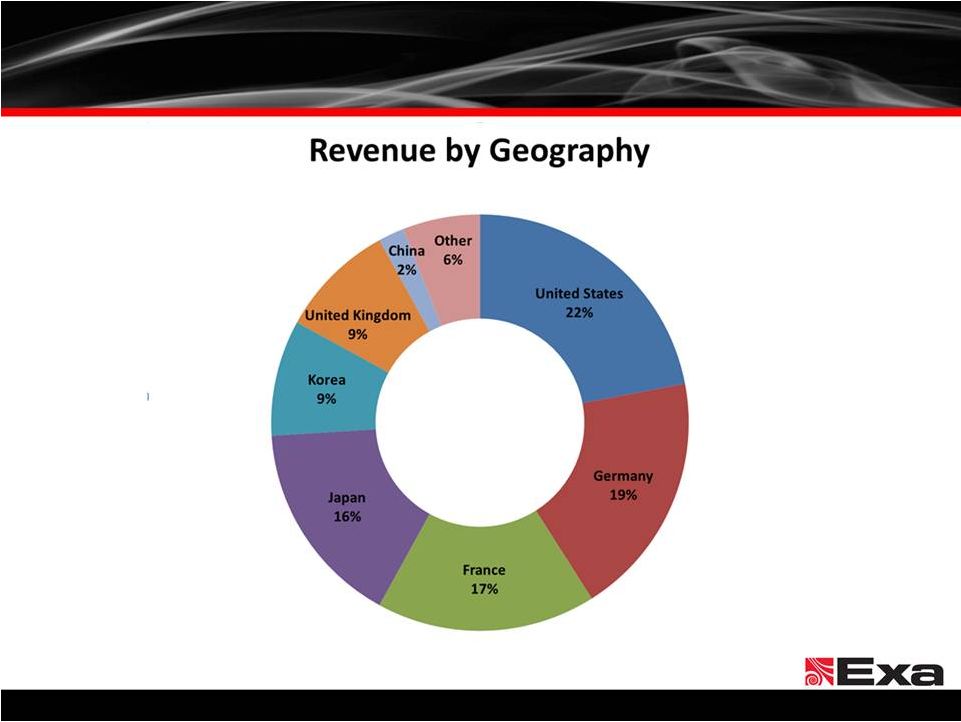 ©
Exa Corporation Confidential
19
Revenue Mix
Note: Data as of FY 2014 |
 Managing
business with focus on increasing revenue growth rate while maintaining positive
Adjusted EBITDA Continue to invest in Sales team to deepen existing customer
penetration and add new customers
Invest in additional applications & solutions to deepen penetration at
existing customers
Expand into other verticals including Aerospace and Oil & Gas
20
©
Exa Corporation. All rights reserved.
Target Model |
 Appendix
©
Exa Corporation Confidential |
 ©
Exa Corporation Confidential
22
*See Appendix
Key Financial Metrics
FY11
FY12
FY13
FY14
Revenue
License
$30.6
$38.8
$41.2
$44.6
Project
7.3
7.2
7.7
9.9
Total Revenue
$37.9
$45.9
$48.9
$54.5
Revenue Growth
6%
21%
6%
12%
Operating Expenses
Cost of Revenues
$9.9
$12.1
$14.2
$16.0
Sales & Marketing
6.1
6.2
7.1
9.5
Research & Development
12.8
14.5
16.7
18.2
General & Administrative
6.0
8.1
9.0
10.9
Total Operating Expenses
$34.8
$40.9
$47.0
$54.6
Non-GAAP Operating Income*
$3.4
$5.7
$3.3
$1.4
Adj. EBITDA*
$4.8
$7.2
$4.9
$3.3 |
 Adjusted EBITDA and Non-GAAP Operating Income
–
Definitions and Reconciliations
23
©
Exa Corporation. All rights reserved.
Non-GAAP Operating Income
(In thousands)
2011
2012
2013
2014
Operating (loss) income
3,116
$
5,035
$
1,960
$
(122)
$
Add back:
Stock based compensation expense
281
636
924
1,210
Amortization of acquired intangible assets
0
65
383
351
Non-GAAP operating income
3,397
$
5,736
$
3,267
$
1,439
$
Adjusted EBITDA Reconciliation
(In thousands)
2011
2012
2013
2014
Net (loss) Income
691
$
14,138
$
763
$
(709)
$
Depreciation and amortization
1,356
1,502
2,009
2,185
Interest expense, net
1,411
1,284
1,631
679
Loss on extinguishment of debt
0
0
0
755
Other (income) expense
(10)
213
(529)
(10)
Foreign exchange loss (gain)
198
106
(17)
83
Provision for income tax
826
(10,706)
112
(920)
EBITDA
4,472
6,537
3,969
2,063
281
636
924
1,210
Adjusted EBITDA
4,753
$
7,173
$
4,893
$
3,273
$
Year Ended January 31,
Year Ended January 31,
Non-cash, share based
compensation expense
To supplement our consolidated financial statements, which are presented on a GAAP basis, we
disclose Non-GAAP Operating Income and Adjusted EBITDA, non-GAAP measures that
exclude certain amounts. These non-GAAP measures are not in accordance with, or an alternative for, generally accepted accounting principles in the United
States. The GAAP measures most comparable to Non-GAAP Operating Income and Adjusted EBITDA
are GAAP income from operations and GAAP net income (loss), respectively.
Reconciliations of these non-GAAP financial measures to the corresponding GAAP measures
are included above.
We define non-GAAP operating income as GAAP operating income excluding non-cash,
stock-based compensation expense and amortization of acquired intangible assets. We
define EBITDA as net income (loss), excluding depreciation and amortization, interest
expense, loss on extinguishment of debt, other income (expense), foreign exchange gain
(loss) and provision for income taxes. We define Adjusted EBITDA as EBITDA, excluding
non-cash share-based compensation expense. Note:
|
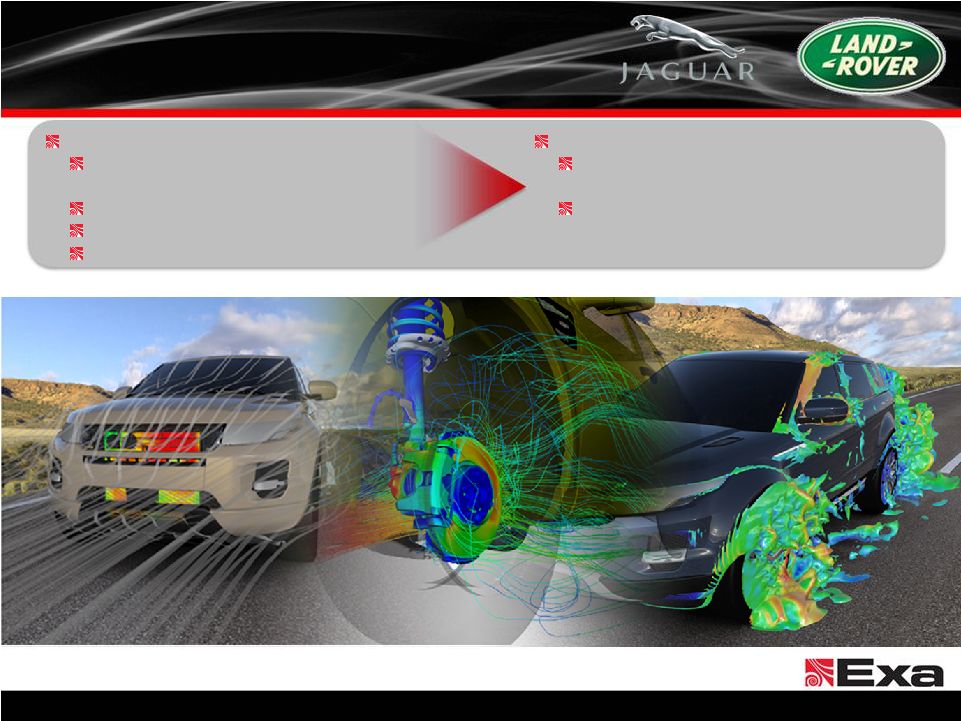 How
JLR Uses Exa’s PowerFLOW The Problem
Reduce joint fleet CO2 to meet global
emissions target by 2020+
Portfolio Diversification
Reduce cost of prototypes
Enable digital sign-off
24
©
Exa Corporation Confidential
The Results
Thermal Mgmt & Aerodynamic prototypes
eliminated prior to production tooling release
Further elimination opportunities for
Aeroacoustics & water mgmt in development |
 Customer Case Studies
25
©
Exa Corporation. All rights reserved.
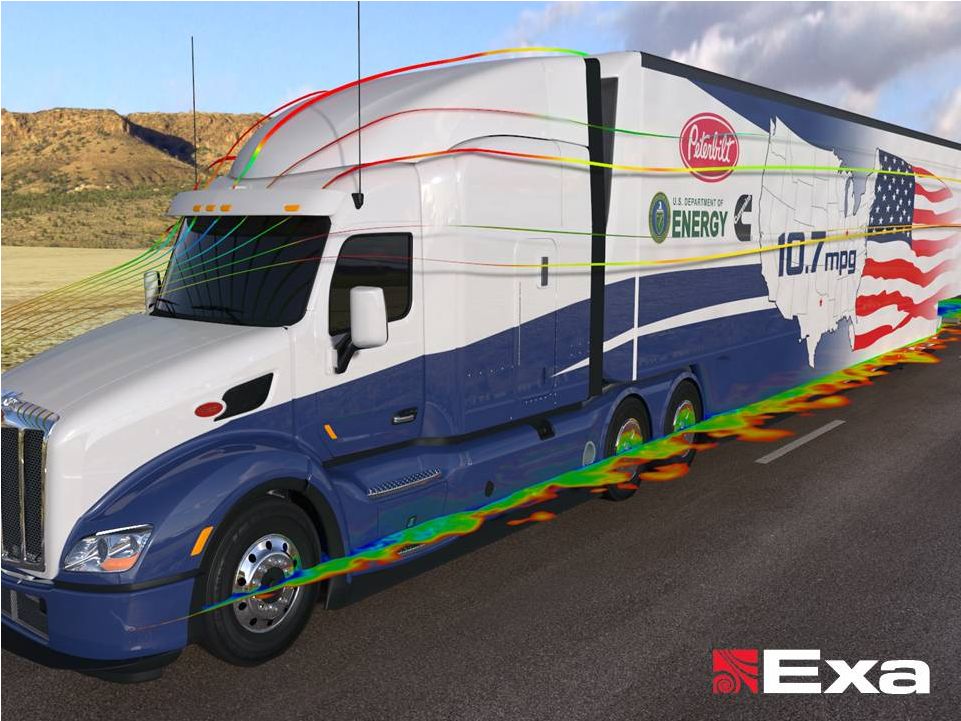
The Problem
Demand for more fuel efficient trucks
Top buying requirement
The Results
24% reduction in aerodynamic drag
12% improvement in fuel economy
~$5,600 annual fuel savings per vehicle |
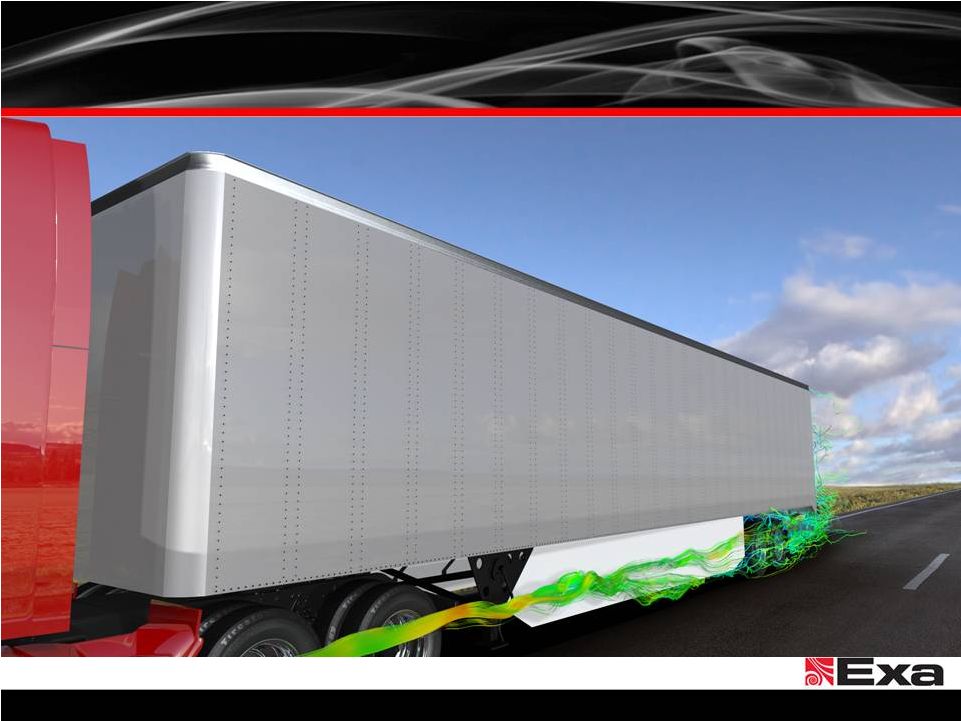 Customer
Case
Studies
–
Trailer
Devices
26
©
Exa Corporation. All rights reserved. |
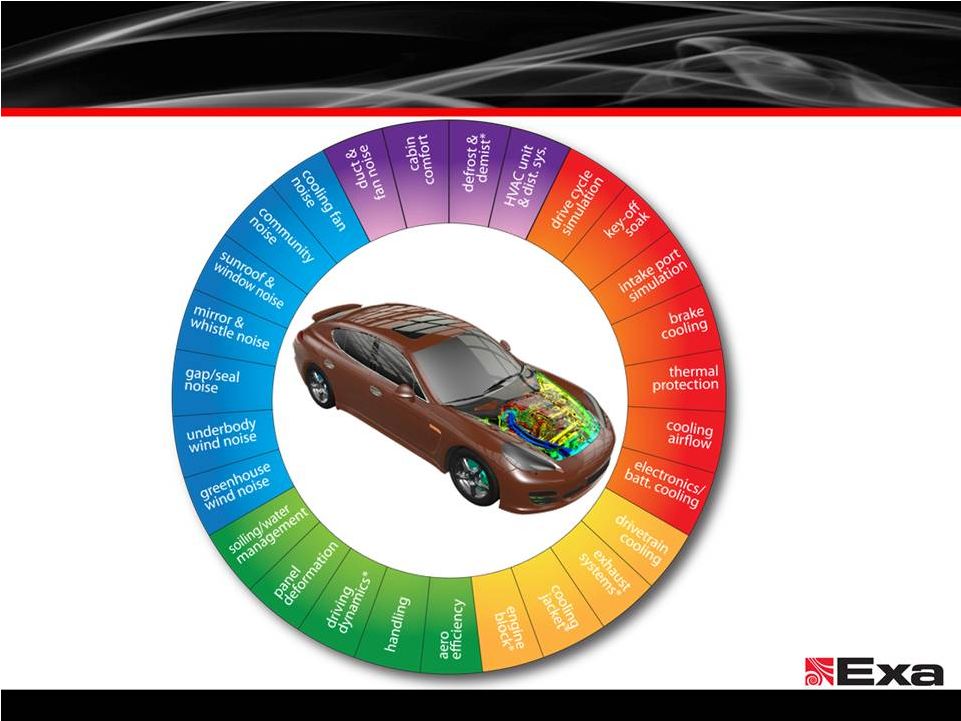 Ground Transportation Applications
©
Exa Corporation Confidential
27 |