Attached files
| file | filename |
|---|---|
| 8-K - CURRENT REPORT OF MATERIAL EVENTS OR CORPORATE CHANGES - RSP Permian, Inc. | a14-9201_18k.htm |
| EX-99.1 - EX-99.1 - RSP Permian, Inc. | a14-9201_1ex99d1.htm |
Exhibit 99.2
|
|
Corporate Update March 31, 2014 |
|
|
2 Forward Looking Information Certain statements and information in this presentation may constitute “forward-looking statements” within the meaning of the Private Securities Litigation Reform Act of 1995. The words “believe,” “expect,” “anticipate,” “plan,” “intend,” “foresee,” “should,” “would,” “could” or other similar expressions are intended to identify forward-looking statements, which are generally not historical in nature. These forward-looking statements are based on our current expectations and beliefs concerning future developments and their potential effect on us. While management believes that these forward-looking statements are reasonable as and when made, there can be no assurance that future developments affecting us will be those that we anticipate. Our forward-looking statements involve significant risks and uncertainties (some of which are beyond our control) and assumptions that could cause actual results to differ materially from our historical experience and our present expectations or projections. Important factors that could cause actual results to differ materially from those in the forward-looking statements include, but are not limited to, the volatility of commodity prices, product supply and demand, competition, access to and cost of capital, uncertainties about estimates of reserves and resource potential and the ability to add proved reserves in the future, the assumptions underlying production forecasts, the quality of technical data, environmental and weather risks, including the possible impacts of climate change, the ability to obtain environmental and other permits and the timing thereof, other government regulation or action, the costs and results of drilling and operations, the availability of equipment, services, resources and personnel required to complete the Company’s operating activities, access to and availability of transportation, processing and refining facilities, the financial strength of counterparties to the Company’s credit facility and derivative contracts and the purchasers of the Company’s production, and acts of war or terrorism. For additional information regarding known material factors that could cause our actual results to differ from our projected results, please see our filings with SEC, including our Annual Report on Form 10-K. Existing and prospective investors are cautioned not to place undue reliance on forward-looking statements, which speak only as of the date hereof. We undertake no obligation to publicly update or revise any forward-looking statements after the date they are made, whether as a result of new information, future events or otherwise. |

|
|
3 Corporate Update |
|
|
4 RSP Overview Market Snapshot Permian Basin Pure Play 2013 Pro Forma Production and Reserves(3) ___________________________ As of March 27, 2014. Expected balance as of March 31, 2014. As of December 31, 2013. Pro forma formation transactions described in 10-K. Pro forma acreage includes acreage from recent acquisitions. Average daily production for year ended December 31, 2013. NYSE Symbol: RSPP Market Cap(1): ~$2.1 billion Long-term Debt(2): ~$0.1 billion Enterprise Value: ~$2.2 billion Focus Area Dawson Area Pro Forma Acreage(3) Effective Horizontal Acreage Gross Net Middle Spraberry 52,970 38,676 Lower Spraberry 53,607 39,250 Wolfcamp A 33,906 21,979 Wolfcamp B 47,136 33,301 Wolfcamp D 39,740 27,354 227,359 160,560 Surface Acreage 53,607 39,250 Total Average Daily Production (4) ~7.3 MBoe/d Proved Reserves 53.9 MMBoe % Oil 65% % NGL 19% % Natural Gas 16% Proved Developed 40% Exit Rate Daily Production ~8.2 MBoe/d |

|
|
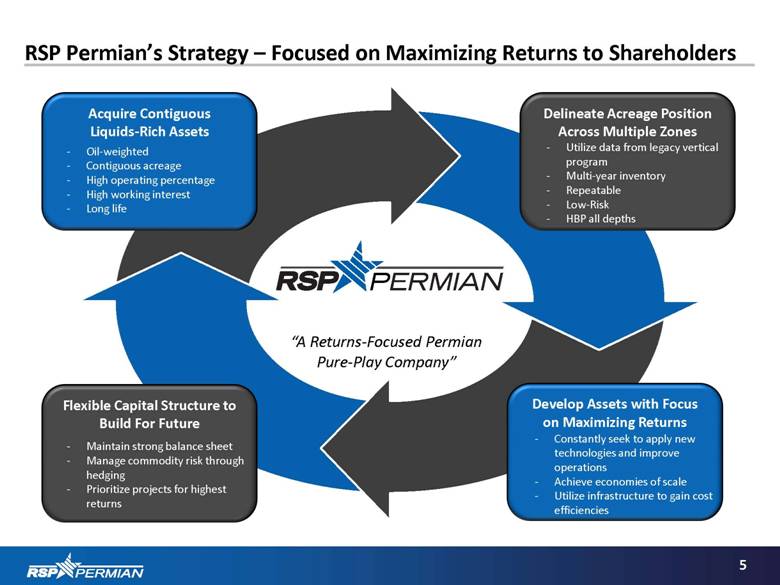
5 RSP Permian’s Strategy – Focused on Maximizing Returns to Shareholders “A Returns-Focused Permian Pure-Play Company” Delineate Acreage Position Across Multiple Zones Utilize data from legacy vertical program Multi-year inventory Repeatable Low-Risk HBP all depths Acquire Contiguous Liquids-Rich Assets Oil-weighted Contiguous acreage High operating percentage High working interest Long life Flexible Capital Structure to Build For Future Maintain strong balance sheet Manage commodity risk through hedging Prioritize projects for highest returns Develop Assets with Focus on Maximizing Returns Constantly seek to apply new technologies and improve operations Achieve economies of scale Utilize infrastructure to gain cost efficiencies |
|
|
6 Company Highlights Overview RSP Multiple Target Zones Provide Substantial Horizontal Inventory(1) Attractively positioned asset base Large, concentrated acreage blocks in core of Midland Basin Oil-weighted (65% oil, 84% liquids)(2) Leading horizontal and vertical drilling experience in multiple pay zones RSP has participated in the drilling of 53 horizontal wells (23 operated) targeting 6 pay zones as of March 15, 2014 Participated in drilling over 300 vertical wells (over 180 operated) since inception Operating 3 horizontal rigs and 4th rigging up in 2Q 2014; 1 operated vertical rig, adding 2nd vertical rig in 2Q 2014 Large inventory of identified drilling locations 1,459 horizontal and 797 vertical drilling locations Future upside in increasing lateral density and other prospective and other prospective horizontal pay zones Strong financial position ~$200 million available on revolving credit facility <0.5x Net Debt / Adjusted EBITDAX(3) Active hedging program ___________________________ As of December 31, 2013. Includes acreage and locations from recent acquisitions. Proved Reserves as of December 31, 2013. Pro forma formation transactions described in 10-K. Please see reconciliation of Adjusted EBITDAX. |

|
|
7 Financial Update Financial Update Pro Forma Daily Production Pro Forma 2013 Results ___________________________ Pro forma Adjusted EBITDAX excludes gain on sale of assets to Resolute. Please see reconciliation of Adjusted EBITDAX. Pro forma results include formation transactions as described in 10-K. Range of 2014E outlook does not include any impact from development plans on acquired properties. CAGR based on midpoint of outlook range. 2010 – 2014E Production CAGR: 63% (3) 18% Production on a pro forma basis increased 43% in 2013 over 2012, averaging approximately 7.3 MBoe/d 2013 production exit rate of approximately 8.2 MBoe/d RSP generated $152mm of pro forma Adjusted EBITDAX(1) in 2013, an increase of 57% over 2012 (3) 10,000 – 11,000 (1) (2) RSP Permian, Inc. RSP Permian, Inc. Q4 2013 Pro Forma 2013 Pro Forma (2) Avg Daily Production Oil (Boe/d) 5,613 5,116 Natural Gas (Mcf/d) 6,235 6,266 NGL (Boe/d) 1,181 1,133 Total (Boe/d) 7,837 7,293 Avg Realized Prices Oil (per Bbl) $94.91 $95.24 Natural Gas (per Mcf) 3.38 3.34 NGLs (per Bbl) 28.94 28.16 Total (per Boe) $75.02 $74.06 Total Revenues ($MM) $53.8 $196.7 Operating Income ($MM) 25.5 75.8 Adjusted EBITDAX ($MM) 40.6 152.4 Net Income ($MM) 14.1 40.8 Cash Expenses per Boe ($ / Boe) LOE $8.84 $8.72 Production & Ad Valorem 6.31 4.97 G&A 1.60 1.40 |

|
|
3rd operated horizontal rig added in January 2nd operated vertical rig arriving in the second quarter 4th operated horizontal rig to arrive in the second quarter Infrastructure (water supply wells, frac pit, and deep SW disposal well) in Spanish Trail prepared for horizontal rig arrival Three “dual well/dual zone” pads on production Kemmer 4210H(LS) / Kemmer 4210WB – Lower Spraberry / Wolfcamp B combination Johnson Ranch 912H(WB) / Johnson Ranch 912MS – Middle Spraberry / Wolfcamp B combination Fendley 404MS / Fendley 404LS – Middle Spraberry / Lower Spraberry combination Three “dual well/dual zone” pads currently drilling Cross Bar Ranch 3025WD / Cross Bar Ranch 3025WB – Wolfcamp D (Cline) / Wolfcamp B combination Will add Middle Spraberry / Lower Spraberry combination wells to pad in 3rd Qtr. Cross Bar Ranch 1717WB / Cross Bar Ranch 1717WA – Wolfcamp B / Wolfcamp A Combination Will add Middle Spraberry / Lower Spraberry combination wells to pad in 4th Qtr. Headlee 3505LS / Headlee 3505WB – Lower Spraberry / Wolfcamp B Combination Operations moving rapidly toward full multi-well/multi-zone pad development Lower Spraberry wells and short (~5,000’) lateral Wolfcamp B wells outperforming expectations Capital cost continue to trend down Updated type curves and reduced capital have increased expected IRR’s 8 Current Activity Operations Update Recent Well Results Net Horizontal Production since Program Inception Boe/d 2014E Net Production: Targeting 40%+ Hz with 3-4 rigs; averaged <2 operated Hz rigs in 2013 First Test Wells Hz Drilling Ramp (1 full-time rig) 2nd operated Hz rig Lateral 30-Day IP Well Name County Length (ft) Zone (Boe/d) Status Kemmer 4210LS Midland 5,247 Lower Spraberry 979 Producing Headlee 3911H Midland 7,270 Lower Spraberry 782 Producing Kemmer 4210WB Midland 5,281 Wolfcamp B 742 Producing Parks Bell 3909H Midland 7,277 Lower Spraberry 683 Producing Johnson Ranch 912WB Martin 7,365 Wolfcamp B NA Producing Johnson Ranch 912MS Martin 7,848 Middle Spraberry NA Producing Fendley 404LS Ector 4,462 Lower Spraberry NA Producing Fendley 404LMS Ector 4,641 Middle Spraberry NA Producing Cross Bar Ranch 1717H(WB) Andrews 6,955 Wolfcamp B NA Completing Cross Bar Ranch 3025WD Martin 4,292 Wolfcamp D (Cline) NA Completing Keystone 1003LS Midland 7,440 Lower Spraberry NA Completing Headlee 3505LS Midland 5,126 Lower Spraberry NA Drilling Cross Bar Ranch 1717WA Andrews NA Wolfcamp A NA Drilling Cross Bar Ranch 3025WB Martin NA Wolfcamp B NA Drilling |
|
|
9 Recent Acquisition Overview Bolt-On Acquisitions Verde Expansion 18% Since IPO, RSP has closed on 3 separate transactions adding horizontal inventory Combined purchase price of $79 million funded by borrowings under revolving credit facility Martin County (“East Cowden” Acquisition) Acquired 17.5% non-operated working interest of producing properties Located between RSP-operated positions 6,451 gross (1,125 net) acres, ~500 Boe/d average net production for February (2-stream) Diamondback Energy (operator) has identified 196 (34 net to RSP) locations in 6 intervals (Middle Spraberry, Lower Spraberry, Wolfcamp A, Wolfcamp B, Wolfcamp D (Cline) and Clearfork) Glasscock County (“Dude” Acquisition) Acquired 100% working interest in 961 acres of undeveloped leasehold 30 horizontal locations identified in 5 intervals (Middle Spraberry, Lower Spraberry, Wolfcamp A, Wolfcamp B, Wolfcamp D) Dawson County (“Verde” Expansion) Acquired 3,766 gross (3,230 net) acres in Verde prospect area 61 net horizontal locations identified in 3 zones (Middle Spraberry, Lower Spraberry, Wolfcamp A/B) East Cowden Acquisition Dude Acquisition IPO Acreage Acquired Acreage |

|
|
10 Reserves, Hedging, Liquidity and 2014 Outlook Pro Forma Proved Reserves as of 12/31/13(1) 18% Liquidity (as of February 28, 2014) Production and Capex Outlook(3) ___________________________ Independent reserve report prepared by Ryder Scott. The crude oil derivative contracts are settled based on the month’s average daily NYMEX price of West Texas Intermediate Light Sweet Crude. The natural gas derivative contracts are settled based on the NYMEX closing settlement price. Excludes any impact from development plans on acquired properties; update will be provided on 1Q 2014 earnings release. 53.9 MMBoe Additional Hedges Since IPO(2) 18% Nearly doubled oil hedges over next 12 months, with total blended floor of ~$88 over that period Added 2014 natural gas collars (floor of $4.00 / ceiling of $4.78) Hedged MBoe Hedged MMcf Production: Total Boe/d 10,000 - 11,000 % Oil 72% - 74% % Natural Gas 12% - 14% % NGLs 13% - 15% Capital Budget: Drilling & Completion Capex ($MM) $340 - $360 Infrastructure / G&G Capex ($MM) $10 - $15 Gross Net Operated Horizontal Wells 40 - 45 34 - 40 Non-Operated Horizontal Wells 25 - 30 4 - 6 Operated & Non-Op Vertical Wells 65 - 70 38 - 42 Cash $26.0 Credit Facility 95.0 Net Debt $69.0 Revolver Borrowing Base $300.0 Revolver Availability 205.0 Current Liquidity $231.0 |

|
|
11 Asset Overview |

|
|
12 RSP’s Focus Area Is in One of the Most Prolific Areas of the Midland Basin Midland Basin Historical Oil Production Heat Map RSP’s Acreage Source: IHS Enerdeq, best-month oil production for wells completed between 1/1/2008 and 9/30/2013. Best-month oil production (bbl) >6,000 4,000-6,000 3,000-4,000 2,000-3,000 1,000-2,000 <1,000 Red dots indicate the most prolific oil production in the basin Borden Focus Area Dawson Area Focus Area Dawson Area |

|
|
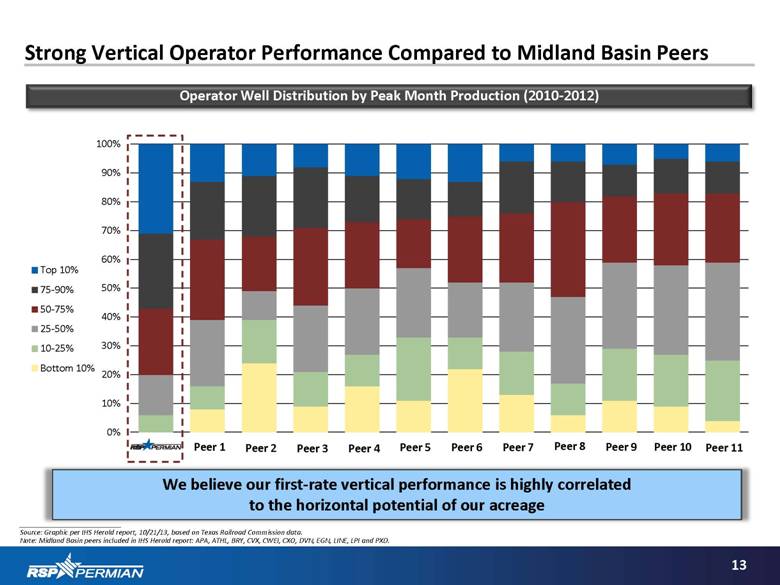
13 Strong Vertical Operator Performance Compared to Midland Basin Peers Operator Well Distribution by Peak Month Production (2010-2012) ___________________________ Source: Graphic per IHS Herold report, 10/21/13, based on Texas Railroad Commission data. Note: Midland Basin peers included in IHS Herold report: APA, ATHL, BRY, CVX, CWEI, CXO, DVN, EGN, LINE, LPI and PXD. We believe our first-rate vertical performance is highly correlated to the horizontal potential of our acreage Peer 1 Peer 2 Peer 3 Peer 4 Peer 5 Peer 6 Peer 7 Peer 8 Peer 9 Peer 10 Peer 11 |
|
|
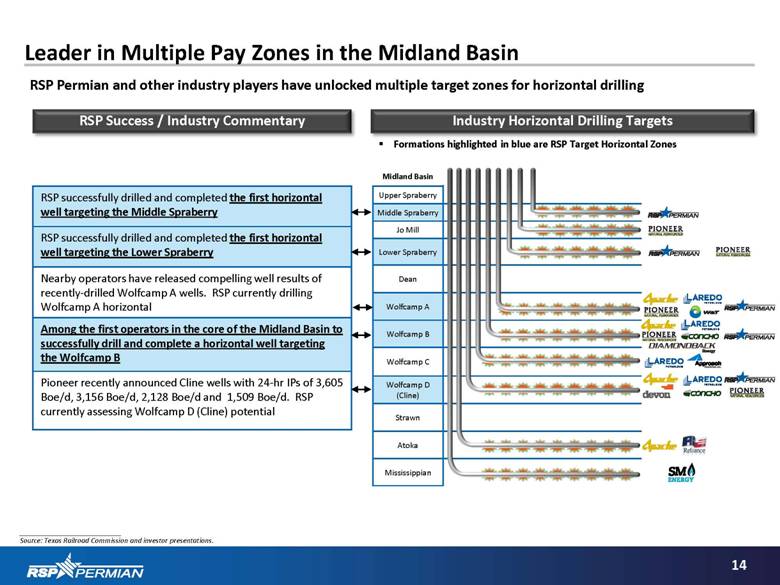
Industry Horizontal Drilling Targets Midland Basin Upper Spraberry Middle Spraberry Jo Mill Lower Spraberry Dean Wolfcamp A Wolfcamp B Wolfcamp C Wolfcamp D (Cline) Strawn Atoka Mississippian 14 Leader in Multiple Pay Zones in the Midland Basin RSP Success / Industry Commentary RSP Permian and other industry players have unlocked multiple target zones for horizontal drilling Formations highlighted in blue are RSP Target Horizontal Zones ___________________________ Source: Texas Railroad Commission and investor presentations. RSP successfully drilled and completed the first horizontal well targeting the Middle Spraberry RSP successfully drilled and completed the first horizontal well targeting the Lower Spraberry Nearby operators have released compelling well results of recently-drilled Wolfcamp A wells. RSP currently drilling Wolfcamp A horizontal Among the first operators in the core of the Midland Basin to successfully drill and complete a horizontal well targeting the Wolfcamp B Pioneer recently announced Cline wells with 24-hr IPs of 3,605 Boe/d, 3,156 Boe/d, 2,128 Boe/d and 1,509 Boe/d. RSP currently assessing Wolfcamp D (Cline) potential |
|
|
___________________________ Note: As of December 31, 2013. Includes locations from recent acquisitions. Dawson area Wolfcamp locations categorized as “Wolfcamp A/B” and included in Wolfcamp B locations. EUR reflects 7,000’ lateral type curve. Lack of production history in the Middle Spraberry and Wolfcamp D (Cline) horizontal wells on RSP acreage. RSP will continue to monitor its well results in assessing the Company’s EURs and resource potential in these zones. 15 Extensive Multi-Year Drilling Inventory with Strong Rates of Return Identified Horizontal Locations Identified Vertical Locations Highlights Multi-year inventory of horizontal and vertical drilling projects Multiple stacked pay zones beneath concentrated acreage position Focus Area Dawson Area Peak Operated Horizontal Rigs Peak Operated Vertical Rigs Increasing Horizontal Activity Shift from Vertical Drilling to Horizontal Development Maintain Vertical Program to Hold All Prospective Zones Operated horizontal locations booked at 5 wells across a section (~1,100’ spacing) Net Locations: Focus Area 154 151 127 117 155 704 Dawson 87 87 - 87 - 261 Total Net Locations: 241 238 127 204 155 965 EUR (1) NA(2) 615 617 617 NA(2) Avg. Lat. Length 6,067' 6,067' 6,214' 6,036' 6,165' |

|
|
Horizontal Production Production (Boe/d) 16 Horizontal Drilling Driving Production Growth Experienced Midland Basin technical team has a proven track record of production growth ~80% of D&C capex directed to horizontal drilling Targeting >40% production growth in 2014 2010 – 2014E Production CAGR: 63% (1) ___________________________ Range of 2014E outlook does not include any impact from development plans on acquired properties. CAGR based on midpoint of outlook range. Vertical Production 15% 45% 85% 55% (1) |

|
|
17 Large, Concentrated Acreage Blocks Provide Operating Advantages Large, Concentrated Acreage Blocks Map of Focus Area RSP leasehold ideally situated for horizontal development North to South blocked-up position, which lays out ideally for horizontal drilling, given desired frac planes Ability to drill long horizontal wells without having to rely on participation by industry players Ability to drive down costs: Sharing infrastructure and other critical drilling resources (water, disposal) across leasehold Rig efficiencies of staying in one location to execute pad drilling on multi-zone horizontal development 5 MI |

|
|
18 Wolfcamp B Horizontal Results Remain Strong RSP Activity Wolfcamp A/B Type Curve Wolfcamp A/B Type Curve and Operated Well Data (Normalized to 7,000’ Lateral Length) Boe/d 24 producing Wolfcamp B wells (8 operated) 11 waiting on completion (10 non-op) and 3 drilling (2 non-op) 1 operated Wolfcamp A well drilling Plan to test several Wolfcamp A wells during 2014 1 operated Wolfcamp D (Cline) well waiting on completion 617 MBoe 7,000' Lateral Well Cost ($MM) $7.5 EUR (MBoe) 617 % Oil / Gas / NGL 74%/13%/13% 30-Day IP (Boe/d) 636 Pre-Tax ROR ($95 Oil / $4 Gas) 45-55% |

|
|
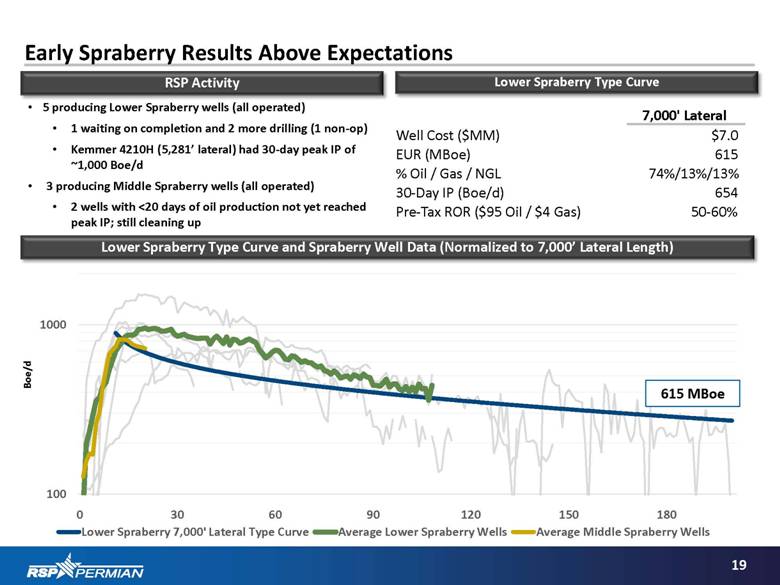
19 Early Spraberry Results Above Expectations RSP Activity Lower Spraberry Type Curve Lower Spraberry Type Curve and Spraberry Well Data (Normalized to 7,000’ Lateral Length) Boe/d 5 producing Lower Spraberry wells (all operated) 1 waiting on completion and 2 more drilling (1 non-op) Kemmer 4210H (5,281’ lateral) had 30-day peak IP of ~1,000 Boe/d 3 producing Middle Spraberry wells (all operated) 2 wells with <20 days of oil production not yet reached peak IP; still cleaning up 615 MBoe 7,000' Lateral Well Cost ($MM) $7.0 EUR (MBoe) 615 % Oil / Gas / NGL 74%/13%/13% 30-Day IP (Boe/d) 654 Pre-Tax ROR ($95 Oil / $4 Gas) 50-60% |
|
|
20 Spraberry Horizontal Potential Provides Significant Upside Leader in the Spraberry Substantial Horizontal Spraberry Inventory - Net Locations First operator to drill horizontal Lower Spraberry and horizontal Middle Spraberry Early results point to economics as strong as Wolfcamp B Lower D&C costs Lower IP rates offset by shallower declines Approximately 2/3 of RSP’s capex budget directed at horizontal Spraberry development (Middle Spraberry, Lower Spraberry) Comparable Average Cumulative Production (Normalized to 7,000’ Lateral Length) Boe Reflects Lower Spraberry wells & Operated Wolfcamp B wells with at least 90 days of production history D&C: $7.0mm Long Lateral / $6.0mm Short Lateral D&C: $7.5mm Long Lateral / $6.3mm Short Lateral |

|
|
21 Consistent Pay Intervals Across RSP’s Contiguous Acreage Position West to East Geologic Analog Midland to Dawson Co. Stratigraphic Cross Section Cross Section All target intervals are present across RSP’s acreage Similar log characteristics with consistent target zone thickness Similar geologic characteristics / thermal maturity A A’ 7,500’ 8,500’ 9,000’ 9,500’ 10,000’ 10,500’ 11,000’ 8,000’ DATUM: TOP WOLFCAMP A |

|
|
22 Map of Spraberry Activity ___________________________ Source: Texas Railroad Commission and investor presentations. 3-stream data. 30-day IP rates noted where available. Horizontal Spraberry Activity – Strong Early Results Pioneer “University 7-43 #16H” (Lower Spraberry) 24-hr IP: 1,660 Boe/d 7,502’ lateral length Reliance “Ratcliff A 2802 H” (Lower Spraberry) 30-day IP: 552 Boe/d 6,928’ lateral length “Ratcliff A 2904 H” (Lower Spraberry) Drilling RSP Permian “Cross Bar Ranch 2017MS” (Middle Spraberry) Drilling 7,039’ lateral length planned “Johnson Ranch 912MS” (Middle Spraberry) On Flowback – F 803 Boe/d on day 20 7,848’ lateral length Diamondback “ST-NW-25-1LS” (Lower Spraberry) Drilling Pioneer “Flanagan 14 Lloyd A #21H” (Lower Spraberry) 24-hr IP: 1,010 Boe/d 7,212’ lateral length Pioneer “Scharbauer Ranch #501H” (Lower Spraberry) 24-hr IP: 691 Boe/d 7,502’ lateral length Pioneer “Mabee K #10H” (Lower Spraberry) 24-hr IP: 1,010 Boe/d 4,982’ lateral length Pioneer “Hutt C #21H” (Lower Spraberry) 24-hr IP: 537 Boe/d 6,662’ lateral length RSP Permian “Headlee 3505LS” (Lower Spraberry) Completing 5,126’ lateral length “Headlee 3911H” (Lower Spraberry) 30-day IP: 782 Boe/d (~88% oil) Cum: 24,733 Boe/53 days 7,270’ lateral length “Parks Bell 3304H” (Lower Spraberry) 30-day IP: 562 Boe/d (~90% oil) Cum: 76,536 Boe/346 days 4,888’ lateral length “Parks Bell 3909H” (Lower Spraberry) 30-day IP: 683 Boe/d (~93% oil Cum: 50,783 Boe/103 days) 7,277’ lateral length “Sarah Ann 3814MS” (Middle Spraberry) 30-day IP: 486 Boe/d (~83% oil) Cum: 34,287 Boe/148 days 5,244’ lateral length “Kemmer 4210LS” (Lower Spraberry) 30-day IP: 979 Boe/d (~88% oil) Cum: 59,571/86 days 5,247’ lateral length “Fendley 404MS” (Middle Spraberry) On Flowback – F 491 Boe/d on day 10 4,158’ lateral length “Fendley 404LS” (Lower Spraberry) On Flowback – F 594 Boe/d on day 14 4,462’ lateral length RSP Permian “Keystone 1003LS” (Lower Spraberry) Completing 7,663’ lateral length |

|
|
23 Map of Midland Basin Activity ___________________________ Source: Texas Railroad Commission and investor presentations. 3-stream data. 30-day IP rates noted where available. Midland Basin Horizontal Wells – Industry Activity Horizontal Target Lower Spraberry Middle Spraberry Wolfcamp A/B/C Wolfcamp D (Cline) Mississippian Clearfork Midland Basin Scurry Mitchell Sterling Glasscock Midland Ector Martin Howard Borden Dawson Gaines Andrews Crane Upton Reagan Irion Tom Green Coke Nolan Fisher Schleicher Crockett Pecos Lynn Garza Kent Pioneer “Mabee K #1H” (Wolfcamp B) 24-hr IP: 1,572 Boe/d 30-day IP: 1,040 Boe/d (76% oil) 6,671’ lateral length Pioneer “University 7-43 10H” (Wolfcamp D / Cline) 24-hr IP: 3,605 Boe/d (74% oil) 7,382’ lateral length Diamondback (FANG) Core of FANG’s horizontal activity “ST NW 4301H” (Wolfcamp B) 24-hr IP: 1,193 Boe/d 30-day IP: 968 Boe/d (85% oil) 7,141’ lateral length “ST NW 2501H” (Wolfcamp B) 24-hr IP: 1,108 Boe/d 30-day IP: 683 Boe/d (90% oil) 4,451’ lateral length Pioneer “Scharbauer #201H” (Wolfcamp D / Cline) 24-hr IP: 1,509 Boe/d 30-day IP: 662 Boe/d (60% oil) 7,862’ lateral length Pioneer “E.T. O’Daniel #1H” (Wolfcamp B) 24-hr IP: 2,801 Boe/d (75% oil) 9,229’ lateral length “E.T. O’Daniel #2H” (Wolfcamp D / Cline) 24-hr IP: 3,156 Boe/d (69% oil) 9,112’ lateral length Element “SFH Unit 23 #1H” (Wolfcamp A) 24-hr IP: 1,086 Boe/d 30-day IP: 701 Boe/d 7,268’ lateral length RSP Permian “Cross Bar Ranch 2017H” (Wolfcamp B) 30-day IP: 607 Boe/d (87% oil) Cum: 73,399 Boe/198 days 6,915 lateral length “Cross Bar Ranch 1811H” (Wolfcamp B) 30-day IP: 650 Boe/d (~84% oil) Cum: 96,032 Boe/248 days 6,967’ lateral length “Katie 1109H” (Wolfcamp B) 30-day IP: 665 Boe/d (91% oil) Cum: 45,029 Boe/174 days 5,054’ lateral length “Kemmer 4209H” (Wolfcamp B) 30-day IP: 755 Boe/d (~85% oil) Cum: 104,126 Boe/543 days 3,864’ lateral length “Kemmer 4210H” (Wolfcamp B) 30-day IP: 742 Boe/d (~85% oil) 5,281 lateral length “Headlee 3910H” (Wolfcamp B) 30-day IP: 727 Boe/d (~88% oil) Cum: 45,935 Boe/77 days 6,781’ lateral length “Headlee 3911H” (Wolfcamp B) 30-day IP:782 Boe/d (~ 88% oil) Cum 24,733 Boe/53 days 7,270 lateral length “Sarah Ann 3812H” (Wolfcamp B) 30-day IP: 745 Boe/d (88% oil) Cum: 104,735 Boe/383 days 4,553’ lateral length RSP’s successful Wolfcamp results are complemented by nearby operators’ announcements |

|
|
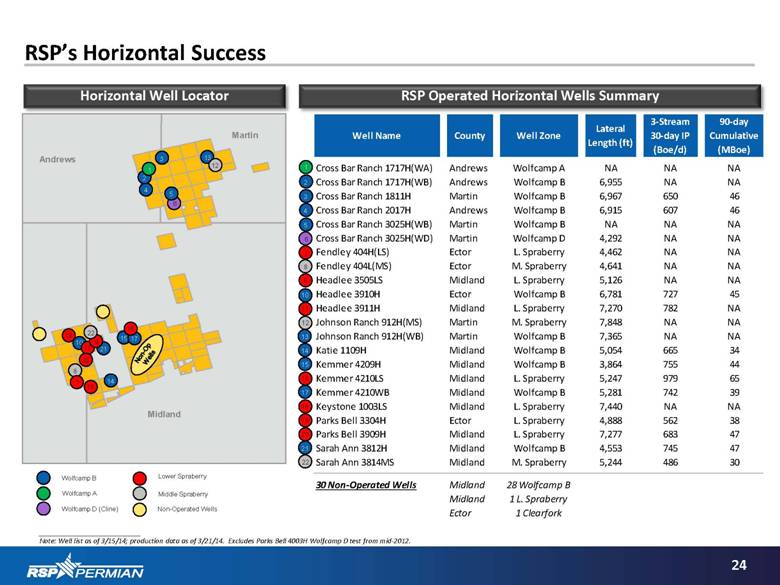
24 RSP’s Horizontal Success RSP Operated Horizontal Wells Summary Horizontal Well Locator 6 15 3 4 Andrews Martin Midland 3 Wolfcamp B Wolfcamp D (Cline) Wolfcamp A Lower Spraberry Middle Spraberry 9 13 13 ___________________________ Note: Well list as of 3/15/14; production data as of 3/21/14. Excludes Parks Bell 4003H Wolfcamp D test from mid-2012. 12 12 4 10 10 11 11 15 17 17 16 16 14 14 19 19 20 20 21 21 22 18 18 9 22 8 8 7 7 6 5 5 2 2 1 1 Non-Op Wells Non-Operated Wells Well Name County Well Zone Lateral Length (ft) 3-Stream 30-day IP (Boe/d) 90-day Cumulative (MBoe) Cross Bar Ranch 1717H(WA) Andrews Wolfcamp A NA NA NA Cross Bar Ranch 1717H(WB) Andrews Wolfcamp B 6,955 NA NA Cross Bar Ranch 1811H Martin Wolfcamp B 6,967 650 46 Cross Bar Ranch 2017H Andrews Wolfcamp B 6,915 607 46 Cross Bar Ranch 3025H(WB) Martin Wolfcamp B NA NA NA Cross Bar Ranch 3025H(WD) Martin Wolfcamp D 4,292 NA NA Fendley 404H(LS) Ector L. Spraberry 4,462 NA NA Fendley 404L(MS) Ector M. Spraberry 4,641 NA NA Headlee 3505LS Midland L. Spraberry 5,126 NA NA Headlee 3910H Ector Wolfcamp B 6,781 727 45 Headlee 3911H Midland L. Spraberry 7,270 782 NA Johnson Ranch 912H(MS) Martin M. Spraberry 7,848 NA NA Johnson Ranch 912H(WB) Martin Wolfcamp B 7,365 NA NA Katie 1109H Midland Wolfcamp B 5,054 665 34 Kemmer 4209H Midland Wolfcamp B 3,864 755 44 Kemmer 4210LS Midland L. Spraberry 5,247 979 65 Kemmer 4210WB Midland Wolfcamp B 5,281 742 39 Keystone 1003LS Midland L. Spraberry 7,440 NA NA Parks Bell 3304H Ector L. Spraberry 4,888 562 38 Parks Bell 3909H Midland L. Spraberry 7,277 683 47 Sarah Ann 3812H Midland Wolfcamp B 4,553 745 47 Sarah Ann 3814MS Midland M. Spraberry 5,244 486 30 30 Non-Operated Wells Midland 28 Wolfcamp B Midland 1 L. Spraberry Ector 1 Clearfork |
|
|
25 RSP’s Key Horizontal Development Pilot Projects For 2014 2014 Planned Horizontal Wells Commentary Johnson Ranch 1018 & 1019 – 2-well stacked offsetting pads for Wolfcamp B – Wolfcamp A spacing pattern test. Project on production by end of Q4 2014 Cross Bar Ranch 2017 - 4 well stacked pad – Wolfcamp B (currently producing), Wolfcamp A (offset 440’ from Wolfcamp B), Lower Spraberry & Middle Spraberry. Micro-seismic will be acquired to study interaction during completion between the 4 zones. Project on production in Q3 2014 Cross Bar Ranch 3025 - 4 well stacked pad – Wolfcamp D (waiting on frac), Wolfcamp B (drilling), Lower Spraberry & Middle Spraberry. Project on production with all 4 wells in Q4 2014 Headlee 3505 - 2 well stacked pad – Lower Spraberry (drilling) and Wolfcamp B. Project on production end of Q2 2014 Kemmer 4210 - 2 well stacked pad – Lower Spraberry and Wolfcamp B. Both wells reached peak rates in Q1 2014 Fendley 404 - 2 well stacked pad – Lower Spraberry and Middle Spraberry. Both wells just starting flowback. Expect peak rates in Q2 2014 Spanish Trail 217 - 2 well stacked pad – Wolfcamp B and Lower Spraberry. Project on production early Q3 2014 Spanish Trail 4817 - 3 well stacked pad – Wolfcamp B, Lower Spraberry and Middle Spraberry. Project on production late Q3 2014 1 3 2 4 5 6 7 8 |

|
|
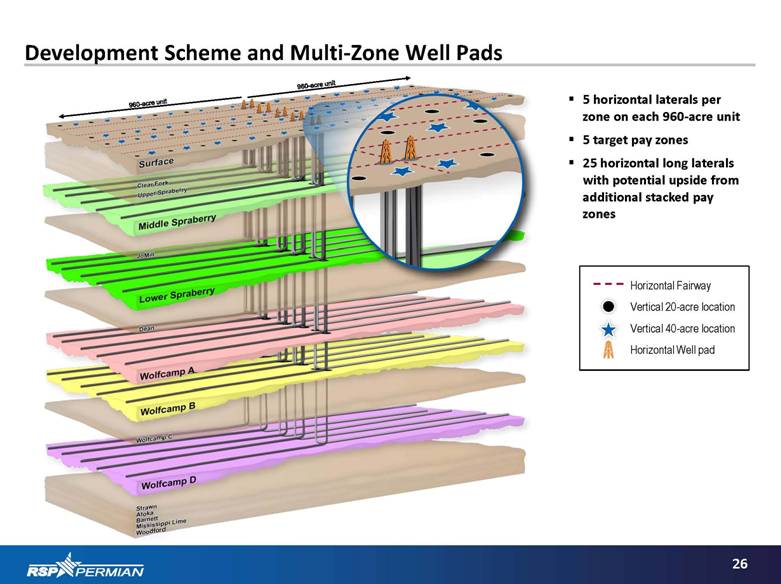
26 Development Scheme and Multi-Zone Well Pads Horizontal Fairway Vertical 20-acre location Vertical 40-acre location Horizontal Well pad 5 horizontal laterals per zone on each 960-acre unit 5 target pay zones 25 horizontal long laterals with potential upside from additional stacked pay zones |
|
|
27 Horizontal Well Costs Coming Down Capital costs decreasing due to experience, efficiencies, completion / well design optimization, and pad development Operated Horizontal Actual Drilling & Completion Costs Per Lateral Foot (by Spud Date) Short Laterals ___________________________ Excludes $216 per lateral foot of cost due to sidetrack. Long Laterals Cost per Lateral Foot Costs trending below budget for both drilling and completion in recent wells (1) |

|
|
28 Low-Cost Operator with Strong Margins Pre-G&A Cash Margin (Twelve Months Ended 12/31/2013) Commodity Mix (Proved Reserves) ___________________________ Source: Company filings. Permian Basin Peers include AREX, ATHL, CXO, FANG, LPI, PXD. As of 12/31/2013. NGL percentage not disclosed. (2) $ / boe (2) (1) Peer 1 Peer 3 Peer 5 Peer 6 Peer 2 Peer 4 |

|
|
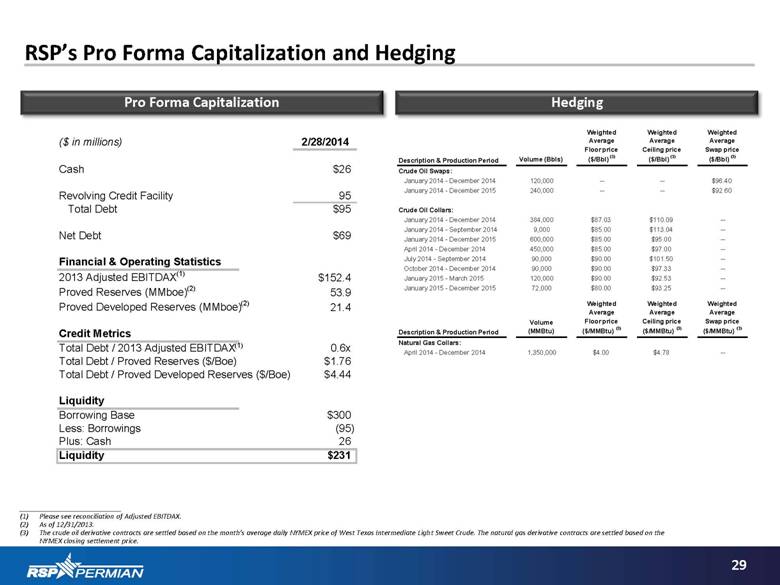
29 RSP’s Pro Forma Capitalization and Hedging ___________________________ Please see reconciliation of Adjusted EBITDAX. As of 12/31/2013. The crude oil derivative contracts are settled based on the month’s average daily NYMEX price of West Texas Intermediate Light Sweet Crude. The natural gas derivative contracts are settled based on the NYMEX closing settlement price. Pro Forma Capitalization Hedging Description & Production Period Volume (Bbls) Weighted Average Floor price ($/Bbl) (3) Weighted Average Ceiling price ($/Bbl) (3) Weighted Average Swap price ($/Bbl) (3) Crude Oil Swaps: January 2014 - December 2014 120,000 -- -- $96.40 January 2014 - December 2015 240,000 -- -- $92.60 Crude Oil Collars: January 2014 - December 2014 384,000 $87.03 $110.09 -- January 2014 - September 2014 9,000 $85.00 $113.04 -- January 2014 - December 2015 600,000 $85.00 $95.00 -- April 2014 - December 2014 450,000 $85.00 $97.00 -- July 2014 - September 2014 90,000 $90.00 $101.50 -- October 2014 - December 2014 90,000 $90.00 $97.33 -- January 2015 - March 2015 120,000 $90.00 $92.53 -- January 2015 - December 2015 72,000 $80.00 $93.25 -- Description & Production Period Volume (MMBtu) Weighted Average Floor price ($/MMBtu) (3) Weighted Average Ceiling price ($/MMBtu) (3) Weighted Average Swap price ($/MMBtu) (3) Natural Gas Collars: April 2014 - December 2014 1,350,000 $4.00 $4.78 -- (1) ($ in millions) 2/28/2014 Cash $26 Revolving Credit Facility 95 Total Debt $95 Net Debt $69 Financial & Operating Statistics 2013 Adjusted EBITDAX (1) $152.4 Proved Reserves (MMboe) (2) 53.9 Proved Developed Reserves (MMboe) (2) 21.4 Credit Metrics Total Debt / 2013 Adjusted EBITDAX 0.6x Total Debt / Proved Reserves ($/Boe) $1.76 Total Debt / Proved Developed Reserves ($/Boe) $4.44 Liquidity Borrowing Base $300 Less: Borrowings (95) Plus: Cash 26 Liquidity $231 |
|
|
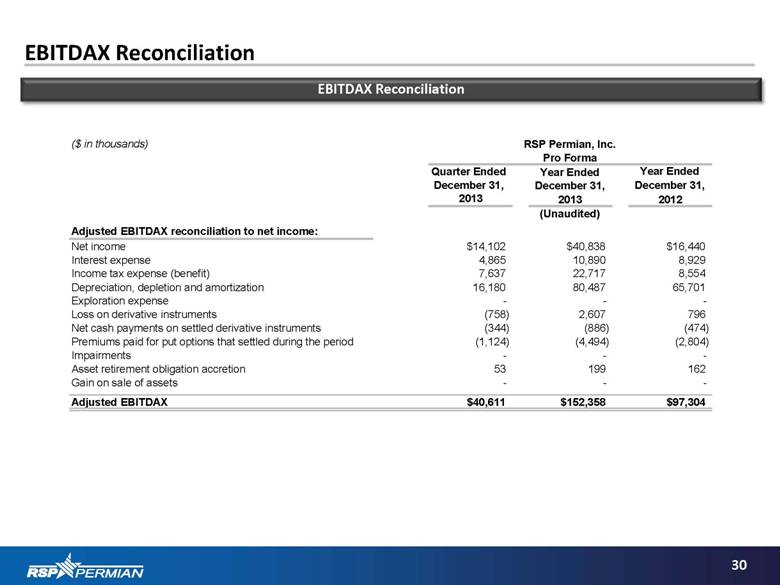
30 EBITDAX Reconciliation EBITDAX Reconciliation ($ in thousands) Quarter Ended Year Ended December 31, December 31, 2013 2013 Adjusted EBITDAX reconciliation to net income: Net income $14,102 $40,838 $16,440 Interest expense 4,865 10,890 8,929 Income tax expense (benefit) 7,637 22,717 8,554 Depreciation, depletion and amortization 16,180 80,487 65,701 Exploration expense - - - Loss on derivative instruments (758) 2,607 796 Net cash payments on settled derivative instruments (344) (886) (474) Premiums paid for put options that settled during the period (1,124) (4,494) (2,804) Impairments - - - Asset retirement obligation accretion 53 199 162 Gain on sale of assets - - - Adjusted EBITDAX $40,611 $152,358 $97,304 Year Ended December 31, 2012 RSP Permian, Inc. Pro Forma (Unaudited) |
|
|
RSP’s executive team has decades of experience in identifying acquisition targets and evaluating resource potential Spanish Trail, East Cowden, Verde and Dude acquisitions are the most recent examples Strategically pursue acquisition opportunities with oil-weighted potential 31 Identified Opportunities for Future Upside Pad drilling = efficiency and lower costs Several “stacked” 2 well pads currently producing; now moving to 4 “stacked” well pads on certain leases RSP continuously evaluates and tests new technology Currently utilizing cutting edge drilling techniques 3D seismic further delineates RSP’s stacked pay zones Well cost efficiencies realized through RSP’s operatorship of 95% of its net acreage Continuously improve drilling techniques, completion methodologies and reservoir evaluation processes Strategic Acquisitions New Technology Multi-Zone Pad Drilling Well Cost Efficiencies Increased Economics/ Locations RSP’s well costs are decreasing and IP rates outperforming type curves, leading to increasing economics RSP evaluating increasing lateral density and drilling more laterals per section, increasing locations |

|
|
32 Additional Disclosures Supplemental Non-GAAP Financial Measures Adjusted EBITDAX is a non-GAAP financial measure that is disclosed by the Company because of its wide acceptance by the investment community as a financial indicator of a company’s ability to internally fund exploration and development activities. Management also believes Adjusted EBITDAX, which excludes certain items included in net income that can vary substantially from company to company within the Company’s industry depending upon accounting methods and capital structures, allows the Company to more effectively evaluate its operating performance and compare the results of the Company’s operations from period to period and against the Company’s peers. Our computations of Adjusted EBITDAX may not be comparable to other similarly titled measures of other companies. Adjusted EBITDAX should not be considered as an alternative to, or more meaningful than, net income as determined in accordance with GAAP or as an indicator of our operating performance or liquidity. Certain Reserve Information Cautionary Note to U.S. Investors: The SEC prohibits oil and gas companies, in their filings with the SEC, from disclosing estimates of oil or gas resources other than “reserves,” as that term is defined by the SEC. This presentation discloses estimates of quantities of oil and gas using certain terms, such as “resource potential,” “net recoverable resource potential,” “resource base,” “estimated ultimate recovery,” “EUR” or other descriptions of volumes of reserves, which terms include quantities of oil and gas that may not meet the SEC’s definitions of proved, probable and possible reserves, and which the SEC’s guidelines strictly prohibit the Company from including in filings with the SEC. These estimates are by their nature more speculative than estimates of proved reserves and accordingly are subject to substantially greater risk of being recovered by the Company. U.S. investors are urged to consider closely the disclosures in the Company’s periodic filings with the SEC. Such filings are available from the Company at 3141 Hood Street, Suite 500, Dallas, Texas 75219, Attention: Investor Relations, and the Company’s website at www.rsppermian.com. These filings also can be obtained from the SEC by calling 1-800-SEC-0330. |
