Attached files
| file | filename |
|---|---|
| EX-5.1 - EXHIBIT 5.1 - SQUARE 1 FINANCIAL INC | d668839dex51.htm |
| EX-23.1 - EXHIBIT 23.1 - SQUARE 1 FINANCIAL INC | d668839dex231.htm |
Table of Contents
As filed with the Securities and Exchange Commission on March 25, 2014
Registration No. 333-193197
UNITED STATES
SECURITIES AND EXCHANGE COMMISSION
Washington, DC 20549
PRE-EFFECTIVE
AMENDMENT NO. 4
TO
FORM S-1
REGISTRATION STATEMENT
UNDER
THE SECURITIES ACT OF 1933
SQUARE 1 FINANCIAL, INC.
(Exact name of registrant as specified in its charter)
|
Delaware |
6022 |
20-187698 | ||
| State or other jurisdiction of incorporation or organization |
(Primary Standard Industrial Classification Code Number) |
(IRS Employer Identification Number) |
406 Blackwell Street, Suite 240
Durham, North Carolina 27701
(866) 355-0468
(Address, including zip code, and telephone number, including area code, of registrant’s principal executive offices)
Douglas H. Bowers
President and Chief Executive Officer
Square 1 Financial, Inc.
406 Blackwell Street, Suite 240
Durham, North Carolina 27701
(866) 355-0468
(Name, address, including zip code, and telephone number, including area code, of agent for service)
| Copies to: | ||
| Christina M. Gattuso, Esq. Joseph J. Bradley, Esq. |
Philip R. Bevan, Esq. Hugh T. Wilkinson, Esq. | |
| Kilpatrick Townsend & Stockton LLP | Silver, Freedman, Taff & Tiernan LLP | |
| 607 14th Street, NW, Suite 900 | 3299 K Street, NW, Suite 100 | |
| Washington, DC 20005 | Washington, DC 20007 | |
| (202) 508-5800 | (202) 295-4500 | |
Approximate date of commencement of proposed sale to the public: As soon as practicable after the effective date of this Registration Statement.
If any of the securities being registered on this Form are to be offered on a delayed or continuous basis pursuant to Rule 415 under the Securities Act, check the following box: ¨
If this Form is filed to register additional securities for an offering pursuant to Rule 462(b) under the Securities Act, check the following box and list the Securities Act registration statement number of the earlier effective registration statement for the same offering. ¨
If this Form is a post-effective amendment filed pursuant to Rule 462(c) under the Securities Act, check the following box and list the Securities Act registration statement number of the earlier effective registration statement for the same offering. ¨
If this Form is a post-effective amendment filed pursuant to Rule 462(d) under the Securities Act, check the following box and list the Securities Act registration statement number of the earlier effective registration statement for the same offering. ¨
Indicate by check mark whether the registrant is a large accelerated filer, an accelerated filer, a non-accelerated filer, or a smaller reporting company. See the definitions of “large accelerated filer,” “accelerated filer” and “smaller reporting company” in Rule 12b-2 of the Exchange Act. (Check one)
| Large accelerated filer | ¨ | Accelerated filer | ¨ | |||
| Non-accelerated filer | x (Do not check if a smaller reporting company) | Smaller reporting company | ¨ |
Calculation of Registration Fee
|
| ||||||
| Title of each class of securities to be registered |
Amount to be registered(1) |
Proposed maximum Aggregate offering price(2) |
Amount of registration fee | |||
| Class A Common Stock, $0.01 par value |
6,763,293 | $114,975,981 | $14,809.00(3) | |||
|
| ||||||
|
| ||||||
| (1) | Includes 882,167 shares of common stock that may be purchased by the underwriter to cover over-allotments, if any. |
| (2) | Estimated solely for the purposes of calculating the registration fee in accordance with Rule 457(o) under the Securities Act of 1933, as amended. This amount represents the proposed maximum aggregate offering price of the securities registered hereunder to be sold by the Registrant and the selling shareholders specified herein. |
| (3) | Previously paid. |
The Registrant hereby amends this Registration Statement on such date or dates as may be necessary to delay its effective date until the Registrant shall file a further amendment which specifically states that this Registration Statement shall thereafter become effective in accordance with Section 8(a) of the Securities Act of 1933 or until the Registration Statement shall become effective on such date as the Commission, acting pursuant to Section 8(a), may determine.
Table of Contents
The information in this preliminary prospectus is not complete and may be changed. We may not sell these securities until the registration statement filed with the Securities and Exchange Commission is effective. This preliminary prospectus is not an offer to sell these securities and it is not soliciting an offer to buy these securities in any jurisdiction where the offer or sale is not permitted.
SUBJECT TO COMPLETION, DATED MARCH 14, 2014
Preliminary
PROSPECTUS
5,881,126 Shares
|
|

|

Common Stock
This prospectus relates to the initial public offering of Square 1 Financial’s Class A common stock. We are offering 3,125,000 shares of our Class A common stock. The selling shareholders identified in this prospectus are offering 2,306,126 shares of our Class A common stock and 450,000 shares of our Class B common stock, which will convert into 450,000 shares of Class A common stock upon sale in this offering. We will not receive any proceeds from sales by the selling shareholders. References in this prospectus to “common stock” refer to Square 1 Financial’s Class A common stock unless we state otherwise or the context otherwise requires.
Prior to this offering, there has been no established public market for our common stock. We currently estimate the public offering price per share of our common stock will be between $15.00 and $17.00. We have applied to have our common stock listed on the Nasdaq Global Market under the symbol “SQBK.”
We are an “emerging growth company” under the federal securities laws and will be subject to reduced public company reporting requirements.
See “Risk Factors,” beginning on page 14, for a discussion of certain risks that you should consider before making an investment decision to purchase our common stock.
| Per Share | Total | |||||||
| Initial public offering price |
$ | $ | ||||||
| Underwriting discounts(1) |
||||||||
| Proceeds to us before expenses |
||||||||
| Proceeds to selling shareholders, before expenses |
||||||||
| (1) | See “Underwriting” for additional information regarding the underwriting discount and certain expenses payable to the underwriters by us. |
The underwriters have an option to purchase up to an additional 882,167 shares of our common stock at the initial public offering price less the underwriting discount, within 30 days from the date of this prospectus. Of the 882,167 shares subject to the underwriters’ option, 468,750 shares will be offered by us and 413,417 shares will be offered by the selling shareholders (67,500 of which are shares of our Class B common stock that convert into 67,500 shares of our Class A common stock upon sale in this offering).
Neither the Securities and Exchange Commission nor any other regulatory body has approved or disapproved of these securities or passed upon the adequacy or accuracy of this prospectus. Any representation to the contrary is a criminal offense.
The shares of our common stock that you purchase in this offering will not be savings accounts, deposits or other obligations of any of our bank or non-bank subsidiaries and are not insured or guaranteed by the Federal Deposit Insurance Corporation or any other governmental agency.
The underwriters expect to deliver the shares to purchasers on or about [·], 2014, subject to customary closing conditions.
|
SANDLER O’NEILL + PARTNERS, L.P. |

| |
Prospectus dated [·], 2014
Table of Contents
| Page | ||||
| i | ||||
| 1 | ||||
| 9 | ||||
| 11 | ||||
| 14 | ||||
| 25 | ||||
| 26 | ||||
| 26 | ||||
| 28 | ||||
| 29 | ||||
| 31 | ||||
| 31 | ||||
| Management’s Discussion and Analysis of Financial Condition and Results of Operations |
47 | |||
| 77 | ||||
| 83 | ||||
| 89 | ||||
| 92 | ||||
| 94 | ||||
| 95 | ||||
| 96 | ||||
| 99 | ||||
| Certain Material U.S. Federal Income Tax Consequences for Non-U.S. Holders of Common Stock |
109 | |||
| 111 | ||||
| 114 | ||||
| 114 | ||||
| 114 | ||||
| 115 | ||||
Table of Contents
You should rely only on the information contained in or incorporated by reference in this prospectus or in any free writing prospectus that we may authorize to be delivered and made available to you. We, the selling shareholders and the underwriters have not authorized anyone to provide you with additional or inconsistent information. If anyone provides you with different or inconsistent information, you should not rely on it. We and the selling shareholders are offering to sell, and seeking offers to buy, our common stock only in jurisdictions where those offers and sales are permitted.
This prospectus describes the specific details regarding this offering and the terms and conditions of the common stock being offered hereby and the risks of investing in our common stock. You should read this prospectus, any free writing prospectus and the additional information about us described in the section entitled “Where You Can Find Additional Information” before making your investment decision.
Neither we, nor any of our officers, directors, agents or representatives or any of the selling shareholders or underwriters, make any representation to you about the legality of an investment in our common stock. You should not interpret the contents of this prospectus or any free writing prospectus to be legal, business, investment or tax advice. You should consult with your own advisors for that type of advice and consult with them about the legal, tax, business, financial and other issues that you should consider before investing in our common stock.
IMPLICATIONS OF BEING AN EMERGING GROWTH COMPANY
As a company with less than $1.0 billion in revenues during our last fiscal year, we qualify as an “emerging growth company” under the Jumpstart Our Business Startups Act of 2012, or the JOBS Act. An emerging growth company may take advantage of reduced reporting requirements and is relieved of certain other significant requirements that are otherwise generally applicable to public companies. As an emerging growth company,
| • | we may present only two years of audited financial statements and only two years of related Management’s Discussion and Analysis of Financial Condition and Results of Operations in this initial public offering prospectus; |
| • | we are exempt from the requirement to obtain an attestation from our auditors on management’s assessment of our internal control over financial reporting under the Sarbanes-Oxley Act of 2002; |
| • | we are permitted to provide less extensive disclosure about our executive compensation arrangements; and |
| • | we are not required to present to our shareholders non-binding advisory votes on executive compensation or golden parachute arrangements. |
We have elected in this prospectus to take advantage of scaled disclosure relating only to executive compensation arrangements. We do not intend to take advantage of any other scaled disclosure or relief during the time that we qualify as an emerging growth company, although the JOBS Act would permit us to do so.
In addition to scaled disclosure and the other relief described above, the JOBS Act permits us an extended transition period for complying with new or revised accounting standards affecting public companies. However, we have elected not to take advantage of this extended transition period, which means that the financial statements included in this prospectus, as well as any financial statements that we file in the future, will be subject to all new or revised accounting standards generally applicable to public companies. Our election not to take advantage of the extended transition period is irrevocable.
i
Table of Contents
This summary highlights selected information contained in this prospectus and may not contain all of the information that you need to consider in making your investment decision. To understand this offering fully, you should carefully read this summary together with the more detailed information contained in this prospectus. You should carefully consider the section titled “Risk Factors” in this prospectus and our consolidated financial statements. Unless we state otherwise or the context otherwise requires, references in this prospectus to “Square 1,” “we,” “our,” and “us” refer to Square 1 Financial, Inc., a Delaware corporation, and its consolidated subsidiaries. References in this prospectus to “the Bank” means Square 1 Bank, the wholly-owned banking subsidiary of Square 1 Financial.
Overview
About us. We are a financial services company headquartered in the greater Research Triangle Park area of North Carolina and became the bank holding company for Square 1 Bank, a de novo North Carolina commercial bank, in August 2005 upon the commencement of Square 1 Bank’s operations. Through Square 1 Bank, which was formed by experienced venture bankers, commercial bankers and entrepreneurs, we focus our banking activities almost exclusively on venture capital firms and private equity firms (which we collectively refer to as “venture firms”) and the portfolio companies funded by such firms. Square 1 Bank provides a broad range of financial services nationwide to these investors and their portfolio companies, including, among others, term commercial loans, revolving lines of credit, asset-based loans, deposit products and fee-based banking services, including credit cards, foreign exchange, cash management and letters of credit. We refer to the market in which we operate as the “venture banking market” and our bankers as “venture bankers.” Among entrepreneurial companies, our primary focus is on venture-backed technology and life sciences companies, nationwide. Our strong relationships and extensive experience in the entrepreneurial community have allowed us to follow these and other companies across their stages of development, resulting in a diversified borrower and depositor customer base. We marked our eight year anniversary in August 2013 and, shortly thereafter, exceeded $1.0 billion in loans outstanding. As of December 31, 2013, we had total assets of $2.3 billion, total loans outstanding of $1.1 billion, total deposits of $2.1 billion, and shareholders’ equity of $189.1 million.
Venture firms are a key referral source for new entrepreneurial company relationships for Square 1 Bank. However, we have no arrangements or understandings with any venture firm relating to lending money to their portfolio companies. We target our business development and marketing strategy primarily on entrepreneurs, venture-backed entrepreneurial companies and venture firms. The terms of the credit facilities we provide to our clients vary by type of loan product, loan size and growth stage of the client and underlying collateral. We provide commercial term loans and lines of credit to venture-backed companies primarily in the technology and life sciences sectors, with loan terms of between 12 and 48 months. These loans are typically made to companies in all stages of a typical start-up company’s lifecycle. Loans originated by our asset-based lending group are typically structured as revolving lines of credit and advances are based on a formula tied to accounts receivable or other assets of the borrowers. Our asset-based loans are typically made to expansion and late stage companies. The primary source of repayment for asset-based loans is typically operating cash flow of the client. We also provide real estate secured, government-guaranteed loans through the Small Business Administration (“SBA”) and U.S. Department of Agriculture (“USDA”) programs, with maturities of 20 years or more, and construction loans, which convert into real estate SBA and USDA loans upon completion of construction, the terms of which are generally 12 months or less. In certain cases, we sell the guaranteed portion of SBA loans originated by us on the secondary SBA market, which serves to reduce the amount of our outstanding loan balances and results in a gain on sale as well as fee income for us.
We provide senior debt facilities to our borrowers that are secured by substantially all of the assets of the borrower client. In some instances, we also obtain the guarantee of the venture firm that provided venture capital to our borrower client or, in the case of a borrower that has not received venture capital funding, a guarantee of individuals associated with the borrower. For early stage companies, the primary source of repayment is typically cash collateral held in accounts with us. At December 31, 2013, with the exception of several credit card loans, all of the loans in our portfolio were secured loans.
In connection with the negotiation of credit facilities with our portfolio company borrowers, we often receive warrants to acquire stock of the borrower, primarily those that are privately-held, venture-backed companies in the life sciences and technology industries, but do not otherwise make equity investments in our portfolio company clients.
1
Table of Contents
Our market. According to the PricewaterhouseCoopers/National Venture Capital Association MoneyTree™ Report (“MoneyTree™ Report”), in 2013 venture capital investment in the U.S. totaled approximately $29.4 billion invested across 3,995 venture investment rounds. In the past four years, in a given quarter, based on the MoneyTree™ Report, there are generally as few as approximately 675 and as many as approximately 1,075 venture investment rounds completed, totaling between $5.0 billion to $8.0 billion across the U.S. While approximately one-third of these investments will be first-time financings for companies, overall these investments span the life stages of a company from angel/seed to late stage of the company, at which point the venture capital backer typically exits its investment through an acquisition or the sale of its investment in connection with an initial public offering of the company. This cycle of venture investment and company maturation results in these companies needing tailored venture banking products and services for many years. This market and the short-term nature of our loan facilities provide a steady flow of banking needs, since we work very closely with both the entrepreneurial company and its venture firm investors to provide debt financing and cash management solutions for each stage of the company’s growth.
Balance Sheet Strength
Banking the venture capital community provides a steady stream of funding, including low-cost deposits. In addition, venture-backed companies, as well as venture firms, typically have large fluctuations in cash flow. We have developed a mix of on- and off-balance sheet client funds and cash management products to accommodate their financial needs, while prudently managing our capital. Venture-backed companies tend to receive large cash infusions from each round of equity financing, which they must hold in a liquid vehicle that allows them to access funds for operating purposes as they implement their business models. As a result, many of our customers hold large cash balances in deposit accounts and off-balance sheet cash management products with us. At December 31, 2013, 65.6% of our client funds came from our borrower clients. Client funds consist of on-balance sheet deposits and off-balance sheet client investment funds. Venture firms also often have excess cash after a capital call or sale of a portfolio company, and require access to a short-term, liquid investment vehicle for these funds. These firms need liquidity for these funds as well as desire to earn a yield, so they often utilize a combination of demand deposits, money market accounts and certain other short-term, highly liquid products we offer. Our average cost of deposits for the year ended December 31, 2013 was 0.04% on an average balance of deposits of $1.9 billion. These low-cost deposits are our primary source of funding and provide us with a significant competitive advantage. They also provide us with more than sufficient funds to satisfy the lending needs of our clients. This funding leverage can be seen in our relatively low loan-to-deposit ratio, which was 49.1% for the year ended December 31, 2013 as well as off-balance sheet deposits, which were $557.9 million at December 31, 2013.
In addition to our funding advantages from our low-cost deposits, 92.7% of our loan portfolio is comprised of floating-rate loans, which provides us with automatic re-pricing of those loans as the interest rate environment changes.
A Specialized Market Demands Specialized Capabilities
Lending to a venture-backed company, particularly in the early and expansion stages of its corporate life cycle, presents challenges to a typical commercial bank lender. For example, early stage clients are in the process of developing their products and often lack revenue and operating cash flow. Expansion stage clients have begun to commercialize their products and generate revenue, but may not have achieved profitability. At December 31, 2013, 13.4% of our loans outstanding were represented by loans to early stage companies, 54.3% to expansion stage companies, and 13.2% to late stage companies. The remainder of our loan portfolio at that date was comprised of loans to venture firms, credit cards and SBA/USDA loans. Lending to companies without revenue or established products requires frequent monitoring as well as knowledgeable and experienced venture bankers who can assist our borrowers. Managing these risks, therefore, requires specialized expertise and controls that cannot be acquired with a simple addition to staff. Our controls include, among other things, the review of monthly financial statements and close monitoring of non-traditional measures such as investor reserves, the company’s cash burn rate, and its performance against non-financial business metrics and milestones. We perform frequent company updates with management and engage venture firms quarterly or more frequently on each portfolio company’s performance and its next anticipated equity event. Our team of experienced bankers and risk managers who are knowledgeable about the industry, and our organizational structure, are dedicated to evaluating and monitoring entrepreneurial companies and their venture capital backers. As a result, we believe the controls and procedures we have in place have enabled us to manage this risk effectively.
2
Table of Contents
We believe that entrepreneurial companies and venture firms welcome choice when selecting a banking partner. Despite the attractiveness of this market, the need for experienced bankers who specialize in lending to venture-backed companies has limited the number of financial institutions and specialty lending companies serving this market. From inception, we have believed there is a significant market opportunity for a high-quality and nimble alternative to Silicon Valley Bank, the only other commercial bank that focuses primarily on, and has the largest share of, the venture banking market on which we focus. Given the industry in which we operate, we believe this market is generally underserved and, therefore, it provides us with an opportunity to continue our strong growth and profitability. While there are other banks that will provide deposit and lending services to entrepreneurial companies, most of these banks do not specialize in lending and deposit/cash services tailored to the specific needs of these types of entrepreneurial companies. There are also specialty venture debt funds that provide loans to such companies, but do not accept deposits or provide other traditional fee-based banking services to such companies. We are still a young company, having only been in existence since August 2005, but believe that we have penetrated the venture banking market in all of the key entrepreneurial hubs in the United States. We have continued to add venture bankers and client managers in key markets, particularly during the last three years, adding over 15 bankers and client managers in Silicon Valley, Boston, New York and the West Coast. These key hires have allowed us to further penetrate markets in which we believe there is significant opportunity for us to grow, and they complement our consistently strong presence in other markets such as the mid-Atlantic, Southeast, Texas and Colorado. We, therefore, believe that our position as the only other “pure play” commercial bank serving the venture banking market provides substantial opportunity for us to continue our successful growth.
Our History and Growth
Square 1 Bank was founded in 2005 by a group of venture and commercial bankers, led by Richard Casey and Susan Casey. The founding team collectively had many decades of experience in banking entrepreneurial companies and venture firms. Since inception, Square 1 Bank has experienced significant success across the following areas:
Capital-Raising:
| • | August 2005—Chartered with an initial capitalization of $105.0 million raised through a private placement of common stock to the management team and Board of Directors of Square 1 Bank, members of the venture community and institutional investors. |
| • | September and December 2008—$7.4 million raised through a private placement of trust preferred securities to members of management, the Board of Directors and other existing shareholders and an additional $5.0 million raised through a private placement of preferred stock to a private equity fund. |
| • | May 2010—$48.5 million raised through a private placement of common stock primarily to institutional investors to support growth and bolster capital. |
| • | October—December 2012 – $23.2 million raised through a private placement of common stock to continue Square 1 Bank’s focus on organic growth and it strategic initiatives. |
3
Table of Contents
Net Income and Net Operating Income(1)
| • | As shown in the chart below, our net operating income has grown steadily, particularly in the last three years. We incurred a loss in 2010 resulting from the sale and impairment of non-agency mortgage-backed securities held in our investment portfolio. |
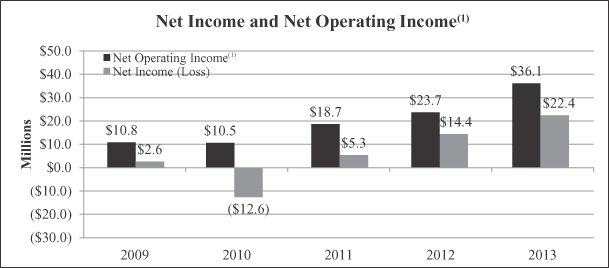
| (1) | Net Operating Income is a non-GAAP financial measure. See “Selected Historical Consolidated Financial Information—Non-GAAP Financial Measures.” |
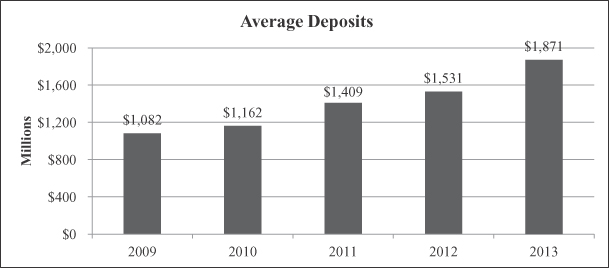
Deposit Growth
| • | We exceeded approximately $1.0 billion in deposits at Square 1 Bank in July 2008, (amounting to $1.1 billion as of July 31, 2008), solely through organic growth. Low-cost deposits have been, and we expect will continue to be, our primary source of funding. |
| • | 65.5% of our deposits were held in noninterest-bearing demand deposit accounts as of December 31, 2013. Our average cost of deposits for the year ended December 31, 2013 was 0.04%. This deposit mix may shift over time as interest rates move up or down. |
4
Table of Contents
Loan Growth
The chart below sets forth the average balance of loans outstanding for each period presented.
| • | At December 31, 2013 we had $1.1 billion in loans outstanding, with $977.3 million in outstanding unfunded loan commitments. |
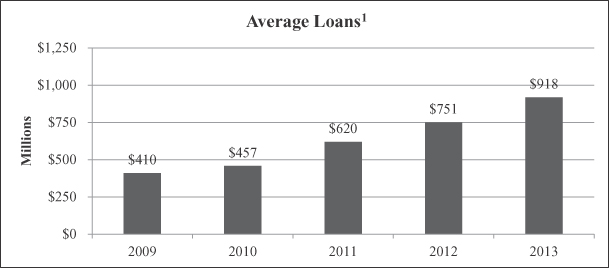
| (1) | Net of unearned income. |
Our Strengths
We believe that we are well-positioned to create value for our shareholders, particularly as a result of the following strengths:
Experienced and knowledgeable entrepreneurs serving entrepreneurs
Our banking team and culture. Square 1 Bank was founded by a group of venture bankers, with collectively, decades of experience in lending to entrepreneurial companies and venture firms. From the outset, we sought to operate in a manner different from larger banks, and recruited experienced bankers who are driven by an entrepreneur’s motivation to serve our market in a manner that is quick and responsive, flexible, accessible and provides “high touch,” personalized service. These founding goals, coupled with a very strong credit culture, have resulted today in a team of over 60 venture bankers and client managers with extensive relationships throughout the entrepreneurial and venture capital community and dedicated to the industry we serve.
Our executive management team. Douglas H. Bowers, President and Chief Executive Officer, has more than 30 years of commercial banking experience. Judith Erwin, our Executive Vice President, Venture Capital Services and Global Treasury Management, and Christopher Woolley, our Executive Vice President, Banking West, are both founders of Square 1 Bank. Sam Bhaumik is our Executive Vice President, Banking Silicon Valley. Each of these three executive officers has an average of more than 25 years of experience working with entrepreneurs and the venture capital community. Ms. Erwin and Mr. Woolley previously worked together in venture banking at the former Imperial Bank and its successor, Comerica Bank. Mr. Bhaumik brings decades of experience in our market having served in a senior position at a specialty finance company focused on venture-backed technology companies and prior to that in senior positions at Imperial Bank, its successor Comerica Bank, and Silicon Valley Bank. Our Chief Credit Officer, Diane Earle, has more than 27 years of experience in commercial lending and risk management. Ms. Earle spent several years at a venture debt fund, as well as at GE Commercial Finance where she served in senior leadership roles in the credit risk management area, focused on the technology and life sciences industries.
5
Table of Contents
Our Board of Directors. Our Board of Directors includes former venture bankers and commercial bankers, representatives of private equity funds and venture capital firms, and a former banking regulator. Several of our founders who serve on our Board of Directors previously worked together in various high-level executive positions at Imperial Bank, and collectively bring decades of experience in lending to the entrepreneurial and venture capital community and in senior management and/or Boards of Directors roles in this market.
Our relationships. A key component of our strategy is to leverage our strong relationships with venture and private equity firms that invest in, and support, our borrowing clients. From these relationships we gain deep insight into the operations and performance of our clients. These venture firms provide experienced institutional oversight over the portfolio companies to which we lend and are a significant driver in our decision to provide banking services to those companies. The ongoing support provided by these firms to the portfolio companies is also a significant factor in our underwriting decisions with respect to our borrowing clients.
Risk Management
Loan portfolio. We understand the risk profile of entrepreneurial companies and have many years of experience lending to the entrepreneurial and venture capital communities. Credit quality is very important to our business and is a key focus of Square 1 Bank. We have four risk managers and a team of portfolio analysts dedicated to evaluating and continually monitoring our borrowers’ financial and operational progress, which positions us to act quickly and proactively manage our exposure to our borrowers. Our bankers and client managers actively partner with our risk management personnel to manage credit issues which may arise in our loan portfolio. Our lending activities are diversified nationwide over a variety of industry sectors (with a focus on technology and life sciences) and with companies in different stages of development. We have developed an extensive credit risk management system which provides for, among other things, frequent contact with our borrowers and we are in the process of upgrading our credit process capabilities to create additional efficiencies for more scalable risk management practices as we grow.
As a result of this credit focus, we have maintained a track record of sound credit quality from inception. Our highest annual rate of net loan charge-offs to average loans over the past five years, 2009 through 2013, was 1.94%. At December 31, 2013, our ratio of nonperforming loans to total loans was 1.34%. Our 2013 net loan charge-offs were 0.95% of average outstanding loans.
Investment portfolio. As a result of the significant low-cost deposits generated by this business model, we have funds in excess of those we lend to our borrowing clients. As a result, we maintain a significant securities portfolio, which totaled $1.1 billion as of December 31, 2013. This securities portfolio provides us with additional sources of income and liquidity. Our investment portfolio is managed by a team of highly-experienced officers and employees. Prior to 2009, management of our investment portfolio was outsourced to a third-party investment firm. At that time, our investment securities portfolio was highly concentrated in non-agency mortgage-backed securities which at the time of purchase were investment grade securities. Following the financial crisis in 2008, a majority of these securities were downgraded to noninvestment grade securities. We incurred significant losses in 2008, 2010 and 2011 on our investment portfolio due primarily to our investment in these pre-2008 non-agency mortgage-backed securities. We terminated our outsourcing relationship in 2008 and began managing our securities investments internally at that time. The remaining non-agency mortgage-backed securities carry a fair value of $20.9 million, less than 2.0%, of the investment portfolio as of December 31, 2013. These remaining non-agency mortgage-backed securities have been written down $7.0 million to address any future losses. We consider the earnings stream on this remaining balance to be of greater value than the risk of additional losses.
We believe that our active management of this portfolio has helped minimize our losses and positioned us to use our large securities portfolio to meet the sometimes unpredictable liquidity needs of our clients and to optimize yields.
Strong brand and reputation in the entrepreneurial and venture capital community. We believe that we have developed a strong brand and market reputation within the entrepreneurial community and have strong relationships with more than 125 venture firms nationwide who are both clients and a source of referrals for entrepreneurial company clients. By capitalizing on the business and personal relationships of our senior management team in the entrepreneurial and venture communities, we believe that we are positioned to continue to grow our business and our client base.
6
Table of Contents
Our Operating Strategy
Our strategic focus is on continuing to build market share and strong revenues complemented by operational efficiencies. We expect to accomplish this by continuing to attract new venture firm and portfolio company relationships while continuing to strengthen existing relationships with entrepreneurs and venture firms.
We intend to pursue the following core strategies to achieve those goals:
Building our presence within the entrepreneurial and venture community in our existing and target markets by:
| • | leveraging the strong relationships and reputations of our experienced venture bankers to grow our market share in key entrepreneurial and venture markets nationwide; |
| • | growing our loan portfolio, including asset-based loans, and continuing to enhance our product offerings to expansion and late stage companies; |
| • | expanding our suite of deposit and investment products, which is important to support the growth of our venture firm and portfolio company clients; and |
| • | deploying the capital from this offering to support our lending and deposit growth. |
Maintaining excellent credit quality by:
| • | continuing to aggressively monitor the performance of our borrowers, which allows us to proactively manage credit exposure; and |
| • | upgrading our systems to more effectively and efficiently monitor asset quality as we grow. |
Expanding and growing our noninterest income and relationship profitability by:
| • | growing the assets under management of Square 1 Asset Management, a registered investment adviser, that was launched in April 2013 to provide a critical cash management tool for our clients and which provides us with income-generating off-balance sheet alternatives to manage the large and sometimes volatile fund flows typical of our clients; |
| • | growing our foreign exchange and letter of credit fee income; |
| • | growing our service charges and fees as we grow our lending and deposit relationships; and |
| • | continuing our practice of taking warrants for equity positions in the companies we serve. |
Growing our core deposits, and prudently and expertly managing strong deposit inflows by:
| • | continuing to grow deposits organically; |
| • | managing our investment portfolio in a conservative manner consistent with our liquidity needs and asset/liability management strategies including to optimize yields; and |
| • | continuing to develop alternative cash management solutions for our clients that allow us to move client funds on and off balance sheet. |
There are no assurances that we will be able to successfully implement our business strategy or that we will achieve our strategic goals or our projected growth.
Our Market Opportunity
The venture banking market in the U.S. includes companies in industries with high potential for innovation and growth, such as technology and life sciences. These entrepreneurial companies can be located anywhere, but venture activity tends to be concentrated in key markets which are hubs for academia and innovation. As a result, in addition to our home office in the greater Research Triangle Park area, we maintain offices in Silicon Valley, San Diego, Campbell, Orange County and Los Angeles, CA, Boston, Austin, the Washington, DC metropolitan area, Denver, New York City and Seattle. We also recently
7
Table of Contents
hired key personnel in Chicago and plan to open loan production offices in San Francisco and Chicago in 2014, as these markets continue to evolve as focal points for the development of venture capital-backed early through late stage companies.
Our market opportunity is driven in large part by the number and amount of venture capital investments because, as entrepreneurial companies receive venture capital investments, they require banking services beyond what they may have obtained when they were formed.
The peak year for venture capital investment in the U.S. was in 2000, a period in which approximately 8,041 companies received a total of nearly $105.2 billion in equity investment as reported in the MoneyTree™ Report. However, as reported in the MoneyTree™ Report, in a more typical year, an average of 3,774 companies receive venture capital investments for aggregate average annual equity investments of approximately $20.0 billion to $30.0 billion.
The following data from the MoneyTree™ Report shows venture capital investment by stage of emerging companies in 2013:
| Stage of Development |
Number of Deals | Investment (in 000’s) |
||||||
| Seed |
218 | $ | 942,953 | |||||
| Early Stage |
2,003 | 9,758,813 | ||||||
| Expansion |
984 | 9,838,458 | ||||||
| Later Stage |
790 | 8,824,734 | ||||||
|
|
|
|
|
|||||
| Total |
3,995 | $ | 29,364,958 | |||||
|
|
|
|
|
|||||
We believe that the market data demonstrates the robust opportunities for growth in our core market. Our deposit and loan portfolio includes entrepreneurial companies at all stages of their life cycles as well as the venture firms. These venture-backed companies need specialized banking services and we are well-positioned, as one of only two commercial banks almost exclusively focused on this market, to capitalize on these opportunities consistent with our past successes.
Corporate Information
Our principal executive office is located at 406 Blackwell Street, Suite 240, Durham, North Carolina 27701, and our telephone number is (866) 355-0468. Our website address is www.square1financial.com. The information contained on our website is not a part of, or incorporated by reference into, this prospectus.
8
Table of Contents
| Class A common stock offered by us |
3,125,000 shares |
| 3,593,750 shares if the underwriters’ option is exercised in full. |
| Class A common stock and Class B common stock offered by the selling shareholders |
2,306,126 shares of Class A and 450,000 shares of Class B(1) |
| 2,652,043 shares of Class A and 517,500 shares of Class B if the underwriters’ option is exercised in full. |
| Common shares outstanding after completion of the offering(2) |
27,200,336 shares |
| 27,669,086 shares of common stock if the underwriters’ option is exercised in full. |
| Common shares outstanding after completion of the offering assuming all outstanding convertible/exercisable securities are converted/exercised into Class A common shares |
29,602,096 shares |
| 30,070,846 shares if the underwriters’ option is exercised in full |
| Use of proceeds |
We estimate that the net proceeds to us from the sale of shares of common stock being offered by us in this offering will be $45.5 million (or $52.5 million if the underwriters exercise in full their purchase option), after deducting estimated underwriting discounts and offering expenses, based on an assumed initial offering price of $16.00 per share, which is the mid-point of the estimated public offering price range set forth on the cover page of this prospectus. We will not receive any proceeds from the sale of our common stock by the selling shareholders. We expect to downstream approximately 90% of the net proceeds of the offering to Square 1 Bank. |
| (1) | Purchasers in this offering will be deemed to have exercised their option to convert Class B shares to Class A shares as a condition to participating in the offering such that all purchasers will receive Class A shares. |
| (2) | References in this section to the number of shares of our common stock outstanding after this offering are based on 23,696,336 shares of our common stock (including Class A and Class B shares) issued and outstanding as of January 31, 2014. Unless otherwise noted, these references exclude: |
| • | 1,319,550 shares of common stock issuable upon the exercise of outstanding stock options at a weighted average exercise price of $6.11 per share (of which options to purchase 719,260 shares have vested); |
| • | 522,870 shares of common stock issuable upon the vesting of outstanding restricted stock awards; |
| • | 612,715 shares of common stock reserved for issuance in connection with restricted stock awards and stock options that remain available for issuance under our equity incentive plan; |
| • | 500,000 shares of our common stock reserved for issuance in connection with outstanding Series A preferred stock and 366,500 shares of our common stock reserved for issuance in connection with outstanding trust preferred securities, which are convertible at the option of the holder, and are expected to be converted, in large part, into shares of common stock following completion of the offering; |
| • | 66,000 shares of common stock issuable upon the exercise of warrants issued to the organizers of the Bank at an exercise price of $10.00 per share; and |
| • | 750,000 shares of common stock issuable upon the exercise of warrants issued to Patriot Financial Partners, L.P. and Patriot Financial Partners Parallel, L.P. at an exercise price of $5.15 per share in connection with a private placement of our common stock in 2010. |
9
Table of Contents
| We intend to use the net proceeds generated by this offering to support our long-term growth by enhancing our capital ratios in light of Basel III, and for general working capital and other corporate purposes. We intend, as a secondary purpose of the offering, to use the net proceeds to redeem, at the first quarterly redemption date following the offering, any Series A preferred stock and to retire any indebtedness relating to Square 1 Financial’s trust preferred securities that remain outstanding following the completion of this offering. Our trust preferred securities and Series A preferred stock are currently redeemable by the Company, at its option, on any quarterly dividend payment date. No premium is attached to such redemption. As our preferred stock and our trust preferred securities are currently convertible, at the option of the holder, into common stock at a conversion price of $10.00 per share, we expect that a significant portion of the $7.4 million in principal outstanding trust preferred securities and the $5.0 million in outstanding Series A preferred stock will be converted into common stock prior to the redemption date. There was no accrued interest payable with respect to our trust preferred securities at December 31, 2013. Although we may, from time to time in the ordinary course of business, evaluate potential acquisition and business line expansion opportunities that we believe are complementary to our business and provide attractive risk-adjusted returns, we do not have any immediate plans, arrangements or understandings relating to any material acquisition. |
| Selling shareholders will receive the proceeds from the sale of their shares in the offering, which are estimated to be, before expenses, approximately $44.1 million in the aggregate, or approximately $50.7 million in the aggregate if the underwriters exercise in full their purchase option based on the midpoint purchase price of $16.00 per share. |
| For additional information, see “Use of Proceeds.” |
| Dividend policy |
We do not expect to pay cash dividends on our common stock in the foreseeable future. Instead, we anticipate that all of our future earnings will be retained to support our operations and finance the growth and development of our business. Any future determination to pay dividends on our common stock will be made by our Board of Directors and will depend upon our results of operations, financial condition, capital requirements, regulatory and contractual restrictions, our business strategy and other factors that the Board deems relevant. For additional information, see “Dividend Policy.” |
| Rank |
Our common stock is subordinate to our Series A preferred stock and trust preferred securities, with respect to the payment of dividends and the distribution of assets upon liquidation. In addition, our common stock will be subordinate to any debt that we may issue in the future and may be subordinate to any new series of preferred stock that we may issue in the future. |
| Listing |
We have applied to have our common stock listed on the Nasdaq Global Market under the trading symbol “SQBK.” |
| Determination of offering price |
Prior to this offering, there has been no public market for our common stock. The initial public offering price will be negotiated between the representative of the underwriters, the selling shareholders and us. In determining the initial public offering price of our common stock, the representative will consider: |
| • | the history and prospects for the industry in which we compete; |
| • | our financial information; |
| • | our earnings prospects; |
| • | our book value; |
| • | the prevailing securities markets at the time of this offering; and |
| • | the recent market prices of and the demand for publicly traded stock of comparable companies. |
| Risk factors |
Investing in our common stock involves risks. See “Risk Factors,” beginning on page 14, for a discussion of certain factors that you should carefully consider before making an investment decision. |
10
Table of Contents
SELECTED HISTORICAL CONSOLIDATED FINANCIAL INFORMATION
The summary financial information presented below is derived in part from our consolidated financial statements. The following is only a summary and you should read it in conjunction with the consolidated financial statements and the related notes beginning on page F-1. The information at December 31, 2013 and 2012 and for the years ended December 31, 2013, 2012 and 2011 is derived in part from the audited consolidated financial statements that appear in this prospectus.
| At or For the Years Ended December 31, | ||||||||||||||||||||
| 2013 | 2012 | 2011 | 2010 | 2009 | ||||||||||||||||
| (Dollars in thousands) |
||||||||||||||||||||
| Financial Condition Data: |
||||||||||||||||||||
| Total assets |
$ | 2,326,427 | $ | 1,803,281 | $ | 1,648,287 | $ | 1,583,871 | $ | 1,095,836 | ||||||||||
| Cash and cash equivalents |
105,730 | 48,971 | 194,240 | 201,279 | 94,489 | |||||||||||||||
| Investment securities—available- for-sale |
924,229 | 776,160 | 679,553 | 820,048 | 460,833 | |||||||||||||||
| Investment securities—held-to- maturity |
154,255 | 67,022 | 28,817 | 16,964 | 19,390 | |||||||||||||||
|
Loans(1) |
1,082,536 | 863,081 | 710,904 | 490,636 | 456,551 | |||||||||||||||
| Off-balance sheet unfunded loan commitments |
977,262 | 741,232 | 714,185 | 576,632 | 433,582 | |||||||||||||||
| Deposits |
2,106,727 | 1,519,329 | 1,508,829 | 1,461,913 | 1,017,437 | |||||||||||||||
| Off-balance sheet client investment funds |
557,883 | 377,932 | 458,464 | 263,325 | 348,968 | |||||||||||||||
| Borrowings |
6,207 | 96,204 | 6,193 | 6,183 | 6,193 | |||||||||||||||
| Repurchase agreements |
12,737 | — | — | 928 | 1,256 | |||||||||||||||
| Total shareholders’ equity |
189,149 | 176,726 | 124,379 | 107,004 | 66,412 | |||||||||||||||
| Operating Data: |
||||||||||||||||||||
| Interest income |
$ | 77,662 | $ | 67,676 | $ | 60,827 | $ | 52,854 | $ | 46,992 | ||||||||||
| Interest expense |
1,328 | 1,142 | 1,502 | 1,880 | 2,982 | |||||||||||||||
| Net interest income |
76,334 | 66,534 | 59,325 | 50,974 | 44,009 | |||||||||||||||
| Provision for loan losses |
13,300 | 9,371 | 7,300 | 5,050 | 9,273 | |||||||||||||||
| Net interest income after provision for loan losses |
63,034 | 57,163 | 52,025 | 45,924 | 34,737 | |||||||||||||||
| Noninterest income (loss) |
25,308 | 15,560 | 6,857 | (22,724 | ) | 10,320 | ||||||||||||||
| Noninterest expense |
55,921 | 51,148 | 49,163 | 43,091 | 37,705 | |||||||||||||||
| Income before income tax expense (benefit) |
32,421 | 21,575 | 9,719 | (19,892 | ) | 7,350 | ||||||||||||||
| Income tax expense (benefit) |
10,038 | 7,203 | 4,372 | (7,271 | ) | 4,738 | ||||||||||||||
| Preferred stock dividends and discount accretion |
250 | 250 | 250 | 250 | 256 | |||||||||||||||
| Net income (loss) available to common shareholders |
22,133 | 14,122 | 5,097 | (12,871 | ) | 2,356 | ||||||||||||||
| (1) | Net of unearned income of $4.5 million, $4.0 million, $4.1 million, $2.1 million and $1.6 million at December 31, 2013, 2012, 2011, 2010 and 2009, respectively. Unearned loan fees, the discount on SBA loans and the unearned initial warrant value are included in unearned income. |
11
Table of Contents
| At or For the Years Ended December 31, | ||||||||||||||||||||
| 2013 | 2012 | 2011 | 2010 | 2009 | ||||||||||||||||
| (Dollars in thousands, except per share data) |
||||||||||||||||||||
| Performance Ratios: |
||||||||||||||||||||
| Return on average assets |
1.06 | % | 0.83 | % | 0.33 | % | (1.01 | )% | 0.20 | % | ||||||||||
| Return on average common equity |
12.44 | 10.11 | 4.59 | (14.00 | ) | 3.21 | ||||||||||||||
| Net interest margin(1) |
|
3.91 |
|
4.14 | 4.02 | 4.22 | 3.92 | |||||||||||||
| Efficiency ratio(2) |
53.10 | 60.74 | 65.43 | 73.46 | 65.28 | |||||||||||||||
| Average equity to average assets |
8.75 | 8.48 | 7.52 | 7.58 | 6.66 | |||||||||||||||
| Capital Ratios (consolidated): |
||||||||||||||||||||
| Tier 1 leverage capital |
8.34 | 9.53 | 8.69 | 8.88 | 8.03 | |||||||||||||||
| Tier 1 risk-based capital |
12.08 | 14.28 | 14.05 | 15.59 | 10.29 | |||||||||||||||
| Total risk-based capital |
13.24 | 15.42 | 15.25 | 16.72 | 11.36 | |||||||||||||||
| Total shareholders’ equity to assets |
8.13 | 9.80 | 7.55 | 6.76 | 6.06 | |||||||||||||||
| Tangible common equity to tangible assets(3) |
7.89 | 9.53 | 7.25 | 6.44 | 5.61 | |||||||||||||||
| Asset Quality Ratios: |
||||||||||||||||||||
| Allowance for loan losses as a percent of total loans |
1.70 | 1.60 | 1.64 | 1.87 | 2.05 | |||||||||||||||
| Allowance for loan losses as a percent of nonperforming loans |
|
127.05 |
|
95.25 | 164.69 | 166.47 | 139.04 | |||||||||||||
| Net charge-offs to average outstanding loans during the period |
0.95 | 0.95 | 0.79 | 1.14 | 1.94 | |||||||||||||||
| Nonperforming loans as a percent of total loans |
1.34 | 1.68 | 0.99 | 1.13 | 1.47 | |||||||||||||||
| Nonperforming assets as a percent of total assets |
0.63 | 0.81 | 0.50 | 0.55 | 0.65 | |||||||||||||||
| Per Share Data: |
||||||||||||||||||||
| Basic income (loss) per common share |
$ | 0.94 | $ | 0.67 | $ | 0.25 | $ | (0.78 | ) | $ | 0.22 | |||||||||
| Diluted income (loss) per common share |
$ | 0.93 | $ | 0.67 | $ | 0.25 | $ | (0.78 | ) | $ | 0.22 | |||||||||
| Book value per common share |
$ | 7.80 | $ | 7.31 | $ | 5.94 | $ | 5.08 | $ | 5.76 | ||||||||||
| Tangible book value per common share |
$ | 7.77 | $ | 7.31 | $ | 5.94 | $ | 5.08 | $ | 5.76 | ||||||||||
| Weighted average common shares outstanding—basic |
23,508,254 | 20,925,764 | 20,093,977 | 16,455,993 | 10,676,500 | |||||||||||||||
| Weighted average common shares outstanding—diluted |
23,859,448 | 21,136,770 | 20,200,227 | 16,514,246 | 10,676,500 | |||||||||||||||
| (1) | Represents net interest income as a percent of average interest-earning assets. |
| (2) | Represents noninterest expense divided by the sum of net interest income and other income, excluding gains or losses on the impairment and sale of securities. Efficiency ratio, as calculated, is a non-GAAP financial measure. See “Selected Historical Consolidated Financial Information—Non-GAAP Financial Measures.” |
| (3) | Tangible common equity to tangible assets is a non-GAAP financial measure. Tangible common equity is computed as total shareholders’ equity, excluding preferred stock, less intangible assets. Tangible assets are calculated as total assets less intangible assets. We believe that the most directly comparable GAAP financial measure is total shareholders’ equity to assets. See “Selected Historical Consolidated Financial Information—Non-GAAP Financial Measures.” |
12
Table of Contents
Non-GAAP Financial Measures
The information set forth above contains certain financial information determined by methods other than in accordance with U.S. generally accepted accounting principles (“GAAP”). These non-GAAP financial measures are “efficiency ratio,” “tangible common equity to tangible assets” and “net operating income.” Although we believe these non-GAAP financial measures provide a greater understanding of our business, these measures are not necessarily comparable to similar measures that may be presented by other companies.
The information provided below reconciles each non-GAAP measure to its most comparable GAAP measure.
| For the Years Ended December 31, | ||||||||||||||||||||
| 2013 | 2012 | 2011 | 2010 | 2009 | ||||||||||||||||
| (Dollars in thousands) |
||||||||||||||||||||
| Efficiency Ratio |
||||||||||||||||||||
| Noninterest expense |
$ | 55,921 | $ | 51,148 | $ | 49,163 | $ | 43,091 | $ | 37,705 | ||||||||||
|
|
|
|
|
|
|
|
|
|
|
|||||||||||
| Net interest taxable equivalent income |
79,404 | 67,950 | 59,325 | 50,974 | 44,009 | |||||||||||||||
| Noninterest taxable equivalent income (loss) |
25,886 | 15,900 | 6,858 | (22,724 | ) | 10,319 | ||||||||||||||
| Less loss on sale of securities and impairment |
(24 | ) | (358 | ) | (8,956 | ) | (30,410 | ) | (3,433 | ) | ||||||||||
|
|
|
|
|
|
|
|
|
|
|
|||||||||||
| Adjusted operating revenue |
$ | 105,314 | $ | 84,208 | $ | 75,139 | $ | 58,660 | $ | 57,761 | ||||||||||
|
|
|
|
|
|
|
|
|
|
|
|||||||||||
| Efficiency ratio |
53.10 | % | 60.74 | % | 65.43 | % | 73.46 | % | 65.28 | % | ||||||||||
| Tangible Common Equity/Tangible Assets |
||||||||||||||||||||
| Total equity |
$ | 189,149 | $ | 176,726 | $ | 124,379 | $ | 107,004 | $ | 66,412 | ||||||||||
| Less: preferred stock |
4,950 | 4,950 | 4,950 | 4,950 | 4,950 | |||||||||||||||
| Intangible assets(1) |
800 | — | — | — | — | |||||||||||||||
|
|
|
|
|
|
|
|
|
|
|
|||||||||||
| Tangible common equity |
$ | 183,399 | $ | 171,776 | $ | 119,429 | $ | 102,054 | $ | 61,462 | ||||||||||
|
|
|
|
|
|
|
|
|
|
|
|||||||||||
| Total assets |
$ | 2,326,427 | $ | 1,803,281 | $ | 1,648,287 | $ | 1,583,871 | $ | 1,095,836 | ||||||||||
| Less: intangible assets(1) |
800 | — | — | — | — | |||||||||||||||
|
|
|
|
|
|
|
|
|
|
|
|||||||||||
| Tangible assets |
2,325,627 | 1,803,281 | 1,648,287 | 1,583,871 | 1,095,836 | |||||||||||||||
|
|
|
|
|
|
|
|
|
|
|
|||||||||||
| Tangible common equity/tangible assets |
7.89 | % | 9.53 | % | 7.25 | % | 6.44 | % | 5.61 | % | ||||||||||
|
|
|
|
|
|
|
|
|
|
|
|||||||||||
| Net Operating Income |
||||||||||||||||||||
| GAAP income before taxes |
$ | 32,421 | $ | 21,575 | $ | 9,719 | $ | (19,892 | ) | $ | 7,350 | |||||||||
| Less loss on sale of securities |
(24 | ) | (358 | ) | (8,956 | ) | (30,410 | ) | (3,433 | ) | ||||||||||
| Add: tax equivalent adjustment and impairment |
3,647 | 1,755 | — | — | — | |||||||||||||||
|
|
|
|
|
|
|
|
|
|
|
|||||||||||
| Non-GAAP net operating income before taxes |
$ | 36,092 | $ | 23,688 | $ | 18,675 | $ | 10,518 | $ | 10,783 | ||||||||||
|
|
|
|
|
|
|
|
|
|
|
|||||||||||
| (1) | Does not include a loan servicing asset of $1.3 million at December 31, 2013. |
13
Table of Contents
An investment in our common stock involves various risks. Before making an investment decision, you should carefully read and consider the risk factors described below as well as the other information included in this prospectus. Any of these risks, if they are realized, could materially and adversely affect our business, financial condition, and results of operations. Additional risks and uncertainties not currently known to us or that we currently deem to be immaterial may also materially and adversely affect us. In any such case, you could lose all or a portion of your original investment.
Risks Relating to Our Business
We are dependent upon the services of key executives and we could be harmed by the loss of their services.
Our performance depends largely on the experience and client relationships of our management team and bankers. Most of these individuals have been involved in venture banking for much of their professional careers, primarily in providing lending or other financing services to emerging growth technology companies, life sciences companies and venture firms and have strong relationships with individuals and institutions in the markets we serve. The implementation of our business and growth strategies also depends upon our ability to continue to attract and retain additional qualified management and banking personnel. Our bankers may terminate their employment with us at any time, and we could have difficulty replacing such officers with persons who are experienced in the specialized aspects of our business or who have ties to the communities within our market areas. If we are unable to retain any of these key employees, our growth and results of operations could be adversely affected. See “Management.”
Because of the credit profile of our loan portfolio, our levels of nonperforming assets and charge-offs can be volatile. We may need to make material provisions for loan losses in any period, which could reduce net income and/or increase net losses in that period.
Our loan portfolio has a credit profile different from that of most other banking companies. The credit profile of our clients varies across our loan portfolio, based on the nature of the lending we do for different market segments. In our portfolios for early, expansion and late stage companies, many of our loans are made to companies with modest or negative cash flows and no established record of profitable operations. Repayment of these loans may be dependent upon receipt by borrowers of additional equity financing from venture firms or others, or in some cases, a successful sale to a third party, public offering or other form of liquidity event. Due to the overall weakening of the economic environment in 2008, venture capital financing activity, as well as mergers and acquisitions and initial public offerings – activities on which venture firms rely to “exit” investments to realize returns – slowed in a meaningful manner. While there has been some improvement in overall economic conditions since then, particularly during the past few years, if economic conditions worsen or do not continue to improve, such activities may slow down further, which may impact the financial health of our client companies. Venture firms may continue to provide financing in a more selective manner, at lower levels, and/or on less favorable terms, any of which may have an adverse effect on our borrowers that are otherwise dependent on such financing to repay their loans to us. Moreover, collateral for many of our loans often includes intellectual property, which is difficult to value and may not be readily salable in the case of default. Because of the intense competition and rapid technological change that characterizes the companies in the technology and life science industry sectors, a borrower’s financial position can deteriorate rapidly.
We continue to increase our efforts to lend to larger clients, as well as to make larger loans. Our ability to make larger loans will increase with the additional capital resulting from this offering. These larger loans include loans equal to or greater than $7.5 million to individual clients, which have over time represented an increasingly larger proportion of our total loan portfolio. Increasing our loan commitments, especially for larger loans, could increase the impact on us of any single borrower default.
We may enter into financing arrangements with our clients, the repayment of which may be dependent on third parties’ financial condition or ability to meet their payment obligations. We make loans secured by letters of credit issued by other third party banks, the repayment of which may be dependent on the reimbursement by third party banks. These third parties may not meet their financial obligations to our clients or to us, which could have an adverse impact on us. We also intend to maintain an emphasis on asset-based lending by providing our clients with lines of credit secured by accounts receivable and inventory. These types of loans generally expose us to additional risks since they are made on the basis of the borrower’s ability to make payments from the cash flows of the borrower’s business and are secured by collateral that may depreciate over time.
14
Table of Contents
In our portfolio of venture capital clients, many of our clients have lines of credit, the repayment of which is dependent on the payment of capital calls or management fees by the underlying limited partner investors in the funds managed by these firms. These limited partner investors may face liquidity issues or have difficulties meeting their financial commitments, especially during unstable economic times, which may lead to our clients’ inability to meet their repayment obligations to us.
Based on the credit profile of our overall loan portfolio, our level of nonperforming loans, loan charge-offs and allowance for loan losses can be volatile and can vary materially from period to period. Although our average nonperforming loans and loan charge-offs have been relatively low historically, due to the credit profile of our loan portfolio and the nature of our borrowers, we may have quarterly or interim periods where nonperforming loans and charge-offs significantly exceed our historical averages. Increases in our level of nonperforming loans or loan charge-offs may require us to increase our provision for loan losses in any period, which could reduce our net income or cause net losses in that period. Additionally, such increases in our level of nonperforming loans or loan charge-offs may also have an adverse effect on our capital ratios and market perceptions of us.
If we conclude that the decline in value of any of our investment securities is other than temporary, we are required to write down the value of that security through a charge to earnings.
We review our investment securities portfolio at each quarter-end reporting period to determine whether securities need to be impaired due to changes in value associated with credit quality. When our other than temporary impairment (“OTTI”) methodology shows that an investment security has declined below its carrying value, we are required to assess whether the decline is other than temporary. If we conclude through our impairment methodology that the decline is other than temporary, we are required to write down the value of that security through a charge to earnings. Factors beyond our control can significantly influence the fair value of securities in our portfolio and can cause potential adverse changes to the fair value of these securities. For example, fixed-rate securities are generally subject to decreases in market value when market interest rates rise. Additional factors include, but are not limited to, rating agency downgrades of the securities, defaults by the issuer or individual borrowers with respect to the underlying securities, and continued instability in the credit markets. The process for determining whether impairment is other than temporary usually requires difficult, subjective judgments about the future financial performance of the issue and any collateral underlying the security in order to assess the probability of receiving all contractual principal on the security. Changes in the expected cash flows of these securities may result in our concluding in future periods that the impairment of these securities is other than temporary, which would require a charge to earnings to write down these securities.
The valuation risk associated with our investment portfolio could have a material adverse impact on our book equity.
As part of managing our overall inherent risk position, our investment portfolio is typically weighted towards fixed-rate securities. If interest rates increase (decrease) the fair value of our investment portfolio will conversely decrease (increase). The decline in value is an unrealized loss that will decrease the fair value of our securities and the Other Comprehensive Income component of our shareholders’ equity. Due to the relatively large size of the investment portfolio, this can have a material adverse impact to our shareholders’ equity. The potential loss in book value could be quite large depending on how quickly and how materially market interest rates change. While the loss is not permanent, it could have a material impact on our book value for any particular reporting period. In addition to regular interest rate risk analysis, we also conduct ongoing analysis to test Square 1 Bank’s exposure to various rising rate scenarios in order to better manage this risk.
Public equity offerings and mergers and acquisitions involving our clients or a slowdown in venture capital investment levels may reduce the market for venture capital investment and the borrowing needs of our current and potential clients, which could adversely affect our ability to grow and our financial performance.
Our core strategy is focused on providing banking products and services to companies, including in particular early- and expansion-stage companies that receive financial support from sophisticated investors, including venture capital or private equity firms, “angels,” and corporate investors. We derive a meaningful share of our deposits from these companies and provide them with loans as well as other banking products and services. In many cases, our credit decisions are based on our analysis of the likelihood that our venture capital-backed client will receive additional rounds of equity capital from investors. If the amount of capital available to such companies decreases, it is likely that the number of new clients and investor financial support to our existing borrowers could decrease, which could have an adverse effect on our business, profitability and growth prospects.
15
Table of Contents
While an active market for public equity offerings and mergers and acquisitions generally has positive implications for our business, one negative consequence is that our clients may pay off or reduce their loans with us if they complete a public equity offering, are acquired by or merge with another entity or otherwise receive a significant equity investment. Moreover, our capital call lines of credit are typically utilized by our venture capital fund clients to make investments prior to receipt of capital called from their respective limited partners. A slowdown in overall venture capital investment levels may reduce the need for our clients to borrow from our capital call lines of credit. Any significant reduction in the outstanding amounts of our loans or under our lines of credit could have a material adverse effect on our business, results of operations and financial condition.
The borrowing needs of our clients may be unpredictable, especially during a challenging economic environment. We may not be able to meet our unfunded credit commitments, or adequately reserve for losses associated with our unfunded credit commitments, which could have a material effect on our business, financial condition, results of operations and reputation.
A commitment to extend credit is a formal agreement to lend funds to a client as long as there is no violation of any condition established under the agreement. The actual borrowing needs of our clients under these credit commitments have historically been lower than the contractual amount of the commitments. A significant portion of these commitments expire without being drawn upon. Because of the credit profile of our clients, we typically have a substantial amount of total unfunded credit commitments, which is reflected off our balance sheet. Actual borrowing needs of our clients may exceed our expected funding requirements, especially during a challenging economic environment when our client companies may be more dependent on our credit commitments due to the lack of available credit elsewhere, the increasing costs of credit, or the limited availability of financings from venture firms. In addition, limited partner investors of our venture capital clients may fail to meet their underlying investment commitments due to liquidity or other financing issues, which may increase our clients’ borrowing needs. Any failure to meet our unfunded credit commitments in accordance with the actual borrowing needs of our clients may have a material adverse effect on our business, financial condition, results of operations and reputation.
Additionally, we establish a reserve for losses associated with our unfunded credit commitments. The level of the reserve for unfunded credit commitments is determined by following a methodology similar to that used to establish our allowance for loan losses in our funded loan portfolio. The reserve is based on credit commitments outstanding, credit quality of the loan commitments, and management’s estimates and judgment, and is susceptible to significant changes. There can be no assurance that our reserve for unfunded credit commitments will be adequate to provide for actual losses associated with our unfunded credit commitments. An increase in the reserve for unfunded credit commitments in any period may result in a charge to our earnings, which could reduce our net income or increase net losses in that period.
Concentration of risk increases the potential for significant losses.
Concentration of risk increases the potential for significant losses in our business. While there may exist a great deal of diversity within each industry, our clients are concentrated by these general industry niches: technology, life science and venture capital. Many of our client companies are concentrated by certain stages within their life cycles, such as early-stage or expansion-stage, and many of these companies are venture capital-backed. Our loan concentrations are derived from our borrowers engaging in similar activities or types of loans extended to a diverse group of borrowers that could cause those borrowers to be similarly impacted by economic or other conditions. In addition, we are continuing to increase our efforts to lend to larger clients and/or to make larger loans, which may increase our concentration risk. Any adverse effect on any of our areas of concentration could have a material impact on our business, results of operations and financial condition. Due to our concentrations, we may suffer losses even when economic and market conditions are generally favorable for our competitors.
We face competitive pressures that could adversely affect our business, results of operations, financial condition and future growth.
We compete with other banks and specialty and diversified financial services companies and venture debt funds, many of which are larger than us. While there are a limited number of direct competitors in the venture banking market. Some of our competitors have long-standing relationships with venture firms and the companies that are funded by such firms. As such, the market we target is extremely competitive and several of our competitors have significantly greater resources, established customer bases, more locations and longer operating histories. Our competitors sometimes undercut the pricing
16
Table of Contents
and/or credit terms we are able to offer in order to increase their market share. Our pricing and credit terms could deteriorate if we act to meet these competitive challenges, which could adversely affect our business, results of operations and financial condition and future growth. If we are not able to successfully compete for customers and grow our business, our earnings could be adversely affected.
A return of recessionary conditions could result in increases in our level of nonperforming loans and/or reduce demand for our products and services, which could have an adverse effect on our results of operations.
Although the U.S. economy has emerged from the severe recession that occurred in 2008 and 2009, economic growth has been slow and uneven, and unemployment levels remain high. Recovery by many businesses has been impaired by lower consumer spending. A return to prolonged deteriorating economic conditions and/or continued negative developments in the domestic and international credit markets could significantly affect the ability of our client companies to operate, the markets in which we do business, the value of our loans and investments, and our ongoing operations, costs and profitability. These events may cause us to incur losses and may adversely affect our financial condition and results of operations.
Our allowance for loan losses is determined based upon both objective and subjective factors, and may be inadequate or subject to increase by our regulators, which could hurt our earnings.
When borrowers default and do not repay the loans that we make to them, we may lose money. The allowance for loan losses is the amount estimated by management as necessary to cover probable losses in the loan portfolio at the statement of financial condition date. The allowance is established through the provision for loan losses, which is charged to income. Determining the amount of the allowance for loan losses necessarily involves a high degree of judgment. Among the material estimates required to establish the allowance are loss exposure at default, the amount and timing of future cash flows on impacted loans, value of collateral, and determination of the loss factors to be applied to the various elements of the portfolio. If our estimates and judgments regarding such matters prove to be incorrect, our allowance for loan losses might not be sufficient, and additional loan loss provisions might need to be made. Depending on the amount of such loan loss provisions, the adverse impact on our earnings could be material. In addition, we may increase the allowance because of changing economic conditions or other qualitative factors. There may be a significant increase in the number of borrowers who are unable or unwilling to repay their loans, resulting in our charging off more loans and increasing our allowance.
In addition, bank regulators may require us to make a provision for loan losses or otherwise recognize further loan charge-offs following their periodic review of our loan portfolio, our underwriting procedures, and our loan loss allowance. Any increase in our allowance for loan losses or loan charge-offs as required by such regulatory authorities could have a material adverse effect on our financial condition and results of operations. Please see “Management’s Discussion and Analysis of Financial Condition and Results of Operations—Critical Accounting Policies and Estimates—Allowance for Loan Losses” for a discussion of the procedures we follow in establishing our loan loss allowance.
Our current level of interest rate spread may decline in the future. Any material reduction in our interest rate spread, or a continuation of the sustained period of low market interest rates, could have a material effect on our business, results of operations or financial condition.
A major portion of our net income comes from our interest rate spread, which is the difference between the interest rates paid by us on amounts used to fund assets and the interest rates and fees we receive on our interest-earning assets. We fund assets using deposits and other borrowings. While we offer interest-bearing deposit products, a majority of our deposit balances consist of noninterest-bearing products. Our interest-earning assets include outstanding loans extended to our clients and securities held in our investment portfolio. Overall, the interest rates we pay on our interest-bearing liabilities and receive on our interest-earning assets, and our level of interest rate spread, could be affected by a variety of factors, including changes in market interest rates, competition, regulatory requirements (such as the repeal of the interest payment restrictions under Federal Reserve Regulation Q), and a change over time in the mix of the types of loans, investment securities, deposits and other liabilities on our balance sheet.
Changes in market interest rates, such as the Federal Funds rate, generally impact our interest rate spread. While changes in interest rates do not produce equivalent changes in the revenues earned from our interest-earning assets and the expenses associated with our interest-bearing liabilities, increases in market interest rates will nevertheless likely cause our interest rate spread to increase. Conversely, if interest rates decline, our interest rate spread will likely decline. Sustained low levels of market interest rates could continue to place downward pressure on our net income levels. Unexpected or further
17
Table of Contents
interest rate changes may adversely affect our business forecasts and expectations. Interest rates are highly sensitive to many factors beyond our control, such as inflation, recession, global economic disruptions, unemployment and the fiscal and monetary policies of the federal government and its agencies. Any material reduction in our interest rate spread or the continuation of sustained low levels of market interest rates could have a material adverse effect on our business, results of operations and financial condition. See “Management’s Discussion and Analysis of Financial Condition and Results of Operations—Interest Rate Risk—Interest Rate Risk Management.”
We anticipate that we will have increased operating expenses in 2014 which could adversely impact our earnings.
As we continue to grow our business and add employees to support our growth, we will incur additional personnel and benefits expenses related to this growth. In addition, our occupancy expenses will increase in 2014 due to our assumption of the leases for the Sand Hill Finance LLC offices, our anticipated addition of new loan production offices in San Francisco and Chicago and an increase in our lease expenses for one of our existing loan production offices. Square 1 Bank is also in the process of updating its online banking system and its platform for lending and credit operations and such updates will result in increased expenses in 2014. We anticipate that the aggregate of these increased expenses will result in approximately a 20% increase in our operating expenses for 2014 compared to 2013. Such increased operating expenses could adversely impact our net income for fiscal year 2014.
Liquidity risk could impair our ability to fund operations and jeopardize our financial condition.
Liquidity is essential to our business. We require sufficient liquidity to meet our expected, as well as unexpected, financial obligations and requirements. Primary liquidity resources for Square 1 Financial are dividends from the Bank and periodic capital raising transactions. Client deposits are the primary source of liquidity for Square 1 Bank. We tend to have volatility in our deposit portfolio due to, among other things, venture capital funding and disbursement patterns and portfolio company cash burn rates. We have tools in place to manage this volatility, including varying the pricing of various deposit products and using off-balance sheet products for managing deposit growth. When needed, wholesale borrowing capacity supplements our liquidity in the form of short- and long-term borrowings secured by our portfolio of investment securities, loans outstanding and, finally, through unsecured overnight funding channels available to us in the Fed Funds market. An inability to maintain or raise funds through these sources could have a substantial negative effect on our liquidity. Our access to funding sources in amounts adequate to finance our activities, or on terms attractive to us, could be impaired by factors that affect us specifically or the financial services industry in general. Factors that could detrimentally impact our access to liquidity sources include an increase in costs of capital in financial capital markets, a decrease in the level of our business activity due to a market downturn or adverse regulatory action against us, or a decrease in depositor or investor confidence in us. Our ability to borrow could also be impaired by factors that are not specific to us, such as a severe volatility or disruption of the financial markets or negative views and expectations about the prospects for the financial services industry as a whole. Any failure to manage our liquidity effectively could have a material adverse effect on our financial condition.
Our business reputation is important and any damage to it could have a material adverse effect on our business.
Our reputation, including the intellectual property associated with our reputation, is very important to sustain our business, as we rely on our relationships with our current, former and potential clients and shareholders, the venture capital and private equity communities, and the industries that we serve. On November 22, 2013, we filed a complaint in the U.S. District Court in the Middle District of North Carolina, demanding injunctive relief to block CommunityOne Bancorp from further use of its logo. Our complaint alleges that CommunityOne Bancorp’s newly-adopted logo is nearly identical to our mark and amounts to trademark infringement, as we currently own multiple U.S. registrations for our logo. Any damage to our reputation, whether arising from alleged trademark infringement or other legal, regulatory, supervisory or enforcement actions, matters affecting our financial reporting or compliance with Securities and Exchange Commission (the “SEC”) and exchange listing requirements, negative publicity, the conduct of our business or otherwise could have a material adverse effect on our business. See “Business—Legal Proceedings.”
Regulation of the financial services industry is undergoing major changes, and future legislation could increase our cost of doing business or harm our competitive position.
We are subject to extensive regulation, supervision and examination by the Board of Governors of the Federal Reserve System (the “Federal Reserve”) and the North Carolina Commissioner of Banks (the “NCCOB”), our primary regulators, and
18
Table of Contents
by the Federal Deposit Insurance Corporation (the “FDIC”), as insurer of our deposits. Such regulation and supervision governs the activities in which an institution and its holding company may engage and are intended primarily for the protection of the insurance fund and the depositors and borrowers of Square 1 Bank rather than for holders of our common stock. Regulatory authorities have extensive discretion in their supervisory and enforcement activities, including the imposition of restrictions on our operations, the classification of our assets and determination of the level of our allowance for loan losses. Any change in such regulation and oversight, whether in the form of regulatory policy, regulations, legislation or supervisory action, may have a material impact on our operations.
In 2010 and 2011, in response to the financial crisis and recession that began in 2008, significant regulatory and legislative changes resulted in broad reform and increased regulation impacting financial institutions. The Dodd-Frank Act has created a significant shift in the way financial institutions operate. The Dodd-Frank Act also created the Consumer Financial Protection Bureau to administer consumer protection and fair lending laws, a function that was formerly performed by the depository institution regulators. The Dodd-Frank Act contains various other provisions designed to enhance the regulation of depository institutions and prevent the recurrence of a financial crisis such as occurred in 2008-2009. The full impact of the Dodd-Frank Act on our business and operations will not be known for years until all of the regulations fully implementing the statute are written and adopted. The Dodd-Frank Act may have a material impact on our operations, particularly through increased regulatory burden and compliance costs. Any future legislative changes could have a material impact on our profitability. Future legislative changes could require changes to business practices or force us to discontinue businesses and potentially expose us to additional costs, liabilities, enforcement action and reputational risk.
Additionally, in early July 2013, the Federal Reserve approved revisions to their capital adequacy guidelines and prompt corrective action rules that implement the revised standards of the Basel Committee on Banking Supervision, commonly called Basel III, and address relevant provisions of the Dodd-Frank Act. Basel III and the regulations of the federal banking agencies require bank holding companies and banks to undertake significant activities to demonstrate compliance with the new and higher capital standards. Compliance with these rules will impose additional costs on us.
We are periodically subject to examination and scrutiny by a number of banking agencies and, depending upon the findings and determinations of these agencies, we may be required to make adjustments to our business that could adversely affect us.
Federal and state banking agencies periodically conduct examinations of our business, including compliance with applicable laws and regulations. If, as a result of an examination, a federal banking agency was to determine that the financial condition, capital resources, asset quality, asset concentration, earnings prospects, management, liquidity, sensitivity to market risk or other aspects of any of our operations has become unsatisfactory, or that we or our management is in violation of any law or regulation, it could take a number of different remedial actions as it deems appropriate. These actions include the power to enjoin “unsafe or unsound” practices, to require affirmative actions to correct any conditions resulting from any violation or practice, to issue an administrative order that can be judicially enforced, to direct an increase in our capital, to restrict our growth, to change the asset composition of our portfolio or balance sheet, to assess civil monetary penalties against our officers or directors, to remove officers and directors and, if it is concluded that such conditions cannot be corrected or there is an imminent risk of loss to depositors, to terminate our deposit insurance. If we become subject to such regulatory actions, our business, results of operations and reputation may be negatively impacted.
We may need to raise additional capital in the future, and if we fail to maintain sufficient capital, whether due to losses, an inability to raise additional capital or otherwise, our financial condition, liquidity and results of operations, as well as our ability to maintain regulatory compliance, would be adversely affected.
We face significant capital and other regulatory requirements as a financial institution. We may need to raise additional capital in the future to provide us with sufficient capital resources and liquidity to meet our commitments and business needs, which could include the possibility of financing acquisitions. In addition, Square 1 Financial, on a consolidated basis, and the Bank, on a stand-alone basis, must meet certain regulatory capital requirements and maintain sufficient liquidity. Our ability to raise additional capital depends on conditions in the capital markets, economic conditions and a number of other factors, including investor perceptions regarding the banking industry, market conditions and governmental activities, and on our financial condition and performance. Accordingly, we cannot assure you that we will be able to raise additional capital if needed or on terms acceptable to us. If we fail to maintain capital to meet regulatory requirements, our financial condition, liquidity and results of operations would be materially and adversely affected.
19
Table of Contents
We are dependent upon Square 1 Bank for cash flow, and Square 1 Bank’s ability to make cash distributions is restricted.
Our primary tangible asset is Square 1 Bank. As such, we depend upon Square 1 Bank for cash distributions (through dividends on Square 1 Bank’s stock) that we use to pay our operating expenses and satisfy our obligations. Such distributions would be a source of funds to pay dividends, should we elect to pay any in the future, on our common stock. There are numerous laws and banking regulations that limit Square 1 Bank’s ability to pay dividends to Square 1 Financial. If Square 1 Bank is unable to pay dividends to Square 1 Financial, we may not be able to satisfy our obligations or pay dividends on our common stock. Federal and state statutes and regulations restrict Square 1 Bank’s ability to make cash distributions to Square 1 Financial. These statutes and regulations require, among other things, that Square 1 Bank maintain certain levels of capital in order to pay a dividend. Further, state and federal banking authorities have the ability to restrict the payment of dividends by supervisory action.
We rely on other companies to provide key components of our business infrastructure.
Third party vendors provide key components of our business infrastructure such as core loan and deposit data processing systems, internet connections, network access and funds distribution. While we have selected these third party vendors carefully, we cannot control their actions. Any problems caused by these third parties, including those which result from their failure to provide services for any reason or their poor performance of services, could adversely affect our ability to deliver products and services to our customers and otherwise to conduct its business. Replacing these third party vendors could also entail significant delay and expense.
We are dependent on our information technology and telecommunications systems and third-party servicers, and systems failures, interruptions or breaches of security could have a material adverse effect on us.
Our business is dependent on the successful and uninterrupted functioning of our information technology and telecommunications systems and third-party servicers. The failure of these systems, or the termination of a third-party software license or service agreement on which any of these systems is based, could interrupt our operations. Because our information technology and telecommunications systems interface with and depend on third-party systems, we could experience service denials if demand for such services exceeds capacity or such third-party systems fail or experience interruptions. If significant, sustained or repeated, a system failure or service denial could compromise our ability to operate effectively, damage our reputation, result in a loss of customer business, and/or subject us to additional regulatory scrutiny and possible financial liability, any of which could have a material adverse effect on us.
In addition, we provide our customers with the ability to bank remotely, including over the Internet and the telephone. The secure transmission of confidential information over the Internet and other remote channels is a critical element of remote banking. Our network could be vulnerable to unauthorized access, computer viruses, phishing schemes and other security breaches. We may be required to spend significant capital and other resources to protect against the threat of security breaches and computer viruses, or to alleviate problems caused by security breaches or viruses. To the extent that our activities or the activities of our customers involve the storage and transmission of confidential information, security breaches and viruses could expose us to claims, regulatory scrutiny, litigation and other possible liabilities. Any inability to prevent security breaches or computer viruses could also cause existing customers to lose confidence in our systems and could materially and adversely affect us.
Additionally, financial products and services have become increasingly technology-driven. Our ability to meet the needs of our customers competitively, and in a cost-efficient manner, is dependent on the ability to keep pace with technological advances and to invest in new technology as it becomes available. Many of our competitors have greater resources to invest in technology than we do and may be better equipped to market new technology-driven products and services. The ability to keep pace with technological change is important, and the failure to do so could have a material adverse impact on our business and therefore on our financial condition and results of operations.
Our risk management framework may not be effective in mitigating risks and/or losses to us.
We have implemented a risk management framework to manage our risk exposure. This framework is comprised of various processes, systems and strategies, and is designed to manage the types of risk to which we are subject, including, among others, credit, market, liquidity, interest rate and compliance. Our framework also includes financial or other modeling methodologies which involve management assumptions and judgment. There is no assurance that our risk
20
Table of Contents
management framework will be effective under all circumstances or that it will adequately mitigate any risk or loss to us. If our framework is not effective, we could suffer unexpected losses and our business, financial condition, results of operations or prospects could be materially and adversely affected. We may also be subject to potentially adverse regulatory consequences.
We depend on the accuracy and completeness of information about customers and counterparties.
In deciding whether to extend credit or enter into other transactions with customers and counterparties, we may rely on information furnished to us by or on behalf of customers and counterparties, including financial statements and other financial information. We also may rely on representations of customers and counterparties as to the accuracy and completeness of that information and, with respect to financial statements, on reports of independent auditors. For example, under our accounts receivable financing arrangements, we rely on information, such as invoices, contracts and other supporting documentation, provided by our clients and their account debtors to determine the amount of credit to extend. Similarly, in deciding whether to extend credit, we may rely upon our customers’ representations that their financial statements conform to GAAP and present fairly, in all material respects, the financial condition, results of operations and cash flows of the customer. We also may rely on customer representations and certifications, or other audit or accountants’ reports, with respect to the business and financial condition of our clients. Our financial condition, results of operations, financial reporting and reputation could be negatively affected if we rely on materially misleading, false, inaccurate or fraudulent information.
Changes in accounting standards could materially impact our financial statements.
From time to time, the Financial Accounting Standards Board or the SEC may change the financial accounting and reporting standards that govern the preparation of our financial statements. Such changes may result in Square 1 Financial being subject to new or changing accounting and reporting standards. In addition, the bodies that interpret the accounting standards (such as banking regulators or outside auditors) may change their interpretations or positions on how these standards should be applied. These changes may be beyond our control, can be hard to predict and can materially impact how we record and report our financial condition and results of operations. In some cases, we could be required to apply a new or revised standard retrospectively, or apply an existing standard differently, also retrospectively, in each case resulting in our needing to revise or restate prior period financial statements.
If we fail to maintain an effective system of internal control over financial reporting, we may not be able to accurately report our financial results. As a result, current and potential shareholders could lose confidence in our financial reporting which would harm our business and the trading price of our securities.
If we identify material weaknesses in our internal control over financial reporting or are otherwise required to restate our financial statements, we could be required to implement expensive and time-consuming remedial measures and could lose investor confidence in the accuracy and completeness of our financial reports. We may also face regulatory enforcement or other actions, including the potential delisting of our securities from Nasdaq Stock Market. This could have an adverse effect on our business, financial condition and results of operations, including our stock price, and could potentially subject us to litigation.
Business disruptions and interruptions due to natural disasters and other external events beyond our control can adversely affect our business, financial condition and results of operations.
Our operations can be subject to natural disasters and other external events beyond our control, such as earthquakes, fires, severe weather, public health issues, power failures, telecommunication loss, major accidents, terrorist attacks, acts of war, and other natural and man-made events. Such events of disaster, whether natural or attributable to human beings, could cause severe destruction, disruption or interruption to our operations or property. Financial institutions, such as us, generally must resume operations promptly following any interruption. If we were to suffer a disruption or interruption and were not able to resume normal operations within a period consistent with industry standards, our business could suffer serious harm. In addition, depending on the nature and duration of the disruption or interruption, we might be vulnerable to fraud, additional expense or other losses, or to a loss of business and/or clients. We have implemented a business continuity and disaster recovery program which is reviewed and updated no less than annually. There is no assurance that our business continuity and disaster recovery program can adequately mitigate the risks of such business disruptions and interruptions.
Additionally, natural disasters and external events could affect the business and operations of our clients, which could impair their ability to pay their loans or fees when due, impair the value of collateral securing their loans, cause our clients to
21
Table of Contents
reduce their deposits with us, or otherwise adversely affect their business dealings with us, any of which could have a material adverse effect on our business, financial condition and results of operations.
Insiders have substantial control over us, and this control may limit our shareholders’ ability to influence corporate matters and may delay or prevent a third party from acquiring control over us.
Our directors and executive officers and their affiliates currently beneficially own, in the aggregate, 49.2% of our outstanding Class A common stock and all of our Class B common stock. Further, we anticipate that our executive officers and members of our Board of Directors will hold an aggregate of 2.4% of our Class A common stock following the offering, and that entities related to members of our Board of Directors will hold an aggregate of 35.7% of our outstanding Class A common stock and all of our Class B common stock following the offering (without giving effect in each case to the exercise of the purchase option granted to the underwriters but giving effect to the sales of secondary shares by the selling shareholders). The significant concentration of stock ownership may adversely affect the trading price of our Class A common stock due to investors’ perception that conflicts of interest may exist or arise. In addition, these shareholders will be able to exercise influence over all matters requiring shareholder approval, including the election of directors and approval of corporate transactions, such as a merger or other sale of our company or its assets. This concentration of ownership could limit your ability to influence corporate matters and may have the effect of delaying or preventing a change in control, including a merger, consolidation or other business combination involving us, or discouraging a potential acquirer from making a tender offer or otherwise attempting to obtain control, even if that change in control would benefit our other shareholders. For information regarding the ownership of our outstanding stock by our executive officers and directors and their affiliates, please see the section titled “Principal and Selling Shareholders.”
Risks Relating to the Offering
An active, liquid market for our common stock may not develop or be sustained following the offering, which may impair your ability to sell your shares and our ability to raise capital and expand our business.
Before this offering, there has been no established public market for our common stock. Although we have applied to have our common stock listed on the Nasdaq Global Market, an active, liquid trading market for our common stock may not develop or be sustained following the offering. A public trading market having the desired characteristics of depth, liquidity and orderliness depends upon the presence in the marketplace and independent decisions of willing buyers and sellers of our common stock, over which we have no control. Without an active, liquid trading market for our common stock, shareholders may not be able to sell their shares at the volume, prices and times desired. Moreover, the lack of an established market could materially and adversely affect the value of our common stock. The initial public offering price for our common stock will be determined by negotiations between us and the representative of the underwriters and may not be indicative of prices that will prevail in the open market following this offering. Consequently, you may not be able to sell your common stock at or above the initial public offering price or at any other price or at the time that you would like to sell. An inactive market may also impair our ability to raise capital by selling our common stock and may impair our ability to expand our business by using our common stock as consideration.
Actual or anticipated issuances or sales of substantial amounts of our common stock following this offering could cause the market price of our common stock to decline significantly and make it more difficult for us to sell equity or equity-related securities in the future at a time and on terms that we deem appropriate. The issuance of any shares of our common stock in the future also would, and equity-related securities could, dilute the percentage ownership interest held by shareholders prior to such issuance. All 5,881,126 of the shares of common stock sold in this offering (or 6,763,293 shares if the underwriters exercise in full their purchase option) will be freely tradable, except that any shares purchased by “affiliates” (as that term is defined in Rule 144 under the Securities Act of 1933, as amended (the “Securities Act”) may be sold publicly only in compliance with the limitations described under “Shares Eligible For Future Sale.” The remaining 21,319,210 outstanding shares of our common stock, or 78.4% of our outstanding shares, will be deemed to be “restricted securities” as that term is defined in Rule 144, and may be sold in the market over time in private transactions or future public offerings. We also intend to file a registration statement on Form S-8 under the Securities Act to register an aggregate of 2.5 million shares of common stock issued or reserved for future issuance under our equity incentive plan. We may issue all of these shares without any action or approval by our shareholders, and these shares, once issued (including upon exercise of outstanding options), will be available for sale into the public market, subject to the restrictions described above, if applicable, for affiliate holders.
22
Table of Contents
Additional expenses following the offering from operating as a public company will adversely affect our profitability.
Following the offering, our noninterest expenses will increase as a result of the additional financial accounting, legal and various other additional expenses usually associated with operating as a public company and complying with public company disclosure obligations, particularly those obligations imposed by the Sarbanes-Oxley Act of 2002 and the Dodd Frank Act.
We are an “emerging growth company,” and the reduced reporting requirements applicable to emerging growth companies may make our common stock less attractive to investors.
We are an “emerging growth company,” as defined in the JOBS Act. For as long as we continue to be an emerging growth company, we may take advantage of exemptions from various reporting requirements that are applicable to other public companies that are not emerging growth companies, including reduced disclosure obligations regarding executive compensation in our periodic reports and proxy statements and exemptions from the requirements of holding a nonbinding advisory vote on executive compensation and shareholder approval of any golden parachute payments not previously approved. We could be an emerging growth company for up to five years, although we could lose that status sooner if our gross revenues exceed $1.0 billion, if we issue more than $1.0 billion in non-convertible debt in a three-year period, or if the market value of our common stock held by non-affiliates exceeds $700 million as of any June 30 before that time, in which case we would no longer be an emerging growth company as of the following December 31. We cannot predict if investors will find our common stock less attractive because we may rely on these exemptions, or if we choose to rely on additional exemptions in the future. If some investors find our common stock less attractive as a result, there may be a less active trading market for our common stock and our stock price may be more volatile.
Securities analysts may not initiate or continue coverage on our common stock, which could adversely affect the market for our common stock.
The trading market for our common stock will depend in part on the research and reports that securities analysts publish about us and our business. We do not have any control over these securities analysts, and they may not cover our common stock. If securities analysts do not cover our common stock, the lack of research coverage may adversely affect its market price. If we are covered by securities analysts, and our common stock is the subject of an unfavorable report, the price of our common stock may decline. If one or more of these analysts cease to cover us or fail to publish regular reports on us, we could lose visibility in the financial markets, which could cause the price or trading volume of our common stock to decline.
Investors in this offering will experience immediate and substantial dilution.
The initial public offering price is substantially higher than the net tangible book value per share of our common stock immediately following this offering. Therefore, if you purchase shares in the offering, you will experience immediate and substantial dilution in net tangible book value per share in relation to the price that you paid for your shares. The dilution as a result of the offering will be $7.43 per share, based on the assumed initial offering price of $16.00 per share, and our pro forma net tangible book value of $8.57 per share as of December 31, 2013. In addition, we expect the conversion to common stock of a substantial portion of our convertible securities, which include our Series A preferred stock and trust preferred securities, to occur following the offering, which would result in dilution of $7.23 per share assuming every convertible security is converted. Additional dilution may occur upon the exercise of warrants and stock options. Accordingly, if we were liquidated at our pro forma net tangible book value, you would not receive the full amount of your investment.
We have broad discretion in the use of the net proceeds from this offering, and our use of those proceeds may not yield a favorable return on your investment.
We expect to use the net proceeds of this offering to support our long-term growth by enhancing our capital ratios to permit growth initiatives and for general working capital and other corporate purposes, which may include, among other things, funding loans and purchasing investment securities through our bank subsidiary. We intend, as a secondary purpose of the offering, to use the net proceeds to redeem, at the first quarterly redemption date following the offering, any Series A preferred stock and to retire any indebtedness relating to Square 1 Financial’s trust preferred securities that remain outstanding following the completion of this offering. As our preferred stock and our trust preferred securities are currently convertible into common stock at a conversion price of $10.00 per share, we expect that a significant portion of the $7.4 million in outstanding trust preferred securities and the $5.0 million in outstanding Series A preferred stock will be converted into common stock following completion of this offering.
23
Table of Contents
Our management has broad discretion over how these proceeds are used and could spend the proceeds in ways with which you may not agree. In addition, we may not use the proceeds of this offering effectively or in a manner that increases our market value or enhances our profitability. We have not established a timetable for the effective deployment of the proceeds, and we cannot predict how long it will take to deploy the proceeds. Investing the offering proceeds in securities until we are able to deploy the proceeds will provide lower margins that we generally earn on loans, potentially adversely affecting shareholder returns, including earnings per share, return on assets and return on equity.
We do not intend to pay dividends in the foreseeable future.
Our Board of Directors intends to retain all of our earnings to promote growth and build capital. Accordingly, we do not expect to pay dividends in the foreseeable future. In addition, we are subject to certain restrictions on the payment of cash dividends as a result of banking laws, regulations and policies. Finally, because Square 1 Bank is our only material asset, our ability to pay dividends to our shareholders depends on our receipt of dividends from the Bank, which is also subject to restrictions on dividends as a result of banking laws, regulations and policies. Accordingly, if the receipt of dividends over the near term is important to you, you should not invest in our common stock. For additional information, see “Dividend Policy.”
Our corporate governance documents, and certain corporate and banking laws applicable to us, could make a takeover more difficult.
Certain provisions of our certificate of incorporation and bylaws, and corporate and federal banking laws, could make it more difficult for a third party to acquire control of our organization or conduct a proxy contest, even if those events were perceived by many of our shareholders as beneficial to their interests. These provisions, and the corporate and banking laws and regulations applicable to us:
| • | enable our Board of Directors to issue additional shares of authorized, but unissued capital stock; |
| • | enable our Board of Directors to issue “blank check” preferred stock with such designations, rights and preferences as may be determined from time to time by the Board; |
| • | enable our Board of Directors to increase the size of the Board and fill the vacancies created by the increase; |
| • | enable our Board of Directors to amend our bylaws without shareholder approval; |
| • | require advance notice for director nominations and other shareholder proposals; |
| • | the election of directors to staggered terms of three years; |
| • | the absence of cumulative voting by shareholders in the election of directors; and |
| • | provisions restricting the calling of special meetings of shareholders. |
These provisions may discourage potential acquisition proposals and could delay or prevent a change in control, including under circumstances in which our shareholders might otherwise receive a premium over the market price of our shares.
An investment in our common stock is not an insured deposit and is subject to risk of loss.
Your investment in our common stock will not be a bank deposit and will not be insured or guaranteed by the FDIC or any other government agency. Your investment will be subject to investment risk, and you must be capable of affording the loss of your entire investment.
24
Table of Contents
CAUTIONARY NOTE REGARDING FORWARD-LOOKING STATEMENTS
This prospectus contains forward-looking statements within the meaning of section 27A of the Securities Act and 21E of the Securities Exchange Act of 1934, as amended (the “Exchange Act”). These forward-looking statements reflect our current views with respect to, among other things, future events and our financial performance. These statements are often, but not always, made through the use of words or phrases such as “may,” “should,” “could,” “predict,” “potential,” “believe,” “will likely result,” “expect,” “continue,” “will,” “anticipate,” “seek,” “estimate,” “intend,” “plan,” “projection,” “would” and “outlook,” or the negative version of those words or other comparable of a future or forward-looking nature. These forward-looking statements are not historical facts, and are based on current expectations, estimates and projections about our industry, management’s beliefs and certain assumptions made by management, many of which, by their nature, are inherently uncertain and beyond our control. Accordingly, we caution you that any such forward-looking statements are not guarantees of future performance and are subject to risks, assumptions and uncertainties that are difficult to predict. Although we believe that the expectations reflected in these forward-looking statements are reasonable as of the date made, actual results may prove to be materially different from the results expressed or implied by the forward-looking statements.
There are or will be important factors that could cause our actual results to differ materially from those indicated in these forward-looking statements, including, but are not limited to, the following:
| • | market and economic conditions (including interest rate environment, levels of public offerings, mergers and acquisitions (“M&A”) and venture capital financing activities) and the associated impact on us; |
| • | changes in management personnel; |
| • | the sufficiency of our capital, including sources of capital (such as funds generated through retained earnings) and the extent to which capital may be used or required; |
| • | our overall investment plans, strategies and activities, including our investment of excess cash/liquidity; |
| • | venture capital/private equity funding and investments; |
| • | operational, liquidity and credit risks associated with our business; |
| • | deterioration of our asset quality; |
| • | our overall management of interest rate risk, including managing the sensitivity of our interest-earning assets and interest-bearing liabilities to interest rates, and the impact to earnings from a change in interest rates; |
| • | our ability to execute our strategy and to achieve organic loan and deposit growth; |
| • | increased competition in the financial services industry, nationally, regionally or locally, which may adversely affect pricing and terms; |
| • | the adequacy of reserves (including allowance for loan and lease losses) and the appropriateness of our methodology for calculating such reserves; |
| • | the level of client investment fees and associated margins; |
| • | changes in federal tax law or policy; |
| • | volatility and direction of market interest rates; |
| • | changes in the regulatory environment; |
| • | changes in trade, monetary and fiscal policies and laws; |
| • | governmental legislation and regulation, including changes in accounting regulation or standards, the nature and timing of the adoption and effectiveness of new requirements under the Dodd-Frank Act, Basel guidelines, capital requirements and other applicable laws and regulations; |
| • | changes in interpretation of existing law and regulation; |
| • | further government intervention in the U.S. financial system; and |
| • | other factors that are discussed in the section titled “Risk Factors,” beginning on page 14. |
25
Table of Contents
The foregoing factors should not be construed as exhaustive and should be read together with the other cautionary statements included in this prospectus. If one or more events related to these or other risks or uncertainties materialize, or if our underlying assumptions prove to be incorrect, actual results may differ materially from what we anticipate. Accordingly, you should not place undue reliance on any such forward-looking statements. Any forward-looking statement speaks only as of the date on which it is made, and we do not undertake any obligation to publicly update or review any forward-looking statement, whether as a result of new information, future developments or otherwise. New factors emerge from time to time, and it is not possible for us to predict which will arise. In addition, we cannot assess the impact of each factor on our business or the extent to which any factor, or combination of factors, may cause actual results to differ materially from those contained in any forward-looking statements.
We estimate that the net proceeds to us from the sale of our common stock offered by us in this offering will be $45.5 million, or $52.5 million if the underwriters elect to exercise in full their purchase option, based on an assumed initial offering price of $16.00 per share, which is the mid-point of the estimated public offering price range set forth on the cover page of this prospectus, and after deducting estimated underwriting discounts and offering expenses. Each $1.00 increase or decrease in the assumed initial public offering price of $16.00 per share would increase or decrease the net proceeds to us from this offering by $2.9 million, or $3.4 million if the underwriters’ purchase option is exercised in full. We will not receive any proceeds from the sale of our common stock by the selling shareholders. We expect to downstream approximately 90% of the net proceeds of the offering to Square 1 Bank.
We intend to use the net proceeds to us generated by this offering to support our long-term growth by enhancing our capital ratios in light of the heightened capital standards under Basel III, and for general working capital and other corporate purposes. We intend, as a secondary purpose of the offering, to use the net proceeds to redeem, at the first quarterly redemption date following the offering, any Series A preferred stock and to retire any indebtedness relating to Square 1 Financial’s trust preferred securities that remain outstanding following the completion of this offering. Our trust preferred securities and Series A preferred stock are currently redeemable by the Company, at its option, on any quarterly dividend payment date. No premium is attached to such redemption. Such redemption would require approval of the Federal Reserve, which approval has not yet been sought. As our preferred stock and our trust preferred securities are currently convertible, at the option of the holder, into common stock at a conversion price of $10.00 per share, we expect that a significant portion of the $7.4 million in outstanding trust preferred securities and the $5.0 million in outstanding Series A preferred stock will be converted into common stock prior to the redemption date. Although we may, from time to time in the ordinary course of business, evaluate potential acquisition and business line expansion opportunities that we believe are complementary to our business and provide attractive risk-adjusted returns, we do not have any immediate plans, arrangements or understandings relating to any material acquisition. Our management will retain broad discretion to allocate the net proceeds of this offering. The precise amounts and timing of our use of the proceeds will depend upon market conditions, among other factors.
The selling shareholders will receive the proceeds from sales by the selling shareholders in this offering, which are estimated to be, before expenses, approximately $44.1 million in the aggregate, or approximately $50.7 million in the aggregate if the underwriters elect to exercise in full their purchase option, based an on an assumed initial offering price of $16.00 per share which is the midpoint of the estimated offering range.
We have not paid any dividends on our common stock since inception, and we do not intend to pay dividends for the foreseeable future. Instead, we anticipate that all of our future earnings will be retained to support our operations and to finance the growth and development of our business. Any future determination relating to our dividend policy will be made by our Board of Directors and will depend on a number of factors, including our financial condition and results of operations, tax considerations, capital requirements, industry standards, and economic conditions. We will also consider the regulatory restrictions that affect the payment of dividends by Square 1 Bank to us, as discussed below.
As a Delaware corporation, Square 1 Financial is permitted to pay dividends out of its surplus, or if no surplus is available, out of its net profits for the fiscal year in which the dividend is declared and the preceding fiscal year. We are not required to obtain prior Federal Reserve approval to pay a dividend unless the declaration and payment of a dividend could
26
Table of Contents
raise supervisory concerns about the safe and sound operation of Square 1 Financial and Square 1 Bank, where the dividend declared for a period is not supported by earnings for that period, or where we plan to declare a material increase in our common stock dividend.
Our ability to pay dividends to our shareholders may depend, in part, upon our receipt of dividends from Square 1 Bank, which is also subject to numerous limitations on the payment of dividends under federal and state banking laws, regulations and policies. The ability of Square 1 Bank to pay dividends is governed by North Carolina law and FDIC regulations. Under North Carolina law, the Board of Directors of Square 1 Bank may declare a dividend provided they maintain regulatory capital ratios sufficient to be considered “adequately capitalized” for regulatory purposes. Also, under FDIC regulations, no bank may pay a dividend if, after the payment of the dividend, it would be “undercapitalized” within the meaning of the prompt corrective action laws. See “Supervision and Regulation—State Bank Regulation—Dividend Restrictions.”
The present and future dividend policy of Square 1 Bank is subject to the discretion of its Board of Directors.
27
Table of Contents
The following table shows our capitalization, including regulatory capital ratios, on a consolidated basis, as of December 31, 2013, on an actual basis and on an as adjusted basis after giving effect to (i) the net proceeds from the sale by us of 3,125,000 shares of common stock in this offering (assuming the underwriters do not exercise their purchase option) at the assumed initial public offering price of $16.00 per share, which is the mid-point of the estimated public offering price range set forth on the cover page of this prospectus, and after deducting estimated underwriting discounts and offering expenses and (ii) the conversion of $3.75 million of trust preferred securities and the exercise of 4,000 warrants by two selling shareholders in connection with the sales of their shares in this offering. You should read the following table in conjunction with the sections titled “Selected Historical Consolidated Financial Information,” and “Management’s Discussion and Analysis of Financial Condition and Results of Operations” and our consolidated financial statements and the related notes appearing elsewhere in this prospectus.
| As of December 31, 2013(1) | ||||||||
| Actual | As Adjusted for the Offering(2) |
|||||||
| (Dollars in thousands, except per share data) |
||||||||
| Long-term debt: |
||||||||
| Junior subordinated debentures(3) |
$ | 6,207 | $ | 3,068 | ||||
|
|
|
|
|
|||||
| Total long-term debt |
$ | 6,207 | $ | 3,068 | ||||
|
|
|
|
|
|||||
| Shareholders’ equity: |
||||||||
| Common stock, par value $0.01 per share, 45,000,000 shares authorized, 23,611,746 shares issued and outstanding; and 70,000,000 shares authorized, 27,115,746 shares issued and outstanding, as adjusted(4) |
$ | 236 | $ | 271 | ||||
| Convertible preferred stock, par value $0.01 per share, 10,000,000 shares authorized, 5,000 shares issued and outstanding; actual and as adjusted |
— | — | ||||||
| Additional paid-in capital |
183,716 | 232,907 | ||||||
| Accumulated other comprehensive income, net |
(4,096 | ) | (4,096 | ) | ||||
| Retained earnings |
9,293 | 8,943 | ||||||
|
|
|
|
|
|||||
| Total shareholders’ equity |
$ | 189,149 | $ | 238,025 | ||||
| Book value per common share |
$ | 7.80 | $ | 8.60 | ||||
| Tangible book value per common share |
$ | 7.77 | $ | 8.57 | ||||
| Capital ratios (consolidated): |
||||||||
| Total shareholders’ equity to assets |
8.13 | % | 10.03 | % | ||||
| Tangible equity to tangible assets(5) |
7.89 | % | 9.80 | % | ||||
| Tier 1 leverage |
8.34 | % | 9.94 | % | ||||
| Tier 1 risk-based |
12.08 | % | 14.55 | % | ||||
| Total risk-based |
13.24 | % | 15.69 | % | ||||
| Basel III capital ratios(6): |
||||||||
| Tier 1 common equity |
10.26 | % | 13.08 | % | ||||
| Tier 1 leverage |
8.34 | % | 9.93 | % | ||||
| Tier 1 risk-based |
10.87 | % | 13.08 | % | ||||
| Total risk-based |
11.91 | % | 14.11 | % | ||||
| (1) | Both columns include Class A common stock and Class B non-voting common stock in the number of shares of common stock outstanding. References in this section to the number of shares of our common stock outstanding do not include the 500,000 shares of our common stock reserved for issuance in connection with outstanding Series A preferred stock. “Actual” does not include 741,500 shares of our common stock reserved for issuance in connection with outstanding trust preferred securities, which Series A preferred stock and trust preferred securities are convertible at $10.00 per share, and are expected to be converted in large part, into shares of common stock following completion of the offering. Both columns exclude 1,394,550 shares of our common stock issuable upon exercise of outstanding stock options at a weighted-average exercise price of $6.12 per share; 532,460 shares of common stock issuable upon the vesting of restricted stock units with a remaining weighted average vesting period, as of December 31, 2013, of 1.1 years. Actual does not include 70,000 shares of common stock issuable upon the exercise of warrants issued to the organizers of the Bank at an exercise price of $10.00 per share; an aggregate of 750,000 shares of common stock issuable upon the exercise of warrants issued to Patriot Financial Partners, L.P. and Patriot Financial Partners Parallel, L.P. at an exercise price of $ 5.15 per share; and 612,715 additional shares of common stock reserved for issuance under our equity incentive plans. As adjusted includes the conversion of $3.75 million of trust preferred securities and the exercise of 4,000 warrants by two selling shareholders in connection with the sales of their shares in this offering. |
(footnotes continued on following page)
28
Table of Contents
| (2) | If the underwriters’ purchase option is exercised in full, common stock, additional paid-in capital and total shareholders’ equity would be $275,845, $239.9 million, and $245.0 million, respectively. |
| (3) | Consists of debt issued in connection with the issuance of our trust preferred securities. |
| (4) | If the underwriters’ purchase option is exercised in full, the as adjusted number of shares outstanding would be 27,584,496. |
| (5) | This is not a measure recognized under GAAP and is therefore considered to be a non-GAAP financial measure. See “Selected Historical Consolidated Financial Information—Non-GAAP Financial Measures” for a reconciliation of this measure to its most directly comparable GAAP measure. |
| (6) | See “Supervision and Regulation—State Bank Regulation—New Capital Rule” for a description of the revised regulatory capital standards to be implemented beginning in 2015. |
If you invest in our common stock, your ownership interest will be diluted to the extent that the initial public offering price per share of our common stock exceeds the book value per share of our common stock immediately following this offering. Tangible book value per common share is equal to our total shareholders’ equity, excluding preferred stock and intangible assets, divided by the number of common shares outstanding. As of December 31, 2013, the tangible book value of our common stock was $183.4 million, or $7.77 per share.
After giving effect to our sale of 3,125,000 shares of common stock in this offering (assuming the underwriters do not exercise their purchase option) at an assumed initial public offering price of $16.00 per share, the conversion of $3.75 million of trust preferred securities and the exercise of 4,000 warrants by two selling shareholders in connection with the sales of their shares in this offering and after deducting estimated underwriting discounts and offering expenses, the pro forma net tangible book value of our common stock at December 31, 2013 would have been $232.3 million, or $8.57 per share. Therefore, this offering will result in an immediate increase of $0.80 in the tangible book value per share of our common stock of existing shareholders and an immediate dilution of $7.43 in the tangible book value per share of our common stock to investors purchasing shares in this offering, or 46.5% of an assumed public offering price of $16.00 per share.
In addition, we expect that our preferred stock and trust preferred securities will be converted, by the holders of such securities, into shares of our common stock prior to the redemption date, which will result in additional dilution to new investors. After giving effect to the offering, in the manner described above, and assuming the subsequent conversion of all shares of preferred stock and all trust preferred securities into an aggregate of 1,241,500 shares of common stock, the pro forma net tangible book value per share of our common stock at December 31, 2013 would have been $8.77 per share. Accordingly, taking into account the conversion of our preferred stock and trust preferred securities, this offering will result in an immediate increase of $1.01 in the book value per share of our common stock of existing shareholders and an immediate dilution of $7.23 in the tangible book value per share of our common stock to investors purchasing shares in this offering, or 45.2% of an assumed public offering price of $16.00 per share.
The following table illustrates the calculation of the amount of dilution per share that a purchaser of our common stock in this offering will incur given the assumptions above:
| Net tangible book value per common share at December 31, 2013 |
$ | 7.77 | ||
| Increase in net book value per common share attributable to new investors |
0.80 | |||
| Pro forma tangible book value per common share after the offering |
8.57 | |||
| Assumed initial public offering price |
16.00 | |||
|
|
|
|||
| Dilution per common share to new investors from offering |
(7.43 | ) | ||
| Additional accretion per common share as a result of conversion of preferred stock and trust preferred securities |
0.21 | |||
|
|
|
|||
| Dilution per common share to new investors from offering and conversion |
$ | (7.23 | ) |
Each $1.00 increase or decrease in the assumed public offering price of $16.00 per share would increase or decrease, respectively, our as adjusted tangible book value by $2.9 million, or approximately $0.11 per share, and the dilution per share to investors in this offering by $0.11 per share, assuming that the number of shares offered by us, as set forth on the cover page of this prospectus, remains the same and after deducting estimated underwriting discounts and commissions and
29
Table of Contents
offering expenses. We may also increase or decrease the number of shares we are offering. An increase of 1.0 million in the number of shares offered by us, together with a $1.00 increase in the assumed offering price of $16.00 per share, would result in an as adjusted tangible book value of $251.1 million, or $8.93 per share, and the dilution per share to investors in this offering would be $7.07 per share. Similarly, a decrease of 1.0 million in the number of shares offered by us, together with a $1.00 decrease in the assumed public offering price of $16.00 per share, would result in as adjusted tangible book value of $215.3 million, or $8.25 per share, and the dilution per share to investors in this offering would be $7.75 per share. The as adjusted information discussed above is illustrative only and will adjust based on the actual public offering price and other terms of this offering determined at pricing.
If the underwriters exercise in full their option to purchase additional shares in this offering, our as adjusted tangible common book value as of December 31, 2013, would be $239.3 million, or $8.67 per share, representing an immediate increase in as adjusted tangible book value to our existing shareholders over our historical December 31, 2013 book value per share of $0.91 per share and immediate dilution to investors participating in this offering of $7.33 per share.
30
Table of Contents
PRICE RANGE OF OUR COMMON STOCK
Prior to this offering, our common stock has not been traded on an established public trading market, and quotations for our common stock were not reported on any market. As a result, there has been no regular market for our common stock. Although our shares may have been sporadically traded in private transactions, the prices at which such transactions occurred may not necessarily reflect the price that would be paid for our common stock in an active market. As of January 31, 2014, there were approximately 385 holders of record of our common stock.
We anticipate that this offering and the listing of our common stock on the Nasdaq Global Market will result in a more active trading market for our common stock. However, we cannot assure you that a liquid trading market for our common stock will develop or be sustained after this offering. You may not be able to sell your shares quickly or at the market price if trading in our common stock is not active. See the section of this prospectus titled “Underwriting” for more information regarding our arrangements with the underwriters and the factors considered in setting the initial public offering price.
Overview
We are a financial services company, headquartered in the greater Research Triangle Park area in North Carolina. Square 1 Financial was incorporated in the State of Delaware in October 2004 and became the bank holding company for Square 1 Bank, a de novo North Carolina commercial bank, in August 2005 upon the commencement of Square 1 Bank’s operations. Through Square 1 Bank, which was formed by experienced venture bankers, commercial bankers and entrepreneurs, we offer a full range of banking and financial products and services throughout the United States, focused on the entrepreneurial community and venture capital and private equity firms, which we collectively refer to as venture firms. Since inception, we have operated as a highly-focused venture bank and have provided a broad range of financial services to entrepreneurs, growing entrepreneurial companies and the venture capital and private equity communities.
Our primary focus is on venture-backed technology and life sciences companies located throughout the United States. We focus on venture firms, and on growing and continuing to develop our strong relationships with these firms and the entrepreneurs and companies they fund. Because we lend primarily to venture-backed entrepreneurial companies, our relationships with venture firms are an important aspect of our business. Many of our venture bankers have long-standing relationships with venture firms and focus on leveraging their industry knowledge to develop relationships with additional venture firms. Our knowledge of, and relationships with, venture firms is a key component in underwriting loans to venture-backed companies as we take into account, among other factors, our past experience with the related venture firm as well as the venture firm’s view of its portfolio companies’ management and prospects. We also maintain regular contact with the venture firms that have invested in our borrowers as part of our ongoing monitoring of, and ultimate repayment, of the loans we make to such clients. However, a venture firm is not responsible for the repayment of a loan unless we obtain an explicit written guarantee from such firm in connection with a loan to one of our borrower clients.
Beyond our relationships with venture firms, we also focus our efforts on the entrepreneurial companies served by the venture firms. We actively build relationships and maintain contact with successful serial entrepreneurs, some of whom are repeat chief executive officers and chief financial officers and who we may encounter with different customers over time. We are also involved in networking activities in the startup communities in many of our markets. We maintain a presence in these communities through participation in events sponsored by “incubators” or “accelerators,” which are informal associations engaged in a variety of activities designed to promote and encourage the startup and development of new companies.
Many of our clients are early stage and pre-revenue companies with specialized banking needs. We provide expansion and late stage entrepreneurial companies with lines of credit secured by accounts receivable and inventory. Separately, we also provide certain clients with commercial business loans and real estate loans through SBA and USDA loan programs. As of December 31, 2013, on a consolidated basis, we had total assets of $2.3 billion, loans of $1.1 billion, investment securities of $1.1 billion, total deposits of $2.1 billion, and shareholders’ equity of $189.1 million.
We provide commercial banking services to our clients from our main office in the greater Research Triangle Park area, located in the American Tobacco Historic District in Durham, North Carolina, and eleven loan production offices located
31
Table of Contents
in key technology hubs across the United States, including Silicon Valley, San Diego, Campbell, Orange County and Los Angeles, CA, Boston, Austin, the Washington DC metropolitan area, Denver, New York City and Seattle. We also offer investment advisory and asset management services to our clients through Square 1 Asset Management, a subsidiary of Square 1 Bank, and provide certain non-banking services to our clients through Square 1 Bank, including funds management. In the fourth quarter of 2013, we acquired the business operations and hired the seven employees of a small factoring company, Sand Hill Finance LLC, as part of our strategy to continue to grow our asset-based lending portfolio. In connection with the acquisition, we acquired $11.9 million in loans secured by accounts receivables, furniture, fixtures, equipment and certain warrants acquired by Sand Hill Finance LLC from its borrowers, all for an aggregate purchase price of $12.4 million. See “Acquisition of Factoring Company” below.
Our team of experienced venture and commercial bankers has substantial banking or related experience and relationships in the venture banking market and in lending to entrepreneurial companies and venture firms. We believe our management team’s long-standing presence in the entrepreneurial and venture/private equity communities and our focus on personalized, high-touch client service, have enabled us to sustain double-digit asset growth since our formation and gives us the tools we need to continue our growth. We believe that, given the limited number of competitors that focus solely on the entrepreneurial and venture markets, the continued growth of new start-up companies nationwide and the need for experienced bankers who specialize in lending to venture-backed companies, we have long-term opportunities for growth.
Our History and Growth
Square 1 Bank was chartered in July 2005 to serve the venture capital community and venture-backed companies. Founded by long time venture bankers Richard Casey and Susan Casey and a team of experienced venture bankers and board members, Square 1 Bank commenced banking operations in August 2005. Since its inception, Square 1 Bank has experienced significant organic growth and milestones, including:
| • | August 2005—Chartered with an initial capitalization of $105.0 million raised through a private placement of common stock to the management team and Board of Directors of Square 1 Bank, members of the venture capital community and institutional investors. Square 1 Bank opened for business with six offices located in the entrepreneurial hubs of Silicon Valley, San Diego, Seattle, Boston, Austin and the greater Research Triangle Park area. |
| • | October 2006—Achieved profitability in only 15 months. |
| • | July 2008—Exceeded $1.0 billion in deposits at Square 1 Bank, ($1.1 billion at July 31, 2008), solely through organic growth. |
| • | May 2010—Completed a $48.5 million capital raise through a private placement of common stock to support growth and bolster capital. |
| • | October—December 2012—Raised $23.2 million through a private placement of our common stock to continue Square 1 Bank’s focus on organic growth and it strategic initiatives. |
| • | September 2013—Exceeded $1.0 billion in total gross loans outstanding ($1.0 billion at September 30, 2013). |
32
Table of Contents
Our growth and our profitability over our history are reflected in the charts below:
Net Income and Net Operating Income(1)
| • | As shown in the chart below, our net operating income has grown steadily, particularly in the last three years. We incurred a loss in 2010 resulting from the sale and impairment of non-agency mortgage-backed securities held in our investment portfolio. |
| (1) | Net Operating Income is a non-GAAP financial measure. See “Selected Historical Consolidated Financial Information—Non-GAAP Financial Measures.” |
Deposit Growth
| • | Square 1 Bank exceeded approximately $1.0 billion in deposits in July 2008, (amounting to $1.1 billion at July 31, 2013), solely through organic growth. Low cost deposits have been, and we expect will continue to be, our primary source of funding. |
| • | 65.5% of our deposits were held in noninterest-bearing demand deposit accounts as of December 31, 2013. Our average cost of deposits for the year ended December 31, 2013 was 0.04%. This deposit mix may shift over time as interest rates move up or down. |
33
Table of Contents
Loan Growth
The chart below sets forth the average balance of loans outstanding for each period presented.
| • | At December 31, 2013, we had $1.1 billion in loans outstanding, with $977.3 million in outstanding unfunded loan commitments as of such date. |
| (1) | Net of unearned income. |
Acquisition of Factoring Company
On December 31, 2013, we acquired the business operations and key employees of Sand Hill Finance LLC, a factoring company located in California, as part of our strategy to continue to grow our asset-based lending portfolio. Square 1 Bank acquired $11.9 million of factoring loans from Sand Hill Finance LLC and certain other assets for a total purchase price of $12.4 million, which included the repayment of $7.2 million in outstanding indebtedness of Sand Hill Finance to Square 1 Bank under a customary revolving line of credit. The acquisition increased our asset-based loans by $11.9 million and increased our technology loans by $7.2 million. Additionally, Square 1 Bank assumed obligations under the real estate lease for the company’s primary place of business and hired the company’s seven employees. We intend to integrate the factoring product into our existing suite of asset-based lending products, and will not operate Sand Hill Finance LLC as a separate division of Square 1 Bank.
Our Market Opportunity
Our primary market is broadly defined as venture firms and the portfolio companies in which they invest, nationwide. The venture capital market (which we define to include private equity firms) is vibrant, with venture-backed companies continuing to attract high levels of venture capital investments. Due to the special financing needs of venture-backed companies, many of which may not be eligible for more traditional forms of financing from financial institutions, this market is generally underserved and therefore is an attractive market for us.
The venture banking market in the U.S. includes companies operating in industries that have high potential for innovation and growth, such as technology and life sciences. Venture-backed companies are in various stages of growth, from what is known as angel/seed stage to early stage, expansion stage and late stage. The various stages of entrepreneurial companies are described below:
Angel/Seed stage—companies in this stage have generally raised a small amount of capital from angel investors or family and friends, rather than from venture firms. These companies are in a pre-marketing stage and generally are focused on product development and market research as well as building a management team and developing a business plan, if the initial steps are successful. We are often the first banking relationship for these companies, which tend to need basic, deposit-focused services. We value our ability to form incumbent relationships with companies at this nascent stage of their development, with the goal of a long-term banking relationship as they mature.
34
Table of Contents
Early stage—companies in this stage have generally received at least one round of institutional funding from venture firms or other sources of capital. These companies are often still in the development or testing phase with respect to their products or services and in some cases may have just begun to make their products or services commercially available. Typically, an early stage company will have a core management team and may have a proven concept or product, but has little or no revenues. We are often the first deposit relationship for these companies and typically provide lines of credit and other products and services.
Expansion stage—These companies are generally monetizing their products and have growing accounts receivables and/or inventories. They have revenues of less than $10 million annually and are generally not profitable or cash flow positive. These companies still typically count on additional rounds of investment from venture firms to support further expansion, marketing, working capital, or development of an improved product. In addition to deposits, revolving lines of credit, term loans and asset-based loans, we may provide growth capital loans for these clients to take advantage of unique growth opportunities such as the acquisition of other companies or intellectual property.
Late stage—These companies tend to have proven their concept, achieved revenue of over $10 million annually, and are profitable. Typically, a late stage company is on the road to a liquidity event such as a public offering or acquisition. In addition to deposits and revolving lines of credit, we may provide asset-based loans, trade letters of credit, foreign exchange products and other treasury management services to such companies.
These entrepreneurial companies can be located anywhere, but venture activity tends to be concentrated in key markets which are hubs for academia and innovation, such as Silicon Valley, San Diego, Boston, New York, the Washington, DC metropolitan area, Austin, Denver and the greater Research Triangle Park area. The size of the venture banking market is driven in large part by the number and amount of venture capital investments, because as entrepreneurial companies receive venture capital investments they require banking services beyond what they may have obtained at their formation. As reported in the MoneyTree™ Report, in recent years, in a given quarter there can be as few as approximately 675 and as many as approximately 1,075 venture investment rounds made across the U.S., totaling between $6.0 billion to $9.0 billion, and approximately one-third of these will be first-time financings for companies that will often need tailored venture banking services for many years. Venture firms are also a key part of our market. These firms need a full range of banking services as well, and depend on financial institutions to provide services to their portfolio companies.
From 1995 through 2013, venture capital firms in the U.S. invested approximately $565.0 billion in U.S. companies, based on data obtained from the MoneyTree™ Report. The peak year for venture capital investment in the U.S. during that period was 2000, during which approximately 8,038 companies received a total of nearly $105.1 billion in equity investment. However, in a more typical year since 2000, an average of 3,774 companies receive venture capital investment which, in the aggregate, corresponds to an average, annual equity investment ranging from $20.0 billion to $30.0 billion.
According to the MoneyTree™ Report , venture capital investment totaled approximately $29.4 billion invested in 3,995 deals in 2013. The following data shows venture capital investment by stage of emerging companies for the year 2013:
| Stage of Development |
Number of Deals |
Investment (in 000’s) |
||||||
| Seed |
218 | $ | 942,953 | |||||
| Early Stage |
2,003 | 9,758,813 | ||||||
| Expansion |
984 | 9,838,458 | ||||||
| Later Stage |
790 | 8,824,734 | ||||||
|
|
|
|
|
|||||
| Total |
3,995 | $ | 29,364,958 | |||||
|
|
|
|
|
|||||
We believe this data demonstrates the robust opportunities for growth in this market. These venture-backed companies need specialized banking services and we are well-positioned as one of only two commercial banks almost exclusively focused on this market.
Geography. We divide the broader U.S. market into West and East markets. In the West market, the west coast alone represents nearly half of all U.S. venture investment activity, according to the National Venture Capital Association Yearbook 2013 (“NVCA 2013 Yearbook”). The San Francisco Bay Area and Silicon Valley are the heart of the venture capital industry, and make up the largest market and highest concentration of venture firms, with more than 200 venture firms located in those two areas, and numerous venture-funded companies. By way of example, in 2012, $10.9 billion, or
35
Table of Contents
approximately 41%, of the total of $26.7 billion in venture capital investments made for that year in the U.S. were made in the San Francisco Bay Area and Silicon Valley. The remainder of California and the Pacific Northwest combined had $4.3 billion in venture capital investments in 2012. Denver and Austin also have strong concentrations of venture activity. The Midwest Region, which includes Chicago, had $1.4 billion in venture capital investments in 2012.
The East market is dominated by New York and Massachusetts. These two areas combined accounted for $4.9 billion of total venture capital investments made in 2012. The mid-Atlantic South, a region that includes Washington, DC, the Research Triangle Park region of North Carolina, and Atlanta, are also markets that have strong concentrations of venture activity.
According to the NVCA 2013 Yearbook, in 2012, the five largest states (California, Massachusetts, New York, Washington and Texas) received 78% of all the dollars invested nationally by venture capital firms.
Industry sectors. Venture investments tend to be made to companies with high potential for innovation and growth. Most investments go to companies in the technology, life sciences, and other select traditional industries. The technology sector generally includes software, hardware, media and entertainment, wireless communications, Internet, and networking. The life sciences sector includes biotechnology, medical devices, pharmaceuticals, and healthcare services. Venture capitalists also invest in innovative companies in traditional industries such as consumer products, manufacturing, and business services. According to the MoneyTree™ Report, the software industry was the leading sector in 2013, receiving 37.3% of the total dollars invested, followed by the biotechnology industry which received approximately 15.4% of total dollars invested in 2013, the media and entertainment industry which received approximately 10.0% of total dollars invested in 2013 with the medical devices industry, the fourth largest sector, receiving approximately 7.2% of total dollars invested in 2013.
Venture banking products and services. Banking the venture capital community is characterized by low-cost deposits. Venture-backed companies tend to receive large cash infusions from each round of equity financing, which they must generally hold in a safe liquid investment vehicle that allows them to access their funds as they develop their products. As a result, venture-backed companies tend to hold large cash balances in short-term deposit accounts. Venture firms also often have excess cash after a capital call or sale of a portfolio company that they wish to invest on a short-term and liquid basis. These firms have a need for safety and liquidity, combined with some yield, for a portion of those funds and often utilize a combination of deposit and money market accounts for investing such funds. These companies and venture firms also produce significant noninterest income for us, as they often use fee-based banking services, including, alternative investment products, foreign exchange, credit cards, bill pay, wires, ACH, letters of credit and lockbox services.
Our Strengths
We believe that we are well-positioned to create value for our shareholders, particularly as a result of the following strengths:
We have an experienced core management team with a record of successes in the venture banking community.
Our team. Douglas H. Bowers, our President and Chief Executive Officer, has more than 30 years of commercial banking experience. Judith Erwin, our Executive Vice President, Venture Capital Services and Global Treasury Management, and Christopher Woolley, our Executive Vice President, Banking West, are both founders of Square 1 Bank. Sam Bhaumik is our Executive Vice President, Banking Silicon Valley. Frank Tower, who joined us in January 2014, is our Executive Vice President, Banking East. Each of these four executive officers has an average of more than 25 years of experience working with entrepreneurs and the venture capital community. Ms. Erwin and Mr. Woolley previously worked together in venture banking at the former Imperial Bank and its successor, Comerica Bank. Mr. Bhaumik brings decades of experience in our market having served in a senior position at a specialty finance company focused on venture-backed technology companies and prior to that, in senior positions at Imperial Bank, its successor Comerica Bank, and Silicon Valley Bank. Mr. Tower has over 20 years of experience financing high growth, venture-backed technology and life science companies, both at Gold Hill Capital , a private equity firm, and in senior positions at Silicon Valley Bank. Our Chief Credit Officer, Diane Earle, has more than 27 years of experience in commercial lending and risk management. Ms. Earle spent several years at a venture debt fund, as well as at GE Commercial Finance where she served in senior leadership roles in the credit risk management area, focused on the technology and life sciences industries. Other members of our executive management team include Patrick Oakes, our Chief Financial Officer, Gregory Thompson, our Executive Vice President, Shared Services, and Jason Kranack, our Senior Vice President, Head of Human Resources. Collectively, these three executives bring more than 50 years of experience in the financial services industry and the business world.
36
Table of Contents
Our highly-experienced team also includes more than 60 venture bankers and client managers and 34 credit administration personnel. These individuals bring bench strength, strong industry relationships and decades of experience in lending to entrepreneurial companies and monitoring the performance of a venture banking loan portfolio.
Our ability to grow our business has been directly related to our ability to attract and retain experienced and qualified management, lenders and other employees with deep and broad ties to the entrepreneurial and venture capital communities. We have grown our employee base from 26 at inception in 2005 to 230 full-time equivalent employees at December 31, 2013. We expect that our position as one of only two commercial banks in the United States almost exclusively focused on the entrepreneurial and venture capital community will allow us to continue to attract qualified employees to support and enhance future organic growth.
Our Board of Directors. Our Board of Directors is comprised of former commercial bankers, venture bankers, representatives of private equity funds and venture capital firms, individuals involved in various aspects of business and a former government regulator. Several of our founders who serve on our Board of Directors, including Susan G. Casey, Robert S. Muehlenbeck, Daniel R. Mathis and Norman P. Creighton, previously worked together in various high-level executive positions at Imperial Bank, which was subsequently acquired by Comerica Bank. Collectively, they bring decades of experience in lending to the entrepreneurial and venture capital community. Our other board members bring years of experience in banking, venture capital, private equity and business.
Our culture. We are entrepreneurs serving entrepreneurs. Square 1 Bank was a de novo, start-up bank founded by a group of venture bankers who, as a founding team of 26 individuals, had decades of experience lending to entrepreneurial companies and the venture capital firms that fund such companies. We understand start-ups and entrepreneurial companies because we are such a company. As the venture capital community is constantly funding new companies, new opportunities are continually created for us to develop new client banking relationships by leveraging our knowledge of, and our commitment to, the entrepreneurial community as a bank that “gets it.” We believe we are well-positioned to continue our organic growth as one of the only other “pure play” commercial banks focused on the venture banking market and to continue to be entrepreneurial bankers serving the entrepreneurial community.
We believe that our highly-experienced management and banking team, our Board of Directors and our entrepreneurial culture are key to our success to date as well as to our continued success.
We have implemented a strong risk management platform.
Loan credit quality. We understand and have many years of experience in serving the entrepreneurial and venture capital communities. Credit quality is very important to our business and is a key focus of Square 1 Bank. Our lending activities are diversified over a large number of emerging growth companies in different sectors, particularly in the technology and life sciences areas, and which are in different stages of their development. Our borrowers are located in various technology centers across the country. We have invested significant resources to ensure our risk management is commensurate with our operating platform. We are in the process of upgrading our credit processes platform. We anticipate this upgrade will allow us to further scale our risk management practices and enhance our portfolio management tools as we grow.
We manage our credit risk exposure through credit controls including: (i) evaluation of credit applications, borrowers, collateral packages and liquidity, (ii) a detailed loan approval process and (iii) rigorous monitoring procedures with respect to our existing loan portfolio. Our regional managers and portfolio analysts monitor loan covenants on a daily basis, our borrowers’ performance on a monthly basis and each region’s portfolio quality on at least an annual basis. We maintain a sophisticated database that provides us with detailed loan performance information. We know our borrowers and work with them to monitor their progress and performance closely. We also know and work closely with the venture firms that fund our entrepreneurial clients. We have an internal credit risk rating system that is used to assess and monitor our credit risk, the performance of each loan and performance of our overall loan portfolio. Our risk managers review and confirm the credit risk rating of each borrower on at least a monthly basis. In addition, our Chief Credit Officer reports to our Board of Directors on a monthly basis on the performance of our loan portfolio and on the concentrations within that portfolio. We believe these credit controls and processes provide Square 1 Bank’s executive management with the tools necessary to adequately manage our loan portfolio. Our Directors’ Loan Committee is responsible for oversight of our credit management and lending practices and reports to our Board of Directors on our credit management and lending practices, including the quality of our loan portfolio.
37
Table of Contents
Investment portfolio. As a result of the low-cost deposits generated by our business model, we have funds in excess of those we lend to our borrowing clients, and maintain a significant securities portfolio of $1.1 billion as of December 31, 2013. This securities portfolio provides us with additional sources of income and liquidity. Our investment portfolio is managed by a team of highly-experienced officers and employees. Prior to 2009, management of our investment portfolio was outsourced to a third-party investment firm. At that time, our investment securities portfolio was highly concentrated in non-agency mortgage-backed securities which at the time of purchase were investment grade securities. We incurred significant losses as a result of the deterioration in the underlying loans in 2008, 2010 and 2011 on our investment portfolio due primarily to our investment in these pre-2008 non-agency mortgage-backed securities. We terminated our outsourcing relationship in 2008 and began managing our securities investments internally at that time. We believe that our active management of this portfolio has helped minimize our losses and positioned us to use our large securities portfolio to meet the sometimes unpredictable liquidity needs of our clients and to optimize yields.
We have strong brand and reputation in the entrepreneurial and venture capital/private equity community.
One of only two pure-play venture banks. We focus almost exclusively on the entrepreneurial and venture communities and are one of only two commercial banks that have such a focus. We pride ourselves on providing quality, high-touch service and believe that is one of our core strengths. We believe that clients welcome choice, and that we have developed a strong brand and market reputation within the entrepreneurial community which has enabled us to be a competitive force within this community. From inception, we have believed there is significant market opportunity for a high-quality and nimble alternative to Silicon Valley Bank, the only other commercial bank focused on, and with the largest share of the venture banking market, on which we focus. Given the industry and market in which we operate, and the specialized expertise in lending to venture-backed companies that is required to lend successfully in this market, we believe this market is generally underserved and, as such, provides us with an opportunity to continue our strong growth and profitability. We are still a young company, having only been in existence since August 2005, but believe that we have penetrated the venture banking market in all key entrepreneurial hubs in the United States. We have continued to add venture bankers and client managers in key markets, particularly during the last three years, including a total of over 15 bankers and client managers added in Silicon Valley, Boston, New York and the West Coast otherwise. These key hires have allowed us to further penetrate markets in which we believe there is significant opportunity for us to grow, and they complement our consistently strong presence in other markets such as the mid-Atlantic, Southeast, Texas and Colorado. We believe that our position as the only other “pure play” commercial bank serving the venture banking market provides substantial opportunity for us to continue our successful growth.
We also have strong relationships with more than 125 venture capital firms nationwide and intend to continue to deepen our relationships within this space. By capitalizing on the business and personal relationships that our senior bankers have in the entrepreneurial and venture communities, we believe that we are positioned to continue to grow our business and our client base. We expect to accomplish this by continuing to attract talented bankers and clients, growing and strengthening our relationships with entrepreneurs and venture firms and through growing organically.
Focus on the entrepreneurial community. We focus on entrepreneurial companies, primarily those that have received funding from venture firms, in the technology and life sciences sectors. In the technology sector, our clients tend to be in the software, hardware, Internet, telecommunications semiconductor, media and related industries. Our clients in the life sciences sector tend to be in the medical devices, healthcare services or biotechnology industries. We develop relationships with our clients at the early stages of their businesses and provide them complete solutions by offering them banking and financial services through our various banking groups and programs that will serve their borrowing, cash management and financial services needs as they grow and expand their businesses. We also target, through our Square Roots program, companies that are in the angel/seed stage of their development and that have not yet received venture capital financing. We generally offer deposit products and cash management services to these clients. Our goal is to continue to work with our Square Roots clients as they grow and expand their operations through the various growth stages and obtain venture financing. As our clients grow and have more extensive lending needs, we provide asset-based lending products and treasury management products and services.
Our deposit and loan portfolio includes entrepreneurial companies at all stages of their life cycles, as well as venture firms.
38
Table of Contents
The following table provides a summary of total loans outstanding, total unfunded loan commitments and deposit balance by stage and type at December 31, 2013 and 2012:
| (Dollars in thousands) | ||||||||||||||||||||||||
| At December 31, 2013 | ||||||||||||||||||||||||
| Loans Outstanding | Unfunded Loan Commitments |
Deposit Balances | ||||||||||||||||||||||
| Amount | Percent | Amount | Percent | Amount | Percent | |||||||||||||||||||
| (Dollars in thousands) | ||||||||||||||||||||||||
| Stage: |
||||||||||||||||||||||||
| Early |
$ | 146,096 | 13.44 | % | $ | 81,611 | 8.35 | % | $ | 730,511 | 34.68 | % | ||||||||||||
| Expansion |
590,511 | 54.32 | 299,898 | 30.69 | 746,032 | 35.41 | ||||||||||||||||||
| Late |
143,925 | 13.24 | 163,231 | 16.70 | 223,989 | 10.63 | ||||||||||||||||||
|
|
|
|
|
|
|
|
|
|
|
|
|
|||||||||||||
| Total portfolio company loans |
880,532 | 81.00 | 544,740 | 55.74 | 1,700,532 | 80.72 | ||||||||||||||||||
| Venture capital/private equity |
143,468 | 13.20 | 415,830 | 42.55 | 405,870 | 19.26 | ||||||||||||||||||
| SBA and USDA |
51,510 | 4.74 | 2,388 | 0.25 | 325 | 0.02 | ||||||||||||||||||
| Credit cards |
11,575 | 1.06 | 14,304 | 1.46 | — | — | ||||||||||||||||||
|
|
|
|
|
|
|
|
|
|
|
|
|
|||||||||||||
| Total |
1,087,085 | 100.00 | % | $ | 977,262 | 100.00 | % | $ | 2,106,727 | 100.00 | % | |||||||||||||
|
|
|
|
|
|
|
|
|
|
|
|||||||||||||||
| Less unearned income |
(4,549 | ) | ||||||||||||||||||||||
|
|
|
|||||||||||||||||||||||
| Total loans, net of unearned income |
$ | 1,082,536 | ||||||||||||||||||||||
|
|
|
|||||||||||||||||||||||
| At December 31, 2012 | ||||||||||||||||||||||||
| Loans Outstanding | Unfunded Loan Commitments |
Deposit Balances | ||||||||||||||||||||||
| Amount | Percent | Amount | Percent | Amount | Percent | |||||||||||||||||||
| (Dollars in thousands) | ||||||||||||||||||||||||
| Stage: |
||||||||||||||||||||||||
| Early |
$ | 90,833 | 10.48 | % | $ | 30,478 | 4.11 | % | $ | 410,891 | 27.04 | % | ||||||||||||
| Expansion |
492,912 | 56.84 | 254,184 | 34.29 | 619,046 | 40.75 | ||||||||||||||||||
| Late |
107,787 | 12.43 | 112,500 | 15.18 | 118,226 | 7.78 | ||||||||||||||||||
|
|
|
|
|
|
|
|
|
|
|
|
|
|||||||||||||
| Total portfolio company loans |
$ | 691,532 | 79.75 | % | 397,162 | 53.58 | 1,148,163 | 75.57 | ||||||||||||||||
| Venture capital/private equity |
132,621 | 15.29 | 329,973 | 44.52 | 370,926 | 24.41 | ||||||||||||||||||
| SBA and USDA |
35,276 | 4.07 | 4,858 | 0.66 | 240 | 0.02 | ||||||||||||||||||
| Credit cards |
7,693 | 0.89 | 9,239 | 1.24 | — | — | ||||||||||||||||||
|
|
|
|
|
|
|
|
|
|
|
|
|
|||||||||||||
| Total |
$ | 867,122 | 100.00 | % | $ | 741,232 | 100.00 | % | $ | 1,519,329 | 100.00 | % | ||||||||||||
|
|
|
|
|
|
|
|
|
|
|
|||||||||||||||
| Less unearned income |
(4,041 | ) | ||||||||||||||||||||||
|
|
|
|||||||||||||||||||||||
| Total loans, net of unearned income |
$ | 863,081 | ||||||||||||||||||||||
|
|
|
|||||||||||||||||||||||
Our Operating Strategy
Our strategic focus is on continuing to build market share and strong revenues complemented by operational efficiencies and personalized, high-touch service, which we believe will produce attractive risk-adjusted returns for our shareholders. Our business model focuses on a relationship-based, venture banking structure guided by the following principles: disciplined risk management; responsive, personalized, high-touch service; focus on building long-term relationships in the entrepreneurial and venture capital/private equity communities; and innovation, creativity, flexibility and efficiency in delivering our products and services. We value our flexible organizational structure and strong risk management culture and believe that the level of market knowledge acquired by our management team and senior bankers over their many years of experience as venture bankers and our personalized, high-touch customer service differentiates us from our competitors. We believe that focusing on these principles enables us to expand our capabilities for providing banking and financial products and services to both entrepreneurial companies and the venture firms that fund such companies and continue to generate steady, long-term growth.
Our organizational culture is focused on providing products and services that meet our clients’ needs in a way that leads to increased depth of relationships, enhanced long-term profitability, client referral and exceptional customer retention. A
39
Table of Contents
key aspect of this philosophy is a clear understanding of a differentiation of service value for our clients. Our client managers, bankers and client service representatives work closely with our clients from inception and are responsible for maintaining the client relationship. We believe our clients prefer this type of highly personalized, high-touch service. We believe that delivering our products and services in this manner leads to successful outcomes for our clients and contributes to retention of our clients over their various life stages.
Our success in quickly raising new capital has contributed to our ability to grow since our inception. Over the past four years, we have completed several private offerings of our capital stock, raising an aggregate of $72.0 million of common equity from private investors, to provide us the necessary capital to continue to implement our strategic plan, enhance our capital and support our growth. We believe that the proceeds from this offering and the improved access to the capital markets afforded us as a public company will enhance our ability to continue to grow our client base and our business.
With these principles in mind, we intend to pursue the following core strategies for our organization:
Growing our core deposits, which are integrally tied to the growth in our venture firm and portfolio company clients, and prudently managing deposit volatility. We commenced operations as a de novo commercial bank in August 2005. All of our deposit growth since inception has been organic and is primarily focused on the entrepreneurial and venture capital communities. Our growth in core deposits is integrally tied to the growth in our loan portfolio. We almost always require our venture-backed clients with whom we have a lending relationship to maintain their deposits with Square 1 Bank. We do not solicit conventional retail deposits.
As of December 31, 2013, 65.5% of our deposit portfolio consisted of noninterest-bearing demand deposit accounts, and therefore these deposits provide us with a low-cost source of funds. We tend to have volatility in our deposit portfolio due to, among other things, venture capital funding and disbursement patterns and portfolio company burn rates. We have tools in place to manage this volatility, including variable pricing and the use of off-balance sheet solutions for managing deposit growth. As we continue to penetrate deeper into the entrepreneurial and venture capital communities we serve and leverage existing relationships, we believe our loan portfolio, and therefore our deposits, will continue to grow. At December 31, 2013, we had $2.1 billion of deposits, an increase of 107.1% from $1.0 billion in deposits at December 31, 2009 and on those same dates had $557.9 million and $349.0 million, respectively, in client investment funds.
Leveraging the strong relationships and reputations of our venture bankers to continue to grow and build our presence in our existing and target markets. We believe that the long-term relationships that our venture bankers and client managers have with the entrepreneurial and venture capital communities, coupled with our reputation for personalized, high-touch service, have been a critical factor in the growth of our loan and deposit portfolios and will continue to be so in the future.
Continuing to grow our loan portfolio while maintaining excellent credit quality. Our loan portfolio has grown consistently since we commenced operations in 2005. Over the years, we have expanded our lending products to include asset-based loans, which increased our ability to lend to expansion and late stage companies, SBA and USDA loans, and credit cards. At December 31, 2013, we had $1.1 billion in our loan portfolio, an increase of 137.1% from December 31, 2009 when our loan portfolio was $456.6 million. The composition of our loan portfolio, as well as the industry segment concentrations, have changed over time. Our technology segment has decreased from 62.8% of our loan portfolio at December 31, 2009 to 45.4% as of December 31, 2013, while life sciences has increased from 15.9% to 18.3% of our loan portfolio over the same period. Asset-based loans, including accounts receivable-based lines of credit, which are provided across the industry segments we serve, have grown to comprise 17.2% of our loan portfolio as of December 31, 2013. We expect that our portfolio of asset-based loans, particularly accounts receivable-based lines of credit, will increase over time organically as well as through our acquisition of Sand Hill Finance, LLC, a factoring company, which closed on December 31, 2013.
We have maintained a track record of sound credit quality from inception. Our highest annual rate of net loan charge-offs to average loans over the past five years, 2009 through 2013, was 1.94% in 2009. At December 31, 2013, our ratio of nonperforming loans to total loans was 1.34%, and our annualized net charge-off ratio was 0.95%. We intend to continue to focus on maintaining strong credit quality. We believe that our strong credit culture and asset quality levels will allow us to continue to grow and that our operating platform will allow us to manage that growth effectively and efficiently, while maintaining the quality of our loan portfolio.
Continuing to provide personalized, high-touch service to our clients. Square 1 Bank was organized to operate in a manner that was different from that of larger, traditional commercial banks. From the outset, we sought and found
40
Table of Contents
experienced bankers who were driven by an entrepreneur’s motivation to serve the entrepreneurial and venture capital/private equity community in a manner that was smart and responsive, adaptive and flexible, accessible and provided “high-touch,” personalized service. We believe our approach to client service distinguishes us from our competitors and we intend to continue our emphasis on providing personalize, high-touch service.
Expanding and growing our noninterest income and relationship profitability. We generate noninterest income, which provides revenue diversification, from fees charged to our clients for foreign exchange transactions, credit cards, service charges, loan documentation fees and letters of credit. We intend to continue our focus on growing our noninterest income. Our noninterest income represented 24.6% of our revenue in fiscal year 2013.
Prudently and conservatively managing our strong deposit flows. As a result of the significant low-cost deposits generated by the venture banking business model, we have funds in excess of those we lend to our borrowing clients. Certain vehicles, including those offered by Square 1 Asset Management, allow us to shift certain deposits off-balance sheet by offering clients alternative investments for their funds. We invest the funds that remain on our balance sheet in securities in accordance with our investment policies and procedures.
There are no assurances that we will be able to successfully implement our business strategy or that we will achieve our strategic goals on projected growth.
Competition
We operate in the United States where financial services are highly competitive. Our competitors include other banks, venture debt funds, specialty and diversified finance companies and investment advisory firms. Our primary competitors are those financial institutions that specialize in venture banking and venture debt. There is only one other pure play commercial bank that serves our market, Silicon Valley Bank, and we compete with them on an ongoing basis in all of the markets we serve. In addition to Silicon Valley Bank, there are several other commercial banks that serve the venture banking market but are not focused primarily on this market. These financial institutions include Comerica, City National Bank, First Republic Bank and Bridge Bank. Other lending competitors also include various debt funds and other specialty and diversified finance companies.
For the venture banking market, lending products are the most significant competitive factor among the financial institutions that serve the venture banking market. Not all commercial banks have credit models that allow for lending to companies that are in a pre-revenue or pre-profit stage. Our main competitors that do have expertise in this market understand how to lend in this market, and compete aggressively for market share. These competitors may choose to relax loan structure covenants, reduce interest rates, lower fees, or offer higher loan amounts than that which we can offer. In particular, financial institutions with greater equity can offer higher loan amounts to later stage companies than we can offer. Venture debt funds are a class of both competitors and partners. These funds may be able to offer fewer covenants, longer terms and higher loan amounts than we generally offer, and price their loans higher than loans we offer. While we do compete with venture debt funds, in certain situations we may partner with these firms to provide a larger partnered loan facility in which we generally take either a senior or pari-passu lien position.
Another competitive differentiator in our market is the level of expertise and service provided by a financial institution, including the expertise to structure loans and provide treasury management services, while also providing personalized service. Based on our experience, many of our competitors are organized to provide efficient, albeit impersonal, approaches to serving the market that are generally not as personalized as the services we provide. Other competitive factors include the knowledge of the venture capital environment, and a network of, or relationships with, venture capital firms, professional services providers, and incubators. For start-up or early stage companies, often times they need advice on ways to facilitate connections to capital and ideas. To capitalize on this need, we have established our Square Roots program to provide consulting, services, and networking for start-up companies that may eventually seek venture capital investments.
With respect to non-lending products such as deposits, treasury management services, and foreign exchange, we also compete with national, regional, and local commercial banks. Such banks are frequently larger financial institutions than we are that have benefits of scale, and can often offer more attractive prices and features than those we can offer. However, we believe our full spectrum of banking services, delivered in a personalized, high-touch manner, allows us to compete favorably in all of our markets. Although the competition in our markets is strong, we believe our breadth of products, our experience and our personalized, high-touch service combined with our focus on the venture community will continue to provide us with growth opportunities in the venture banking market.
41
Table of Contents
Lending Activities
Our primary lending focus is to serve the entrepreneurial community and the venture capital firms that fund the entrepreneurial community.
We target our business development and marketing strategy primarily on entrepreneurs, venture-backed entrepreneurial companies and venture firms. Venture firms are a key referral source for new relationships with entrepreneurial companies. Our venture bankers and client managers actively solicit the business of entrepreneurial companies within our industry segments and the business of the venture capital firms that fund such companies. Our venture bankers who lead our regional teams bring years of experience and extensive relationships with the entrepreneurial and venture capital communities. We seek to attract new lending clients through personalized, high-touch service, relationship networks with venture capital firms and their portfolio companies, innovative and flexible structures and competitive pricing.
We offer a full array of commercial lending products to serve the needs of our clients. These products include traditional commercial loans, revolving lines of credit, equipment loans, asset-based loans, credit cards and capital call loans. We focus our lending activities in the technology and life sciences industries, and in the venture capital community. In connection with the negotiation of credit facilities, we often receive warrants which grant us rights to acquire stock of our clients, primarily those that are privately-held, venture-backed companies in the life sciences and technology industries. We do a financial review and analysis of a client’s products, markets and risks, in addition to a financial review, as part of our underwriting process.
The terms of the credit facilities we provide to our clients vary by type of loan product, loan size and growth stage of the client and underlying collateral. We provide commercial term loans and lines of credit to venture-backed companies in the technology and life sciences sectors, with loan terms of between 12 and 48 months. These loans are typically made to companies in various stages of a start-up lifecycle. If the company is in an early stage company, the primary source of repayment is the venture investment round held in deposit accounts with us. If the company is a late stage company, the primary source of repayment may also include operating cash flows. The ratio of total deposits to loan commitments for early, expansion and late stage companies that have lending relationships with us were 320.8%, 83.8% and 72.9%, respectively, at December 31, 2013. Although we do not maintain minimum balance requirements or otherwise restrict the deposits of our borrowers, we do have financial covenants which may require the company to maintain certain levels of cash or liquidity. In cases involving venture-backed companies, we also take into account the strength of the venture firm(s) funding such companies. Commercial loans that we originate are generally secured by all corporate assets of the borrower, which may include accounts receivable, inventory equipment and intellectual property, and may also include personal guarantees. Loans originated by our asset-based lending group are typically structured as revolving lines of credit and advances are based on a formula tied to accounts receivable or other assets. Our asset-based loans are typically made to expansion and late stage companies. The primary source of repayment for asset-based loans is typically operating cash flow of the client. Separately, we provide SBA and USDA loans to certain of our clients.
We provide secured and unsecured capital call lines and management company lines of credit to venture capital and private equity firms, which generally use bank debt for capital efficiency, to cover short-term cash needs between capital calls or to smooth cash flows for one of their investments prior to sale. Loans made to venture capital and private equity firms may also be for the purpose of covering leasehold improvements or fundraising expenses. The primary sources of repayment for these loans are capital contributions from the firm’s limited partners, management fees, and a secondary source of repayment is generally the liquidation of the fund’s assets (i.e., their portfolio companies).
We offer credit cards, generally secured by client deposit accounts at Square 1 Bank, but also, occasionally offered as a sublimit under a line of credit, to our clients in all industry segments. The limits extended to clients are usually taken out of total credit facilities offered to the client, and, as a result, the repayment sources are the same as those credit facilities. We earn interest income on our credit card portfolio based on outstanding balances and interchange fee income based on total transaction amounts. Our credit card clients generally pay off their balances each month.
We also provide real estate secured, government-guaranteed loans through the SBA and USDA programs, with maturities of 20 years or more, and construction loans, which convert into real estate SBA and USDA loans upon completion of the construction, the terms of which are generally 12 months or less. In certain cases, we sell the guaranteed portion of SBA loans originated by us on the secondary SBA market, which serves to reduce the amount of our outstanding loan balances and results in a gain on sale and fee income for us. As of December 31, 2013, we had $51.5 million of SBA/USDA loans outstanding.
42
Table of Contents
Credit Policy and Procedures
General. We maintain and adhere to what we believe are disciplined underwriting standards, taking into account the credit needs of our clients and, at the same time, providing flexible loan solutions in a highly responsive, timely and efficient manner.
We seek to maintain a broadly diversified loan portfolio across the industries and geographies we serve within the entrepreneurial and venture capital communities. We strive to balance credit quality and soundness of capital with profitability and managed growth. These components, together with active credit management, are the foundation of our credit culture, which we believe is critical to enhancing the long-term value of our organization to our clients, employees, shareholders and communities.
We have an entrepreneurial-focused, service-driven, relationship-based credit culture, rather than a price-driven, transaction-based culture. We are primarily focused on the entrepreneurial and venture capital communities and we understand the credit needs of those communities and the risks associated with providing credit facilities to entrepreneurial companies at various stages of growth. We have key credit guidelines that are followed by our management team in originating credit facilities, with deviations to those guidelines monitored and tracked by our credit administration division and our Chief Credit Officer, and reported to our Directors’ Loan Committee on a monthly basis.
Credit concentrations. In connection with the management of our credit portfolio, we actively manage the composition of our loan portfolio, including industry segment concentrations, which are measured as a percentage of our risk-based capital. The credit profile of our clients varies depending on the stage of growth and the industry segment. Our loan approval policies establish concentrations limits with respect to industry segments, growth stage and loan product type to enhance portfolio diversification. These limits are reviewed annually as part of our annual review of our credit policy and program. In general, loan concentration levels are monitored on a monthly basis, and our industry segment, loan product type, growth stage and geographical concentrations are monitored monthly by our credit administration division and our Chief Credit Officer, and reported monthly to the Directors’ Loan Committee.
We also manage concentration of credit to individual borrowers and our overall exposure to large loan commitments and outstandings in excess of certain set percentages of total outstanding loans and commitments. These limits are reviewed and ratified at least annually by our Directors’ Loan Committee and the Board of Directors of Square 1 Bank.
Loan approval process. We seek to achieve an appropriate balance between prudent, disciplined underwriting, on the one hand, and innovation, flexibility in our decision-making and responsiveness to our clients, on the other hand. Our Directors’ Loan Committee has the authority to approve loans up to Square 1 Bank’s legal lending limit, which was $31.9 million as of December 31, 2013 and will increase following the offering due to the additional capital raised in the offering. Consistent with that authority, the Directors’ Loan Committee has delegated approval authority for certain credit actions and types of loans, subject to the level of total potential liability for a borrower, to our Chief Credit Officer. Our Chief Credit Officer, in turn has delegated certain lending authority to risk managers and senior management, based on position, capability and experience. In addition, approval authority has been delegated to certain loan committees for larger loan exposures and adversely rated credits. The Bank Loan Committee is comprised of all the risk managers and the Senior Loan Committee is comprised of all the risk managers and the Chief Credit Officer. All adversely graded credits must be approved by the Risk Control Committee which is comprised of the Chief Credit Officer, the risk managers, the special assets officer and certain other members of management. These delegations and authorities are reviewed and ratified at least annually by our Directors’ Loan Committee and the Board of Directors of Square 1 Bank. The Directors’ Loan Committee and the Board of Directors reviews and approves all delegated credit actions on a monthly basis. We believe that our credit approval process provides for thorough underwriting and efficient decision making.
Credit risk management. Credit risk management involves a partnership between our venture bankers, client managers and our credit approval, credit administration and collections personnel. It is the policy of Square 1 Bank to assign risk ratings to all credit facilities using our internal credit risk rating system. We assign each individual loan a credit risk rating of 1 through 7. Loans rated 1 through 3.5 are performing loans that we rate internally as “Pass.” Loans rated 1 are in the highest category and are adequately secured by deposits in Square 1 Bank or securities. Loans rated 4 are special mention and have potential weaknesses that require increased management attention. Loan rated 5 through 7 are generally loans for which one or more weaknesses exist and with respect to which we believe we may incur a loss. Some loans rated 5 may still be considered “performing (criticized)” due to the unique profile of our borrowers. While we will downgrade a loan displaying
43
Table of Contents
certain weaknesses, many early and expansion stage companies will continue to make scheduled interest and principal payments while we work with them to restructure their equity financing and/or sell the business. All nonperforming 5 rated loans are considered impaired. Our venture bankers are responsible for recommending the appropriate credit risk rating on all credit facilities but the rating is approved as part of the loan approval process and is monitored as part of the overall credit review process. Our venture bankers are also responsible for recommending changes, where appropriate, to a credit risk rating based on any change in the credit relationship with our clients whether financial or not, regardless of whether a credit action is requested. Loans that exhibit signs of credit weakness are handled by our special assets division. Each of our regional managers and venture bankers are held accountable for the loans made by them and our regional managers are held accountable for loans made by the venture bankers under their supervision.
Given the nature of the entrepreneurial companies we serve, which are primarily venture-backed companies, the need to make modifications or amendments to our credit facilities are typical over the course of the term of a loan. It is not unusual for our clients’ business plans to change as they recognize the realities of bringing their products to market, as economic conditions change and as new or different business opportunities arise. Because we have alternative sources of payments other than operations for many of our venture-backed clients, we often make adjustments to our credit underwriting as our clients’ sources of repayment change over time.
We review compliance with financial and other loan covenants on a daily basis. Risk managers conduct monthly portfolio reviews with each region to assess the accuracy of credit risk ratings and identify potential problem loans. We conduct monthly administrative meetings of the Risk Control Committee, at which adversely rated loans and our strategy for managing those credits are reviewed. Annually, or more frequently as required, our Chief Credit Officer conducts portfolio reviews for each of our regions. Our regional managers, client managers and bankers are responsible for the loans they originate and we believe that motivates them to focus on high quality credit consistent with our strategic focus on credit quality.
Our policies and procedures are designed to provide us with rapid notification of potential credit quality problems and to enable us to take prompt action on troubled credit facilities. We have established risk tolerance levels based on asset quality ratios against which we measure the credit quality of our loan portfolio. Our credit administration division reports on a monthly basis to our Directors’ Loan Committee and our Board the performance of our loan portfolio against our established risk tolerance levels.
Our credit administration division provides monthly reporting on all loans that are criticized or classified to the Directors’ Loan Committee and the Board of Directors of Square 1 Bank for their review. This review includes an evaluation of a client’s business prospects, its financial condition, venture financing, the underlying collateral, the level of reserves required and loan accrual status. Additionally, we have an independent, third-party review performed on our credit risk ratings and our credit administration functions at least annually. Management reviews these reports and the Chief Credit Officer presents them to the Directors’ Loan Committee, the Audit Committee and the Board of Directors. These third-party procedures provide management with additional information for assessing our asset quality.
Deposits
Deposits are our primary source of liquid funds to support our earning assets. Unlike most commercial banks, the venture banking model contemplates that our borrowing customers will provide a significant majority of our deposits as our lending customers are almost always required to maintain significant cash balances in deposit accounts at Square 1 Bank. We do not obtain deposits from conventional retail sources. Our deposits provide us with a source of low-cost funding. Our deposits are also subject to volatility due to the unique nature of venture banking such as the timing of venture capital funding and portfolio company burn rates. We offer traditional depository products, including checking, money market and certificates of deposit with a variety of rates. Deposits at Square 1 Bank are insured by the FDIC up to statutory limits.
We price our interest-bearing deposit products based on a variety of factors, including current market conditions, changes in market interest rates, competition within our sector, regulatory requirements and our asset-liability management needs.
Client Investment Funds
We have a strong liquidity position given our venture banking model. We utilize alternative cash investment vehicles to manage our on-balance sheet deposit growth, which tends to be volatile as is typical in the market in which we operate. At
44
Table of Contents
December 31, 2013, we had $557.9 million in client investment funds, an increase from $349.0 million at December 31, 2009. To accomplish this, we offer our clients alternative cash investment vehicles such as sweep accounts and investment in the Certificates of Deposit Account Registry Service (“CDARS”), the latter of which allows us to place client deposits in one or more insured depository institutions. In April 2013, we formed Square 1 Asset Management, a wholly-owned subsidiary of Square 1 Bank, and a registered investment adviser, to allow us to directly provide cash management solutions for our clients and the market we serve. Square 1 Asset Management offers customized solutions to our clients that are tailored to meet the unique corporate cash management needs of entrepreneurial companies and venture firms. As of December 31, 2013, we had $108.1 million of assets under management. We expect to continue to manage our on-balance sheet deposit growth through these alternative investment vehicles for our clients and to grow the amount of assets under management by Square 1 Asset Management as we offer this service to both our existing clients and new clients. As a result, we expect to generate additional noninterest income from these sources in the future.
Investments
Due to the deposits generated by the venture banking model, our investment portfolio at times may be larger than our loan portfolio. We manage our investment portfolio primarily to address asset/liability strategies as well as to optimize portfolio yield over the long term in a manner that is consistent with liquidity needs. It is our policy only to invest in investment securities that are government guaranteed, agency-backed or rated investment grade by a nationally recognized statistical rating organization. The types of securities we purchase are based on our current and projected liquidity position as well as relative value among approved asset classes. Since the fourth quarter of 2011, we have increased our investment in corporate bonds, primarily with floating coupons, for the purpose of minimizing market value risk and diversifying the portfolio.
The majority of our investment portfolio is classified as available-for-sale and can be used for meeting unforeseen liquidity needs. Our investments are comprised of a variety of high-grade securities, including government agency securities, government guaranteed mortgage-backed securities, highly rated corporate bonds, SBA pools, municipal securities and other asset-backed securities. Our portfolio maturity and concentration mix is designed to ensure that our liquidity needs are met, including sufficient liquidity to meet anticipated loan increases, deposit decreases and a reserve to meet unexpected liquidity demands. We regularly evaluate the performance and the composition of our investment portfolio as changes in market conditions may necessitate a repositioning of our investment portfolio. It is predominantly our intention not to sell investment securities unless we determine to change our mix of investments to manage interest rate risk, although we may sell investment securities from time to time, under certain circumstances.
The investment policy is reviewed annually by the Board of Directors of Square 1 Bank. Overall investment goals are established by the Board of Directors, the Board Asset/Liability Committee, the Chief Financial Officer and the Asset/Liability Committee of Square 1 Bank. The Board of Directors has delegated the responsibility of monitoring our investment activities to the Asset/Liability Committee of Square 1 Bank, which is a management committee. Day-to-day activities pertaining to the investment portfolio are conducted within our treasury department under the supervision of our Chief Financial Officer.
Enterprise Risk Management
We place significant emphasis on risk mitigation as an integral component of our organizational culture. We have an Enterprise Risk Committee comprised of our executive management team and other senior members of our team which meets monthly to discuss our risk management. Risk management with respect to our lending philosophy focuses, among other things, our strong underwriting undertaken by an experienced Chief Credit Officer, our venture bankers and risk managers. Our risk mitigation techniques include loan and credit administration reviews by an independent third party that reports directly to the Audit Committee of our Board of Directors and a credit risk rating system applied to all our credit facilities, including a process for monitoring those relationships that have higher credit risk ratings and implementing corrective measures on a timely basis to avoid or minimize losses.
We also focus on risk management in numerous other areas throughout our organization, including asset/liability management, investments, liquidity, international operations, corporate governance, allowance for loan and lease losses, information technology, operations, human resources, regulatory compliance and legal and have regular reviews by an independent third party of our internal controls in these areas. We have implemented an extensive asset/liability management process, use a simulation model to perform sensitivity analysis on the economic value of equity and the impact of changes in
45
Table of Contents
market interest rates on our net interest income and use and independent, reputable third party to validate the reasonableness of our assumptions and results.
Although, as a non-public company we have not been subject to the Sarbanes-Oxley Act, we have begun to implement management assessment and testing of internal controls consistent with the Sarbanes-Oxley Act and have engaged an experienced independent public accounting firm to assist us with respect to compliance and to review and assess our controls with respect to technology, as well as to perform penetration testing to assist us in managing the risks associated with information security.
Employees
As of December 31, 2013, we had 230 full-time equivalent employees. None of our employees are represented by any collective bargaining unit or are parties to a collective bargaining agreement. We believe that our relations with our employees are good.
Properties
Our main office is located at 406 Blackwell Street, Suite 240, Durham, North Carolina. We lease our main office and also lease office space for our eleven loan production offices.
| Lease Expiration | ||||
| Headquarters/Branch: |
||||
| Durham, NC |
1/31/2018 | |||
| Loan Production Offices: |
||||
| Aliso Viejo, CA (Orange County market) |
||||
| Austin, TX |
6/30/2017 | |||
| Campbell, CA |
10/31/2015 | |||
| Waltham, MA (Boston market) |
12/31/2015 | |||
| Denver, CO |
10/31/2017 | |||
| Santa Monica, CA (Los Angeles market) |
11/30/2016 | |||
| New York, NY |
8/30/2014 | |||
| San Diego, CA |
12/31/2015 | |||
| Seattle, WA |
12/31/2015 | |||
| Menlo Park, CA (Silicon Valley) |
1/31/2016 | |||
| Chevy Chase, MD (Washington, DC market) |
12/31/2014 | |||
Legal Proceedings
On November 22, 2013, we filed a complaint in the U.S. District Court in the Middle District of North Carolina, demanding injunctive relief to block CommunityOne Bancorp from further use of its logo, along with monetary damages. Our complaint alleges that CommunityOne Bancorp’s newly-adopted logo is nearly identical to our mark and amounts to trademark infringement, as we currently own multiple U.S. registrations for our logo. The complaint further alleges that given the two companies’ presence in the same industry, CommunityOne Bancorp’s use of the logo is likely to cause confusion and to deceive the public as to the source, origin, or sponsorship of the products and services offered by CommunityOne Bancorp.
We are party to other legal actions that are routine and incidental to our business. In management’s opinion, the outcome of these matters, individually or in the aggregate, will not have a material effect on our results of operations or financial position.
Subsidiaries
In addition to Square 1 Bank, the only other subsidiary of Square 1 Financial is Square 1 Ventures, LLC, which was formed in 2007 to manage a fund-of-funds focused on venture capital firms.
46
Table of Contents
MANAGEMENT’S DISCUSSION AND ANALYSIS OF
FINANCIAL CONDITION AND RESULTS OF OPERATIONS
The objective of this section is to help potential investors understand our views on our results of operations and financial condition. You should read this discussion in conjunction with the consolidated balance sheets as of December 31, 2013 and 2012, and the related consolidated statements of operations and comprehensive income, changes in shareholders’ equity, and cash flows for each of the years in the three-year period ended December 31, 2013, that appear at the end of this prospectus.
Critical Accounting Policies and Estimates
We prepared our consolidated financial statements in accordance with GAAP. In doing so, we made certain estimates that were critical in nature to our financial condition and results of operations as they require us to make especially difficult, subjective and/or complex judgments about matters that are inherently uncertain and because it is likely that materially different amounts would be reported using different conditions and assumptions. The following discusses the accounting policies and estimates that are subject to the greatest amount of subjectivity and may have a material impact on our financial results. We have discussed the development and selection of these critical accounting policies and estimates with the Audit Committee of our Board of Directors.
Allowance for Loan Losses. The allowance for loan losses is management’s estimate of credit losses inherent in the loan portfolio at the balance sheet date. We consider our accounting policy for the allowance for loan losses to be critical as this allowance is subject to significant near term changes and its estimation requires us to make material estimates. We make forecasts that are highly uncertain and require a high degree of judgment in order to determine the allowance for loan losses. Our loan loss reserve methodology is applied by us to our loan portfolio and we maintain the reserve at an amount that management believes will be adequate to absorb probable losses inherent in the portfolio, based on evaluations of the collectability of loans.
A loan is considered impaired, based on current information and events, if it is probable that the Bank will be unable to collect the scheduled payments of principal and interest when due according to the contractual terms of the loan agreement. We apply a systematic process for the evaluation of individual loans and pools of loans for inherent risk of loan losses. Uncollateralized loans are measured for impairment based on the present value of expected future cash flows discounted at the historical effective interest rate, while all collateral-dependent loans are measured for impairment based on the fair value of the collateral.
The Bank uses several factors in determining if a loan is impaired. The internal asset classification procedures include a thorough review of significant loans and lending relationships, as well as the accumulation of related data. This data includes loan payment status, borrowers’ financial data and borrowers’ operating factors such as cash flows and operating income or loss. It is possible that these factors and management’s evaluation of the adequacy of the allowance for loan losses will change.
The allowance for loan losses is established through a provision for loan losses charged to expense. Loans are charged against the allowance for loan losses when management believes that the collectability of the principal is unlikely. The evaluations take into consideration such factors as changes in the nature and volume of the loan portfolio, overall portfolio quality, review of specific problem loans, and current economic conditions and trends that may affect the borrower’s ability to pay.
The allowance for loan losses is based on a formula allocation for similarly risk-rated loans and individually for impaired loans. The formula allocation is determined on a monthly basis by utilizing a historical loan loss migration model, which is a statistical model used to estimate an appropriate allowance for outstanding loan balances by calculating the likelihood of a loan being charged-off based on its credit risk rating using historical loan performance data from our portfolio. The historical loan loss migration statistical model utilizes loss history over the trailing six-month period, over the trailing twelve-month period and since Square 1 Bank’s adoption of its allowance methodology. These three loss rates are annualized and averaged equally to provide a charge-off rate that is reflective of both current market conditions and the cumulative experience of Square 1 Bank. This average rate is then applied using three methodologies that are based on industry, stage of company and structure of debt. An allowance for loan losses is calculated using each of these methodologies. The results of the three calculations are then averaged for each risk-rating category and applied to the respective period-end client loan balances for each corresponding risk-rating category in order to provide an estimation of the
47
Table of Contents
aggregate allowance for loan losses. Equal weighting is given to each historical time frame and to each methodology, and is applied across all loan categories. The application of these methodologies has been applied consistently for all periods presented in this prospectus.
Square 1 Bank applies qualitative allocations to the results we obtained through our historical loan loss migration model to ascertain the total allowance for loan losses. These qualitative allocations are based upon management’s assessment of the risks that may lead to a loan loss experience different from our historical loan loss experience. These risks are aggregated to become our qualitative allocation. Based on management’s prediction or estimate of changing risks in the lending environment, the qualitative allocation may vary significantly from period to period and includes, but is not limited to, consideration of the following factors:
| • | changes in lending policies and procedures, including underwriting standards and collections, and charge-off and recovery practices; |
| • | changes in national and local economic business conditions, including the market and economic condition of our clients’ industry sectors; |
| • | changes in the nature of our loan portfolio; |
| • | changes in experience, ability, and depth of lending management and staff; |
| • | changes in the trend of the volume and severity of past due and classified loans; |
| • | changes in the trend of the volume of nonaccrual loans, troubled debt restructurings, and other loan modifications; and |
| • | other factors as determined by management from time to time. |
The Bank will generally charge off a loan when it determines that the loan is uncollectible, meaning that all economically sensible means of recovery have been exhausted. Charge offs are approved by the Chief Credit Officer or designee.
For further information, see Notes 2 and 4 to the consolidated financial statements appearing elsewhere in this prospectus.
Fair Value Measurements. We use fair value measurements to record fair value for certain financial instruments and to determine fair value disclosures. Available for sale securities and derivative instruments are financial instruments recorded at fair value on a recurring basis. We make estimates regarding valuation of assets and liabilities measured at fair value in preparing our consolidated financial statements. We disclose our method and approach for fair value measurements of assets and liabilities in Notes 2 and 17 to the consolidated financial statements appearing elsewhere in this prospectus.
Accounting Standards Codification (“ASC”) 820, Fair Value Measurements and Disclosures, defines fair value as the price that would be received to sell an asset or paid to transfer a liability (the “exit price”) in an orderly transaction between market participants at the measurement date. Fair value is a market-based measurement considered from the perspective of a market participant who holds the asset or owes the liability rather than an entity-specific measurement.
ASC 820 establishes a three-level hierarchy for disclosure of assets and liabilities recorded at fair value. The classification of assets and liabilities within the hierarchy is based on whether the inputs to the valuation methodology used for measurement are observable or unobservable. Observable inputs reflect market-derived or market-based information obtained from independent sources, while unobservable inputs reflect our estimates about market data. The three levels for measuring fair value are defined in Note 2 to the consolidated financial statements appearing elsewhere in this prospectus.
It is our practice to maximize the use of observable inputs and minimize the use of unobservable inputs when developing fair value measurements. When available, we use quoted market prices to measure fair value. For inactive markets, there is little information, if any, to evaluate if individual transactions are orderly. Accordingly, we are required to estimate, based upon all available facts and circumstances, the degree to which orderly transactions are occurring. Price quotes based upon transactions that are not orderly are not considered to be determinative of fair value and are given little, if any, weight in measuring fair value. Price quotes based upon transactions that are orderly are considered in determining fair value, with the weight given based upon the facts and circumstances. If sufficient information is not available to determine if price quotes are based upon orderly transactions, less weight is given to the price quote relative to other transactions that are known to be orderly. In certain cases, the inputs used to measure fair value may fall into different levels of the fair value
48
Table of Contents
hierarchy. In such cases, for disclosure purposes the level in the fair value hierarchy within which the fair value measurement is determined is based on the lowest level input that is significant to the fair value measurement in its entirety.
Fair values are based on estimates or calculations at the transaction level using present value techniques in instances where quoted market prices are not available. Because broadly traded markets do not exist for many of our financial instruments, the fair value calculations attempt to incorporate the effect of current market conditions at a specific time. Fair valuations are management’s estimates of the values, and they are calculated based on indicator prices corroborated by observable market quotes or pricing models, the economic and competitive environment, the characteristics of the financial instruments, expected losses, and other such factors.
These calculations are subjective in nature, involve uncertainties and matters of significant judgment, and do not include tax ramifications; therefore, the results cannot be determined with precision or substantiated by comparison to independent markets, and they may not be realized in an actual sale or immediate settlement of the instruments. There may be inherent weaknesses in any calculation technique, and changes in the underlying assumptions used, including discount rates and estimates of future cash flows, could significantly affect the results. Our valuation processes include a number of key controls that are designed to ensure that fair value is measured appropriately.
For further information, see Note 17 to the consolidated financial statements appearing elsewhere in this prospectus.
Income Taxes. We consider our accounting policy relating to income taxes to be critical as the determination of current and deferred income taxes is based on complex analyses of many factors including interpretation of federal, state and foreign income tax laws, the difference between tax and financial reporting bases of assets and liabilities (temporary differences), estimates of amounts due or owed, the timing of reversals of temporary differences and current financial accounting standards. Actual results could differ significantly from the estimates due to tax law interpretations used in determining the current and deferred income tax liabilities. Additionally, there can be no assurances that estimates and interpretations used in determining income tax liabilities may not be challenged by federal and state taxing authorities.
Deferred tax assets and liabilities resulting from temporary differences between the financial reporting and tax bases of assets and liabilities are measured at the balance sheet date using enacted tax rates expected to apply to taxable income in the years the temporary differences are expected to reverse.
The realization of deferred tax assets depends upon the existence of sufficient taxable income within the carry-back or carry-forward periods under the tax law in the applicable tax jurisdiction. Valuation allowances are established when management determines, based on available information, that it is more likely than not that deferred income tax assets will not be realized. Significant judgment is required in determining whether valuation allowances should be established as well as the amount of such allowances. When making such determination, consideration is given to, among other things, the following:
| • | Future taxable income; |
| • | Future reversals of existing taxable temporary differences; |
| • | Taxable income in prior carry-back years; and |
| • | Tax planning strategies. |
Management evaluates each position based solely on the technical merits and facts and circumstances of the position, assuming the position will be examined by a taxing authority having full knowledge of all relevant information. We review our uncertain tax positions quarterly. Management reevaluates tax positions when new information about recognition or measurement becomes available. We evaluate our uncertain tax positions in accordance with ASC 740, Income Taxes. The portion of the tax benefit which is uncertain is disclosed in the Notes to the consolidated financial statements.
To the extent that the final tax outcome of these matters is different than the amounts recorded, such differences will impact income tax expense in the period in which such determination is made. For further information, see Note 10 to the consolidated financial statements.
Investment Securities. Investments in certain securities are classified into three categories—held to maturity, trading and available for sale. We intend to hold our securities classified as available for sale for an indefinite period of time but may
49
Table of Contents
sell them prior to maturity. All other securities, which we have the positive intent and ability to hold to maturity, are classified as held to maturity securities. During the periods included in this prospectus, we did not hold any trading securities.
We analyze marketable securities for other-than-temporary impairment as required under ASC 820-10 which provides guidance on how to determine other than temporary impairment. Market valuations represent the current fair value of a security at a specified point in time and do not represent the risk of repayment of the principal due to our ability to hold the security to maturity. Gains and losses on securities are only realized upon the sale of the security prior to maturity. A credit downgrade represents an increased level of risk of other-than-temporary impairment, and will only be recognized if we assess the downgrade to challenge the issuer’s ability to service the debt and to repay the principal at contractual maturity.
We consider our accounting policy for investment securities to be critical as the analysis of marketable securities for other-than-temporary impairment is subject to significant judgment and, as our investment securities comprise a significant portion of our assets, changes in valuation of our market securities may have a material impact.
Assumptions utilized vary from security to security. There are numerous factors to be considered when estimating whether a credit loss exists and the period over which the debt security is expected to recover. The following list is not meant to be all inclusive. All of the following factors shall be considered:
| • | The length of time and the extent to which the fair value has been less than the amortized cost basis (severity and duration); |
| • | Adverse conditions specifically related to the security, an industry, or geographic area; for example changes in the financial condition of the issuer of the security, or in the case of an asset-backed debt security, changes in the financial condition of the underlying obligors. Examples of those changes include any of the following: |
| • | Changes in technology; |
| • | The discontinuance of a segment of the business that may affect the future earnings potential of the issuer or underlying loan obligors of the security; and |
| • | Changes in the quality of the credit enhancement. |
| • | The historical and implied volatility of the fair value of the security; |
| • | The payment structure of the debt security and the likelihood of the issuer being able to make payments that increase in the future; |
| • | Failure of the issuer of the security to make scheduled interest or principal payments; |
| • | Any changes to the rating of the security by a rating agency; and |
| • | Recoveries or additional declines in fair value after the balance sheet date. |
We use a third party to obtain information about the structure of each security, including subordination and other credit enhancements, in order to determine how the underlying collateral cash flows will be distributed to each security issued in the structure. These cash flows are then discounted at the interest rate equal to the yield anticipated at the time the security was purchased. We review the actual collateral performance of these securities on a quarterly basis and update the inputs as appropriate to determine the projected cash flows.
For further information, see Notes 2 and 3 to the consolidated financial statements appearing elsewhere in this prospectus.
Overview of Company Operations
We are a financial services company, headquartered in the greater Research Triangle Park area in North Carolina. Square 1 Financial was incorporated in the State of Delaware in October 2004 and became the bank holding company for Square 1 Bank, a de novo North Carolina commercial bank, in August 2005 upon the commencement of Square 1 Bank’s operations. Through Square 1 Bank, which was formed by experienced venture bankers and entrepreneurs, we offer a full range of banking and financial products and services throughout the United States, focused on the entrepreneurial community and venture capital and private equity firms. Since inception, we have operated as a highly-focused venture bank and have provided a broad range of financial services to entrepreneurs, growing entrepreneurial companies and the venture capital and
50
Table of Contents
private equity communities. Our primary focus is on the technology and life sciences industries located throughout the United States. We also focus on the venture capital and private equity market and on growing and continuing to develop our strong relationships with the venture capital and private equity community and the entrepreneurs and companies that are funded by such firms. Through our asset-based lending group, we provide clients with lines of credit secured by accounts receivable and inventory. We provide our clients with commercial business loans and real estate loans through SBA and USDA loan programs. We also offer investment advisory and asset management services to our clients through Square 1 Asset Management, a subsidiary of Square 1 Bank, and provide certain non-banking services to our clients through Square 1 Bank, including funds management and global market services.
Executive Overview of Recent Financial Performance
An important part of our strategy is increasing our penetration into the most active entrepreneurial markets and industries. We have continued to add venture bankers and client managers, particularly during the last three years, in key markets, including a total of 15 bankers and client managers in Silicon Valley, Boston, New York and other locations on the West Coast. These key hires have allowed us to further penetrate markets in which we believe there is significant opportunity for us to grow, and they complement our consistently strong presence in other areas such as the mid-Atlantic, Southeast, Texas and Colorado. We believe that our position as the only other “pure play” commercial bank serving the venture banking market provides substantial opportunity for us to continue our successful growth.
As a result, we have continued to experience robust balance sheet and revenue growth, which has resulted in three consecutive years of increasing net operating income. We had net income available to common shareholders of $22.1 million and diluted earnings per share of $0.93 for the year ended December 31, 2013, compared to net income available to common shareholders of $14.1 million and diluted earnings per share of $0.67 for the prior year. We experienced strong growth in net interest income as a result of significant growth in both loans and deposits during 2013, with an average loan balance for 2013 of $918.2 million, compared to $750.9 million for 2012. This loan growth was funded by our continued ability to generate strong growth from new and existing venture firms and entrepreneurial companies. We also continue to experience favorable funding of our interest earning assets with 61.4% of our average deposits for the year ended December 31, 2013, coming from noninterest-bearing deposits compared to 66.0% for the year ended December 31, 2012. Our average client funds, which consist of on-balance sheet deposits and client investment funds, increased $344.5 million, or 17.5%, during the year ended December 31, 2013. The success of our larger and more experienced banking teams drove continued growth in fee income. We also experienced significant gains from our equity warrant assets as our clients experienced liquidity events during 2013. In addition, while higher loan balances and increases in specific reserves on nonperforming loans have increased our provision for loans losses, overall credit quality remains strong. At December 31, 2013, our ratio of nonperforming loans to total loans was 1.34%, improving from 1.68% at December 31, 2012.
As we continue to grow our business and add employees to support our growth, we will incur additional personnel and benefits expenses related to such growth. In addition, our occupancy expenses will increase in 2014 due to our assumption of the leases for the Sand Hill Finance LLC offices, the anticipated addition of new loan production offices in San Francisco and Chicago, and an increase in our lease expenses for one of our existing loan production offices. Square 1 Bank is also in the process of updating its online banking system and its platform for lending and credit operations. Such updates will result in increased expenses in 2014. We anticipate that the aggregate of these increased expenses will result in approximately a 20% increase in our operating expenses for 2014 compared to 2013. Such increased operating expenses could adversely impact our net income for fiscal year 2014.
Results of Operations
Performance Summary. 2013 vs. 2012. For the year ended December 31, 2013, we reported net income available to common shareholders of $22.1 million, an increase of $8.0 million, or 56.7%, compared to net income of $14.1 million for the year ended December 31, 2012. The increase resulted from a $9.8 million, or 14.7%, increase in net interest income and a $9.7 million, or 62.6%, increase in noninterest income, partially offset by a $3.9 million, or 41.9%, increase in our loan loss provision and a $4.8 million, or 9.3%, increase in noninterest expense. The net interest income increase was primarily the result of our continued success in growing both our loan portfolio and the level of low cost deposits. The increase in noninterest income reflected additional fee income related to this balance sheet growth and fees contingent upon customer success events, as well as a $3.8 million increase in warrant income as 31 of our portfolio company clients in which we had taken warrant positions had successful liquidity events in 2013.
51
Table of Contents
2012 vs. 2011. For the year ended December 31, 2012, we reported net income available to common shareholders of $14.1 million, an increase of $9.0 million, or 177.1%, compared to net income of $5.1 million for the year ended December 31, 2011. The increase resulted from a $7.2 million, or 12.2%, increase in net interest income and a $8.7 million, or 126.9%, increase in noninterest income, partially offset by a $2.1 million, or 28.4%, increase in our loan loss provision and a $2.0 million, or 4.0%, increase in noninterest expense. While net interest income improved primarily as a result of continued loan growth funded by low cost deposits, noninterest income in 2011 was adversely affected by $9.0 million in net securities losses due to the sale of a significant percentage of our non-agency mortgage-backed securities.
Net Interest Income (Fully Tax Equivalent Basis). Net interest income, the primary contributor to our earnings, represents the difference between the income that we earn on our interest-earning assets and the cost to us of our interest-bearing liabilities. Our net interest income depends upon the volume of interest-earning assets and interest-bearing liabilities and the interest rates that we earn or pay on them. Net interest income is affected by changes in the amount and mix of interest-earning assets and interest-bearing liabilities, referred to as “volume changes.” It is also affected by changes in yields earned on interest-earning assets and rates paid on interest-bearing deposits and other borrowed funds, referred to as “rate changes.” The yield earned on loans includes loan fees, which are primarily loan origination fees and loan documentation fees related to loan origination. Net interest income and the net interest margin are presented on a fully taxable equivalent basis based on the federal statutory tax rate of 35% to consistently reflect income from taxable loans and securities and tax-exempt securities.
2013 vs. 2012. For the year ended December 31, 2013, net interest income increased $11.5 million, or 16.9%, to $79.4 million compared to 2012. This increase was primarily driven by a $11.6 million, or 16.8%, increase in interest income. Our interest income increase primarily resulted from:
| • | a $7.4 million, or 14.6%, increase to $58.2 million in interest income on loans resulting from a 22.3% higher average balance, partially offset by a 43 basis point decrease in the yield earned. The 43 basis point decrease in the yield earned resulted from increased competitive pressure in the current low rate environment. |
| • | a $4.7 million or 117.1%, increase to $8.8 million in interest income on nontaxable securities caused by a 114.5% higher average balance and a 6 basis point increase in the yield earned. The higher nontaxable securities balance and yield was primarily a result of our purchases of municipal securities. |
Interest income was partially offset by interest expense of $1.3 million, which represented a $0.2 million, or 16.3%, increase from 2012. This increase was driven by the higher volume of our interest-bearing liabilities. 56.7% of our funding for the year ended December 31, 2013 came from noninterest-bearing deposits compared to 61.6% for the year ended December 31, 2012.
Net Interest Margin (Fully Tax Equivalent Basis). 2013 vs. 2012. Our net interest margin declined to 3.91% from 4.14%. The primary reasons for the decrease were:
| • | a decline in yields on our newly originated loans in response to competitive pressures in the current low rate environment; |
| • | an increase in premium amortization on securities as the amount of prepayments increased in the low rate environment; and |
| • | interest-bearing deposits grew at a faster rate than our non-interest bearing deposits and did not experience a decline in rates. |
The decline in the net interest margin was partially offset by:
| • | our decision to invest a greater percentage of interest-earning assets in higher yielding municipal bonds. |
52
Table of Contents
Net Interest Income (Fully Tax Equivalent Basis). 2012 vs. 2011. For the year ended December 31, 2012, net interest income increased $8.6 million, or 14.5%, to $67.9 million when compared to 2011. This increase was primarily driven by a $8.3 million, or 13.6%, increase in interest income. Our net interest income increase in 2012 primarily resulted from:
| • | a $7.8 million, or 18.2%, increase to $50.8 million in interest income on loans resulting from a 21.2% higher average balance, partially offset by a 17 basis point decrease in the yield earned. The 17 basis point decrease in the yield earned resulted from increased competitive pressure in the low rate environment. |
| • | a $3.9 million increase to $4.0 million in interest income on nontaxable securities resulting from a significantly higher average balance primarily as a result of our purchases of municipal securities and a 141 basis point increase in the yield. |
These increases were partially offset by a $3.4 million, or 19.7%, decline in interest income on taxable securities to $14.0 million, which was caused by a $40.4 million, or 5.5%, decline in the weighted average balance and a 35 basis point decline in the yield earned.
Our net interest income was further increased by $0.4 million as a result of a decline in interest expense. Interest expense declined as a result of the 7 basis point decline in rates more than offsetting the $4.1 million, or 0.8%, increase in the average balance of interest-bearing liabilities.
Net Interest Margin (Fully Tax Equivalent Basis). 2012 vs. 2011. Our net interest margin increased to 4.14% in 2012 from 4.02% in 2011. The primary reasons for the increase were:
| • | the average balance of higher yielding, nontaxable municipal bonds increased significantly in 2012; |
| • | the rates paid on interest-bearing money market deposits declined; and |
| • | loans became a higher percentage of interest-earning assets. |
The increase in the net interest margin was partially offset by:
| • | declining loan yields in response to competitive pressures in the low rate environment; and |
| • | an increase in premium amortization as the amounts of prepayments of mortgage-backed securities increased. |
53
Table of Contents
Average Balances and Yields. The following table presents information regarding average balances for assets and liabilities, the total dollar amounts of interest income and dividends from average interest-earning assets, the total dollar amounts of interest expense on average interest-bearing liabilities, and the resulting average yields and costs. The yields and costs for the periods indicated are derived by dividing the income or expense by the average balances for assets or liabilities, respectively, for the periods presented. Loan fees are included in interest income on loans. Yields are presented on a tax equivalent basis.
| Years Ended December 31, | ||||||||||||||||||||||||||||||||||||
| 2013 | 2012 | 2011 | ||||||||||||||||||||||||||||||||||
| Average Balance |
Interest and Dividends |
Yield/ Cost |
Average Balance |
Interest and Dividends |
Yield/ Cost |
Average Balance |
Interest and Dividends |
Yield/ Cost |
||||||||||||||||||||||||||||
| (Dollars in thousands) |
||||||||||||||||||||||||||||||||||||
| Interest-earning assets: |
||||||||||||||||||||||||||||||||||||
| Federal Reserve deposits, federal funds sold and other short-term investments |
$ | 135,372 | $ | 361 | 0.27 | % | $ | 101,209 | $ | 284 | 0.28 | % | $ | 111,784 | $ | 341 | 0.31 | % | ||||||||||||||||||
| Loans, net of unearned income |
918,149 | 58,230 | 6.34 | 750,857 | 50,815 | 6.77 | 619,537 | 42,981 | 6.94 | |||||||||||||||||||||||||||
| Nontaxable securities |
193,363 | 8,772 | 4.54 | 90,162 | 4,041 | 4.48 | 4,063 | 125 | 3.07 | |||||||||||||||||||||||||||
| Taxable securities |
779,179 | 13,369 | 1.72 | 695,421 | 13,951 | 2.01 | 735,840 | 17,380 | 2.36 | |||||||||||||||||||||||||||
|
|
|
|
|
|
|
|
|
|
|
|
|
|||||||||||||||||||||||||
| Total interest-earning assets |
2,026,063 | 80,732 | 3.98 | 1,637,649 | 69,091 | 4.22 | 1,471,224 | 60,827 | 4.13 | |||||||||||||||||||||||||||
|
|
|
|
|
|
|
|
|
|
|
|
|
|||||||||||||||||||||||||
| Less: Allowance for loan losses |
(17,057 | ) | (14,217 | ) | (11,464 | ) | ||||||||||||||||||||||||||||||
| Noninterest-earning assets |
81,836 | 84,094 | 81,354 | |||||||||||||||||||||||||||||||||
|
|
|
|
|
|
|
|||||||||||||||||||||||||||||||
| Total assets |
$ | 2,090,842 | 1,707,526 | 1,541,114 | ||||||||||||||||||||||||||||||||
|
|
|
|
|
|
|
|||||||||||||||||||||||||||||||
| Interest-bearing liabilities: |
||||||||||||||||||||||||||||||||||||
| Demand deposits |
$ | 67,059 | 96 | 0.14 | $ | 20 | — | — | $ | 52 | — | — | ||||||||||||||||||||||||
| Money market |
624,281 | 499 | 0.08 | 488,924 | 423 | 0.09 | 497,135 | 802 | 0.16 | |||||||||||||||||||||||||||
| Time deposits |
31,552 | 61 | 0.19 | 32,082 | 50 | 0.16 | 26,915 | 56 | 0.21 | |||||||||||||||||||||||||||
|
|
|
|
|
|
|
|
|
|
|
|
|
|||||||||||||||||||||||||
| Total interest-bearing deposits |
722,892 | 656 | 0.09 | 521,026 | 473 | 0.09 | 524,102 | 858 | 0.16 | |||||||||||||||||||||||||||
| FHLB advances |
8,015 | 31 | 0.39 | 7,814 | 24 | 0.31 | 137 | — | 0.35 | |||||||||||||||||||||||||||
| Other borrowings |
10,672 | 11 | — | 222 | 2 | 0.78 | 692 | 1 | 0.25 | |||||||||||||||||||||||||||
| Junior subordinated debt |
6,206 | 630 | 10.15 | 6,200 | 643 | 10.37 | 6,191 | 643 | 10.37 | |||||||||||||||||||||||||||
|
|
|
|
|
|
|
|
|
|
|
|
|
|||||||||||||||||||||||||
| Total interest-bearing liabilities |
747,785 | 1,328 | 0.18 | 535,262 | 1,142 | 0.21 | 531,122 | 1,502 | 0.28 | |||||||||||||||||||||||||||
|
|
|
|
|
|
|
|
|
|
|
|
|
|||||||||||||||||||||||||
| Noninterest-bearing liabilities |
1,160,175 | 1,027,695 | 894,074 | |||||||||||||||||||||||||||||||||
|
|
|
|
|
|
|
|||||||||||||||||||||||||||||||
| Total liabilities |
1,907,960 | 1,562,957 | 1,425,196 | |||||||||||||||||||||||||||||||||
| Total shareholders’ equity |
182,882 | 144,569 | 115,918 | |||||||||||||||||||||||||||||||||
|
|
|
|
|
|
|
|||||||||||||||||||||||||||||||
| Total liabilities and shareholders’ equity |
$ | 2,090,842 | $ | 1,707,526 | $ | 1,541,114 | ||||||||||||||||||||||||||||||
|
|
|
|
|
|
|
|||||||||||||||||||||||||||||||
| Net interest income |
$ | 79,404 | $ | 67,949 | $ | 59,325 | ||||||||||||||||||||||||||||||
|
|
|
|
|
|
|
|||||||||||||||||||||||||||||||
| Interest rate spread |
3.80 | % | 4.01 | % | 3.85 | % | ||||||||||||||||||||||||||||||
|
|
|
|
|
|
|
|||||||||||||||||||||||||||||||
| Net interest margin |
3.91 | % | 4.14 | % | 4.02 | % | ||||||||||||||||||||||||||||||
|
|
|
|
|
|
|
|||||||||||||||||||||||||||||||
| Ratio of average interest-earning assets to average interest-bearing liabilities |
270.94 | % | 305.95 | % | 277.00 | % | ||||||||||||||||||||||||||||||
|
|
|
|
|
|
|
|||||||||||||||||||||||||||||||
54
Table of Contents
Rate/Volume Analysis. The following table sets forth the effects of changing rates and volumes on our net interest income. The rate column shows the effects attributable to changes in rate (changes in rate multiplied by current volume). The volume column shows the effects attributable to changes in volume (changes in volume multiplied by prior rate). The net column represents the sum of the prior columns. For purposes of this table, changes attributable to changes in both rate and volume that cannot be segregated have been allocated proportionally based on the changes due to rate and the changes due to volume.
| Year Ended December 31,
2013 Compared to December 31, 2012 |
||||||||||||
| Increase (Decrease) Due to |
||||||||||||
| Rate | Volume | Net | ||||||||||
| (Dollars in thousands) | ||||||||||||
| Interest income: |
||||||||||||
| Federal Reserve deposits, federal funds sold and other short-term investments |
$ | (8 | ) | $ | 85 | $ | 77 | |||||
| Loans, net of unearned income |
(3,468 | ) | 10,883 | 7,415 | ||||||||
| Nontaxable securities(1) |
754 | 3,977 | 4,731 | |||||||||
| Taxable securities |
(3,043 | ) | 2,461 | (582 | ) | |||||||
|
|
|
|
|
|
|
|||||||
| Total interest-earning assets |
(5,765 | ) | 17,406 | 11,641 | ||||||||
| Interest expense: |
||||||||||||
| Demand deposits |
— | 96 | 96 | |||||||||
| Money market |
(40 | ) | 116 | 76 | ||||||||
| Time deposits |
12 | (1 | ) | 11 | ||||||||
| Borrowings |
(38 | ) | 41 | 3 | ||||||||
|
|
|
|
|
|
|
|||||||
| Total interest-bearing liabilities |
(66 | ) | 252 | 186 | ||||||||
|
|
|
|
|
|
|
|||||||
| Change in net interest income |
$ | (5,699 | ) | $ | 17,154 | $ | 11,455 | |||||
|
|
|
|
|
|
|
|||||||
| (1) | Tax equivalent income. |
| Year Ended December 31,
2012 Compared to December 31, 2011 |
||||||||||||
| Increase (Decrease) Due to |
||||||||||||
| Rate | Volume | Net | ||||||||||
| (Dollars in thousands) | ||||||||||||
| Interest income: |
||||||||||||
| Federal Reserve deposits, federal funds sold and other short-term investments |
$ | (24 | ) | $ | (33 | ) | $ | (57 | ) | |||
| Loans, net of unearned income |
(764 | ) | 8,598 | 7,834 | ||||||||
| Nontaxable securities(1) |
1,207 | 2,709 | 3,916 | |||||||||
| Taxable securities |
(2,625 | ) | (804 | ) | (3,429 | ) | ||||||
|
|
|
|
|
|
|
|||||||
| Total interest-earning assets |
(2,206 | ) | 10,470 | 8,264 | ||||||||
| Interest expense: |
||||||||||||
| Demand deposits |
— | — | — | |||||||||
| Money market |
(367 | ) | (12 | ) | (379 | ) | ||||||
| Time deposits |
(17 | ) | 11 | (6 | ) | |||||||
| Borrowings |
(669 | ) | 694 | 25 | ||||||||
|
|
|
|
|
|
|
|||||||
| Total interest-bearing liabilities |
(1,053 | ) | 693 | (360 | ) | |||||||
|
|
|
|
|
|
|
|||||||
| Change in net interest income |
$ | (1,153 | ) | $ | 9,777 | $ | 8,624 | |||||
|
|
|
|
|
|
|
|||||||
| (1) | Tax equivalent income. |
55
Table of Contents
Provision for Loan Losses. We consider a number of factors in determining the required level of our loan reserves and the provision required to achieve what we believe is the appropriate reserve level, including loan growth, credit risk rating trends, nonperforming loan levels, delinquencies, loan portfolio concentrations and economic and market trends. The provision for loan losses represents our determination of the amount necessary to be charged against the current period’s earnings to maintain the allowance for loan losses at a level that we consider adequate in relation to the estimated losses inherent in the loan portfolio.
2013 vs. 2012. For the year ended December 31, 2013, the provision for loan losses was $13.3 million, an increase of $3.9 million, or 41.9%, compared to 2012. The higher provision in 2013 reflected the 25.4% growth in loan balance as well as an increase in the allowance for specific reserves related to nonperforming loans and an increase in net charge-offs. At December 31, 2013, nonperforming loans totaled $14.5 million, which was 1.34% of total loans compared to $14.5 million, or 1.68% of total loans, at December 31, 2012. Specific loan loss allowances relating to nonperforming loans increased to $5.4 million and were 37.6% of nonperforming loans at December 31, 2013, compared to $3.3 million, or 23.0%, of nonperforming loans at December 31, 2012. Net loan charge-offs were $8.8 million for the year ended December 31, 2013, compared to $7.2 million for 2012.
2012 vs. 2011. For the year ended December 31, 2012, the provision for loan losses was $9.4 million, an increase of $2.1 million, or 28.4%, compared to 2011. The higher provision in 2012 resulted from 21.4% higher loan balances combined with an increase in the allowance for specific reserves related to nonperforming loans and an increase in net charge-offs. At December 31, 2012, nonperforming loans totaled $14.5 million, or 1.68% of total loans, compared to $7.1 million, or 0.99% of total loans, at December 31, 2011. Specific loan loss allowances relating to nonperforming loans increased to $3.3 million and were 23.0% of nonperforming loans at December 31, 2012, compared to $2.6 million, or 36.9%, of nonperforming loans at December 31, 2011. Net loan charge-offs were $7.2 million for 2012, compared to $4.9 million for 2011.
Noninterest Income.
2013 vs. 2012. The following table shows the components of noninterest income and the dollar and percentage changes from 2013 to 2012.
| Years Ended December 31, |
Change | |||||||||||||||
| 2013 | 2012 | Dollars | Percent | |||||||||||||
| (Dollars in thousands) | ||||||||||||||||
| Core banking income: |
||||||||||||||||
| Service charges and fees |
$ | 6,535 | $ | 5,695 | $ | 840 | 14.7 | % | ||||||||
| Foreign exchange fees |
4,864 | 3,768 | 1,096 | 29.1 | ||||||||||||
| Letter of credit fees |
1,247 | 1,048 | 199 | 19.0 | ||||||||||||
| Loan documentation fees |
429 | 401 | 28 | 7.0 | ||||||||||||
| Client investment fees |
218 | 188 | 30 | 16.0 | ||||||||||||
|
|
|
|
|
|
|
|||||||||||
| Total core banking income |
13,293 | 11,100 | 2,193 | 19.8 | ||||||||||||
| Net loss on sale of securities |
(24 | ) | (358 | ) | 334 | 93.3 | ||||||||||
| Warrant income |
3,750 | (73 | ) | 3,823 | 5237.0 | |||||||||||
| Gain on sale of loans |
2,033 | 2,575 | (542 | ) | (21.0 | ) | ||||||||||
| Bank owned life insurance |
1,073 | 633 | 440 | 69.5 | ||||||||||||
|
Other |
5,183 | 1,683 | 3,500 | 208.0 | ||||||||||||
|
|
|
|
|
|
|
|||||||||||
| Total noninterest income |
$ | 25,308 | $ | 15,560 | $ | 9,748 | 62.6 | % | ||||||||
|
|
|
|
|
|
|
|
|
|||||||||
Core banking income represents recurring income from traditional banking services provided to our customers. Income from these fees increased $2.2 million, or 19.8%, primarily due to an increased customer base combined with increased service utilization by our customers. Service charges and fees represent fees earned on our deposit accounts and credit card fee income. For the year ended December 31, 2013, service charges and fees on deposit accounts were $4.1 million, with growth of $0.5 million, or 13.0%, and credit card income was $2.5 million, with growth of $0.4 million, or 17.8%. These increases for the year ended December 31, 2013, are consistent with new customer growth and increased penetration with our existing customers.
56
Table of Contents
Foreign exchange fees are primarily transaction based fees earned from our customers for performing foreign currency-based transactions on their behalf. The increase of $1.1 million in foreign exchange fees reflects our expanding geographic footprint and the evolving needs of our client base.
Warrant income includes income realized upon the exercise of a warrant and the sale of the underlying equity security and the quarterly mark-to-market of our warrant portfolio. We experienced several material warrant gains during 2013. This income is volatile as it is largely dependent on liquidity events experienced by our clients. The following table shows the components of warrant income and the period-to-period changes (see further discussion of our equity warrant assets under “Derivatives” in Note 2 to the consolidated financial statements).
| Years Ended December 31, |
Change | |||||||||||||||
| 2013 | 2012 | Dollars | Percent | |||||||||||||
| (Dollars in thousands) | ||||||||||||||||
| Equity warrant assets: |
||||||||||||||||
| Net realized gains on equity warrants |
$ | 4,535 | $ | 1,502 | $ | 3,033 | 201.9 | % | ||||||||
| Change in fair value |
(785 | ) | (1,575 | ) | 790 | 50.2 | ||||||||||
|
|
|
|
|
|
|
|||||||||||
| Warrant income (loss) |
$ | 3,750 | $ | (73 | ) | $ | 3,823 | 5237.0 | % | |||||||
|
|
|
|
|
|
|
|
|
|||||||||
For the year ended December 31, 2013, our other income was primarily comprised of income earned from our debt, venture capital and private equity fund investments portfolio, fees earned based upon contingent customer success events such as completion of an initial public offering or business combination. The increase in other income during the year ended December 31, 2013, compared to the prior year was primarily the result of increased customer success fees and gains on our investments in our private equity investments portfolio. For the year ended December 31, 2013, noninterest income from customer success fees increased $1.4 million, or 119.8%, to $2.6 million from $1.2 million in the prior year. These fees are by their nature volatile and there is no assurance that such fees will remain at these levels or increase in the future. Our investments in debt, venture capital and private equity funds totaled $4.1 million at December 31, 2013. These investments are primarily in funds for CRA credit, other non-CRA funds for relationship purposes and an investment in our own fund-of-funds, Square 1 Ventures. For the year ended December 31, 2013, noninterest income from these investments was $1.1 million, an increase of $1.3 million from the $0.2 million loss recognized in 2012. The Volcker Rule is not expected to have a material impact on these investments.
2012 vs. 2011. The following table shows the components of noninterest income and the dollar and percentage changes from 2011 to 2012.
| Years Ended December 31, |
Change | |||||||||||||||
| 2012 | 2011 | Dollars | Percent | |||||||||||||
| (Dollars in thousands) | ||||||||||||||||
| Core banking income: |
||||||||||||||||
| Service charges and fees |
$ | 5,695 | $ | 4,573 | $ | 1,122 | 24.5 | % | ||||||||
| Foreign exchange fees |
3,768 | 3,586 | 182 | 5.1 | ||||||||||||
| Letter of credit fees |
1,048 | 719 | 329 | 45.8 | ||||||||||||
| Loan documentation fees |
401 | 344 | 57 | 16.6 | ||||||||||||
| Client investment fees |
188 | 155 | 33 | 21.3 | ||||||||||||
|
|
|
|
|
|
|
|||||||||||
| Total core banking income |
11,100 | 9,377 | 1,723 | 18.4 | ||||||||||||
| Net loss on sale of securities |
(358 | ) | (8,956 | ) | 8,598 | 96.0 | ||||||||||
| Warrant income (loss) |
(73 | ) | 1,084 | (1,157 | ) | (106.7 | ) | |||||||||
| Gain on sale of loans |
2,575 | 2,399 | 176 | 7.3 | ||||||||||||
| Bank owned life insurance |
633 | — | 633 | — | ||||||||||||
| Other |
1,683 | 2,953 | (1,270 | ) | (43.0 | ) | ||||||||||
|
|
|
|
|
|
|
|||||||||||
| Total noninterest income |
$ | 15,560 | $ | 6,857 | $ | 8,703 | 126.9 | % | ||||||||
|
|
|
|
|
|
|
|
|
|||||||||
57
Table of Contents
Higher noninterest income in 2012 resulted from a $1.7 million, or 18.4% increase in our core banking income and a significant decrease in securities losses, partially offset by decreases in warrant income and other income. For the year ended December 31, 2012, service charges on deposit accounts were $3.6 million, an increase of $0.5 million, or 17.6%, and credit card income was $2.1 million, an increase of $0.6 million, or 38.6%.
The net loss on securities sold includes the net impact of securities transactions and any valuation impairment recognized on our securities portfolio. The $9.0 million loss in 2011 resulted primarily from actions taken to reduce our exposure to non-agency mortgage-backed securities.
The following table shows the components of warrant income and the year-to-year changes.
| Years Ended December 31, |
Change | |||||||||||||||
| 2012 | 2011 | Dollars | Percent | |||||||||||||
| (Dollars in thousands) | ||||||||||||||||
| Equity warrant assets: |
||||||||||||||||
| Net realized gains on equity warrants |
$ | 1,502 | $ | 2,262 | $ | (760 | ) | (33.6 | )% | |||||||
| Change in fair value |
(1,575 | ) | (1,178 | ) | (397 | ) | (33.7 | ) | ||||||||
|
|
|
|
|
|
|
|||||||||||
| Warrant income (loss) |
$ | (73 | ) | $ | 1,084 | $ | (1,157 | ) | (106.7 | )% | ||||||
|
|
|
|
|
|
|
|
|
|||||||||
Noninterest Expense. 2013 vs. 2012. The following table shows the components of noninterest expense and the related dollar and percentage changes.
| Years Ended December 31, |
Change | |||||||||||||||
| 2013 | 2012 | Dollars | Percent | |||||||||||||
| (Dollars in thousands) | ||||||||||||||||
| Personnel |
$ | 35,759 | $ | 30,507 | $ | 5,252 | 17.2 | % | ||||||||
| Occupancy |
2,779 | 2,687 | 92 | 3.4 | ||||||||||||
| Data processing |
3,097 | 3,043 | 54 | 1.8 | ||||||||||||
| Furniture and equipment |
2,536 | 2,692 | (156 | ) | (5.8 | ) | ||||||||||
| Advertising and promotions |
1,255 | 973 | 282 | 29.0 | ||||||||||||
| Professional fees |
3,232 | 3,646 | (414 | ) | (11.4 | ) | ||||||||||
| Telecommunications |
1,172 | 1,152 | 20 | 1.7 | ||||||||||||
| Travel |
1,099 | 954 | 145 | 15.2 | ||||||||||||
| FDIC assessment |
1,293 | 1,295 | (2 | ) | (0.2 | ) | ||||||||||
| Other |
3,699 | 4,199 | (500 | ) | (11.9 | ) | ||||||||||
|
|
|
|
|
|
|
|||||||||||
| Total noninterest expense |
$ | 55,921 | $ | 51,148 | $ | 4,773 | 9.3 | % | ||||||||
|
|
|
|
|
|
|
|
|
|||||||||
For the year ended December 31, 2013 we recognized $55.9 million in total noninterest expense, an increase of $4.8 million, or 9.3%, compared to 2012.
Personnel, at $35.8 million, represented 63.9% of our total noninterest expense and this category increased $5.3 million, or 17.2%. This increase primarily resulted from an increase in our full-time equivalent employees to 230 at December 31, 2013, from 203 at December 31, 2012, to support our balance sheet and income growth.
58
Table of Contents
2012 vs. 2011. The following table shows the components of noninterest expense and the related dollar and percentage changes.
| Years Ended December 31, |
Change | |||||||||||||||
| 2012 | 2011 | Dollars | Percent | |||||||||||||
| (Dollars in thousands) | ||||||||||||||||
| Personnel |
$ | 30,507 | $ | 26,885 | $ | 3,622 | 13.5 | % | ||||||||
| Occupancy |
2,687 | 2,739 | (52 | ) | (1.9 | ) | ||||||||||
| Data processing |
3,043 | 2,540 | 503 | 19.8 | ||||||||||||
| Furniture and equipment |
2,692 | 2,562 | 130 | 5.1 | ||||||||||||
| Advertising and promotions |
973 | 779 | 194 | 24.9 | ||||||||||||
| Professional fees |
3,646 | 4,026 | (380 | ) | (9.4 | ) | ||||||||||
| Telecommunications |
1,152 | 1,449 | (297 | ) | (20.5 | ) | ||||||||||
| Travel |
954 | 870 | 84 | 9.7 | ||||||||||||
| FDIC assessment |
1,295 | 2,308 | (1,013 | ) | (43.9 | ) | ||||||||||
| Other |
4,199 | 5,005 | (806 | ) | (16.1 | ) | ||||||||||
|
|
|
|
|
|
|
|||||||||||
| Total noninterest expense |
$ | 51,148 | $ | 49,163 | $ | 1,985 | 4.0 | % | ||||||||
|
|
|
|
|
|
|
|
|
|||||||||
For fiscal year 2012 we recognized $51.1 million in total noninterest expense, an increase of $2.0 million, or 4.0%, when compared to the same period in 2011.
Personnel, at $30.5 million, represented 59.6% of our total noninterest expense and this category increased $3.6 million, or 13.5%. The primary cause of this increase was an increase in our full-time equivalent employees from 189 at December 31, 2011 to 203 at December 31, 2012 to support our balance sheet and income growth. Our FDIC deposit insurance assessment declined $1.0 million, or 43.8%, as the rate we are charged was reduced after the first quarter of 2011.
Income Tax Provision.
2013 vs. 2012. Income tax expense increased $2.8 million, or 39.4%, for the year ended December 31, 2013, as compared to the prior year due to a $10.8 million, or 50.3%, increase in pre-tax income. Our effective tax rate declined to 31.0% from 33.4% as a result of an increase in our tax preferred income from our municipal securities portfolio and bank owned life insurance.
2012 vs. 2011. Income tax expense increased $2.8 million, or 64.8%, due to an $11.9 million or 122.0% increase in pre-tax income. Our effective tax rate declined to 33.4% from 45.0% as a result of an increase in our tax preferred income from our municipal securities portfolio and bank owned life insurance. In addition, 2011 income tax expense included recognition of $0.6 million in prior period taxes in 2011 as a result of an IRS audit.
Discussion and Analysis of Financial Condition
Our total assets increased $523.1 million, or 29.0%, to $2.3 billion at December 31, 2013, from $1.8 billion at December 31, 2012, primarily due to growth in our loan portfolio of $219.5 million and an increase in our investment securities portfolio of $235.3 million.
Our total assets increased $155.0 million, or 9.4%, to $1.8 billion at December 31, 2012, as compared to $1.6 billion at December 31, 2011, primarily due to growth of $152.2 million in our loan portfolio and an increase of $134.8 million in our investment securities portfolio.
59
Table of Contents
Loans. At December 31, 2013, 2012 and 2011, loans totaled $1.1 billion, $867.1 million and $715.0 million, respectively. The following table presents the balance and associated percentage of each category of loans within our loan portfolio at the dates indicated.
| At December 31, | ||||||||||||||||||||||||
| 2013 | 2012 | 2011 | ||||||||||||||||||||||
| Amount | Percent | Amount | Percent | Amount | Percent | |||||||||||||||||||
| (Dollars in thousands) | ||||||||||||||||||||||||
| Commercial loans: |
||||||||||||||||||||||||
| Technology |
$ | 493,337 | 45.39 | % | $ | 416,657 | 48.06 | % | $ | 417,280 | 58.36 | % | ||||||||||||
| Life sciences |
199,069 | 18.31 | 168,481 | 19.43 | 113,433 | 15.87 | ||||||||||||||||||
| Venture capital/private equity |
143,468 | 13.20 | 132,621 | 15.29 | 89,670 | 12.54 | ||||||||||||||||||
| Asset-based loans |
186,702 | 17.17 | 104,988 | 12.11 | 71,176 | 9.95 | ||||||||||||||||||
| SBA and USDA |
23,719 | 2.18 | 8,887 | 1.02 | 11,412 | 1.60 | ||||||||||||||||||
| Other |
1,424 | 0.13 | 1,406 | 0.16 | 948 | 0.13 | ||||||||||||||||||
|
|
|
|
|
|
|
|
|
|
|
|
|
|||||||||||||
| Total commercial loans |
1,047,719 | 96.38 | 833,040 | 96.07 | 703,919 | 98.45 | ||||||||||||||||||
| Real estate loans: |
||||||||||||||||||||||||
| SBA and USDA |
27,504 | 2.53 | 26,389 | 3.04 | 6,131 | 0.86 | ||||||||||||||||||
|
|
|
|
|
|
|
|
|
|
|
|
|
|||||||||||||
| Total real estate loans |
27,504 | 2.53 | 26,389 | 3.04 | 6,131 | 0.86 | ||||||||||||||||||
| Construction: |
||||||||||||||||||||||||
| SBA and USDA |
287 | 0.03 | — | — | — | — | ||||||||||||||||||
|
|
|
|
|
|
|
|
|
|
|
|
|
|||||||||||||
| Total construction loans |
287 | 0.03 | — | — | — | — | ||||||||||||||||||
| Credit cards |
11,575 | 1.06 | 7,693 | 0.89 | 4,936 | 0.69 | ||||||||||||||||||
|
|
|
|
|
|
|
|
|
|
|
|
|
|||||||||||||
| Total loans |
1,087,085 | 100.00 | % | 867,122 | 100.00 | % | 714,986 | 100.00 | % | |||||||||||||||
| Less unearned income(1) |
(4,549 | ) | (4,041 | ) | (4,082 | ) | ||||||||||||||||||
|
|
|
|
|
|
|
|||||||||||||||||||
| Total loans, net of unearned income |
$ | 1,082,536 | 100.00 | % | $ | 863,081 | 100.00 | % | $ | 710,904 | 100.00 | % | ||||||||||||
|
|
|
|
|
|
|
|
|
|
|
|
|
|||||||||||||
| (1) | Unearned income consists of unearned loan fees, the discount on SBA loans and the unearned initial warrant value. |
| At December 31, | ||||||||||||||||
| 2010 | 2009 | |||||||||||||||
| Amount | Percent | Amount | Percent | |||||||||||||
| (Dollars in thousands) | ||||||||||||||||
| Commercial loans: |
||||||||||||||||
| Technology |
$ | 300,306 | 60.94 | % | $ | 287,767 | 62.81 | % | ||||||||
| Life sciences |
80,286 | 16.29 | 72,604 | 15.85 | ||||||||||||
| Venture capital/private equity |
61,886 | 12.56 | 54,031 | 11.79 | ||||||||||||
| Asset-based loans |
46,995 | 9.54 | 40,978 | 8.94 | ||||||||||||
| SBA and USDA |
— | — | — | — | ||||||||||||
| Other |
137 | 0.03 | 336 | 0.07 | ||||||||||||
|
|
|
|
|
|
|
|
|
|||||||||
| Total commercial loans |
489,610 | 99.36 | 455,716 | 99.46 | ||||||||||||
| Real estate loans: |
||||||||||||||||
| SBA and USDA |
— | — | — | — | ||||||||||||
|
|
|
|
|
|
|
|
|
|||||||||
| Total real estate loans |
— | — | — | — | ||||||||||||
| Construction: |
||||||||||||||||
| SBA and USDA |
— | — | — | — | ||||||||||||
|
|
|
|
|
|
|
|
|
|||||||||
| Total construction loans |
— | — | — | — | ||||||||||||
| Credit cards |
3,141 | 0.64 | 2,450 | 0.54 | ||||||||||||
|
|
|
|
|
|
|
|
|
|||||||||
| Total loans |
492,751 | 100.00 | % | 458,166 | 100.00 | % | ||||||||||
| Less unearned income(1) |
(2,115 | ) | (1,615 | ) | ||||||||||||
|
|
|
|
|
|||||||||||||
| Total loans, net of unearned income |
$ | 490,636 | 100.00 | % | $ | 456,551 | 100.00 | % | ||||||||
|
|
|
|
|
|
|
|
|
|||||||||
| (1) | Unearned income consists of unearned loan fees, the discount on SBA loans and the unearned initial warrant value. |
60
Table of Contents
The increase in commercial loans from December 31, 2012, to December 31, 2013 occurred in all our client industry segments, with most of the growth occurring in our technology and life sciences client sector and asset-based loans.
Within our commercial loan portfolio, our asset-based loans increased $81.7 million, or 77.8%, to $186.7 million as of December 31, 2013, from $105.0 million as of December 31, 2012, and increased $33.8 million, or 47.5%, from $71.2 million as of December 31, 2011. This increase in asset-based loans since 2011 has primarily been due to our strategic focus on expanding this product line to better serve the needs of our expansion and late stage clients, while $11.9 million of the increase in 2013 was the result of our acquisition of Sand Hill Finance.
Our loans to venture firm clients fluctuate from year to year based on funding needs driven by investment cycles and timing. We have consistently increased the number of venture firm clients since 2010 and the amount of loan commitments to such clients has increased as well, from $362.1 million at December 31, 2010, to $559.3 million at December 31, 2013. The amount of loan commitments that are utilized by these clients vary during the year and often increase at the end of the year when these clients may increase the amount drawn on their lines of credit for various business reasons. The amount of loans outstanding to our venture firm clients at December 31, 2013, was $143.5 million, compared to $132.6 million as of December 31, 2012. During the first quarter of 2013 we experienced a decline from our 2012 year end balances of $41.2 million. We anticipate a similar decline from our year end 2013 balances during the first quarter of 2014. Our venture firm loans increased to $132.6 million as of December 31, 2012, from $89.7 million as of December 31, 2011, an increase of $42.9 million, or 47.9%, as a result of a larger customer base and increased line of credit utilization by such firms.
We began offering SBA and USDA loans in 2011. As of December 31, 2013, SBA and USDA loans represented 4.7% of our loan portfolio compared to 4.1% as of December 31, 2012 and 2.5% as of December 31, 2011. We expect to continue to grow our SBA and USDA loan portfolio as we originate new loans and sell a portion of the guaranteed balances.
Loan Concentration
Loan concentrations may exist when there are borrowers engaged in similar activities or types of loans extended to a diverse group of borrowers that could cause those borrowers or portfolios to be similarly impacted by economic or other conditions. The breakdown of total loans as a percentage of total loans by industry sector at December 31, 2013 and 2012, is as follows:
| At December 31, | ||||||||||||||||
| 2013 | 2012 | |||||||||||||||
| Amount | Percent | Amount | Percent | |||||||||||||
| (Dollars in thousands) | ||||||||||||||||
| Venture portfolio industry: |
||||||||||||||||
| Software |
$ | 178,408 | 16.47 | % | $ | 116,167 | 13.46 | % | ||||||||
| Healthcare services |
75,311 | 6.96 | 70,199 | 8.13 | ||||||||||||
| Other industries |
131,332 | 12.13 | 85,780 | 9.94 | ||||||||||||
| Consumer products and services |
55,985 | 5.17 | 41,182 | 4.77 | ||||||||||||
| Media and telecom |
70,470 | 6.51 | 62,758 | 7.27 | ||||||||||||
| Hardware |
76,203 | 7.04 | 57,731 | 6.69 | ||||||||||||
| IT services |
68,203 | 6.30 | 70,138 | 8.13 | ||||||||||||
| Financial services |
55,215 | 5.10 | 58,872 | 6.82 | ||||||||||||
| Medical devices and equipment |
57,725 | 5.33 | 38,057 | 4.41 | ||||||||||||
| Biotech |
55,180 | 5.10 | 42,902 | 4.97 | ||||||||||||
| Business products and services |
56,635 | 5.23 | 48,337 | 5.60 | ||||||||||||
|
|
|
|
|
|
|
|
|
|||||||||
| Total venture portfolio industry |
880,667 | 81.34 | 692,123 | 80.19 | ||||||||||||
|
|
|
|
|
|
|
|
|
|||||||||
| VCS |
143,468 | 13.25 | 132,621 | 15.37 | ||||||||||||
| SBA and USDA |
51,510 | 4.76 | 35,276 | 4.09 | ||||||||||||
| Credit cards |
11,575 | 1.08 | 7,693 | 0.89 | ||||||||||||
| Other (overdrafts and in-process) |
(135 | ) | (0.01 | ) | (591 | ) | (0.07 | ) | ||||||||
|
|
|
|
|
|
|
|
|
|||||||||
| Total loans |
1,087,085 | 100.42 | 867,122 | 100.47 | ||||||||||||
|
|
|
|
|
|
|
|
|
|||||||||
| Less unearned income |
(4,549 | ) | (0.42 | ) | (4,041 | ) | (0.47 | ) | ||||||||
|
|
|
|
|
|
|
|
|
|||||||||
| Loans, net of unearned income |
$ | 1,082,536 | 100.00 | % | $ | 863,081 | 100.00 | % | ||||||||
|
|
|
|
|
|
|
|
|
|||||||||
61
Table of Contents
The following table provides a summary of total loans by size and category. The breakout of the categories is based on total client balances (individually or in the aggregate) at December 31, 2013.
| At December 31, 2013 | ||||||||||||||||||||||||||||||||
| Total | Less than $5 Million | $5 Million -$10 Million | > $10 Million | |||||||||||||||||||||||||||||
| Amount | Number | Amount | Number | Amount | Number | Amount | Number | |||||||||||||||||||||||||
| (Dollars in thousands) | ||||||||||||||||||||||||||||||||
| Commercial loans: |
||||||||||||||||||||||||||||||||
| Technology |
$ | 493,337 | 238 | $ | 328,288 | 214 | $ | 165,049 | 24 | $ | — | — | ||||||||||||||||||||
| Life sciences |
199,069 | 68 | 98,910 | 56 | 67,259 | 10 | 32,900 | 2 | ||||||||||||||||||||||||
| Venture capital/private equity |
143,468 | 70 | 60,168 | 61 | 40,496 | 6 | 42,804 | 3 | ||||||||||||||||||||||||
| Asset-based loans |
186,702 | 70 | 56,639 | 59 | 29,357 | 4 | 100,706 | 7 | ||||||||||||||||||||||||
| SBA and USDA |
23,719 | 40 | 23,719 | 40 | — | — | ||||||||||||||||||||||||||
| Other |
1,424 | 18 | 1,424 | 18 | — | — | — | — | ||||||||||||||||||||||||
|
|
|
|
|
|
|
|
|
|
|
|
|
|
|
|
|
|||||||||||||||||
| Total commercial loans |
1,047,719 | 504 | 569,148 | 448 | 302,161 | 44 | 176,410 | 12 | ||||||||||||||||||||||||
| Real estate loans: |
||||||||||||||||||||||||||||||||
| SBA and USDA |
27,504 | 44 | 21,669 | 43 | 5,835 | 1 | ||||||||||||||||||||||||||
|
|
|
|
|
|
|
|
|
|
|
|
|
|
|
|
|
|||||||||||||||||
| Total real estate loans |
27,504 | 44 | 21,669 | 43 | 5,835 | 1 | — | — | ||||||||||||||||||||||||
| Construction loans: |
||||||||||||||||||||||||||||||||
| SBA and USDA |
287 | 1 | 287 | 1 | — | — | — | — | ||||||||||||||||||||||||
|
|
|
|
|
|
|
|
|
|
|
|
|
|
|
|
|
|||||||||||||||||
| Total construction loans |
287 | 1 | 287 | 1 | — | — | — | — | ||||||||||||||||||||||||
| Credit cards |
11,575 | 578 | 11,575 | 578 | — | — | — | — | ||||||||||||||||||||||||
|
|
|
|
|
|
|
|
|
|
|
|
|
|
|
|
|
|||||||||||||||||
| Total loans |
1,087,085 | 1,127 | $ | 602,679 | 1,070 | $ | 307,996 | 45 | $ | 176,410 | 12 | |||||||||||||||||||||
|
|
|
|
|
|
|
|
|
|
|
|
|
|
|
|||||||||||||||||||
| Less unearned income |
(4,549 | ) | ||||||||||||||||||||||||||||||
|
|
|
|||||||||||||||||||||||||||||||
| Loans, net of unearned income |
$ | 1,082,536 | ||||||||||||||||||||||||||||||
|
|
|
|||||||||||||||||||||||||||||||
At December 31, 2013, gross loans equal to or greater than $7.5 million to any single client, individually or in the aggregate, totaled $221.3 million, or 20.4%, of our loan portfolio. These loans represented 19 client relationships and none of these loans were on nonaccrual status as of December 31, 2013.
62
Table of Contents
Loan Maturity
As of December 31, 2013, 92.7% or $1.0 billion, of our total outstanding gross loans were variable-rate loans that adjust at specified dates based on our prime lending rate or other variable indices, compared to $836.7 million, or 96.9%, as of December 31, 2012. The following table sets forth the remaining contractual maturity distribution of our gross loan portfolio by industry sector at December 31, 2013, for fixed and variable-rate loans.
| One Year or Less |
After One Year and Through Five Years |
After Five Years |
Total | |||||||||||||
| (In thousands) | ||||||||||||||||
| Fixed-rate loans: |
||||||||||||||||
| Commercial loans: |
||||||||||||||||
| Technology |
$ | 1,948 | $ | 4,414 | $ | — | $ | 6,362 | ||||||||
| Life sciences |
6,273 | 26,343 | — | 32,616 | ||||||||||||
| Venture capital/private equity |
— | 452 | — | 452 | ||||||||||||
| Asset-based loans |
19,217 | 18,646 | — | 37,863 | ||||||||||||
| SBA and USDA |
— | — | — | — | ||||||||||||
| Other |
— | — | 528 | 528 | ||||||||||||
|
|
|
|
|
|
|
|
|
|||||||||
| Total commercial loans |
27,438 | 49,855 | 528 | 77,821 | ||||||||||||
| Real estate loans: |
||||||||||||||||
| SBA and USDA |
— | — | 1,900 | 1,900 | ||||||||||||
|
|
|
|
|
|
|
|
|
|||||||||
| Total real estate loans |
— | — | 1,900 | 1,900 | ||||||||||||
| Construction loans: |
||||||||||||||||
| SBA and USDA |
— | — | — | — | ||||||||||||
|
|
|
|
|
|
|
|
|
|||||||||
| Total construction loans |
— | — | — | — | ||||||||||||
| Credit cards |
— | — | — | — | ||||||||||||
|
|
|
|
|
|
|
|
|
|||||||||
| Total fixed-rate loans |
$ | 27,438 | $ | 49,855 | $ | 2,428 | 79,721 | |||||||||
|
|
|
|
|
|
|
|
|
|||||||||
| Variable-rate loans: |
||||||||||||||||
| Commercial loans: |
||||||||||||||||
| Technology |
$ | 200,342 | $ | 286,633 | $ | — | $ | 486,975 | ||||||||
| Life sciences |
39,117 | 127,336 | — | 166,453 | ||||||||||||
| Venture capital/private equity |
121,760 | 19,547 | 1,709 | 143,016 | ||||||||||||
| Asset-based loans |
70,465 | 78,374 | — | 148,839 | ||||||||||||
| SBA and USDA |
— | — | 23,719 | 23,719 | ||||||||||||
| Other |
896 | — | — | 896 | ||||||||||||
|
|
|
|
|
|
|
|
|
|||||||||
| Total commercial loans |
432,580 | 511,890 | 25,428 | 969,898 | ||||||||||||
| Real estate loans: |
||||||||||||||||
| SBA and USDA |
— | — | 25,604 | 25,604 | ||||||||||||
|
|
|
|
|
|
|
|
|
|||||||||
| Total real estate loans |
— | — | 25,604 | 25,604 | ||||||||||||
| Construction loans: |
||||||||||||||||
| SBA and USDA |
— | — | 287 | 287 | ||||||||||||
|
|
|
|
|
|
|
|
|
|||||||||
| Total construction loans |
— | — | 287 | 287 | ||||||||||||
| Credit cards |
11,575 | — | — | 11,575 | ||||||||||||
|
|
|
|
|
|
|
|
|
|||||||||
| Total variable-rate loans |
$ | 444,155 | $ | 511,890 | $ | 51,319 | 1,007,364 | |||||||||
|
|
|
|
|
|
|
|
|
|||||||||
| Less unearned income |
(4,549 | ) | ||||||||||||||
|
|
|
|||||||||||||||
| Total loans, net of unearned income |
$ | 1,082,536 | ||||||||||||||
|
|
|
|||||||||||||||
Of the $561.7 million in loans due between one and five years, $431.0 million, or 76.7%, mature in less than three years.
Upon maturity, loans satisfying our credit quality standards may be renewed. Such renewals are subject to the same underwriting and credit administration practices as we utilize for new loans. It is not our practice to grant loans with unconditional extension or renewal terms.
63
Table of Contents
Investment Securities
Investment securities totaled $1.1 billion at December 31, 2013, an increase of $235.3 million, or 27.9%, compared to $843.2 million at December 31, 2012. Our investment securities portfolio increased $134.8 million, or 19.0%, to $843.2 million at December 31, 2012, from $708.4 million at December 31, 2011.
Our investment securities portfolio is comprised of both available-for-sale securities and securities that we intend to hold to maturity. We purchase securities for our investment securities portfolio to manage interest rate risk, ensure a stable source of liquidity, and to provide a steady source of income in excess of our cost of funds.
The following table sets forth the amortized cost and fair values of our securities portfolio at the dates indicated.
| At December 31, | ||||||||||||||||||||||||
| 2013 | 2012 | 2011 | ||||||||||||||||||||||
| Amortized Cost |
Fair Value |
Amortized Cost |
Fair Value |
Amortized Cost |
Fair Value |
|||||||||||||||||||
| (In thousands) | ||||||||||||||||||||||||
| Available for sale securities: |
||||||||||||||||||||||||
| U.S. Treasury Securities |
$ | — | $ | — | $ | — | $ | — | $ | — | $ | — | ||||||||||||
| Agency direct obligations |
34,853 | 35,061 | — | — | — | — | ||||||||||||||||||
| SBA pools |
127,309 | 129,211 | 161,364 | 165,120 | 131,206 | 132,315 | ||||||||||||||||||
| Agency mortgage-backed securities |
445,855 | 447,850 | 399,167 | 409,171 | 499,869 | 501,802 | ||||||||||||||||||
| Corporates |
148,288 | 145,817 | 66,375 | 68,406 | — | — | ||||||||||||||||||
| Municipal bonds |
97,532 | 92,029 | 106,433 | 110,735 | 22,219 | 22,854 | ||||||||||||||||||
| Non-agency mortgage-backed securities |
54,134 | 52,170 | 26,352 | 19,016 | 30,106 | 17,812 | ||||||||||||||||||
| Other asset-backed securities |
22,787 | 22,091 | 5,002 | 3,712 | 6,553 | 4,770 | ||||||||||||||||||
|
|
|
|
|
|
|
|
|
|
|
|
|
|||||||||||||
| Total available for sale |
$ | 930,758 | $ | 924,229 | $ | 764,693 | $ | 776,160 | $ | 689,953 | $ | 679,553 | ||||||||||||
|
|
|
|
|
|
|
|
|
|
|
|
|
|||||||||||||
| Held to maturity securities: |
||||||||||||||||||||||||
| Agency mortgage-backed securities |
$ | 18,666 | $ | 18,246 | $ | 15,311 | $ | 15,860 | $ | 16,713 | $ | 17,146 | ||||||||||||
| Municipal bonds |
127,339 | 122,009 | 39,594 | 39,390 | — | — | ||||||||||||||||||
| Corporates |
8,250 | 6,299 | 8,227 | 5,850 | 8,214 | 7,684 | ||||||||||||||||||
| Other |
— | — | 3,890 | 3,890 | 3,890 | 3,890 | ||||||||||||||||||
|
|
|
|
|
|
|
|
|
|
|
|
|
|||||||||||||
| Total held to maturity |
$ | 154,255 | $ | 146,554 | $ | 67,022 | $ | 64,990 | 28,817 | 28,720 | ||||||||||||||
|
|
|
|
|
|
|
|
|
|
|
|
|
|||||||||||||
| Total securities |
$ | 1,085,013 | $ | 1,070,783 | $ | 831,715 | $ | 841,150 | $ | 718,770 | $ | 708,273 | ||||||||||||
|
|
|
|
|
|
|
|
|
|
|
|
|
|||||||||||||
Our available-for-sale securities portfolio totaled $924.2 million at December 31, 2013, an increase of $148.1 million, or 19.1%, compared to $776.2 million at December 31, 2012. The increase was primarily due to purchases of new investment securities, consisting mostly of corporate securities, non-agency mortgage-backed securities and other asset-backed securities. Available-for-sale securities increased $96.6 million, or 14.2%, to $776.2 million at December 31, 2012 compared to $679.6 million at December 31, 2011. The increase in 2012 from 2011 was primarily due to our purchase of new securities, mostly municipal bonds. Legacy non-agency mortgage-backed securities represent $20.9 million of the $52.2 million of non-agency mortgage-backed securities held as of December 31, 2013. The $20.9 million of legacy non-agency mortgage-backed securities were purchased prior to 2008 before the onset of the financial crisis and the balance of the $52.2 million are investment grade non-agency mortgage-backed securities purchased in 2013. The $20.9 million of legacy non-agency mortgage-backed securities purchased before 2008 is spread across a number of originators and issuers. There are 25 unique securities that have an average balance of $836,000, with the largest single security having a fair value of $2.9 million as of December 31, 2013. Of the $20.9 million in securities, $15.6 million had multiple underlying loan originators. Of the remaining $5.3 million, the largest exposure to a single loan originator was $1.7 million to Bank of America. There are also 17 different issuers that comprise the $20.9 million, with the largest remaining exposure of $4.6 million to Credit-Based Asset Servicing and Securitization. The underlying loans in this group are comprised of prime (43%), Alt-A (16%) and sub-prime (41%) loans. The underlying loans consist primarily of one-to four-family real estate loans and are secured by first position liens.
The other $31.3 million of the $52.2 million of non-agency mortgage-backed securities purchased in 2013 is comprised of 14 different securities from five underlying issuers. The loans underlying such securities are comprised of prime (82%) and Alt-A (18%) loans.
64
Table of Contents
Other asset-backed securities are comprised of two small student loan securities with an aggregate fair value of $1.5 million at December 31, 2013, a trust preferred CDO totaling $3.4 million and two venture debt obligations with an aggregate fair value of $17.2 million. The loans underlying the two venture debt obligations are similar to the loans in our venture banking portfolio and have an estimated average life of one year or less.
We monitor our non-agency mortgage-backed securities and other asset-backed securities on an ongoing basis. Principal repayment, delinquencies, prepayments and default rates are tracked monthly. In addition, we perform a discounted cash flow analysis for our non-agency mortgage-backed securities on a quarterly basis as part of our OTTI review. The student loan securities and the trust preferred CDO are monitored semi-annually.
Our held to maturity securities portfolio is mainly comprised of municipal bonds, which we began purchasing for this portfolio in 2011. Prior to that, our held to maturity securities portfolio was primarily comprised of agency mortgage-backed securities. Our held to maturity securities portfolio had an amortized cost of $154.3 million at December 31, 2013, an increase of $87.3 million, or 130.3%, compared to $67.0 million at December 31, 2012. Of this increase, $23.7 million was the result of a transfer of municipal bonds from available-for-sale to held-to-maturity during the fourth quarter of 2013. Held to maturity securities increased $38.2 million, or 132.6%, to $67.0 million at December 31, 2012 from $28.8 million at December 31, 2011. The increases in this portfolio in 2011, 2012 and 2013 were primarily due to our purchase of new municipal bond securities that we intend to hold until they are either called or reach maturity.
At December 31, 2013, the duration of our available-for-sale securities portfolio was approximately 2.1 years and the overall investment securities portfolio duration was 2.8 years.
The following table sets forth the stated maturities and weighted average yields of investment securities at December 31, 2013. Weighted average yields on tax-exempt securities are presented on a tax equivalent basis. While not reflected in the table below, 36.0% of the investment portfolio is either floating rate or adjustable rate securities and will reprice either immediately or within the first year based on the repricing of the underlying loans.
| December 31, 2013 | ||||||||||||||||||||||||||||||||||||
| Total Amortized Cost |
Less than One Year | After One to Five Years | After Five to Ten Years | After Ten Years | ||||||||||||||||||||||||||||||||
| Amortized Cost |
Average Yield |
Amortized Cost |
Average Yield |
Amortized Cost |
Average Yield |
Amortized Cost |
Average Yield |
|||||||||||||||||||||||||||||
| (Dollars in thousands) | ||||||||||||||||||||||||||||||||||||
| Available for sale securities: |
||||||||||||||||||||||||||||||||||||
| U.S. Treasury securities |
$ | — | $ | — | — | % | $ | — | — | % | $ | — | — | % | $ | — | — | % | ||||||||||||||||||
| Agency direct obligations |
34,853 | 3,890 | 2.75 | 30,963 | 0.76 | — | — | — | — | |||||||||||||||||||||||||||
| SBA pools |
127,309 | — | — | — | — | 60,384 | 1.50 | 66,925 | 1.50 | |||||||||||||||||||||||||||
| Agency mortage-backed securities |
445,855 | — | — | — | — | 29,190 | 1.46 | 416,665 | 2.28 | |||||||||||||||||||||||||||
| Corporates |
148,288 | — | — | 55,610 | 1.57 | 12,945 | 1.34 | 79,733 | 3.29 | |||||||||||||||||||||||||||
| Municipal bonds |
97,532 | — | — | — | — | 6,002 | 3.82 | 91,530 | 4.33 | |||||||||||||||||||||||||||
| Non-agency mortage-backed securities |
54,134 | — | — | — | — | — | — | 54,134 | 2.87 | |||||||||||||||||||||||||||
| Other asset-backed securities |
22,787 | — | — | 17,127 | 2.86 | — | — | 5,660 | 1.11 | |||||||||||||||||||||||||||
|
|
|
|
|
|
|
|
|
|
|
|||||||||||||||||||||||||||
| Total |
$ | 930,758 | $ | 3,890 | 2.75 | % | $ | 103,700 | 1.54 | % | $ | 108,521 | 1.60 | % | $ | 714,647 | 2.62 | % | ||||||||||||||||||
|
|
|
|
|
|
|
|
|
|
|
|
|
|
|
|
|
|
|
|||||||||||||||||||
| Held to maturity securities: |
. | |||||||||||||||||||||||||||||||||||
| Agency mortage-backed securities |
$ | 18,666 | $ | — | — | % | $ | — | — | % | $ | — | — | % | $ | 18,666 | 3.18 | % | ||||||||||||||||||
| Municipal bonds |
127,339 | — | — | — | — | 6,815 | 2.38 | 120,524 | 5.23 | |||||||||||||||||||||||||||
| Corporates |
8,250 | — | — | — | — | — | — | 8,250 | 2.42 | |||||||||||||||||||||||||||
| Other |
— | — | — | — | — | — | — | — | — | |||||||||||||||||||||||||||
|
|
|
|
|
|
|
|
|
|
|
|||||||||||||||||||||||||||
| Total |
$ | 154,255 | $ | — | — | $ | — | — | $ | 6,815 | 2.38 | $ | 147,440 | 4.81 | % | |||||||||||||||||||||
|
|
|
|
|
|
|
|
|
|
|
|
|
|
|
|||||||||||||||||||||||
| Total securities |
$ | 1,085,013 | $ | 3,890 | 2.75 | % | $ | 103,700 | 1.54 | % | $ | 115,336 | 1.64 | % | $ | 862,087 | 2.99 | % | ||||||||||||||||||
|
|
|
|
|
|
|
|
|
|
|
|
|
|
|
|
|
|
|
|||||||||||||||||||
65
Table of Contents
Derivatives
Derivative instruments are recorded as a component of other assets and other liabilities on the balance sheet.
Equity Warrant Assets. In most cases, we seek equity warrants in connection with extending loan commitments to our customers. In general, the equity warrants entitle us to purchase a specific number of shares of a client’s stock at a specific price over a specified time period. The warrants may also include contingent provisions which provide for additional shares to be purchased at a specific price if defined future events occur, such as future rounds of equity financing by the client. These warrants are obtained at the inception of a loan facility or the amendment of a loan facility. These warrants are not obtained in lieu of other fees, interest or payments. These warrants potentially provide an additional return, in addition to the traditional loan yield from interest and fees, in the event that a liquidity event of the borrowing company occurs. The grant date fair values of equity warrants received in connection with extending loan commitments are considered to be loan fees and are recognized over the life of the loan commitment as an adjustment to the loan yield through loan interest income. Any changes from the grant date in the fair value of equity warrant assets are recognized as increases or decreases to warrant valuation and as net gains or losses in noninterest income during the period in which the change is recognized. These changes in warrant valuation and related gains or losses may occur as a result of a change in the Black Scholes value of the warrant, when a portfolio company completes an initial public offering on a publicly reported market or is acquired. We may exercise these equity warrant assets for either shares or cash.
Our equity warrants portfolio is primarily comprised of warrants in non-public companies and our practice is to monetize our positions as soon as a liquidity event occurs. Often, there is a lock-up period requiring us to hold our equity position in a publicly traded security until the expiration of the lock-up period. Warrants held, which amounted to $5.1 million held in 451 companies and $4.8 million held in 396 companies at December 31, 2013 and 2012, respectively, are shown as warrant valuation in the accompanying consolidated balance sheets. At December 31, 2013, included in the $5.1 million in equity warrant assets in 451 companies are $1.0 million of equity warrant assets held in three publicly traded companies, which we intend to monetize upon expiration of the respective lock-up periods. We did not hold any equity warrant assets in publicly traded companies at December 31, 2012.
Foreign Exchange Forward Contracts. We enter into foreign exchange forward contracts with clients involved in foreign activities, either as the purchaser or seller, depending upon the clients’ needs. For each forward contract entered into with our clients, we enter into an opposite way forward contract with a correspondent bank, which mitigates the risk of fluctuations in currency rates. As of December 31, 2013, we had $3.9 million in gross notional customer outstanding forward contracts and an offsetting $3.8 million in gross national correspondent bank outstanding forward contracts.
Deposits
The following table sets forth the composition of our deposits at December 31, 2013, 2012 and 2011.
| At December 31, | ||||||||||||||||||||||||
| 2013 | 2012 | 2011 | ||||||||||||||||||||||
| Amount | Percent | Amount | Percent | Amount | Percent | |||||||||||||||||||
| (Dollars in thousands) | ||||||||||||||||||||||||
| Period end: |
||||||||||||||||||||||||
| Noninterest-bearing demand deposits |
$ | 1,380,024 | 65.51 | % | $ | 1,061,191 | 69.85 | % | $ | 1,028,594 | 68.18 | % | ||||||||||||
| Interest-bearing deposits: |
||||||||||||||||||||||||
| Demand deposits |
103,638 | 4.92 | — | — | — | — | ||||||||||||||||||
| Money market |
596,247 | 28.30 | 442,285 | 29.11 | 458,287 | 30.37 | ||||||||||||||||||
| Time deposits |
26,818 | 1.27 | 15,853 | 1.04 | 21,948 | 1.45 | ||||||||||||||||||
|
|
|
|
|
|
|
|
|
|
|
|
|
|||||||||||||
| Total period end deposits |
$ | 2,106,727 | 100.00 | % | $ | 1,519,329 | 100.00 | % | $ | 1,508,829 | 100.00 | % | ||||||||||||
|
|
|
|
|
|
|
|
|
|
|
|
|
|||||||||||||
66
Table of Contents
| For the Years Ended December 31, | ||||||||||||||||||||||||
| 2013 | 2012 | 2011 | ||||||||||||||||||||||
| Amount | Percent | Amount | Percent | Amount | Percent | |||||||||||||||||||
| (Dollars in thousands) | ||||||||||||||||||||||||
| Average: |
||||||||||||||||||||||||
| Noninterest-bearing demand deposits |
$ | 1,148,529 | 61.37 | % | $ | 1,009,474 | 65.95 | % | $ | 884,784 | 62.80 | % | ||||||||||||
| Interest-bearing deposits: |
||||||||||||||||||||||||
| Demand deposits |
67,059 | 3.58 | 20 | — | 52 | — | ||||||||||||||||||
| Money market |
624,281 | 33.36 | 488,924 | 31.95 | 497,135 | 35.29 | ||||||||||||||||||
| Time deposits |
31,552 | 1.69 | 32,082 | 2.10 | 26,915 | 1.91 | ||||||||||||||||||
|
|
|
|
|
|
|
|
|
|
|
|
|
|||||||||||||
| Total average deposits |
$ | 1,871,421 | 100.00 | % | $ | 1,530,500 | 100.00 | % | $ | 1,408,886 | 100.00 | % | ||||||||||||
|
|
|
|
|
|
|
|
|
|
|
|
|
|||||||||||||
Our deposits increased to $2.1 billion at December 31, 2013, from $1.5 billion at December 31, 2012, an increase of $587.4 million, or 38.7%. This increase was primarily due to growth of our client base and an increase in deposits due to our introduction of an interest-bearing demand account. While our noninterest-bearing deposits increased $318.8 million, or 30.0%, during this period, our interest-bearing deposits increased $268.6 million, or 58.6% during this same period. Changes in our period end deposits are impacted by the timing of year-end activity of our customers, primarily venture firms.
At December 31, 2013, the aggregate balance of time deposit accounts individually equal to or greater than $100,000 totaled $26.6 million. At December 31, 2013, substantially all time deposit accounts in amounts equal to or greater than $100,000 were scheduled to mature within one year. The maturity profile of our time deposits as of December 31, 2013 is as follows:
| Maturity Period at December 31, 2013 |
Three months or less |
More than three months to six months |
More
than six months to twelve months |
More than twelve months |
||||||||||||
| (Dollars in thousands) | ||||||||||||||||
| Time deposits, $100,000 and over |
$ | 22,720 | $ | 3,004 | $ | 754 | $ | 101 | ||||||||
| Other time deposits |
148 | 91 | — | — | ||||||||||||
|
|
|
|
|
|
|
|
|
|||||||||
| Total time deposits |
$ | 22,868 | $ | 3,095 | $ | 754 | $ | 101 | ||||||||
|
|
|
|
|
|
|
|
|
|||||||||
Client Investment Funds
We utilize alternative cash investment vehicles to manage our on-balance sheet deposit growth, which tends to be volatile as is typical in the market in which we operate. For example, we offer our clients alternative cash investment vehicles such as sweep accounts and investments in the CDARS, the latter of which allows us to place client deposits in one or more insured depository institutions. Square 1 Asset Management offers customized solutions to our clients that are tailored to meet the unique corporate cash management needs of entrepreneurial companies and venture firms. At December 31, 2013, Square 1 Asset Management had $108.1 million of assets under management. We expect to continue to manage our on-balance sheet deposit growth through these alternative investment vehicles for our clients and to grow the amount of assets under management by Square 1 Asset Management.
The following table summarizes average and period-end client investment funds at and for the dates indicated.
| For the Years ended December 31, | ||||||||||||
| 2013 | 2012 | % Change |
||||||||||
| (Dollars in thousands) | ||||||||||||
| Average: | ||||||||||||
| Client investment assets under management |
$ | 36,503 | $ | — | — | % | ||||||
| Sweep money market funds |
219,550 | 150,263 | 46.1 | |||||||||
| CDARS |
189,535 | 291,790 | (35.0 | ) | ||||||||
|
|
|
|
|
|||||||||
| Total average client investment funds |
$ | 445,588 | $ | 442,053 | 0.8 | % | ||||||
|
|
|
|
|
|
|
|||||||
67
Table of Contents
| At December 31, | ||||||||||||
| 2013 | 2012 | % Change |
||||||||||
| (Dollars in thousands) | ||||||||||||
| Period end: | ||||||||||||
| Client investment assets under management |
$ | 108,105 | $ | — | NA | |||||||
| Sweep money market funds |
271,823 | 210,583 | 29.1 | % | ||||||||
| CDARS |
177,955 | 167,349 | 6.3 | |||||||||
|
|
|
|
|
|||||||||
| Total period end client investment funds |
$ | 557,883 | $ | 377,932 | 47.6 | % | ||||||
|
|
|
|
|
|
|
|||||||
Borrowings
As a result of strong deposit levels, we decreased borrowings by $77.3 million at December 31, 2013, through $90.0 million in net repayments of Federal Home Loan Bank advances, partially offset by a $12.7 million increase in repurchase agreements. Federal Home Loan Bank advances increased $90.0 million at December 31, 2012, compared to December 31, 2011.
Long-Term Debt
On September 30, 2008, Square 1 Financial Capital Trust I, a Delaware statutory business trust, that is a subsidiary of Square 1 Financial, issued $7.4 million of trust preferred securities in a private placement offering. Distributions payable on the trust preferred securities are cumulative and are payable at a fixed rate of interest per annum equal to 8.0%. The holders of the trust preferred securities have no voting rights. The trust preferred securities are convertible into Square 1 Financial Class A common stock at any time at a conversion ratio equal to $10.00 per share. The trust preferred securities mature on September 30, 2038, and may be redeemed by us on the last day of any quarter. We intend to redeem such trust preferred securities at the first quarterly redemption date following the offering to the extent that any trust preferred securities remain outstanding following the close of the offering. We anticipate that a large portion of the trust preferred securities will be converted into our common stock by the holders prior to the redemption date. At December 31, 2013, our trust preferred securities have a debt discount of $1.4 million, the amortization of which will be accelerated upon redemption or conversion of the trust preferred securities.
Risk Management
Overview. Managing risk is an essential part of successfully managing a financial institution. Our most prominent risk exposures are credit risk, interest rate risk and market risk. Credit risk is the risk of not collecting the interest and/or the principal balance of a loan or investment when it is due. Interest rate risk is the potential reduction of net interest income as a result of changes in interest rates. Market risk arises from fluctuations in interest rates that may result in changes in the values of financial instruments, such as available for sale securities, which are accounted for on a mark-to-market basis. Other risks that we face are operational risks, liquidity risks and reputation risk. Operational risks include risks related to fraud, regulatory compliance, processing errors, technology and disaster recovery. Liquidity risk is the possible inability to fund obligations to depositors, lenders or borrowers due to unforeseen circumstances. Reputation risk is the risk that negative publicity or press, whether true or not, could cause a decline in our customer base or revenue.
Credit Risk
Analysis of Nonperforming and Classified Assets. We place loans that are 90 days or more past due as to principal or interest payments on nonaccrual status, or prior to that, if we have determined based upon current information available to us that the timely collection of principal or interest is not probable. When a loan is placed on nonaccrual status, any previously recorded interest is reversed and recorded as a reduction of loan interest and fee income. Typically, collections of interest and principal received on a nonaccrual loan are applied to the outstanding principal as determined at the time of collection of the loan.
Troubled debt restructurings occur when debtors are granted concessions that we would not otherwise consider because of economic or legal reasons pertaining to the debtor’s financial difficulties. Such concessions would include, but are not limited to, the transfer of assets or the issuance of equity interests by the debtor to satisfy all or part of the debt, modification of the terms of debt or the substitution or addition of debtor(s).
68
Table of Contents
The following table provides information with respect to our nonperforming assets and troubled debt restructurings at the dates indicated.
| At December 31, | ||||||||||||||||||||
| 2013 | 2012 | 2011 | 2010 | 2009 | ||||||||||||||||
| (In thousands) | ||||||||||||||||||||
| Nonaccrual loans: |
||||||||||||||||||||
| Commercial loans: |
||||||||||||||||||||
| Technology |
$ | 12,153 | $ | 14,149 | $ | 4,748 | $ | 5,407 | $ | 5,560 | ||||||||||
| Life sciences |
— | — | 2,315 | 117 | 1,162 | |||||||||||||||
| Venture capital/private equity |
— | — | — | — | — | |||||||||||||||
| Asset-based loans |
— | — | — | — | — | |||||||||||||||
| SBA and USDA |
648 | 368 | — | — | — | |||||||||||||||
| Other |
— | — | — | — | — | |||||||||||||||
|
|
|
|
|
|
|
|
|
|
|
|||||||||||
| Total commercial loans |
12,801 | 14,517 | 7,063 | 5,524 | 6,722 | |||||||||||||||
| Real estate loans: |
||||||||||||||||||||
| SBA and USDA |
1,665 | — | — | — | — | |||||||||||||||
|
|
|
|
|
|
|
|
|
|
|
|||||||||||
| Total real estate loans |
1,665 | — | — | — | — | |||||||||||||||
| Construction |
— | — | — | — | — | |||||||||||||||
| Credit cards |
— | — | — | — | — | |||||||||||||||
|
|
|
|
|
|
|
|
|
|
|
|||||||||||
| Total nonaccrual loans |
14,466 | 14,517 | 7,063 | 5,524 | 6,722 | |||||||||||||||
|
|
|
|
|
|
|
|
|
|
|
|||||||||||
| Other real estate owned |
— | — | — | — | — | |||||||||||||||
|
|
|
|
|
|
|
|
|
|
|
|||||||||||
| Total nonperforming loans |
$ | 14,466 | $ | 14,517 | $ | 7,063 | $ | 5,524 | $ | 6,722 | ||||||||||
|
|
|
|
|
|
|
|
|
|
|
|||||||||||
| Total accruing loans past 90 days or more |
$ | — | $ | 1,460 | $ | — | $ | — | $ | — | ||||||||||
|
|
|
|
|
|
|
|
|
|
|
|||||||||||
| Foreclosed assets(1) |
$ | 119 | $ | 119 | $ | 1,237 | $ | 3,237 | $ | 400 | ||||||||||
|
|
|
|
|
|
|
|
|
|
|
|||||||||||
| Accruing troubled debt restructurings |
— | — | — | — | — | |||||||||||||||
| Nonaccrual troubled debt restructurings |
3,379 | 3,565 | 2,547 | 649 | 3,073 | |||||||||||||||
|
|
|
|
|
|
|
|
|
|
|
|||||||||||
| Total troubled debt restructurings |
3,379 | 3,565 | 2,547 | 649 | 3,073 | |||||||||||||||
| Less: nonaccrual troubled debt restructurings included in total nonaccrual loans |
(3,379 | ) | (3,565 | ) | (2,547 | ) | (649 | ) | (3,073 | ) | ||||||||||
|
|
|
|
|
|
|
|
|
|
|
|||||||||||
| Total nonperforming assets and troubled debt restructurings |
$ | 14,585 | $ | 16,096 | $ | 8,300 | $ | 8,761 | $ | 7,122 | ||||||||||
|
|
|
|
|
|
|
|
|
|
|
|||||||||||
| Total nonperforming loans to total loans |
1.34 | % | 1.68 | % | 0.99 | % | 1.13 | % | 1.47 | % | ||||||||||
| Total nonperforming loans to total assets |
0.62 | % | 0.81 | % | 0.43 | % | 0.35 | % | 0.61 | % | ||||||||||
| Total nonperforming assets and troubled debt restructurings to total assets |
0.63 | % | 0.89 | % | 0.50 | % | 0.55 | % | 0.65 | % | ||||||||||
| (1) | Foreclosed assets consist of capital stock acquired in lieu of incurring a charge-off. |
69
Table of Contents
The following table presents a composition of nonperforming loans by stage at December 31, 2013.
| At December 31, 2013 | ||||||||||||
| Amount | Number | Percent | ||||||||||
| (Dollars in thousands) |
||||||||||||
| Stage: |
||||||||||||
| Early |
$ | 1,580 | 3 | 13.00 | % | |||||||
| Expansion |
3,287 | 2 | 27.05 | |||||||||
| Late |
7,286 | 3 | 59.95 | |||||||||
|
|
|
|
|
|
|
|||||||
| Total portfolio company loans |
$ | 12,153 | 8 | 100.00 | % | |||||||
|
|
|
|
|
|
|
|||||||
At December 31, 2013, our total nonperforming assets and troubled debt restructurings were $14.6 million, a $1.5 million, or 9.4%, decline from December 31, 2012. At December 31, 2013, nonperforming loans and troubled debt restructurings represented 1.34% of our total loans and were comprised of 10 credits that had $5.4 million in specific reserves held against them.
At December 31, 2012, our total nonperforming assets and troubled debt restructurings were $16.1 million, an $7.8 million, or 93.9%, increase from December 31, 2011. At December 31, 2012, nonperforming loans and troubled debt restructurings represented 1.68% of our total loans and were comprised of eight credits that had $3.3 million in specific reserves held against them.
As of December 31, 2013, our criticized (performing) and impaired loans represented 8.5% of our total gross loans. This compares to 9.2% at December 31, 2012. 68.2% of our criticized and impaired loans at December 31, 2013 are to companies in the technology sector, across all growth stages. Loans to technology sector companies represented approximately 45.4% of our loan portfolio at December 31, 2013. Loans to early and expansion stage clients comprise 79.0% of our criticized and nonperforming loans. It is common for an early or expansion stage client’s remaining liquidity to fall temporarily below the threshold necessary for a pass-rated credit during its capital-raising period for a new round of funding. This situation typically lasts only a few weeks and, in our experience, generally resolves itself with a subsequent round of venture funding. As a result, we expect that some of our early-stage and expansion stage clients will be managed through our criticized portfolio during a portion of their life cycle without resulting in net charge-offs.
Management is proactive in its approach to identifying and resolving problem loans and is focused on working with the borrowers and guarantors of these loans to provide loan modifications when warranted. The level of nonperforming assets fluctuates in response to changing economic and market conditions, the relative size and composition of the loan portfolio, as well as management’s degree of success in resolving problem assets.
Interest income that would have been recorded for the years ended December 31, 2013 and 2012 had nonaccruing loans and troubled debt restructurings been current in accordance with their original terms and had been outstanding throughout the period amounted to $0.9 million and $0.7 million, respectively.
Allowance for Loan Losses. The allowance for loan losses, a material estimate which could change significantly in the near-term, is established through a provision for loan losses charged to earnings to account for losses that are inherent in the loan portfolio and estimated to occur, and is maintained at a level that management considers adequate to absorb losses in the loan portfolio. Loan losses are charged against the allowance for loan losses when management believes that the uncollectibility of the principal loan balance is confirmed. Subsequent recoveries, if any, are credited to the allowance for loan losses when received.
Management’s judgment in determining the adequacy of the allowance is inherently subjective as it requires estimates that are susceptible to significant revision as more information becomes available and as situations and information change. The allowance for loan losses is evaluated on a monthly basis by management and takes into consideration such factors as changes in the nature and volume of the loan portfolio, overall portfolio quality, review of specific problem loans and current economic conditions and trends that may affect the borrower’s ability to repay.
70
Table of Contents
The allowance for loan losses consists of the following key elements:
| • | Specific allowance for identified impaired loans. For such loans that are identified as impaired, an allowance is established when the discounted cash flows (or collateral value if the loan is collateral dependent) or observable market price of the impaired loan are lower than the carrying value of that loan. |
| • | General valuation allowance, which represents a valuation allowance on the remainder of the loan portfolio, after excluding impaired loans. For this portion of the allowance, loans are reviewed based on industry, stage and structure and are assigned allowance percentages based on historical loan loss experience adjusted for qualitative factors. Qualitative factors that, in management’s judgment, affect the collectibility of the portfolio as of the evaluation date, may include changes in lending policies and procedures; changes in national and local economic and business conditions, including the condition of various market segments; changes in the nature and volume of the portfolio; changes in the experience, ability and depth of lending management and staff; changes in the volume and severity of past due and classified loans and in the volume of nonaccruals, trouble debt restructurings, and other loan modifications; the existence and effect of any concentrations of credit and changes in the level of such concentrations; and the effect of external factors, such as competition and legal and regulatory requirements, on the level of estimated and inherent credit losses in the Bank’s current portfolio. |
The following table sets forth the breakdown of the allowance for loan losses by loan category at the dates indicated.
| At December 31, | ||||||||||||||||||||||||||||||||||||
| 2013 | 2012 | 2011 | ||||||||||||||||||||||||||||||||||
| (Dollars in thousands) | ||||||||||||||||||||||||||||||||||||
| Amount | % of Allowance of Total Allowance |
% of Loans in Category to Total Loans |
Amount | % of Allowance of Total Allowance |
% of Loans in Category to Total Loans |
Amount | % of Allowance of Total Allowance |
% of Loans in Category to Total Loans |
||||||||||||||||||||||||||||
| Commercial loans: |
||||||||||||||||||||||||||||||||||||
| Technology |
$ | 12,476 | 67.88 | % | 45.39 | % | $ | 10,548 | 76.20 | % | 48.06 | % | $ | 8,469 | 72.80 | % | 58.36 | % | ||||||||||||||||||
| Life sciences |
1,894 | 10.31 | 18.31 | 804 | 5.81 | 19.43 | 1,550 | 13.33 | 15.87 | |||||||||||||||||||||||||||
| Venture capital/private equity |
197 | 1.07 | 13.20 | 152 | 1.10 | 15.29 | 156 | 1.34 | 12.54 | |||||||||||||||||||||||||||
| Asset-based loans |
1,894 | 10.31 | 17.17 | 1,205 | 8.70 | 12.11 | 895 | 7.69 | 9.95 | |||||||||||||||||||||||||||
| SBA and USDA |
627 | 3.41 | 2.18 | 381 | 2.75 | 1.02 | 266 | 2.29 | 1.60 | |||||||||||||||||||||||||||
| Other |
2 | 0.01 | 0.13 | 4 | 0.03 | 0.16 | 5 | 0.04 | 0.13 | |||||||||||||||||||||||||||
|
|
|
|
|
|
|
|
|
|
|
|
|
|
|
|
|
|
|
|||||||||||||||||||
| Total commercial loans |
17,090 | 92.99 | 96.38 | 13,094 | 94.59 | 96.07 | 11,341 | 97.49 | 98.45 | |||||||||||||||||||||||||||
| Real estate loans: |
||||||||||||||||||||||||||||||||||||
| SBA and USDA |
1,163 | 6.33 | 2.53 | 680 | 4.91 | 3.04 | 245 | 2.11 | 0.86 | |||||||||||||||||||||||||||
|
|
|
|
|
|
|
|
|
|
|
|
|
|
|
|
|
|
|
|||||||||||||||||||
| Total real estate loans |
1,163 | 6.33 | 2.53 | 680 | 4.91 | 3.04 | 245 | 2.11 | 0.86 | |||||||||||||||||||||||||||
| Construction: |
||||||||||||||||||||||||||||||||||||
| SBA and USDA |
10 | 0.05 | 0.03 | — | — | — | — | — | — | |||||||||||||||||||||||||||
|
|
|
|
|
|
|
|
|
|
|
|
|
|
|
|
|
|
|
|||||||||||||||||||
| Total construction loans |
10 | 0.05 | 0.03 | — | — | — | — | — | — | |||||||||||||||||||||||||||
| Credit cards |
116 | 0.63 | 1.06 | 69 | 0.50 | 0.89 | 46 | 0.40 | 0.69 | |||||||||||||||||||||||||||
|
|
|
|
|
|
|
|
|
|
|
|
|
|
|
|
|
|
|
|||||||||||||||||||
| Total |
$ | 18,379 | 100.00 | % | 100.00 | % | $ | 13,843 | 100.00 | % | 100.00 | % | $ | 11,632 | 100.00 | % | 100.00 | % | ||||||||||||||||||
|
|
|
|
|
|
|
|
|
|
|
|
|
|
|
|
|
|
|
|||||||||||||||||||
71
Table of Contents
| At December 31, | ||||||||||||||||||||||||
| 2010 | 2009 | |||||||||||||||||||||||
| Amount | % of Allowance of Total Allowance |
% of Loans in Category to Total Loans |
Amount | % of Allowance of Total Allowance |
% of Loans in Category to Total Loans |
|||||||||||||||||||
| (Dollars in thousands) | ||||||||||||||||||||||||
| Commercial loans: |
||||||||||||||||||||||||
| Technology |
$ | 8,009 | 87.08 | % | 60.94 | % | $ | 8,169 | 87.42 | 62.81 | % | |||||||||||||
| Life sciences |
770 | 8.37 | 16.29 | 869 | 9.30 | 15.85 | ||||||||||||||||||
| Venture capital/private equity |
70 | 0.76 | 12.56 | 78 | 0.83 | 11.79 | ||||||||||||||||||
| Asset-based loans |
317 | 3.45 | 9.54 | 204 | 2.18 | 8.94 | ||||||||||||||||||
| SBA and USDA |
— | — | — | — | — | — | ||||||||||||||||||
| Other |
— | — | 0.03 | 1 | 0.01 | 0.07 | ||||||||||||||||||
|
|
|
|
|
|
|
|
|
|
|
|
|
|||||||||||||
| Total commercial loans |
9,166 | 99.66 | 99.36 | 9,321 | 99.74 | 99.46 | ||||||||||||||||||
| Real estate loans: |
||||||||||||||||||||||||
| SBA and USDA |
— | — | — | — | — | — | ||||||||||||||||||
|
|
|
|
|
|
|
|
|
|
|
|
|
|||||||||||||
| Total real estate loans |
— | — | — | — | — | — | ||||||||||||||||||
| Construction |
— | — | — | — | — | — | ||||||||||||||||||
|
|
|
|
|
|
|
|
|
|
|
|
|
|||||||||||||
| — | — | — | — | — | — | |||||||||||||||||||
| Credit cards |
31 | 0.34 | 0.64 | 24 | 0.26 | 0.54 | ||||||||||||||||||
|
|
|
|
|
|
|
|
|
|
|
|
|
|||||||||||||
| Total |
$ | 9,197 | 100.00 | % | 100.00 | % | $ | 9,345 | 100.00 | % | 100.00 | % | ||||||||||||
|
|
|
|
|
|
|
|
|
|
|
|
|
|||||||||||||
Analysis of Loan Loss Experience. The following table sets forth an analysis of the allowance for loan losses for the years indicated.
| Year Ended December 31, | ||||||||||||||||||||
| 2013 | 2012 | 2011 | 2010 | 2009 | ||||||||||||||||
| (Dollars in thousands) | ||||||||||||||||||||
| Allowance at beginning of period |
$ | 13,843 | $ | 11,632 | $ | 9,197 | $ | 9,345 | $ | 8,005 | ||||||||||
| Provision for loan losses |
13,300 | 9,371 | 7,300 | 5,050 | 9,273 | |||||||||||||||
| Charge-offs: |
||||||||||||||||||||
| Commercial loans: |
||||||||||||||||||||
| Technology |
9,344 | 4,940 | 5,121 | 5,468 | 7,984 | |||||||||||||||
| Life sciences |
— | 500 | 700 | 127 | — | |||||||||||||||
| SBA and USDA |
269 | 2,461 | — | — | — | |||||||||||||||
|
|
|
|
|
|
|
|
|
|
|
|||||||||||
| Total commercial loans |
9,613 | 7,901 | 5,821 | 5,595 | 7,984 | |||||||||||||||
| Credit cards |
— | — | — | 3 | — | |||||||||||||||
|
|
|
|
|
|
|
|
|
|
|
|||||||||||
| Total charge offs |
9,613 | 7,901 | 5,821 | 5,598 | 7,984 | |||||||||||||||
|
|
|
|
|
|
|
|
|
|
|
|||||||||||
| Recoveries: |
||||||||||||||||||||
| Commercial loans: |
||||||||||||||||||||
| Technology |
(699 | ) | (553 | ) | (953 | ) | (400 | ) | (51 | ) | ||||||||||
| Life sciences |
— | (188 | ) | — | — | — | ||||||||||||||
| SBA and USDA |
(150 | ) | — | — | — | — | ||||||||||||||
|
|
|
|
|
|
|
|
|
|
|
|||||||||||
| Total commercial loans |
(849 | ) | (741 | ) | (953 | ) | (400 | ) | (51 | ) | ||||||||||
| Credit cards |
— | — | (3 | ) | — | |||||||||||||||
|
|
|
|
|
|
|
|
|
|
|
|||||||||||
| Total recoveries |
(849 | ) | (741 | ) | (956 | ) | (400 | ) | (51 | ) | ||||||||||
|
|
|
|
|
|
|
|
|
|
|
|||||||||||
| Allowance at end of period |
$ | 18,379 | $ | 13,843 | $ | 11,632 | $ | 9,197 | $ | 9,345 | ||||||||||
|
|
|
|
|
|
|
|
|
|
|
|||||||||||
| Allowance for loan losses to total loans at end of period |
1.70 | % | 1.60 | % | 1.64 | % | 1.87 | % | 2.05 | % | ||||||||||
| Net charge-offs to average loans outstanding during period |
0.95 | % | 0.95 | % | 0.79 | % | 1.14 | % | 1.94 | % | ||||||||||
72
Table of Contents
Interest Rate Risk
Interest Rate Risk Management. Market risk is defined as the risk of adverse fluctuations in the market value of financial instruments due to changes in market interest rates. Interest rate risk is our primary market risk and can result from timing and volume differences in the repricing of our rate-sensitive assets and liabilities, widening or tightening of credit spreads, changes in the general level of market interest rates and changes in the shape and level of market yield curves. Additionally, changes in interest rates can influence the rate of principal prepayments on mortgage securities, which affects the rate of amortization of purchase premiums and discounts and ultimately the yield of such securities. Other market risks include foreign currency exchange risk and equity price risk. These risks are not considered significant and no separate quantitative information concerning them is presented herein.
We manage the interest rate sensitivity of our interest-bearing liabilities and interest-earning assets in an effort to minimize the adverse effects of changes in the interest rate environment. Management of interest rate risk is carried out primarily through strategies involving our available-for-sale securities and available funding sources. In addition, our policies permit the use of on- and off-balance sheet derivative financial instruments to assist in managing interest rate risk, although we have not entered into any derivative financial instruments to date for such purposes.
We have a Management Asset/Liability Committee to communicate, coordinate and control all aspects involving interest rate risk management. The Management Asset/Liability Committee, with oversight from the Board Asset/Liability Committee (“BALCO”), establishes and monitors the volume, maturities, pricing and mix of assets and funding sources with the objective of managing assets and funding sources to provide results that are consistent with liquidity, growth, risk limits and profitability goals. Adherence to relevant policies is monitored on an ongoing basis.
Market Risk
Economic Value of Equity and Net Interest Income Simulation Analysis. The matching of assets and liabilities may be analyzed by examining the extent to which such assets and liabilities are “interest sensitive.” An asset or liability is said to be interest rate sensitive within a specific time period if it will mature or reprice within that time period. We analyze our interest rate sensitivity position to manage the risk associated with interest rate movements through the use of two simulation models: economic value of equity (“EVE”) and net interest income (“NII”) simulations. The EVE simulation provides a long-term view of interest rate risk because it analyzes all of the Bank’s future cash flows. EVE is defined as the present value of the Bank’s assets, less the present value of its liabilities, adjusted for any off-balance sheet items. The results show a theoretical change in the economic value of our shareholders’ equity as interest rates change.
EVE and NII simulations are completed monthly and presented to the Management and Board Asset/Liability Committees. The simulations provide an estimate of the impact of changes in interest rates on equity and net interest income under a range of assumptions. The numerous assumptions used in the simulation process are reviewed by the Management and Board Asset/Liability Committees on a monthly basis. Changes to these assumptions can significantly affect the results of the simulation. The simulation incorporates assumptions regarding the potential timing in the repricing of certain assets and liabilities when market rates change and the changes in spreads between different market rates. The simulation analysis incorporates management’s current assessment of the risk that pricing margins will change adversely over time due to competition or other factors.
Simulation analysis is only an estimate of our interest rate risk exposure at a particular point in time. We continually review the potential effect changes in interest rates could have on the repayment of rate sensitive assets and funding requirements of rate sensitive liabilities.
The table below sets forth an approximation of our NII sensitivity exposure for the 12-month periods ending December 31, 2014 and 2015 and our EVE sensitivity at December 31, 2013. The simulation uses projected repricing of assets and liabilities at December 31, 2013 on the basis of contractual maturities, anticipated repayments and scheduled rate adjustments. Prepayment rates can have a significant impact on interest income simulation. Because of the large percentage of variable-rate loans and mortgage-backed securities we hold, rising or falling interest rates have a significant impact on the prepayment speeds of our earning assets that in turn affect the rate sensitivity position. Generally, when interest rates rise, prepayments tend to slow. When interest rates fall, prepayments tend to rise. Our asset sensitivity would be reduced if prepayments slow and vice versa. While we believe such assumptions to be reasonable, there can be no assurance that assumed prepayment rates will approximate actual future mortgage-backed security and loan repayment activity.
73
Table of Contents
| Estimated Increase/Decrease in Net Interest Income |
Estimated Percentage Change in EVE | |||||
| Basis Point (“bp”) Change in Interest Rates |
12 Months Ending December 31, 2014 |
12 Months Ending December 31, 2015 |
As of December 31, 2013 | |||
| +300 | 6.1% | 17.1% | (2.6)% | |||
| +200 | 4.7 | 13.7 | (1.5) | |||
| +100 | 2.5 | 8.3 | (0.5) | |||
| -100 | (1.0) | (4.5) | 0.5 | |||
| -200 | (1.7) | (6.2) | 5.2 | |||
Rates are incrementally increased over the first twelve months and not increased instantaneously at the beginning of the projection. The results show that we are asset sensitive and that net interest income will increase as rates rise and will decrease as rates decline. Sensitivity will increase in the second year of the projection due to interest rates being up or down for the full year and also due to the other assumptions used in the analysis as noted previously. Interest rates do not normally move all at once or evenly over time, but the analysis is useful to understanding the potential direction and magnitude of net interest income changes due to changing interest rates.
The EVE analysis shows that we would theoretically lose market value in a rising rate environment. This is primarily due to the fixed-rate securities in our investment portfolio, which will lose value as rates rise. The analysis also assumes that amortizing assets will experience slower prepayments as rates increase, which will also cause asset values to decline. The opposite will be true for a declining rate environment where we will see our market value increase as the fixed-rate securities will increase in value.
Liquidity Risk
Liquidity Management. Liquidity management is the ability to meet current and future financial obligations of a short-term nature. Our primary sources of funds consist of deposit inflows, loan repayments and sales, maturities and sales of securities. While maturities and scheduled amortization of loans and securities are predictable sources of funds, deposit flows, mortgage prepayments and loan and security sales are greatly influenced by general interest rates, economic conditions and competition.
We regularly adjust our investment in liquid assets based upon our assessment of (1) expected loan demand, (2) expected deposit flows, (3) yields available on interest-earning deposits and securities, and (4) the objectives of our asset/liability management, funds management and liquidity policies. The objective of the liquidity policy is to reduce the risk to our earnings and capital arising from the inability to meet obligations in a timely manner without incurring unacceptable losses. This entails ensuring sufficient funds are available at a reasonable cost to meet potential demands from both fund providers and borrowers. Liquid assets, defined as cash, due from banks, federal funds sold, repurchase agreements, and available-for-sale securities, were 44.2% of total assets at December 31, 2013. Excess liquid assets are generally invested in investment grade available-for-sale securities.
Our most liquid assets are cash and cash equivalents. The levels of these assets depend on our operating, financing, lending and investing activities during any given period. At December 31, 2013, cash and cash equivalents totaled $105.7 million. Securities classified as available-for-sale, which provide additional sources of liquidity, totaled $924.2 million at December 31, 2013. In addition, at December 31, 2013, we had the ability to borrow $226.1 million from the Federal Home Loan Bank of Atlanta. There were no outstanding borrowings under this line at December 31, 2013. Additionally, at December 31, 2013, we had the ability to access $111.1 million from the Federal Reserve Bank’s Discount Window on a collateralized basis. We also maintain $60.0 million of unsecured lines of credit from four financial institutions to access federal funds. We had not accessed the unsecured lines of credit as of December 31, 2013. We believe that our liquid assets, combined with the available credit lines, provide adequate liquidity to meet our current financial obligations.
74
Table of Contents
| Payments Due by Period | ||||||||||||||||||||
| Total | Less Than One Year |
One to Three Years |
Three to Five Years |
More Than Five Years |
||||||||||||||||
| (In thousands) | ||||||||||||||||||||
| Contractual Obligations |
||||||||||||||||||||
| Deposits without stated maturity |
$ | 2,079,909 | $ | 2,079,909 | $ | — | $ | — | $ | — | ||||||||||
| Time deposits |
26,818 | 26,717 | 101 | — | — | |||||||||||||||
| FHLB and other borrowings |
12,737 | 12,737 | — | — | — | |||||||||||||||
| Junior subordinated debentures |
6,207 | — | — | — | 6,207 | |||||||||||||||
| Operating lease obligations |
7,276 | 2,424 | 3,622 | 1,230 | — | |||||||||||||||
|
|
|
|
|
|
|
|
|
|
|
|||||||||||
| Total |
$ | 2,132,947 | $ | 2,121,787 | $ | 3,723 | $ | 1,230 | $ | 6,207 | ||||||||||
|
|
|
|
|
|
|
|
|
|
|
|||||||||||
Capital Management. Our management seeks to maintain adequate capital to support anticipated asset growth, operating needs and unexpected risks, and to ensure that Square 1 Financial and Square 1 Bank are in compliance with all current and anticipated regulatory capital guidelines. Our primary sources of new capital include retained earnings and proceeds from the sale and issuance of capital stock or other securities. Our management engages, in consultation with the BALCO, in an annual capital planning process in an effort to optimize the use of the capital available to us and to appropriately plan for our future capital needs. The capital plan, approved annually by the Board of Directors, considers capital needs for the foreseeable future and allocates capital to both existing and future business activities. Expected future use or activities for which capital may be set aside include balance sheet growth and associated relative increases in market or credit exposure, investment activity, potential product and business expansions, acquisitions and strategic or infrastructure investments.
Regulatory capital ratios for Square 1 Financial and the Bank exceeded minimum federal regulatory guidelines for a well-capitalized depository institution as of and December 31, 2013, 2012 and 2011. See Note 13 to the consolidated financial statements for further information. Capital ratios for Square 1 Financial and Square 1 Bank, compared to the minimum regulatory ratios to be considered “well capitalized” and “adequately capitalized,” are set forth below.
| December 31, | Minimum Ratio to be “Well Capitalized” |
Minimum Ratio to be “Adequately Capitalized” |
||||||||||||||||||
| 2013 | 2012 | 2011 | ||||||||||||||||||
| Square 1 Financial: |
||||||||||||||||||||
| Total risk-based capital ratio |
13.24 | % | 15.42 | % | 15.25 | % | 10.00 | % | 8.00 | % | ||||||||||
| Tier 1 risk-based capital ratio |
12.08 | 14.28 | 14.05 | 6.00 | 4.00 | |||||||||||||||
| Tier 1 leverage ratio |
8.34 | 9.53 | 8.69 | N/A | 4.00 | |||||||||||||||
| Tangible equity to tangible assets ratio |
7.89 | 9.53 | 7.25 | N/A | N/A | |||||||||||||||
| Tangible equity to risk-weighted assets ratio |
11.17 | 13.97 | 12.25 | N/A | N/A | |||||||||||||||
| Square 1 Bank: |
||||||||||||||||||||
| Total risk-based capital ratio |
12.97 | % | 14.54 | % | 14.84 | % | 10.00 | % | 8.00 | % | ||||||||||
| Tier 1 risk-based capital ratio |
11.82 | 13.40 | 13.65 | 6.00 | 4.00 | |||||||||||||||
| Tier 1 leverage ratio |
8.16 | 8.94 | 8.43 | 5.00 | 4.00 | |||||||||||||||
Off-Balance Sheet Arrangements
In the normal course of operations, we engage in a variety of financial transactions that, in accordance with accounting principles generally accepted in the United States of America, are not recorded in our financial statements. These transactions involve, to varying degrees, elements of credit, interest rate and liquidity risk. Such transactions are used primarily to manage customers’ requests for funding and take the form of loan commitments, lines of credit and letters of credit.
75
Table of Contents
The contractual amounts of commitments to extend credit represent the amounts of potential accounting loss should the contract be fully drawn upon, the customer defaults and any existing collateral has no value. We use the same credit policies in making commitments and conditional obligations as we do for on-balance sheet instruments. Financial instruments whose contract amounts represent credit risk at December 31, 2013 and 2012 are as follows:
| At December 31, | ||||||||
| 2013 | 2012 | |||||||
| (In thousands) | ||||||||
| Commitments to extend credit(1): |
||||||||
| Future loan commitments |
$ | 977,262 | $ | 741,232 | ||||
| Standby letters of credit(2) |
89,232 | 83,234 | ||||||
|
|
|
|
|
|||||
| Total commitments |
$ | 1,066,494 | $ | 824,466 | ||||
|
|
|
|
|
|||||
| (1) | Commitments to extend credit are agreements to lend to a customer as long as there is no violation of any condition established in the contract. Commitments may require payment of a fee and generally have fixed expiration dates or other termination clauses. |
| (2) | Standby letters of credit are conditional commitments issued to guarantee the performance of a customer to a third party. |
For the years ended December 31, 2013 and 2012, we engaged in no off-balance sheet transactions reasonably likely to have a material effect on our financial condition, results of operations or cash flows.
The Volcker Rule
Under provisions of the Dodd-Frank Wall Street Reform and Consumer Protection Act (the “Dodd-Frank” Act) referred to as the “Volcker Rule,” certain limitations are placed on the ability of bank holding companies and their affiliates to engage in sponsoring, investing in and transacting with certain investment funds, including hedge funds and private equity funds (collectively “covered funds”). The Volcker Rule also places restrictions on proprietary trading, which could impact certain hedging activities. The Volcker Rule becomes fully effective in July 2015. The Volcker Rule is not expected to have a material impact on us.
Impact of Recent Accounting Pronouncements
The information required by this item is included in Note 1 to the consolidated financial statements included in this prospectus.
Effect of Inflation and Changing Prices
The financial statements and related financial data presented in this prospectus have been prepared in accordance with U.S. generally accepted accounting principles, which require the measurement of financial condition and operating results in terms of historical dollars without considering the change in the relative purchasing power of money over time due to inflation. The primary impact of inflation on our operations is reflected in increased operating costs. Unlike most industrial companies, virtually all the assets and liabilities of a financial institution are monetary in nature. As a result, interest rates generally have a more significant impact on a financial institution’s performance than do general levels of inflation. Interest rates do not necessarily move in the same direction or to the same extent as the prices of goods and services.
76
Table of Contents
General
The Board of Directors of Square 1 Financial is composed of 12 members. The Board of Directors of Square 1 Financial is divided into three classes, each of which contains approximately one-third of the number of directors. The shareholders elect one class of directors each year for a term of three years. Our executive officers are appointed by our Board of Directors and hold office until their successors are duly appointed and qualified.
We entered into agreements with Endicott Opportunity Partners III, L.P. (“Endicott”), Patriot Financial Partners, L.P. and Patriot Financial Partners Parallel, L.P. (“Patriot”), Castle Creek Capital Partners IV, L.P. (“Castle Creek”), and Northaven Partners, L.P. (“Northaven”) that permits each of them to nominate one representative who will be elected or appointed to our Board of Directors for so long as each of Endicott, Patriot, Castle Creek and Northaven or their affiliates owns at least 4.9% of the outstanding shares of our common stock. Robert I. Usdan, W. Kirk Wycoff, John T. Pietrzak and Paul R. Burke currently serve on our Board of Directors as the representatives of Endicott, Patriot, Castle Creek and Northaven, respectively. Messrs. Wycoff, Pietrzak and Burke were elected by Square 1 Financial’s shareholders following the expiration of the terms to which they were appointed under the terms of the agreements. Mr. Usdan was appointed to serve on our Board of Directors under the terms of the agreement and will stand for election by Square 1 Financial’s shareholders following the expiration of the term to which he was appointed.
Board of Directors
A brief description of the background of each of our directors is set forth below. Other than Ms. Casey, each of our directors also currently serves as a director of Square 1 Bank.
Douglas H. Bowers. Mr. Bowers is Chairman, President and Chief Executive Officer of Square 1 Bank and President and Chief Executive Officer of Square 1 Financial. He brings with him nearly 30 years of banking experience from Bank of America and its predecessors. Throughout his career, Mr. Bowers had responsibility for a wide range of activities, including Head of Commercial Banking, Head of Foreign Exchange, President of Europe, Middle East and Africa (based in London), Head of Large Corporate Banking and President of Bank of America’s Leasing business. In the 18 months prior to joining Square 1 Financial, he was a Managing Director for LoneStar/Hudson Advisors, a large private equity firm based out of Dallas. Mr. Bowers’ wealth of varied banking experience and significant knowledge of all aspects of the business of Square 1 Financial, as well as his long-standing relationships in the banking industry, qualify him to serve on our Board of Directors. Age 56. Director since 2011. Term expires in 2016.
Paul R. Burke. Mr. Burke co-founded Northaven Management, Inc., an investment management firm focusing exclusively on equity investments in the financial services industry. Mr. Burke shares responsibility for Northaven’s investment activities and oversees its operations. Prior to the formation of Northaven, Mr. Burke was a Vice President in Bankers Trust’s Financial Services Group, where he spent 10 years involved in the origination and execution of merger and acquisition, restructuring and principal transactions for a wide array of financial services firms. He serves as a director of Eastern Insurance Holdings, Inc. and Kinloch Holdings, Inc. Mr. Burke’s substantial experience with respect to mergers and acquisitions and restructuring transactions within the financial services industry, as well as his experience as a director of various public and private companies, qualify him to serve on our Board of Directors. Age 51. Director since 2010. Term expires in 2014.
Susan G. Casey. Ms. Casey is an original founder and member of the Board of Directors of Square 1 Financial. Ms. Casey served Square 1 Bank in a variety of functions, most recently as Chief Credit Officer. Prior to founding Square 1 Bank, she was President of the Technology & Life Science Division of Comerica Bank. Ms. Casey joined Comerica after its acquisition of Imperial Bank in 2001, where she was Chief Credit Officer and Chief Operating Officer of the Emerging Growth Division. She also spent five years at Silicon Valley Bank before her tenure at Imperial Bank. Ms. Casey’s knowledge of all aspects of the business of Square 1 Financial, extensive experience in the venture capital banking industry, and her long-standing relationships within the venture capital community, qualify her to serve on our Board of Directors. Age 55. Director since 2007. Term expires in 2015.
77
Table of Contents
Norman P. Creighton. Mr. Creighton was most recently Vice Chairman of Comerica Bank—California. Prior to that, Mr. Creighton was formerly the Vice Chairman and Chief Executive Officer of Imperial Bank from 1997 to 2001 and served as President and Chief Executive Officer of Imperial Bank from 1983 until January 1997. Mr. Creighton’s extensive senior management level experience in the venture capital banking industry, as well as his long-standing relationships within the venture community, qualify him to serve on our Board of Directors. Age 78. Director since 2005. Term expires in 2015.
William F. Grant III. Mr. Grant is currently a self-employed financial consultant and advisor. From 2002 to 2012 he was a Principal of the Wm. Franklin Group, a sole proprietorship focusing on bank management reviews. He was a Principal in The Secura Group’s financial consulting practice from 2000 to 2002. Retiring in 2000, Mr. Grant spent 30 years with the Federal Reserve and the Office of the Comptroller of the Currency, where he held a variety of bank supervision, human resources and public affairs positions. He is a Director and Audit Committee Chair of FSG, Bank NA and FSG Inc., Chattanooga, Tennessee; a publicly traded company. Through his experience at the Federal Reserve and the Office of the Comptroller of the Currency, as well as his service as a director of other financial institutions, Mr. Grant is considered a financial expert and provides knowledge and expertise directly related to the various regulatory matters affecting Square 1 Financial and Square 1 Bank. Age 65. Director since 2005. Term expires in 2016.
Daniel R. Mathis. Mr. Mathis was formerly President, Chief Executive Officer and a Director of First National Bank in San Diego, California from 2001 to 2002. Prior to joining First National Bank, Mr. Mathis worked at Imperial Bank from 1993 to 2001. From January 1997 to 2001, Mr. Mathis was President, Chief Operating Officer and a director of Imperial Bank. Mr. Mathis’ extensive senior executive management level experience in commercial banking and the venture banking industry, qualifies him to serve on our Board of Directors. Age 66. Director since 2004. Term expires in 2015.
Robert S. Muehlenbeck. Mr. Muehlenbeck, Chairman of Square 1 Financial, has extensive senior management and board level experience with publicly traded banks and financial institutions dating back to 1993, serving as a Senior Officer and Director of Imperial Bancorp, Imperial Creditcorp and Ventures, as well as Imperial Credit Industries. Prior to that time, Mr. Muehlenbeck served as President of a real estate development and financial services company, following several years practicing law in the Silicon Valley area. Mr. Muehlenbeck’s extensive senior management level and board experience in the venture capital banking industry and financial services industry, generally, as well as his prior experience as an attorney, qualify him to serve on our Board of Directors. Age 65. Director since 2005. Term expires in 2016.
John T. Pietrzak. Mr. Pietrzak is a Managing Principal at Castle Creek Capital and has been with the firm since 2005. Mr. Pietrzak serves on the Board of Panhandle State Bank and Community Trust Financial Corporation. Prior to joining Castle Creek, Mr. Pietrzak was a Director at Levi Strauss & Co. where he led a team responsible for forecasting demand for the Dockers brand. Prior to that, he worked at Diamond Strategy and Technology Consultants. Mr. Pietrzak began his career at Sara Lee Corporation where he held positions in a variety of functional areas. Mr. Pietrzak is a former Director of West Coast Bancorp and its wholly-owned subsidiary, West Coast Bank. Mr. Pietrzak’s management and board experience at various public companies, as well as his significant experience in the financial services industry, qualify him to serve on our Board of Directors. Age 41. Director since 2010. Term expires in 2014.
Dr. Seth A. Rudnick. Dr. Rudnick is a recently retired Partner at Canaan Partners, a global venture capital firm, where he led the firm’s investments in healthcare companies from 1998 to 2013. His prior leadership experience also includes the roles of Chairman of the Board and Chief Executive Officer at CytoTherapeutics, a company focused on the development and commercialization of stem-cell based therapies, and Senior Vice President of Biotech Research and Development at R.W. Johnson Pharmaceutical Research Institute, where he led all research and development activities and managed the Institute’s Biotechnology Center in San Diego, California. Dr. Rudnick also serves on the Board of Directors of Pozen, Liquidia Inc., Envisia, G1 Therapeutics, Vaxinnate and Meryx. He is Chairman of the scientific advisory boards of The Emory Drug Development Institute, DRIVE and G1 Therapeutics. Dr. Rudnick’s vast experience in the life sciences field and the venture capital industry, as well as his management and board experience at various Biotech companies, qualify him to serve on our Board of Directors. Age 65. Director since 2012. Term expires in 2016.
Robert H. Scott. Mr. Scott is currently President and Chief Executive Officer of Clique Intelligence, Inc., an early stage computer software start-up. Prior to his position at Clique Intelligence, Mr. Scott was Vice President and Worldwide General Manager, Business Solutions Energy and Utilities Business Unit at Hewlett-Packard, responsible for worldwide business operations, sales and marketing, and research and development. Mr. Scott was previously President and Chief Executive Officer of several technology companies, including Xelor Software, Iperia, ONET Networks, MultiLink, Octave Communications and most recently Colubris Networks which was sold to HP in 2008. In 2002, Mr. Scott was named Ernst &
78
Table of Contents
Young’s Entrepreneur of the Year for the telecom sector and the New Hampshire High Tech Council’s Entrepreneur of the Year. Mr. Scott currently serves on the board of directors of Bradford Networks and Ezuce and on the advisory board of Windspeed Ventures. Mr. Scott’s extensive public company management experience and his significant experience in the technology and telecom industry, qualify him to serve on our Board of Directors. Age 58. Director since 2009. Term expires in 2016.
Robert I. Usdan. Mr. Usdan is a Co-Founder and Principal of The Endicott Group, a private investment and advisory firm specializing in the financial services industry. Prior to founding Endicott in 1996, Mr. Usdan was an Associate Director at Sandler O’Neill & Partners, L.P. Mr. Usdan currently serves on the Board of Directors of American Business Bank and TGR Financial, Inc. Mr. Usdan received a Bachelor of Arts from the University of Virginia. Mr. Usdan’s experience with respect to the financial services industry, as well as his experience overseeing the growth of early stage portfolio companies, qualifies him to serve on our Board of Directors. Age 48. Director since 2013. Term expires in 2015.
W. Kirk Wycoff. Mr. Wycoff has more than 30 years of banking experience and is the Managing Partner of Patriot Financial Partners. He serves as Chairman of the Board of Directors of Continental Bank Holdings, Inc., and served as its President and Chief Executive Officer from its inception in 2005 until June of 2007. Mr. Wycoff serves on the Boards of Directors of Guaranty Bancorp, Porter Bancorp, Inc. and Heritage Commerce Corp. Mr. Wycoff served on the investment committee of NewSpring Ventures (which he co-founded in 1999) and NewSpring Mezzanine Fund. From 1991 to 2004, Mr. Wycoff was Chairman and Chief Executive Officer of Progress Financial Corp. Mr. Wycoff also served as Chief Executive Officer of Crusader Savings Bank, a Philadelphia community bank from 1989-91. Mr. Wycoff’s extensive prior experience as a director of numerous banking organizations, including his experience as a director of publicly-traded banking organizations, as well as his extensive experience with capital acquisition and management in the banking industry, qualify him to serve on our Board of Directors. Age 55. Director since 2010. Term expires in 2014.
Director Qualifications. Square 1 Financial’s Nominating/Corporate Governance Committee has adopted a set of criteria that it considers when it selects individuals to be nominated for election to the Board of Directors. A candidate must meet any qualification requirements set forth in any Board or committee governing documents.
Square 1 Financial’s Nominating/Corporate Governance Committee will consider the following criteria in selecting nominees: financial, regulatory and business experience; familiarity with and participation in the venture capital and venture banking market; integrity, honesty and reputation; dedication to Square 1 Financial and its shareholders; independence; and any other factors the Nominating/Corporate Governance Committee deems relevant, including diversity, the size of the Board of Directors and regulatory disclosure obligations.
In addition, prior to nominating an existing director for re-election to the Board of Directors, the Nominating/Corporate Governance Committee will consider and review an existing director’s Board and committee attendance and performance; length of Board service; experience, skills and contributions that the existing director has brought and continues to bring to the Board; and the director’s independence.
Director Independence. Under the rules of the Nasdaq Stock Market, independent directors must comprise a majority of our Board of Directors within a specified period of time of this offering. The rules of the Nasdaq Stock Market, as well as those of the SEC, also impose several other requirements with respect to the independence of our directors. Our Board of Directors has evaluated the independence of its members based upon the rules of the Nasdaq Stock Market and the SEC and the transactions referenced under the section of this prospectus titled “Certain Relationships and Related Party Transactions.” Applying these standards, our Board of Directors has affirmatively determined that, with the exception of our current President and Chief Executive Officer, Douglas H. Bowers, and the former Executive Vice President and Chief Credit Officer, Susan G. Casey, each of the other current directors is an independent director, as defined under the applicable rules. However, while, Mr. Wycoff is not deemed independent under Nasdaq Audit Committee composition standards as a result of his affiliation with Patriot, the Board of Directors has determined that he is independent for purposes of the Nasdaq Compensation Committee Standards. See “Certain Relationships and Related Party Transactions.”
Leadership Structure. Our Board of Directors does not have a policy regarding the separation of the roles of Chief Executive Officer and Chairman of the Board, as the Board believes that it is in the best interests of our organization to make that determination from time to time based on the position and direction of our organization and the membership of the Board. The Board of Directors has determined that the separation of the offices of Chairman of the Board and President and Chief Executive Officer enhances Board independence and oversight. Moreover, the separation of the Chairman of the Board
79
Table of Contents
and President and Chief Executive Officer allows the President and Chief Executive Officer to better focus on his growing responsibilities of running Square 1 Financial, enhancing shareholder value and expanding and strengthening Square 1 Financial’s franchise while allowing the Chairman of the Board to lead the Board in its fundamental role of providing advice to and independent oversight of management. Consistent with this determination, Robert S. Muehlenbeck serves as Chairman of the Board of Directors of Square 1 Financial. Mr. Muehlenbeck is independent under the listing requirements of The Nasdaq Stock Market.
Executive Officers
A brief description of the background of each of our executive officers who is not also a director is set forth below.
Patrick Oakes. Mr. Oakes has served as Executive Vice President and Chief Financial Officer since August 2012. He is a senior financial executive with over 20 years of experience in banking, finance and capital markets. Prior to his employment with Square 1 Bank, he served as Executive Vice President and Chief Financial Officer of Encore Bancshares, Inc. and Senior Vice President and Treasurer for Sterling Bancshares, Inc. Mr. Oakes is a Chartered Financial Analyst. He received his undergraduate degree from Texas A&M University, and his MBA from Richmond, The American International University in London. Age 45.
Diane Earle. Ms. Earle joined Square 1 Bank in August, 2010 as Senior Vice President—Risk Manager, and has served Square 1 Bank as Executive Vice President and Chief Credit Officer since 2012. She has also served in the same capacity with Square 1 Financial, Inc. since 2012. Ms. Earle served as Risk Manager—Life Sciences and Technology of Square 1 Financial and Square 1 Bank from 2010 to 2012. Ms. Earle was Managing Director and Senior Credit Officer of Hercules Technology Growth Capital from 2008 to 2010. Before that, she was Senior Vice President and Senior Credit Officer at Life Sciences Capital, LLC from 2007 to 2008. Prior to that she was Senior Vice President and Senior Risk Manager at GE Life Science Finance from 2001 to 2007. She graduated magna cum laude from Fairfield University in 1982. Age 54.
Samir (Sam) Bhaumik. Mr. Bhaumik is Executive Vice President—Silicon Valley Banking. Prior to joining Square 1 Bank in October 2011, Mr. Bhaumik was with Hercules Technology Growth Capital from September 2004 until September 2011 where he was Senior Managing Director—Technology Group Head. He was part of the original team that took Hercules public in 2005 and committed over $2.0 billion to more than 170 venture-backed technology and life sciences companies nationwide. Before joining Hercules, Mr. Bhaumik spent two years at the New York Stock Exchange as Vice President of the western region. Prior to the New York Stock Exchange, Mr. Bhaumik served as Co-Founder and Senior Vice President of the Emerging Growth Division at Imperial Bank from April 1993 to February 2003. Imperial Bank was acquired by Comerica Bank in early 2001. Prior to Comerica Bank, Mr. Bhaumik served as a Vice President with Silicon Valley Bank’s Technology Group from 1986 to 2003. Age 50.
Judith E. Erwin. Ms. Erwin is a Founder and Executive Vice President—Venture Capital Services and Global Treasury Management, which includes responsibility for all non-debt products, domestic and international treasury products and Square 1 Asset Management. Prior to joining Square 1 in 2005, Ms. Erwin founded the Venture Capital Services practice at Imperial Bank, where she developed a client base throughout the United States, Canada, the United Kingdom and Israel. Prior to Imperial, Ms. Erwin worked for a variety of national and regional commercial banks in either treasury or loan products, sales and/or product management, and has a cumulative 30 years of banking experience. Age 55.
Gregory Thompson is Executive Vice President—Shared Services. Mr. Thompson leads the IT, Operations, Specialty Lending Division, Strategy, Marketing and Communications and Legal functions for Square 1 Financial and Square 1 Bank. Mr. Thompson is a certified public accountant and certified management accountant and brings over 25 years of financial services experience, including 20 years with Wells Fargo and its predecessors where he had responsibility for a wide range of activities including commercial and consumer CFO, M&A due diligence, and management reporting. Prior to joining Square 1 in August 2011, Mr. Thompson served as Managing Director of GB Thompson and Associates LLC, a consulting practice providing strategy, operational and financial services to community banks in the Carolinas from September 2009 until August 2011. Mr. Thompson received his undergraduate degree from Louisiana Tech University. Age 51.
Frank Tower. Mr. Tower is Executive Vice President—East Banking. Mr. Tower has more than 20 years of experience financing high growth, venture-backed technology and life science companies. Prior to joining Square 1 Bank in January 2014, Mr. Tower was a Founding General Partner of Gold Hill Capital, an independent private equity firm providing debt and equity capital to rapid growth technology companies. Mr. Tower was involved in all aspects of fund deployment, portfolio
80
Table of Contents
management and strategic direction as a senior member of Gold Hill’s investment and operating committees. From 1992 to 2003, Mr. Tower was with Silicon Valley Bank, including as Senior Credit Officer and Senior Vice President/Manager of the Mid-Atlantic Region. Mr. Tower graduated with a Bachelor of Science degree in Finance and Investments from Babson College. Age 47.
Christopher J. Woolley. Mr. Woolley is a Founder of Square 1 Bank and serves as Executive Vice President—Banking West, with responsibility for the Banking practice in the western United States, other than Silicon Valley. Mr. Woolley previously worked at Imperial Bank and Comerica Bank from 1996 to 2005, where he was the founding Senior Vice President/Regional Manager for the Emerging Growth practice in the Pacific Southwest and Chair of the National Life Sciences Committee. From 1990 to 1996, he was a Vice President with the middle market lending group of Wells Fargo. Mr. Woolley is a certified public accountant who began his career with Arthur Andersen & Co. and has also worked as a chief financial officer and as an investment advisor. Age 55.
Jason Kranack. Mr. Kranack is Senior Vice President—Head of Human Resources. Mr. Kranack brings over 16 years of experience in human resources, operations, labor relations and organizational design across diversified industries, including leadership roles with US Filter, Penske Logistics and Bank of America. Prior to joining Square 1, Mr. Kranack was President of JKCG, LLC, an independent consulting practice which provided a full range of business consulting services to improve the profitability, growth, and effectiveness of businesses and organizations. From May 2008 until August 2011 Mr. Kranack was Vice President of Human Resources and Corporate Services at ACN, Inc. Mr. Kranack also serves on the Board of Directors for WEBD (Working to Educate Build and Develop), which works with historically black colleges and universities throughout North Carolina. Age 39.
Corporate Governance Principles and Board Matters
We are committed to having sound corporate governance principles, which are essential to running our business efficiently and maintaining our integrity in the marketplace. Square 1 Financial periodically reviews its corporate governance policies and procedures in its efforts to ensure that Square 1 Financial meets the highest standards of ethical conduct, reports results with accuracy and transparency, and maintains full compliance with the laws, rules and regulations that govern Square 1 Financial’s operations. As part of this periodic corporate governance review, the Board of Directors reviews and adopts corporate governance policies and practices for Square 1 Financial.
Corporate Governance Policy
Square 1 Financial has adopted a corporate governance policy to govern certain activities, including:
| (1) | the duties and responsibilities of the Board of Directors and each director; |
| (2) | the composition and operation of the Board of Directors; |
| (3) | the establishment and operation of Board committees; |
| (4) | convening executive sessions of independent directors; |
| (5) | succession planning; |
| (6) | the Board of Directors’ interaction with management and third parties; |
| (7) | the evaluation of the performance of the Board of Directors and of the Chief Executive Officer; and |
| (8) | orientation of new directors and continuing education. |
Code of Ethics and Business Conduct
Square 1 Financial has adopted a Code of Ethics and Business Conduct which is designed to ensure that Square 1 Financial’s directors, executive officers and employees meet the highest standards of ethical conduct. The Code of Ethics and Business Conduct requires that Square 1 Financial’s directors, executive officers and employees avoid conflicts of interest, comply with all laws and other legal requirements, conduct business in an honest and ethical manner, and otherwise act with integrity and in Square 1 Financial’s best interest. Under the terms of the Code of Ethics and Business Conduct, directors, executive officers and employees are required to report any conduct that they believe in good faith to be an actual or apparent violation of the Code of Ethics and Business Conduct.
81
Table of Contents
As a mechanism to encourage compliance with the Code of Ethics and Business Conduct, Square 1 Financial has established procedures to receive, retain and treat complaints received regarding accounting controls or auditing matters. These procedures ensure that individuals may submit concerns regarding questionable accounting or auditing matters in a confidential and anonymous manner. It is Square 1 Financial’s policy that no reprisal will be taken against any director, executive officer or employee who reports a concern in good faith and pursuant to and in accordance with the Code of Ethics and Business Conduct.
Compensation Committee interlocks and insider participation. Upon completion of the offering, none of the members of our Compensation Committee will be or will have been an officer or employee of Square 1 Financial or Square 1 Bank. In addition, none of our executive officers serves or has served as a member of the Board of Directors, compensation committee or other board committee performing equivalent functions of any entity that has one or more executive officers serving as one of our directors or on our Compensation Committee.
Board Committees
Our Board of Directors has established standing committees in connection with the discharge of its responsibilities. These committees include the Audit Committee, the Compensation Committee and the Nominating/Corporate Governance Committee. Each committee of the Board of Directors operates under a written charter. Our Board of Directors also may establish such other committees as it deems appropriate, in accordance with applicable law and regulations and our corporate governance documents.
Audit Committee. The Board of Directors has a separately-designated standing Audit Committee established in accordance with requirements of the Exchange Act. The Audit Committee meets periodically with independent auditors and management to review accounting, auditing, internal control structure and financial reporting matters. The Board of Directors has determined that Mr. Grant is an audit committee financial expert under the rules of the SEC. Each of the members of the Audit Committee is independent in accordance with the listing standards of the Nasdaq Stock Market.
Compensation Committee. The Compensation Committee is responsible for all matters regarding Square 1 Financial’s employee compensation and benefit programs, including approval of the compensation objectives for Square 1 Financial and Square 1 Bank, establishing the compensation for Square 1 Financial’s and Square 1 Bank’s senior management and conducting the performance review of the President and Chief Executive Officer. The Compensation Committee reviews all components of compensation, cash incentive plans, long-term incentive plans and various employee benefit matters. Each of the members of the Compensation Committee is independent in accordance with the listing standards of the Nasdaq Stock Market.
Nominating/Corporate Governance Committee. The Nominating/Corporate Governance Committee takes a leadership role in shaping Square 1 Financial’s governance policies and practices, including recommending to the Board of Directors the corporate governance policies and guidelines applicable to Square 1 Financial and monitoring compliance with these policies and guidelines. In addition, the Nominating/Corporate Governance Committee is responsible for identifying individuals qualified to become members of the Board of Directors and recommending to the Board the director nominees for election at the annual meeting of shareholders. This committee also recommends to the Board director candidates for each committee for appointment by the Board. Each of the members of the Nominating/Corporate Governance Committee is independent in accordance with the listing standards of the Nasdaq Stock Market.
Board Asset/Liability Committee (“BALCO”). The BALCO is responsible for setting Square 1 Financial’s overall policy, limits and strategies with respect to interest rate risk, valuation risk, capital, liquidity and the investment portfolio of Square 1 Financial and its subsidiaries.
Square 1 Bank Directors’ Loan Committee (“DLC”). The DLC of Square 1 Bank is responsible for providing oversight of the credit risk management function of the Bank as well as exercising loan approval authority for loans exceeding the delegated authority of the Chief Credit Officer.
82
Table of Contents
The following table sets forth information regarding the compensation awarded to, earned by, or paid to certain of our executive officers during the year ended December 31, 2013. As an emerging growth company, we have opted to comply with the executive compensation disclosure rules applicable to “smaller reporting companies” as such term is defined in the rules promulgated under the Securities Act, which require compensation disclosure for our principal executive officer and our two other most highly compensated executive officers. Throughout this prospectus, these four officers are referred to as our “named executive officers.”
The compensation reported in the Summary Compensation Table below is not necessarily indicative of how we will compensate our named executive officers in the future. We will continue to review, evaluate and modify our compensation framework to maintain a competitive total compensation package. As such, and as a result of our becoming a publicly-traded company, the compensation program following this offering could vary from our historical practices.
Our named executive officers for 2013, which consist of our principal executive officer and the three other most highly compensated executive officers, included:
| • | Douglas H. Bowers, President and Chief Executive Officer, member of the Board of Directors of Square 1 Financial, and Chairman of the Board of Directors of Square 1 Bank; |
| • | Patrick Oakes, Executive Vice President and Chief Financial Officer; |
| • | Gregory Thompson, Executive Vice President—Shared Services; and |
| • | Judith E. Erwin, Executive Vice President—Venture Capital Services and Global Treasury Management. |
Summary Compensation Table
The following table provides information regarding the compensation of our named executive officers for the fiscal year ended December 31, 2013. Except as set forth in the notes to the table, all cash compensation for each of our named executive officers was paid by Square 1 Bank, where each serves in the same capacity.
| Name and Principal Position |
Year | Salary | Stock Awards (1) |
Option Awards |
Nonequity Incentive Plan Compensation (2) |
All Other Compensation (3) |
Total | |||||||||||||||||||||
| Douglas H. Bowers |
2013 | $ | 500,000 | $ | 422,000 | — | $ | 325,000 | $ | 67,047 | $ | 1,314,047 | ||||||||||||||||
| President and Chief Executive Officer |
||||||||||||||||||||||||||||
| Patrick Oakes |
2013 | 250,000 | 137,680 | — | 130,000 | 33,177 | 550,857 | |||||||||||||||||||||
| Executive Vice President and |
||||||||||||||||||||||||||||
| Gregory Thompson |
2013 | 249,583 | 114,920 | — | 115,000 | 127,846 | 607,349 | |||||||||||||||||||||
| Executive Vice President— |
||||||||||||||||||||||||||||
| Judith E. Erwin |
2013 | 270,833 | 146,560 | — | 155,000 | 32,629 | 605,022 | |||||||||||||||||||||
| Executive Vice President— |
||||||||||||||||||||||||||||
| (1) | Represents the aggregate grant date fair value of the grant of 25,000, 11,000, 9,000 and 12,000 Restricted Stock Units to Messrs. Bowers, Oakes, Thompson and Ms. Erwin, respectively, computed in accordance with FASB ASC Topic 718 based on a per share price of $8.88. The amounts also include aggregate grant date fair value of the grant of 15,267, 3,053, 2,672 and 3,053 Restricted Stock Units to Messrs. Bowers, Oakes, Thompson and Ms. Erwin, respectively, computed in accordance with FASB ASC Topic 718 based on a per share price of $13.10. |
| (2) | Represents the cash component of 2013 awards under the Square 1 Bank Corporate Incentive Plan. |
(footnotes continued on following page)
83
Table of Contents
| (3) | Details of the amounts reported in the “All Other Compensation” column are provided in the table below. The table excludes perquisites, which did not exceed $10,000 in the aggregate for each named executive officer: |
| Item |
Douglas H. Bowers | Patrick Oakes | Gregory Thompson | Judith E. Erwin | ||||||||||||
| Employer matching contribution |
$ | 15,476 | $ | 10,200 | $ | 10,200 | $ | 7,971 | ||||||||
| Relocation allowance |
— | — | 94,149 | — | ||||||||||||
| Bank owned life insurance(1) |
2,490 | 536 | 788 | 1,278 | ||||||||||||
| Trip for top performers |
1,210 | 1,450 | 1,543 | 1,513 | ||||||||||||
| Country club dues |
14,010 | — | — | — | ||||||||||||
| Warrant incentive compensation plan payments(2) |
25,000 | 20,000 | 20,000 | 20,000 | ||||||||||||
| Tax gross ups |
8,861 | 992 | 1,167 | 1,869 | ||||||||||||
|
|
|
|
|
|
|
|
|
|||||||||
| Total |
$ | 67,047 | $ | 33,177 | $ | 127,846 | $ | 32,629 | ||||||||
|
|
|
|
|
|
|
|
|
|||||||||
| (1) | The named executive officers receive supplemental life insurance coverage under split dollar life insurance agreements related to the Bank’s bank owned life insurance program. The benefit is the lesser of $1.0 million or three times the executive’s then current base salary reduced by benefits paid under the Square 1 Bank group term life insurance plan. |
| (2) | Reflects payments made to the named executive officers under the Warrant Incentive Compensation Plan. Please see the section titled “Executive Compensation—Warrant Incentive Compensation Plan” for more information. |
Employment Agreements. Square 1 Financial and Square 1 Bank have entered into employment agreements with Messrs. Bowers, Oakes and Thompson and Ms. Erwin (collectively, the “executives” or individually, the “executive”). Square 1 Financial and Square 1 Bank intend for these agreements to help ensure that they maintain a stable and competent management base.
The employment agreements provide for initial terms of three years (Mr. Bowers) and two years (Messrs. Oakes and Thompson) which may be extended annually for an additional year in the sole discretion of the Board so that the remaining term is extended to its original duration. The employment agreement for Ms. Erwin provides for an initial term ending on August 8, 2008, renewable for additional one-year periods on an automatic basis, unless notice of non-renewal is provided at least six months prior to the end of the current term. The agreements for Messrs. Bowers, Oakes and Thompson also provide for an extension of the term for one year after a “change of control” (as defined in the agreement) if the remaining term is less than one year as of the effective date of the change of control. The agreements specify each executive’s base salary and eligibility to participate in the cash-and equity-based incentive programs and employee benefit plans.
Under the agreements, the executives agree to maintain the confidentiality of non-public information and trade secrets learned during the course of employment and further agree that Square 1 Financial and Square 1 Bank maintain ownership over their work product (as defined in the agreement). In addition, during their employment and for a specified period following termination of employment, the executives are subject to restrictive covenants relating to their ability to (i) solicit customers for or on behalf of a competing business (as defined under the agreement), (ii) recruit employees of Square 1 Bank or Square 1 Financial for another business, or (iii) serve as directors, officers or employees of a competing business. The term of the restrictive covenants range from 24 months in the case of Messrs. Bowers and Oakes to 12 months in the case of Mr. Thompson and Ms. Erwin (24 months following a change in control).
Under the agreements, Square 1 Financial or Square 1 Bank may terminate an executive at any time for “cause” (as defined in the employment agreements). The executive receives no severance payments or further benefits under the agreement upon termination for cause. Upon voluntary termination of employment, the executive receives only accrued compensation and vested benefits through the termination date. The agreements provide for specified severance if the executive’s employment is terminated by Square 1 Bank or Square 1 Financial without cause or if the executive voluntarily terminates employment “with good reason” (as defined in the agreement). See, “—Potential Payments upon Termination or Change in Control.”
84
Table of Contents
Potential Payments upon Termination or Change in Control
Our employment agreements with our named executive officers provide for certain payments to be made in connection with their termination of employment in certain circumstances.
Upon a termination of employment by us without “cause” (as defined in the employment agreement) or by the named executive officer for “good reason” (as defined in the employment agreement), in addition to any accrued or earned but unpaid amounts, subject to the execution of a general release of claims in favor of Square 1 Financial and Square 1 Bank, the named executive officer will be entitled to (i) a lump-sum payment equal to a multiple of their then current base salary (two times’ base salary for Mr. Bowers and one times’ base salary for Messrs. Oakes and Thompson and Ms. Erwin. If, after a change in control (as defined the employment agreement), an executive is terminated without “cause” or voluntarily terminates for “good reason,” the severance benefit is based on a multiple of then current base salary and bonus (three times the sum of base salary and three-year average bonus for Mr. Bowers and two times the sum of base salary and target bonus for the year of termination for Messrs. Oakes and Thompson). However, with respect to a termination that occurs in connection with a change in control, the payments are subject to reduction if the severance benefit, whether alone or in conjunction with other payments or benefits that are contingent on the change in control, create an “excess parachute payment” within the meaning of Section 280G of the Internal Revenue Code of 1986, as amended. For each executive, payment of severance benefits is also conditioned upon the execution of a release of claims against Square 1 Financial and Square 1 Bank.
Annual Incentive Compensation
We maintain an annual incentive compensation plan for key employees which is designed to maximize the achievement of corporate, business unit and individual performance goals. A participant’s award under the plan takes into account our overall financial performance, the participant’s performance against his or her own designated individual performance objectives and, for certain participants, his or her own business unit’s performance. Awards under the plan may be made in the form of a cash payment and/or an equity-based award under the then effective equity compensation plan of Square 1. The plan is administered by the Compensation Committee which, annually, (i) establishes the performance criteria applicable to the determination of awards, (ii) designates the employees or classes of employees eligible to participate in the plan, and (iii) determines the potential targets of incentive compensation opportunities for eligible participants. The individual and/or business unit performance goals applicable to the determination of a participant’s (other than our Chief Executive Officer and any Executive Vice President) award are determined with the participant and his or her manager, with review and approval of such goals by the Executive Vice President in charge of the participant’s business unit. The individual performance goals for our Chief Executive Officer and all Executive Vice Presidents are approved by the Compensation Committee. Performance goals and evaluations include, but are not limited to, achieving net operating income at the regional and company level, credit quality of the loan portfolio, new and enhanced client relationships, noninterest income, expense management, and adherence to Square 1’s values.
Warrant Incentive Compensation Plan
The Warrant Incentive Compensation Plan (the “Warrant Plan”) is intended to: (i) provide incentive compensation to key employees of Square 1 Bank and Square 1 Financial; (ii) encourage them to remain employees; (iii) reward them for contributing materially to the success of Square 1 Bank and Square 1 Financial; and (iv) further their identity of interests with those of shareholders of the Square 1 Financial. The Warrant Plan is administered by the Compensation Committee and all compensation paid under the Warrant Plan is derived from the proceeds of liquidation of warrants received by Square 1 Bank as consideration for loans. Compensation paid under the Warrant Plan is limited to 30% of the net warrant income generated with respect to all warrants held by Square 1 Bank that are converted into cash in a given fiscal year. Participants of the Warrant Plan include those employees of Square 1 Bank or Square 1 Financial who are responsible for originating the loans from which the warrants are derived and other eligible employees as determined by the Chief Executive Officer and the Compensation Committee. Upon a change of control of Square 1 Bank or Square 1 Financial (as defined in the Warrant Plan), any existing interests in the Warrant Plan will immediately vest and any funds being held by Square 1 Bank or Square 1 Financial from the liquidation of warrants shall be immediately paid to the designated participants. The Warrant Plan is intended to be a payroll practice of the Bank that is not subject to ERISA and is not intended to be a nonqualified deferred compensation plan that is subject to Section 409A of the Internal Revenue Code.
85
Table of Contents
Equity Incentive Compensation
We maintain our 2009 Stock Incentive Plan (the “2009 Plan”) as a means of attracting, retaining, motivating and rewarding employees and non-employee directors of Square 1 Financial and Square 1 Bank. We use the plan to provide competitive compensation opportunities, to recognize individual contributions, to reward the achievement of business objectives, and to promote the creation of long-term value for shareholders by closely aligning the interests of key personnel with our shareholders. We have made awards under the plan on a free-standing basis or in conjunction with the settlement of awards under our annual incentive compensation program.
We currently have 2,700,000 shares reserved for awards under the plan, consisting of authorized and unissued shares or treasury shares. As of January 31, 2014, 1,319,550 stock options were outstanding under the 2009 Plan, 719,260 of which were exercisable. Of the currently outstanding stock options, 1,144,550 have an exercise price of $6.00; 44,500 have an exercise price of $6.75; and 130,500 have an exercise price of $6.875. Under the 2009 Plan, 612,715 shares remain available for issuance to directors, officers and employees pursuant to the plan. All stock options vest in equal installments over a period of five years beginning on the first anniversary of the date of grant. In addition, as of January 31, 2014, 522,870 restricted stock units were outstanding. The restricted stock units vest according to one of three schedules: (a) retention grants vest in equal installments over a period of three years beginning on the first anniversary of the date of the grant; (b) new hire grants vest in equal installments over a period of five years beginning on the first anniversary of the date of grant; (c) corporate incentive grants vest in three equal installments over a period of two years, with one-third vesting immediately, and another one-third vesting on the first and second anniversaries of the date of grant; and (d) annual award grants to directors vest 100% on the first anniversary of the date of grant.
The 2009 Plan provides for the grant of incentive stock options, nonstatutory stock options, non-statutory stock options, restricted stock, and other stock-based awards such as restricted stock units and stock appreciation rights (“SARs”). Under the plan, the exercise price of an option and the base price of SAR may not be less than the fair market value of a share on the grant date. The maximum term of each option or SAR is ten years. Subject to these limits, the times at which each option or SAR will be exercisable and provisions requiring forfeiture of unexercised options or SARs at or following termination of employment or upon the occurrence of other events generally are fixed by the Compensation Committee. Options may be exercised by payment of the exercise price in cash or its equivalent, or, at the discretion of the Compensation Committee, using shares having a fair market value equal to the exercise price. These exercise methods may include withholding of option shares to pay the exercise price, tendering previously acquired shares and, to the extent permitted by law, by means of a “cashless” exercise involving a broker. The Compensation Committee is also authorized to grant restricted stock and restricted stock units. Prior to the end of the restricted period, shares granted as restricted stock may not be sold, and are forfeited in the event of a separation from service in specified circumstances. Aside from the risk of forfeiture and non-transferability, an award of restricted stock may entitle the participant to the rights of a shareholder, including the right to vote the shares and to receive dividends, which dividends could be either forfeitable or non-forfeitable. Any of these rights may be limited by the Compensation Committee.
Under the 2009 Plan, we are required to adjust the number and kind of shares subject to the share limitations and individual awards, as well as to the exercise price, grant price or purchase price relating to any award, upon the occurrence of specific corporate events such as a large, special and non-recurring dividend or distribution, recapitalization, stock split, stock dividend, reorganization, merger, consolidation, spin-off, business combination or other similar corporate transaction or event affecting Square 1 Financial common stock.
The 2009 Plan is administered by the Compensation Committee, which is authorized to select participants, determine the type and number of awards to be granted and the number of shares to which awards will relate, specify times at which awards will be exercisable or settled, set other terms and conditions of such awards, waive or amend any terms, conditions, restrictions or limitations on an award; prescribe forms of award agreements, establish and interpret performance goals and business criteria in connection with awards and evaluate the level of performance, and make all other determinations which may be necessary or advisable for the administration of the 2009 Plan.
The 2009 Plan authorizes the Compensation Committee to provide for forfeiture of awards and award gains in the event a participant fails to comply with conditions relating to non-competition, non-solicitation, confidentiality, non-disparagement and other requirements for the protection of the our business, including during specified periods following separation from service.
86
Table of Contents
The Compensation Committee will determine, among other things, the vesting schedule of awards, the circumstances resulting in forfeiture of awards, the post-termination exercise periods of options and SARs, and the events resulting in acceleration of the right to exercise and the lapse of restrictions. Unless otherwise determined by the Compensation Committee at the time an award is made, a participant’s award(s) under the plan will vest in full upon the participant’s death or disability. In the event a participant’s employment or service is terminated for cause, all unvested awards are forfeited and all unexercised stock options are cancelled.
The 2009 Plan provides that, in the event of a “change in control” (as defined in the plan), all outstanding awards will immediately vest and become fully exercisable and, any restrictions and forfeiture conditions of such awards will lapse. The Compensation Committee can provide for different treatment of an award upon a change in control by so specifying at the grant date. In the event of a change in control, the Committee may unilaterally determine that all outstanding awards are cancelled and that the value of such awards, as determined by the Committee, be paid out in cash in an amount based on the value received by Square 1 Financial shareholders in the transaction. However, no cash settlement will occur with respect to any award if the Committee reasonably determines in good faith prior to the occurrence of a change in control that such awards will be assumed by any successor to Square 1 Financial.
The Board may amend, suspend or terminate the 2009 Plan without the consent of shareholders or participants, except that any amendment to the plan must be submitted to shareholders if an amendment would materially increase the number of shares reserved for issuance, change the types of awards available under the plan, expand the class of persons eligible to receive awards under the plan, extend the term of the plan or decrease the exercise price at which options may be granted. Unless earlier terminated, the authority of the Compensation Committee to make grants under the 2009 Plan will terminate on September 13, 2015.
Outstanding Equity Awards at 2013 Fiscal Year-End
The following table shows the number of shares of our common stock covered by stock options and restricted stock units held by our named executive officers as of December 31, 2013. All of the awards shown in the table below were granted under the 2009 Plan. All of the stock options and restricted stock units shown in the table below were granted with a per share exercise price equal to the fair market value of our common stock on the grant date. Each of the stock options and restricted stock units set forth below vests ratably in either three or five installments as determined by the Compensation Committee. No stock options were exercised by the named executive officers during fiscal 2013.
| Option Awards | Stock Awards | |||||||||||||||||||||||||||
| Name |
Grant Date |
Number of Securities Underlying Unexercised Options (#) Exercisable |
Number of Securities Underlying Unexercised Options (#) Unexercisable |
Option Exercise Price ($) |
Option Expiration Date |
Number of Shares or Units that have not Vested (#) |
Market Value of Shares or Units of Stock that have not Vested ($) |
|||||||||||||||||||||
| Douglas H. Bowers |
3/29/2011 | 80,000 | 120,000 | 6.00 | 3/29/2018 | 34,133 | 303,101 | |||||||||||||||||||||
| Patrick Oakes |
8/13/2012 | 10,000 | 40,000 | 6.88 | 8/13/2019 | 11,000 | 97,680 | |||||||||||||||||||||
| Gregory Thompson |
8/8/2011 | 16,000 | 24,000 | 6.00 | 8/8/2018 | 9,000 | 79,920 | |||||||||||||||||||||
| Judith E. Erwin |
8/2/2010 | 54,000 | 36,000 | 6.00 | 8/2/2017 | 12,000 | 106,650 | |||||||||||||||||||||
Compensation of Directors
Non-employee directors of Square 1 Bank and Square 1 Financial receive: an annual cash retainer of between $20,000 and $25,000 for their service as a member of the Board of Directors; an annual cash retainer of between $4,000 and $20,000 for their service as a chair of a committee of the Board of Directors; and an annual cash retainer of between $2,000 and $10,000 for their service as a member of a committee of the Board of Directors.
In addition, Square 1 Financial will grant to each non-employee director restricted stock units of Square 1 Financial in an amount equivalent to $15,000 for directors of both Square 1 Financial and Square 1 Bank, and in an amount equivalent to $10,000 for directors of Square 1 Financial, the exact number of restricted stock units to be calculated based upon the value of Square 1 Financial common stock. Directors who hold (or represent firms that hold) greater than 17,800 shares of Square 1 Financial common stock are permitted to elect to receive an annual cash fee in lieu of restricted stock units. These restricted stock units vest on the first anniversary of the grant date.
87
Table of Contents
The following table sets forth compensation paid, earned or awarded during 2013 to each of our directors other than Mr. Bowers, whose compensation is described in the “Summary Compensation Table” above. The table also includes compensation earned by each director that is attributable to their service as a director of Square 1 Bank.
| Director |
Fees Earned or Paid in Cash |
Stock Awards(5) |
Total | |||||||||
| Paul R. Burke |
$ | 40,000 | (1) | $ | 15,002 | $ | 55,002 | |||||
| Susan G. Casey |
21,667 | 10,001 | 31,668 | |||||||||
| Norman P. Creighton |
52,000 | (2) | — | 52,000 | ||||||||
| William F. Grant III |
37,000 | 15,002 | 52,002 | |||||||||
| Robert E. Keith, Jr. |
30,000 | (1)(3) | 15,002 | 45,002 | ||||||||
| Daniel R. Mathis |
60,000 | (2) | — | 60,000 | ||||||||
| Robert S. Muehlenbeck |
61,000 | 15,002 | 76,002 | |||||||||
| John T. Pietrzak |
49,167 | (1)(2) | — | 49,167 | ||||||||
| Seth A. Rudnick |
52,333 | (2) | — | 52,333 | ||||||||
| Robert H. Scott |
38,000 | 15,002 | 53,002 | |||||||||
| Lee Settle |
24,167 | (3) | 15,002 | 39,169 | ||||||||
| Robert I. Usdan |
5,167 | (4) | — | 5,167 | ||||||||
| W. Kirk Wycoff |
46,000 | (1)(2) | — | 46,000 | ||||||||
| (1) | Includes payments made to Northaven, TL Ventures, Castle Creek and Patriot Financial Partners, the respective entities these Directors represent. |
| (2) | Includes an annual cash fee of $15,000 in lieu of restricted stock units. |
| (3) | Messrs. Keith and Settle resigned from the Board of Directors effective October 31, 2013. Their restricted stock units became fully vested upon their resignation. |
| (4) | Mr. Usdan was appointed to the Board of Directors in November 2013. |
| (5) | Represents the aggregate grant date fair value of the granting of 2,055 restricted stock units to each director who is a director of both the Company and the Bank, and 1,370 restricted stock units to each director who is a director of only the Company computed in accordance with FASB ASC Topic 718 based on a per share price of $7.30. |
Directors are reimbursed for travel, food, lodging and other expenses directly related to their activities as directors.
88
Table of Contents
PRINCIPAL AND SELLING SHAREHOLDERS
The following table provides information regarding the beneficial ownership of our common stock as of January 31, 2014, and as adjusted to reflect the completion of the offering, for:
| • | each person known to us to be the beneficial owner of more than five percent of our common stock; |
| • | each of our directors and executive officers; |
| • | all directors and executive officers, as a group; and |
| • | the selling shareholders. |
Based on the information provided to us by or on behalf of the selling shareholders, the selling shareholders are not broker-dealers or an affiliate of a broker-dealer.
We have determined beneficial ownership in accordance with the rules of the SEC. Except as indicated by the footnotes below, we believe, based on the information furnished to us, that the persons and entities named in the tables below have sole voting and investment power with respect to all shares of common stock that they beneficially own, subject to applicable community property laws. Unless otherwise noted, the address for each shareholder listed on the table below is: c/o Square 1 Financial, Inc., 406 Blackwell Street, Suite 240, Durham, North Carolina 27701.
In connection with our private placement offerings we entered into Registration Rights Agreements with Endicott, Castle Creek, Patriot, Northaven, MGS Partners, LLC (“MGS Partners”) and Basswood Opportunity Partners, LP, Basswood Opportunity Fund, Inc., Basswood Financial Fund, LP and Basswood Financial Enhanced Fund, LP (“Basswood”). Under those Registration Rights Agreements, we granted certain demand and piggyback registration rights with respect to the shares of common stock acquired by those entities in our private placement offerings. See “Certain Relationships and Related Party Transactions—Registration Rights.”
The tables below calculate the percentage of beneficial ownership based on 19,783,726 shares of Class A common stock outstanding as of January 31, 2014 and 27,200,336 shares of common stock outstanding upon completion of the offering (which assume the underwriters’ purchase option has not been exercised), except as follows. In computing the number of shares of common stock beneficially owned by a person and the percentage ownership of that person, we deemed outstanding shares of common stock subject to options or warrants held by that person that are currently exercisable or exercisable within sixty days of January 31, 2014. However, we did not deem these shares outstanding for the purpose of computing the percentage ownership of any other person. Beneficial ownership representing less than 1% is denoted with an asterisk (*).
| Prior to the Offering | Shares of Common Stock Being Offered |
After the Offering | ||||||||||||||||||||||||||||||
| Name of Beneficial Owner |
Number of Shares Owned (Excluding Options, Trust Preferred Securities and Warrants) |
Number of Shares That May be Acquired Within 60 Days by Exercising Options, Trust Preferred Securities and Warrants |
Number of Shares |
Percent of Class |
Number of Shares |
Percent of Class |
Number of Shares Owned (Excluding Options, Trust Preferred Securities and Warrants) (9) |
Percent of Class |
||||||||||||||||||||||||
| Patriot Financial Partners, L.P. Cira Centre, 2929 Arch Street Philadelphia, PA 19104 |
3,731,938 | (1) | 750,000 | 4,481,938 | 21.83 | % | 550,000 | 2.78 | % | 3,181,938 | 11.70 | % | ||||||||||||||||||||
| Castle Creek Capital Partners IV, L.P. 6051 El Tordo Rancho Santa Fe, CA 92067-1329 |
1,898,842 | (2) | — | 1,898,842 | 9.60 | % | — | — | 1,898,842 | 6.98 | % | |||||||||||||||||||||
| Endicott Opportunity Partners III, L.P. 360 Madison Avenue, 21st Floor New York, NY 10017 |
1,898,842 | (3) | — | 1,898,842 | 9.60 | % | 450,000 | (4) | 2.28 | % | 1,898,842 | 6.98 | % | |||||||||||||||||||
| Northaven Management, Inc. 275 Park Avenue, 6th Floor New York, NY 10016 |
1,591,958 | (5) | — | 1,591,958 | (5) | 8.05 | % | 125,000 | * | 1,466,958 | 5.39 | % | ||||||||||||||||||||
| Basswood Capital Management, LLC 645 Madison Avenue New York, NY 10022 |
1,222,726 | (6) | — | 1,222,726 | 6.18 | % | 549,385 | 2.78 | % | 673,341 | 2.48 | % | ||||||||||||||||||||
(table and footnotes continued on following page)
89
Table of Contents
| Prior to the Offering | Shares of Common Stock Being Offered |
After the Offering | ||||||||||||||||||||||||||||||
| Name of Beneficial Owner |
Number of Shares Owned (Excluding Options, Trust Preferred Securities and Warrants) |
Number of Shares That May be Acquired Within 60 Days by Exercising Options, Trust Preferred Securities and Warrants |
Number of Shares |
Percent of Class |
Number of Shares |
Percent of Class |
Number of Shares Owned (Excluding Options, Trust Preferred Securities and Warrants) (9) |
Percent of Class |
||||||||||||||||||||||||
| Stanley J. Bradshaw |
534,500 | 79,000 | 613,500 | 3.09 | % | 533,480 | 2.70 | % | 80,020 | * | ||||||||||||||||||||||
| Leon A. Felman |
158,000 | 300,000 | 458,000 | |
2.28 |
% |
398,261 | 2.01 | % | 59,739 | * | |||||||||||||||||||||
| FJC |
115,000 | (7) | — | 115,000 | |
* |
|
100,000 | * | 15,000 | * | |||||||||||||||||||||
| Amaprop Limited |
700,000 | (8) | — | 700,000 | |
3.54 |
% |
50,000 | * | 650,000 | 2.39 | % | ||||||||||||||||||||
| (1) | Includes shares held by each of Patriot Financial Partners, L.P. and Patriot Financial Partners Parallel, L.P. Because (i) W. Kirk Wycoff, Ira Lubert and James Lynch serve as general partners of Patriot Financial Partners, L.P. and Patriot Financial Partners Parallel, L.P. (together, the “Funds”) and Patriot Financial Partners, GP, L.P (“Patriot GP”) and as members of Patriot Financial Partners, GP, LLC (“Patriot LLC”), (ii) Patriot LLC serves as general partner of Patriot GP and (iii) Patriot GP serves as general partner of the Funds, each of Messrs. Wycoff, Lubert and Lynch, Patriot LLC and Patriot GP may be deemed to possess shared voting and dispositive power over the shares of Company common stock held by the Funds. |
| (2) | Does not include 2,563,383 shares of Class B Non-Voting Common Stock held by Castle Creek Capital Partners IV, L.P. and its affiliates. |
| (3) | Does not include 1,349,227 shares of Class B Non-Voting Common Stock held by Endicott Opportunity Partners III, L.P. and its affiliates. |
| (4) | Consists of Class B shares that will convert to Class A shares upon the sale in this offering. Endicott Management Company (“EMC”) is the investment manager to Endicott Opportunity Partners III, L.P. (“EOP III”), and consequently has the authority to vote and to dispose of the securities held by EOP III. W.R. Endicott III, L.L.C. (“WRE III”), is the general partner of EOP III and may be deemed to have beneficial ownership of, and share voting and dispositive power over, shares of securities held directly by EOP III. Robert I. Usdan and Wayne K. Goldstein are the Co-Presidents and sole shareholders of EMC and the managing members of WRE III and may be deemed to have beneficial ownership of, and share voting and dispositive power over, shares of securities held directly by EOP III. |
| (5) | Includes shares held by each of Northaven Partners, L.P., Northaven Partners II, L.P., Northaven Partners III, L.P., Northaven Capital Partners, L.P. (together, the “Partnerships”), and Northaven Offshore, Ltd. (together with the Partnerships, the “Funds”). Northaven Management, Inc. (the “Manager”), which serves as investment advisor to the Funds, is the beneficial owner of 1,591,958 shares of Class A common stock, and has shared voting and dispositive power over the shares owned by the Funds. Northaven Associates, LLC (the “General Partner”) is the general partner of each of the Partnerships, owns the management shares of Northaven Offshore, Ltd., and may be deemed to have beneficial ownership of the shares held by the Funds, and has shared voting and dispositive power over such shares. Paul Burke and Richard Brown are the shareholders of the Manager and the members of the General Partner, may each be deemed to be beneficial owners of the shares owned by the Funds, and have shared voting and dispositive power over such shares. |
| (6) | Includes shares held by each of Basswood Opportunity Partners, L.P., Basswood Opportunity Fund, Inc., Basswood Financial Fund, LP, Basswood Financial Enhanced Fund, LP and MGS Partners, LLC. Basswood Capital Management, L.L.C. (the “Management Company”) is the investment manager or adviser to Basswood Opportunity Partners, LP, Basswood Opportunity Fund, Inc., Basswood Financial Fund, LP and Basswood Financial Enhanced Fund, LP (collectively, the “Funds”), and consequently has the authority to vote and to dispose of the securities held by the Funds. Basswood Partners, L.L.C. (“Basswood Partners”), is the general partner of each of Basswood Opportunity Partners, LP, Basswood Financial Fund, LP and Basswood Financial Enhanced Fund, LP and may be deemed to have beneficial ownership of, and share voting and dispositive power over, shares of securities held directly by such Funds. Matthew Lindenbaum and Bennett Lindenbaum are the managing members of the Management Company and Basswood Partners and may be deemed to have beneficial ownership of, and share voting and dispositive power over, shares of securities held directly by the Funds. MGS Partners, LLC is an entity in which Matthew Lindenbaum and Bennett Lindenbaum are each members. |
| (7) | Lorin Silverman, President of FJC, may be deemed to share voting and investment power with respect to the shares. |
| (8) | Shares are held by Amaprop Limited (“Amaprop”). Amaranth Advisors L.L.C. (the “Trading Advisor”) is the trading adviser to Amaprop, and has the authority to vote and to dispose of the securities held by Amaprop. Nicholas Maounis is the managing member of the Trading Advisor and may be deemed to share voting and dispositive power over shares of securities held directly by Amaprop. |
| (9) | Does not include the sale of shares by each of the selling shareholders in proportion to the number of shares each such selling shareholder sells in the offering if the underwriters’ purchase option is exercised, which in the aggregate total 413,417 shares (including 67,500 shares of Class B Common Stock) if the underwriters exercise in full their purchase option. |
90
Table of Contents
| Prior to the Offering | After the Offering | |||||||||||||||||||||||||||||||
| Name of Beneficial |
Number
of Shares Owned (Excluding Options, Trust Preferred Securities and Warrants and RSUs) |
Number of Shares That May be Acquired Within 60 Days by Exercising Options, Trust Preferred Securities Warrants and Vesting of RSUs |
Number of Shares |
Percent of Class(1) |
Number
of Shares Owned (Excluding Options, Trust Preferred Securities and Warrants and RSUs) |
Number of Shares That May be Acquired Within 60 Days by Exercising Options, Trust Preferred Securities Warrants and Vesting of RSUs |
Number of Shares |
Percent of Class |
||||||||||||||||||||||||
| Samir Bhaumik |
12,000 | 25,018 | 37,018 | * | 12,000 | 25,018 | 37,018 | * | ||||||||||||||||||||||||
| Douglas H. Bowers |
90,692 | 129,655 | 220,347 | 1.11 | % | 90,692 | 129,655 | 220,347 | * | |||||||||||||||||||||||
| Paul R. Burke |
4,236 | (2) | — | 4,236 | * | 4,236 | (2) | — | 4,236 | * | ||||||||||||||||||||||
| Susan G. Casey |
101,562 | 194,000 | 295,562 | 1.49 | % | 101,562 | 194,000 | 295,562 | * | |||||||||||||||||||||||
| Norman P. Creighton |
166,181 | 4,000 | 170,181 | * | 166,181 | 4,000 | 170,181 | * | ||||||||||||||||||||||||
| Diane Earle |
1,500 | 10,891 | 12,391 | * | 1,500 | 10,891 | 12,391 | * | ||||||||||||||||||||||||
| Judith E. Erwin |
22,854 | 55,018 | 77,872 | * | 22,854 | 55,018 | 77,872 | * | ||||||||||||||||||||||||
| William F. Grant III |
24,236 | 17,000 | 41,236 | * | 24,236 | 17,000 | 41,236 | * | ||||||||||||||||||||||||
| Jason Kranack |
— | 2,509 | 2,509 | * | — | 2,509 | 2,509 | * | ||||||||||||||||||||||||
| Daniel R. Mathis |
22,181 | 19,000 | 41,181 | * | 22,181 | 19,000 | 41,181 | * | ||||||||||||||||||||||||
| Robert S. Muehlenbeck |
58,236 | 9,000 | 67,236 | * | 58,236 | 9,000 | 67,236 | * | ||||||||||||||||||||||||
| Patrick Oakes |
6,000 | 11,018 | 17,018 | * | 6,000 | 11,018 | 17,018 | * | ||||||||||||||||||||||||
| John T. Pietrzak |
— | (3) | — | — | * | — | (3) | — | — | * | ||||||||||||||||||||||
| Seth A. Rudnick |
— | 30,000 | 30,000 | * | — | 30,000 | 30,000 | * | ||||||||||||||||||||||||
| Robert H. Scott |
4,436 | — | 4,436 | * | 4,436 | — | 4,436 | * | ||||||||||||||||||||||||
| Gregory Thompson |
5,000 | 16,891 | 21,891 | * | 5,000 | 16,891 | 21,891 | * | ||||||||||||||||||||||||
| Frank Tower |
— | |
— |
|
— | * | — | |
— |
|
— | |||||||||||||||||||||
| Robert I. Usdan |
— | (4) | — | — | * | — | (4) | — | — | * | ||||||||||||||||||||||
| Christopher J. Woolley |
87,272 | 68,018 | 155,290 | * | 87,272 | 68,018 | 155,290 | * | ||||||||||||||||||||||||
| W. Kirk Wycoff |
— | (5) | — | — | * | — | (5) | — | — | * | ||||||||||||||||||||||
| All directors and executive officers as a group (20 persons) |
606,386 | 592,017 | 1,198,403 | 6.06 | % | 606,386 | 592,017 | 1,198,403 | 4.41 | % | ||||||||||||||||||||||
| * | Less than 1%. |
| (1) | Based on 19,783,726 shares of Square 1 Financial’s Class A common stock outstanding and entitled to vote as of January 31, 2014, plus the number of shares that may be acquired within 60 days thereafter by each individual (or group of individuals) by exercising stock options and shares issuable upon the exercise of warrants and the conversion of trust preferred securities. |
| (2) | Northaven Management, Inc. is the beneficial owner of 1,591,958 shares of Square 1 Financial’s Class A common stock. As Mr. Burke serves as a shareholder in Northaven Management, Inc., and a member of Northaven Associates, LLC, the general partner of each of Northaven Partners, L.P., Northaven Partners II, L.P., Northaven Partners III, L.P., and Northaven Capital Partners, L.P., and Northaven Offshore Ltd. Mr. Burke may be deemed to have beneficial ownership of such shares. |
| (3) | Mr. Pietrzak serves as a principal of Castle Creek Capital Partners IV, L.P. which entity owns 1,898,842 shares of Square 1 Financial’s Class A common stock and 2,563,383 shares of Square 1 Financial’s Class B non-voting common stock. Mr. Pietrzak disclaims beneficial ownership of such shares. |
| (4) | Mr. Usdan serves as a managing member of WRE III, the general partner of EOP III which entity owns 1,898,842 shares of Square 1 Financial’s Class A common stock and 1,349,227 shares of Square 1 Financial’s Class B non-voting common stock. Mr. Usdan may be deemed to have beneficial ownership of such shares. Mr. Usdan disclaims beneficial ownership of such shares. |
| (5) | Patriot Financial Partners, L.P. holds 3,182,218 shares and 639,524 warrants to purchase shares of Square 1 Financial’s Class A common stock. Patriot Financial Partners Parallel, L.P. holds 549,720 shares and 110,476 warrants to purchase shares of Square 1 Financial’s Class A common stock. Patriot GP is a general partner of the Funds, and Patriot LLC is a general partner of Patriot GP. In addition, Mr. Wycoff is one of the general partners of the Funds and Patriot GP, and is a member of Patriot LLC. Accordingly, securities owned by the Funds may be regarded as being beneficially owned by Mr. Wycoff. Mr. Wycoff disclaims beneficial ownership thereof except to the extent of his pecuniary interest therein. |
91
Table of Contents
The following describes the material terms of our amended and restated certificate of incorporation and bylaws.
General
Our certificate of incorporation authorizes us to issue a total of 45,000,000 shares of common stock, par value $0.01 per share, of which 4,000,000 are shares of Class B non-voting common stock, and 10,000,000 shares of preferred stock, $0.01 per share, of which 5,000 shares have been designated as Series A preferred stock. At a special meeting of shareholders held on February 4, 2014, we received approval to amend our certificate of incorporation to increase our authorized common stock to 70,000,000 shares, subject to the closing of our initial public offering of common stock. The authorized but unissued shares of our capital stock will be available for future issuance without shareholder approval, unless otherwise required by applicable law or the rules of any applicable securities exchange.
Class A Common Stock
As of January 31, 2014, 19,783,726 shares of our Class A common stock were issued and outstanding and held by approximately 385 shareholders of record. We have reserved an additional 500,000 shares for issuance upon the conversion of our Series A preferred stock, 741,500 shares for issuance upon the conversion of our trust preferred securities, 820,000 shares for issuance upon the exercise of organizer and investor warrants and 1,842,420 shares for issuance upon exercise of outstanding stock options and the vesting of outstanding restricted stock units. We have also reserved 612,715 shares for issuance in connection with stock options and restricted stock units that remain available for issuance under our stock incentive plan.
Dividends. Square 1 Financial can pay dividends out of statutory surplus or from certain net profits if, as and when declared by the Board of Directors. The payment of dividends by Square 1 Financial is limited by law and applicable regulation. The holders of common stock of Square 1 Financial are entitled to receive and share equally in dividends as may be declared by the Board of Directors of Square 1 Financial out of funds legally available for dividends. If Square 1 Financial issues preferred stock, the holders of the preferred stock may have a priority over the holders of the common stock with respect to dividends.
Voting Rights. The holders of Class A common stock of Square 1 Financial possess exclusive voting rights in Square 1 Financial. They elect Square 1 Financial’s Board of Directors and act on other matters as are required to be presented to them under Delaware law or as are otherwise presented to them by the Board of Directors. Each holder of common stock is entitled to one vote per share and does not have any right to cumulate votes in the election of directors. If Square 1 Financial issues preferred stock, holders of Square 1 Financial preferred stock may also possess voting rights.
Indemnification and Limit on Liability. Square 1 Financial’s certificate of incorporation contains provisions that limit the liability of and indemnify its directors, officers and employees. Such provisions provide that each person who was or is made a party or is threatened to be made a party to or is otherwise involved in any action, suit or proceeding, whether civil, criminal, administrative or investigative, by reason of the fact that he or she is or was a director or officer of Square 1 Financial will be indemnified and held harmless by Square 1 Financial to the fullest extent authorized by the Delaware General Corporation Law against all expense, liability and loss reasonably incurred. Under certain circumstances, the right to indemnification will include the right to be paid by Square 1 Financial the expenses incurred in defending any such proceeding in advance of its final disposition. In addition, a director of Square 1 Financial will not be personally liable to Square 1 Financial or its shareholders for monetary damages except for liability for any breach of the duty of loyalty, for acts or omissions not in good faith or which involve intentional misconduct or knowing violation of the law, under Section 174 of the Delaware General Corporation Law, or for any transaction from which the director derived an improper personal benefit.
Preemptive Rights; Redemption. Holders of the Class A common stock of Square 1 Financial are not entitled to preemptive rights with respect to any shares that may be issued. The Class A common stock cannot be redeemed.
Class B Non-Voting Common Stock
As of January 31, 2014, 3,912,610 shares of our Class B non-voting common stock were issued and outstanding and held by two shareholders. The dividend, indemnification, preemptive rights and redemption provisions described above with respect to our Class A common stock are equally applicable to our Class B non-voting common stock.
92
Table of Contents
Voting Rights. The holders of Class B non-voting common stock have no voting rights except as may be provided for under Delaware law.
Conversion/Transfer. Shares of Class B non-voting common stock may be converted into an equal number of shares of Class A common stock at the option of a holder of such shares provided such holder is not the initial holder or affiliate of the initial holder. Purchasers in this offering will be deemed to have exercised their option to convert Class B shares to Class A shares as a condition to participating in the offering such that all purchasers will receive Class A shares. Class B non-voting common stock may only be transferred in the following manner: (i) to an affiliate of the initial Class B non-voting common stock holder or to Square 1 Financial, (ii) in a widely distributed public offering of common stock of Square 1 Financial and/or Class B non-voting common stock of Square 1 Financial, (iii) in a transfer in which no transferee (or group of associated transferees) would receive 2% or more of any class of voting securities of Square 1 Financial (including under a related series of such transfers), or (iv) in a transfer to a person that is acquiring at least a majority of the voting securities of Square 1 Financial.
Protective Provisions. For so long as any Class B non-voting common stock remains outstanding, Square 1 Financial will not, without first obtaining the written consent of the holders of 80% of the shares of Class B non-voting common stock then outstanding, take any action with respect to either of the following matters: (i) amend, alter, repeal, impair or change in any material respect the rights, preferences, powers, privileges, restrictions, qualifications or limitations of the Class B non-voting common stock, and (ii) amend, alter, repeal or waive any provision of Square 1 Financial’s certificate of designation, the certificate of incorporation of Square 1 Financial or the bylaws of Square 1 Financial which would adversely affect any right, preference, privilege of the Class B non-voting common stock or the holders thereof.
Preferred Stock
Square 1 Financial currently has 5,000 shares of Series A preferred stock outstanding. Preferred stock may be issued with designations, powers, preferences and rights as the Board of Directors may from time to time determine. The Board of Directors can, without shareholder approval, issue preferred stock with voting, dividend, liquidation and conversion rights that could dilute the voting strength of the holders of the common stock and may assist management in impeding an unfriendly takeover or attempted change in control.
Dividends. Holders of the outstanding shares of Series A preferred stock are entitled to receive, when and as authorized by the Board of Directors, out of funds legally available for the payment of dividends, cumulative preferential cash dividends at the rate of 5.0% of the issue price of the Series A preferred stock plus any accrued dividends.
Redemption. The Series A preferred stock is currently redeemable by the Company, at its option, on any quarterly dividend payment date (March 31, June 30, September 30 and December 31). The redemption price is equal to the sum of the issue price plus any accrued dividends.
Conversion. Each share of Series A preferred stock may be converted, at the option of the holder, into the number of fully paid and nonassessable shares of Square 1 Financial Common Stock equal to the quotient of (x) $1,000 (the issue price of the Series A preferred stock) plus any accrued dividends divided by (y) $10.00 per share.
Voting Rights. Holders of shares of Series A preferred stock have no voting rights, except as may be required by Delaware law.
Protective Provisions. For so long as 50% of the shares of the Series A preferred stock remain outstanding, Square 1 Financial may not, except with the written consent of at least a majority of the holders of the shares of Series A preferred stock then outstanding, (i) amend, repeal, impair or change, in any material respect, the rights, preferences, powers, privileges, restrictions, qualifications or limitations of the Series A preferred stock, (ii) authorize, establish, create or issue any additional series of preferred stock, (iii) amend, repeal, impair or waive any provision of its Certificate of Designations, Certificate of Incorporation or bylaws which would adversely affect any right, preference, privilege or voting power of the Series A preferred stock or the Series A preferred stock holders, and (iv) increase the authorized number of shares of Series A preferred stock.
93
Table of Contents
RESTRICTIONS ON ACQUISITION OF SQUARE 1 FINANCIAL
General
As described below and elsewhere in this document, certain provisions in Square 1 Financial’s certificate of incorporation and bylaws may have anti-takeover effects. In addition, Delaware corporate law and regulatory restrictions may make it difficult for persons or companies to acquire control of Square 1 Financial.
Restrictions in Square 1 Financial’s Certificate of Incorporation and Bylaws
Square 1 Financial’s certificate of incorporation and bylaws contain provisions that could make an acquisition of Square 1 Financial by means of a tender offer, proxy context or otherwise more difficult. Some provisions will also render the removal of the incumbent Board of Directors or management of Square 1 Financial more difficult. These provisions may have the effect of deterring a future takeover attempt that is not approved by the directors of Square 1 Financial, but which Square 1 Financial shareholders may deem to be in their best interests or in which shareholders may receive a substantial premium for their shares over then current market prices. As a result, shareholders who might desire to participate in such a transaction may not have the opportunity to do so. The following description of these provisions is only a summary and does not provide all of the information contained in Square 1 Financial’s certificate of incorporation and bylaws.
Evaluation of Offers. The certificate of incorporation of Square 1 Financial provides that the Board of Directors of Square 1 Financial, when evaluating an offer, to (1) make a tender or exchange offer for any equity security of Square 1 Financial, (2) merge or consolidate Square 1 Financial with another corporation or entity, or (3) purchase or otherwise acquire all or substantially all of the properties and assets of Square 1 Financial, may, in connection with the exercise of its judgment in determining what is in the best interest of Square 1 Financial and the shareholders of Square 1 Financial, give consideration to all relevant factors and the social and economic effect of acceptance of such offer on: Square 1 Financial’s present and future customers and employees and those of its subsidiaries (including Square 1 Bank); the communities in which Square 1 Financial and its subsidiaries operate or are located; the ability of Square 1 Financial to fulfill its corporate objectives as a bank holding company; and the ability of Square 1 Bank to fulfill its objectives under applicable statutes and regulations. By having these standards in the certificate of incorporation of Square 1 Financial, the Board of Directors may be in a stronger position to oppose such a transaction if the Board concludes that the transaction would not be in the best interest of Square 1 Financial, even if the price offered is significantly greater than the then market price of any equity security of Square 1 Financial.
Classified Board of Directors. The Board of Directors of Square 1 Financial is divided into three classes, each of which contains approximately one-third of the number of directors. The shareholders elect one class of directors each year for a term of three years. The classified Board makes it more difficult and time consuming for a shareholder group to fully use its voting power to gain control of the Board of Directors without the consent of the incumbent Board of Directors of Square 1 Financial.
Shareholder Action by Written Consent; Special Meetings of Shareholders. Shareholders of Square 1 Financial must act only through an annual or special meeting. Shareholders cannot act by written consent in lieu of a meeting. The certificate of incorporation provides that only a majority of the Board of Directors of Square 1 Financial may call special meetings of the shareholders of Square 1 Financial. Shareholders are not able to call a special meeting or require that the Board do so. At a special meeting, shareholders may consider only the business specified in the notice of meeting given by Square 1 Financial. The provisions of Square 1 Financial’s certificate of incorporation prohibiting shareholder action by written consent may have the effect of delaying consideration of a shareholder proposal until the next annual meeting, unless a special meeting is called at the request of a majority of the Board of Directors. These provisions also would prevent the holders of a majority of common stock from unilaterally using the written consent procedure to take shareholder action. Moreover, a shareholder could not force shareholder consideration of a proposal between annual meetings over the opposition of the Board of directors by calling a special meeting of shareholders.
Advance Notice Provisions for Shareholder Nominations and Proposals. Square 1 Financial’s bylaws establish an advance notice procedure for shareholders to nominate directors or bring other business before an annual meeting of shareholders of Square 1 Financial. A person may not be nominated for election as a director unless that person is nominated by or at the direction of Square 1 Financial’s Board or by a shareholder who has given appropriate notice to Square 1 Financial before the meeting. Similarly, a shareholder may not bring business before an annual meeting unless the
94
Table of Contents
shareholder has given Square 1 Financial appropriate notice of its intention to bring that business before the meeting. Square 1 Financial’s Secretary must receive notice of the nomination or proposal not less than 90 days and not more than 120 days prior to the annual meeting. A shareholder who desires to raise new business must provide certain information to Square 1 Financial concerning the nature of the new business, the shareholder and the shareholder’s interest in the business matter. Similarly, a shareholder wishing to nominate any person for election as a director must provide Square 1 Financial with certain information concerning the nominee and the proposing shareholder.
Advance notice of nominations or proposed business by shareholders gives Square 1 Financial’s Board time to consider the qualifications of the proposed nominees, the merits of the proposals and, to the extent deemed necessary or desirable by Square 1 Financial’s Board, to inform shareholders and make recommendations about those matters.
Preferred Stock. The certificate of incorporation authorizes Square 1 Financial’s Board to establish one or more series of preferred stock and, for any series of preferred stock, to determine the terms and rights of the series, including voting rights, conversion rates, and liquidation preferences. Although Square 1 Financial’s Board has no intention at the present time of doing so, it could issue a series of preferred stock that could, depending on its terms, impede a merger, tender offer or other takeover attempt. Square 1 Financial’s Board will make any determination to issue shares with those terms based on its judgment as to the best interests of Square 1 Financial and its shareholders.
Anti-Takeover Effects of Square 1 Financial’s Certificate of Incorporation and Bylaws
The provisions described above are intended to reduce Square 1 Financial’s vulnerability to takeover attempts and other transactions that have not been negotiated with and approved by members of the Board of Directors. Provisions of the 2009 Stock Incentive plan provide for accelerated benefits to participants if a change in control of Square 1 Financial occurs. The foregoing provisions and limitations may make it more difficult for companies or persons to acquire control of Square 1 Financial. Additionally, the provisions could deter offers to acquire the outstanding shares of Square 1 Financial that might be viewed by shareholders to be in their best interests. Square 1 Financial’s Board of Directors believes that the provisions of the certificate of incorporation and bylaws are in the best interest of Square 1 Financial and its shareholders.
Transfer Agent and Registrar
Upon completion of the offering, the transfer agent and registrar for our common stock will be Computershare.
SHARES ELIGIBLE FOR FUTURE SALE
Future sales of substantial amounts of our common stock in the public market could adversely affect prevailing market prices. Furthermore, since only a limited number of shares will be available for sale shortly after the offering because of contractual and legal restrictions on resale described below, sales of substantial amounts of shares of common stock in the public market after the restrictions lapse could adversely affect the prevailing market price for shares of our common stock as well as our ability to raise equity capital in the future.
Upon completion of this offering, we will have 27,200,336 shares of common stock issued and outstanding (27,669,086 shares if the underwriters exercise in full their purchase option). The number of issued and outstanding common shares will increase to 28,066,836 upon the full conversion of our remaining preferred stock and trust preferred securities (28,535,586 shares if the underwriters exercise in full their purchase option), both of which will become convertible and are expected to be converted in part, following completion of the offering. In addition, 3,462,610 shares of our common stock are issuable upon the transfer and conversion of our Class B non-voting common stock, 1,394,550 shares of our common stock are issuable upon the exercise of outstanding stock options and 816,000 shares are issuable upon the exercise of warrants.
Of these shares, the 5,881,126 shares sold in this offering by us and the selling shareholders (or 6,763,293 shares, if the underwriters exercise their purchase option in full) will be freely tradable without further restriction or registration under the Securities Act, except that any shares purchased by our affiliates may generally only be sold in compliance with SEC Rule 144, which is described below. The remaining 21,319,210 outstanding shares will be deemed “restricted securities” under the Securities Act. Restricted securities may be sold in the public market only if they qualify for an exemption from registration under Rule 144 or any other applicable exemption.
95
Table of Contents
Rule 144
All shares of our common stock held by our “affiliates,” as that term is defined in Rule 144 under the Securities Act, generally may be sold in the public market only in compliance with Rule 144. Rule 144 defines an affiliate as any person who directly or indirectly controls, or is controlled by, or is under common control with, the issuer, which generally includes our directors, executive officers, 10% shareholders and certain other related persons. Upon completion of the offering, we expect that approximately 46.0% of our outstanding common stock (45.2% of our outstanding common stock if the underwriters exercise in full their purchase option) will be held by “affiliates” (assuming they do not purchase any shares in this offering and taking into account the 1,125,000 shares to be sold by selling shareholders who are affiliates).
Under Rule 144 under the Securities Act, a person (or persons whose shares are aggregated) who is deemed to be an “affiliate” of ours would be entitled to sell within any three-month period a number of shares that does not exceed the greater of 1% of the then outstanding shares of our common stock, which would be approximately 272,003 common shares immediately after this offering (assuming the underwriters do not elect to exercise their purchase option), or the average weekly trading volume of our common stock on the Nasdaq Global Market during the four calendar weeks preceding such sale. Sales under Rule 144 are also subject to a six-month holding period and requirements relating to manner of sale, notice and the availability of current public information about us.
Rule 144 also provides that a person who is not deemed to have been an affiliate of ours at any time during the three months preceding a sale, and who has for at least six months beneficially owned shares of our common stock that are restricted securities, will be entitled to freely sell such shares of our common stock subject only to the availability of current public information regarding us. A person who is not deemed to have been an affiliate of ours at any time during the three months preceding a sale, and who has beneficially owned for at least one year shares of our common stock that are restricted securities, will be entitled to freely sell such shares of our common stock under Rule 144 without regard to the current public information requirements of Rule 144.
Lock-Up Agreements
Our executive officers and directors, those persons participating in the directed share program and shareholders who have registration rights, have entered into lock-up agreements under which they have generally agreed not to sell or otherwise transfer their shares for a period of 180 days after the completion of the offering. These lock-up restrictions are subject to certain exceptions. For additional information, see “Underwriting—Lock-Up Agreements.” As a result of these contractual restrictions, shares of our common stock subject to lock-up agreements will not be eligible for sale until these agreements expire or the restrictions are waived by the underwriters.
Following the lock-up period, all of the shares of our common stock that are restricted securities or are held by our affiliates as of the date of this prospectus will be eligible for sale in the public market in compliance with Rule 144.
Stock Incentive Plan
We intend to file with the SEC a registration statement on Form S-8 covering the shares of common stock reserved for stock options, restricted stock or other types of awards granted under the 2009 plan. That registration statement is expected to be filed and become effective as soon as practicable after the closing of this offering. Upon effectiveness, the shares of common stock covered by that registration statement will be eligible for sale in the public market, subject to the lock-up agreements and Rule 144 of the Securities Act.
CERTAIN RELATIONSHIPS AND RELATED PARTY TRANSACTIONS
In addition to the compensation arrangements with directors and executive officers described in “Executive Compensation” above, the following is a description of each transaction since January 1, 2010, and each proposed transaction in which:
| • | we have been or are to be a participant; |
96
Table of Contents
| • | the amount involved exceeds or will exceed $120,000; and |
| • | any of our directors, executive officers or beneficial holders of more than 5% of our capital stock, or any immediate family member of or person sharing the household with any of these individuals (other than tenants or employees), had or will have a direct or indirect material interest. |
Endicott Investments
In connection with our 2010 private placement offering, we sold 1,456,311 shares of our Class A common stock at a price of $5.15 per share to Endicott.
In connection with the investment, we entered into an agreement with Endicott that permits it to nominate one representative who will be elected or appointed to our Board of Directors, for so long as Endicott and its affiliates own at least 4.9% of the outstanding shares of our common stock. Mr. Usdan was appointed by the Board of Directors as the representative of Endicott.
In connection with the investment, we also made certain representations and warranties and covenants regarding Square 1 Bank and us and agreed to provide limited indemnification rights to Endicott in connection with the representations and warranties.
In connection with our September 2012 private placement offering, we sold 105,318 shares of our Class A common stock and 1,349,227 of our Class B non-voting common stock at a price of $6.875 per share to Endicott and its affiliates.
Castle Creek Investments
In connection with our 2010 private placement offering, we sold 887,765 shares of our Class A common stock and 1,976,313 shares of our Class B non-voting common stock at a price of $5.15 per share to Castle Creek.
In connection with the investment, we entered into an agreement with Castle Creek that permits it to nominate one representative who will be elected or appointed to our Board of Directors, for so long as Castle Creek and its affiliates own at least 4.9% of the outstanding shares of our common stock. Mr. Pietrzak was appointed by the Board of Directors as the representative of Castle Creek.
In connection with the investment, we also made certain representations and warranties and covenants regarding Square 1 Bank and us and agreed to provide limited indemnification rights to Castle Creek in connection with the representations and warranties.
In connection with our September 2012 private placement offering, we sold 140,203 shares of our Class A common stock and 587,070 of our Class B non-voting common stock at a price of $6.875 per share to Castle Creek and its affiliates.
Patriot Investments
In connection with our 2010 private placement offering, we sold 2,864,078 shares of our Class A common stock to Patriot at a price of $5.15 per share.
In connection with the investment, we entered into an agreement with Patriot that provided it with certain additional rights, including the ability to nominate one representative who will be elected or appointed to our Board of Directors, for so long as Patriot owns at least 4.9% of our outstanding stock. Mr. Wycoff was appointed by the Board of Directors as the representative of Patriot.
In connection with the investment, we also made certain representations and warranties and covenants regarding Square 1 Bank and us and agreed to provide limited indemnification rights to Patriot in connection with the representations and warranties.
In addition, on February 23, 2010 and May 21, 2010, Square 1 Financial granted warrants to purchase a total of 750,000 shares of its common stock at an exercise price of $5.15 per share to Patriot.
97
Table of Contents
In connection with our September 2012 private placement offering, we sold 727,273 shares of our Class A common stock at a price of $6.875 per share to Patriot and its affiliates.
Northaven Investments
In connection with our 2010 private placement offering we sold 1,067,962 shares of our Class A common stock at a price of $5.15 per share to Northaven and its affiliates. In connection with the investment, we entered into an agreement with Northaven that permits it to nominate one representative who will be elected or appointed to our Board of Directors for so long as Northaven and its affiliates own at least 4.9% of the outstanding shares of our Class A common stock. Mr. Burke was appointed by the Board of Directors as the representative of Northaven.
In connection with the investment, we also made certain representations and warranties and covenants regarding Square 1 Bank and us and agreed to provide limited indemnification rights to Northaven in connection with the representations and warranties.
In connection with our December 2012 private placement offering, we sold 20,000 shares of our Class A common stock at a price of $6.875 per share to Northaven.
Basswood Investments
In connection with our 2010 private placement offering, we sold 1,067,961 shares of our Class A common stock to Basswood and MGS Partners at a price of $5.15 per share.
In connection with the investment, we also made certain representations and warranties and covenants regarding Square 1 Bank and us and agreed to provide limited indemnification rights to Basswood in connection with the representations and warranties.
In connection with our September 2012 private placement offering, we sold 89,765 shares of our Class A common stock at a price of $6.875 per share to Basswood.
Private Placement Offerings
We have engaged in several private offerings of our common stock in which certain of our executive officers, directors and principal shareholders participated.
Registration Exemption
The issuances of securities described above were made in reliance upon exemptions from federal securities registration under Section 4(2) of the Securities Act, and Rule 506 thereunder, as transactions not constituting a public offering of securities because the shares were issued privately without general solicitation. There were no underwriting discounts or commissions on these sales.
Registration Rights
In connection with our private placement offerings, we entered into Registration Rights Agreements with Endicott, Castle Creek, Patriot, Northaven, MGS Partners and Basswood. Under those Registration Rights Agreements we granted certain demand and piggyback registration rights with respect to the shares of common stock acquired by those entities in our private placement offerings.
Under the Registration Rights Agreements we may be required to file a Form S-3 or similar “short-form” registration statement (provided we are permitted to use such form) with the SEC to register the shares of our common stock acquired by those entities, including the shares of our common stock issuable upon the conversion or exercise of any warrant, right or other security held by these entities. We will be required to pay the expenses associated with these demand registrations, other than those incurred by these entities.
98
Table of Contents
The Registration Rights Agreements also provide certain “piggyback” registration rights. Subject to certain limitations, in the event that we register any of our securities under the Securities Act, we must give notice to these entities of our intention to effect such a registration and must include in the registration statement all registrable securities of these entities for which we have received a written request for inclusion. The required notice regarding these registration rights was provided on November 7, 2013. We also requested a waiver of the “lock-up” requirement related to holders of 25,000 or more of our outstanding common stock. In addition, if Square 1 Financial is advised in writing in good faith by any managing underwriter of Square 1 Financial’s securities being offered in a public offering that the amount to be sold by selling shareholders (other than Square 1 Financial) is greater than the amount which can be offered without adversely affecting the offering, Square 1 Financial may reduce the amount offered for the accounts of selling shareholders. However, the amount of registrable securities of the selling shareholders may not be reduced below ten percent of the total amount of the securities included in such offering. We will be required to pay the expenses associated with these piggyback registrations, other than those incurred by these entities.
Ordinary Banking Relationships
Certain of our officers, directors and principal shareholders, as well as their immediate family members and affiliates, are customers of, or have or have had transactions with, Square 1 Bank or us in the ordinary course of business. These transactions include deposits and loans. Related party transactions are made in the ordinary course of business, on substantially the same terms, including interest rates and collateral (where applicable), as those prevailing at the time for comparable transactions with persons not related to us, and do not involve more than normal risk of collectability or present other features unfavorable to us. As of the date of this prospectus, no related party loans were categorized as nonaccrual, past due, restructured or potential problem loans. We expect to continue to enter into transactions in the ordinary course of business on similar terms with our officers, directors and principal shareholders, as well as their immediate family members and affiliates.
Policies and Procedures Regarding Related Party Transactions
Transactions by Square 1 Bank or us with related parties are subject to a formal written policy, as well as regulatory requirements and restrictions. These requirements and restrictions include Sections 23A and 23B of the Federal Reserve Act (which govern certain transactions by Square 1 Bank with its affiliates) and the Federal Reserve’s Regulation O (which governs certain loans by Square 1 Bank to its executive officers, directors, and principal shareholders). We have adopted policies to comply with these regulatory requirements and restrictions.
Our formal written policy governing the approval of related party transactions complies with all applicable requirements of the SEC and the Nasdaq Global Market concerning related party transactions. Related party transactions are transactions in which we are a participant, the amount involved exceeds $120,000 and a related party has or will have a direct or indirect material interest. Related parties of Square 1 Financial include directors (including nominees for election as directors), executive officers, 5% shareholders and the immediate family members of these persons. Our Director of Legal, in consultation with management and outside counsel, as appropriate, will review potential related party transactions to determine if they are subject to the policy. If so, the transaction will be referred to the Directors Loan Committee of Square 1 Bank and, subsequently, the Board of Directors of Square 1 Bank for approval. In determining whether to approve a related party transaction, the Board’s Nominating/Corporate Governance Committee will consider, among other factors, the fairness of the proposed transaction, the direct or indirect nature of the related party’s interest in the transaction, the appearance of an improper conflict of interests for any director or executive officer taking into account the size of the transaction and the financial position of the related party, whether the transaction would impair an outside director’s independence, the acceptability of the transaction to our regulators and the potential violations of other corporate policies.
General
Square 1 Bank is a North Carolina-charted stock commercial bank. Square 1 Bank is the wholly-owned subsidiary of Square 1 Financial, a Delaware corporation and registered bank holding company. Square 1 Bank’s deposits are insured up to applicable limits by the FDIC and by the Deposit Insurance Fund for amounts in excess of the FDIC insurance limits. Square 1 Bank is subject to extensive regulation by the NCCOB, as its chartering agency, and by the FDIC, as its deposit insurer.
99
Table of Contents
Square 1 Bank is required to file reports with, and is periodically examined by, the FDIC and the NCCOB concerning its activities and financial condition and must obtain regulatory approvals prior to entering into certain transactions, including, but not limited to, mergers with or acquisitions of other financial institutions.
The regulation and supervision of Square 1 Bank establish a comprehensive framework of activities in which an institution can engage and is intended primarily for the protection of depositors and borrowers and, for purposes of the FDIC, the protection of the insurance fund. The regulatory structure also gives the regulatory authorities extensive discretion in connection with their supervisory and enforcement activities and examination policies, including policies with respect to the classification of assets and the establishment of adequate loan loss reserves for regulatory purposes. Any change in such regulatory requirements and policies, whether by the applicable state legislature, the FDIC or Congress, could have a material adverse impact on Square 1 Financial or Square 1 Bank and their operations. Square 1 Bank is a member of the Federal Home Loan Bank of Atlanta. Square 1 Financial is regulated as a bank holding company by the Federal Reserve and the NCCOB.
Certain regulatory requirements applicable to Square 1 Bank and Square 1 Financial are referred to below or elsewhere herein. The description of statutory provisions and regulations applicable to commercial banks and their holding companies set forth below and elsewhere in this document does not purport to be a complete description of such statutes and regulations and their effects on Square 1 Bank and Square 1 Financial and is qualified in its entirety by reference to the actual laws and regulations involved.
State Bank Regulation
Business Activities. The NCCOB regulates Square 1 Bank’s internal organization as well as its deposit, lending and investment activities. The basic authority for Square 1 Bank’s activities is specified by North Carolina law.
The FDIC also regulates many of the areas regulated by the NCCOB and federal law may limit some of the authority provided to Square 1 Bank by North Carolina law. Approval of the NCCOB and the FDIC is required for, among other things, the establishment of branch offices and business combinations.
Branching Activities. Any North Carolina-chartered bank meeting certain requirements may, with the approval of the NCCOB and the FDIC, establish and operate branches anywhere in the state.
Interstate Branching. Federal law authorizes the responsible federal banking agencies to approve merger transactions between banks located in different states, regardless of whether the merger would be prohibited under the law of the two states, unless the state in which the target is located has opted out. Accordingly, a North Carolina bank may acquire branches in a state other than North Carolina unless the other state has enacted legislation opting out. Federal law also authorizes de novo branching into another state if the host state enacts a law expressly permitting out of state banks to establish such branches within its borders.
Regulation of Management. Federal law sets forth circumstances under which officers or directors of a bank or bank holding company may be removed by the institution’s primary federal banking supervisory authority. Federal law also prohibits a management official of a bank or bank holding company from serving as a management official with an unaffiliated bank or bank holding company that has offices within a specified geographic area that is related to the location of the bank’s offices and the asset size of the institutions.
Activities and Investments. Since the enactment of the FDIC Improvement Act of 1991, all state-chartered FDIC insured banks have generally been limited to activities as principal to those authorized for national banks, notwithstanding state law. Additionally, the FDIC Improvement Act limits equity investments by state banks to the types and amounts permitted national banks. Certain exceptions exist. For example, the FDIC is authorized to permit banks to engage in state authorized activities or investments that are impermissible for national banks (other than non-subsidiary equity investments) if the bank meets all applicable capital requirements and it is determined that the activities or investments do not pose a significant risk to the Deposit Insurance Fund.
Capital Requirements. Square 1 Bank is required to comply with the FDIC’s capital adequacy standards for insured banks. The FDIC has issued risk-based capital and leverage capital guidelines for measuring capital adequacy, and all applicable capital standards must be satisfied for Square 1 Bank to be considered in compliance with regulatory capital requirements.
100
Table of Contents
Under the FDIC’s risk-based capital measure, the minimum ratio (“Total Capital Ratio”) of Square 1 Bank’s total capital (“Total Capital”) to its risk-weighted assets (including various off-balance-sheet items, such as standby letters of credit) is 8.0%. At least half of Total Capital must be composed of “Tier 1 Capital.” Tier 1 Capital includes common equity, undivided profits, minority interests in the equity accounts of consolidated subsidiaries, qualifying noncumulative perpetual preferred stock, and a limited amount of cumulative perpetual preferred stock, less goodwill and various other intangible assets. The remainder of Total Capital may consist of “Tier 2 Capital” which includes certain subordinated debt, certain hybrid capital instruments and other qualifying preferred stock, and a limited amount of loan loss reserves. A bank that does not satisfy minimum capital requirements may be required to adopt and implement a plan acceptable to its federal banking regulator to achieve an adequate level of capital.
Under the leverage capital measure, the minimum ratio (“Leverage Capital Ratio”) of Tier 1 Capital to average assets, less goodwill and various other intangible assets, generally is 4.0%. The FDIC’s guidelines also provide that banks experiencing internal growth or making acquisitions will be expected to maintain strong capital positions substantially above the minimum levels without significant reliance on intangible assets, and a bank’s “Tangible Leverage Ratio” (determined by deducting all intangible assets) and other indicators of a bank’s capital strength also are taken into consideration by banking regulators in evaluating proposals for expansion or new activities.
The FDIC also considers interest rate risk (arising when the interest rate sensitivity of Square 1 Bank’s assets does not match the sensitivity of its liabilities or its off-balance-sheet position) in the evaluation of the bank’s capital adequacy. Banks with excessive interest rate risk exposure are required to hold additional amounts of capital against their exposure to losses resulting from that risk. Through the risk-weighting of assets, the regulators also require banks to incorporate market risk components into their risk-based capital. Under these market risk requirements, capital is allocated to support the amount of market risk related to a bank’s lending and trading activities.
Square 1 Bank’s capital categories are determined solely for the purpose of applying the “prompt corrective action” rules described below and they are not necessarily an accurate representation of its overall financial condition or prospects for other purposes. A failure to meet the capital guidelines could subject Square 1 Bank to a variety of enforcement actions under those rules, including the issuance of a capital directive, the termination of deposit insurance by the FDIC, a prohibition on the taking of brokered deposits, and other restrictions on its business. As described below, the FDIC also can impose other substantial restrictions on banks that fail to meet applicable capital requirements
As a bank holding company, Square 1 Financial is subject to capital adequacy guidelines for bank holding companies substantially similar to those of the FDIC for state-chartered savings banks.
New Capital Rule. On July 9, 2013, the federal bank regulatory agencies issued a final rule that will revise their risk-based capital requirements and the method for calculating risk-weighted assets to make them consistent with agreements that were reached by the Basel Committee on Banking Supervision and certain provisions of the Dodd-Frank Act. The final rule applies to all depository institutions, top-tier bank holding companies with total consolidated assets of $500 million or more and top-tier savings and loan holding companies.
The rule establishes a new common equity Tier 1 minimum capital requirement (4.5% of risk-weighted assets), increases the minimum Tier 1 capital to risk-based assets requirement (from 4.0% to 6.0% of risk-weighted assets) and assigns a higher risk weight (150%) to exposures that are more than 90 days past due or are on nonaccrual status and to certain commercial real estate facilities that finance the acquisition, development or construction of real property.
The rule also includes changes in what constitutes regulatory capital, some of which are subject to a two-year transition period. These changes include the phasing-out of certain instruments as qualifying capital. In addition, Tier 2 capital is no longer limited to the amount of Tier 1 capital included in total capital. Mortgage servicing rights, certain deferred tax assets and investments in unconsolidated subsidiaries over designated percentages of common stock will be required to be deducted from capital, subject to a two-year transition period. Finally, Tier 1 capital will include accumulated other comprehensive income (which includes all unrealized gains and losses on available for sale debt and equity securities), subject to a two-year transition period.
The new capital requirements also include changes in the risk-weights of assets to better reflect credit risk and other risk exposures. These include a 150% risk weight (up from 100%) for certain high volatility commercial real estate acquisition, development and construction loans and non-residential mortgage loans that are 90 days past due or otherwise on nonaccrual
101
Table of Contents
status; a 20% (up from 0%) credit conversion factor for the unused portion of a commitment with an original maturity of one year or less that is not unconditionally cancellable; a 250% risk weight (up from 100%) for mortgage servicing rights and deferred tax assets that are not deducted from capital; and increased risk-weights (from 0% to up to 600%) for equity exposures.
Finally, the rule limits capital distributions and certain discretionary bonus payments if the banking organization does not hold a “capital conservation buffer” consisting of 2.5% of common equity Tier 1 capital to risk-weighted assets in addition to the amount necessary to meet its minimum risk-based capital requirements.
The final rule becomes effective on January 1, 2015. The capital conservation buffer requirement will be phased in beginning January 1, 2016, at 0.625% of risk-weighted assets, increasing each year until fully implemented at 2.5% on January 1, 2019.
Prompt Corrective Regulatory Action. Federal law establishes a system of prompt corrective action to resolve the problems of undercapitalized banks. Under this system, the FDIC has established five capital categories (“well capitalized,” “adequately capitalized,” “undercapitalized,” “significantly undercapitalized,” and “critically undercapitalized”) and is required to take various mandatory supervisory actions, and is authorized to take other discretionary actions with respect to banks in the three undercapitalized categories. The severity of any such actions taken will depend upon the capital category in which a bank is placed. Generally, subject to a narrow exception, current federal law requires the FDIC to appoint a receiver or conservator for a bank that is critically undercapitalized.
Under the FDIC’s prompt corrective action rules, a bank that (1) has a Total Capital Ratio of 10.0% or greater, a Tier 1 Capital Ratio of 6.0% or greater, and a Leverage Ratio of 5.0% or greater, and (2) is not subject to any written agreement, order, capital directive, or prompt corrective action directive issued by the FDIC, is considered to be “well capitalized.” A bank with a Total Capital Ratio of 8.0% or greater, a Tier 1 Capital Ratio of 4.0% or greater, and a Leverage Ratio of 4.0% or greater, is considered to be “adequately capitalized.” A bank that has a Total Capital Ratio of less than 8.0%, a Tier 1 Capital Ratio of less than 4.0%, or a Leverage Ratio of less than 4.0%, is considered to be “undercapitalized.” A bank that has a Total Capital Ratio of less than 6.0%, a Tier 1 Capital Ratio of less than 3.0%, or a Leverage Ratio of less than 3.0%, is considered to be “significantly undercapitalized,” and a bank that has a tangible equity capital to assets ratio equal to or less than 2.0% is deemed to be “critically undercapitalized.” For purposes of these rules, the term “tangible equity” includes core capital elements counted as Tier 1 Capital for purposes of the risk-based capital standards, plus the amount of outstanding cumulative perpetual preferred stock (including related surplus), minus all intangible assets (with various exceptions). A bank may be considered to be in a capitalization category lower than indicated by its actual capital position if it receives an unsatisfactory examination rating or is subject to a regulatory action that requires heightened levels of capital.
A bank that becomes “undercapitalized,” “significantly undercapitalized,” or “critically undercapitalized” is required to submit an acceptable capital restoration plan to the FDIC. An “undercapitalized” bank also is generally prohibited from increasing its average total assets, making acquisitions, establishing new branches, or engaging in any new line of business, except in accordance with an accepted capital restoration plan or with the approval of the FDIC. Also, the FDIC may treat an “undercapitalized” bank as being “significantly undercapitalized” if it determines that those actions are necessary to carry out the purpose of the law.
As of December 31, 2013, all of Square 1 Bank’s capital ratios were at levels that would qualify it to be “well capitalized” for regulatory purposes.
Safety and Soundness Guidelines. Federal law requires each federal banking agency to establish safety and soundness standards for institutions under its authority. The federal banking agencies, including the FDIC, have released Interagency Guidelines Establishing Standards for Safety and Soundness. The guidelines specify basic standards for internal controls and information systems, internal audit systems, loan documentation, credit underwriting, interest rate risk exposure and asset growth, asset quality earnings and employee compensation. If the appropriate federal banking agency determines that a depository institution is not in compliance with the safety and soundness guidelines, it may require the institution to submit an acceptable plan to achieve compliance with the guidelines. The institution must submit an acceptable compliance plan within 30 days of receipt of a request for such a plan. Failure to submit or implement a compliance plan may result in regulatory sanctions.
102
Table of Contents
Uniform Lending Standards. Under the FDIC’s regulations, state banks must adopt and maintain written policies that establish appropriate limits and standards for loans that are secured by interests in real estate or are made for the purpose of financing permanent improvements to real estate. The policies must establish loan portfolio diversification standards, prudent underwriting standards, including loan-to-value limits that are clear and measurable, loan administration procedures and documentation and loan approval and reporting requirements. Such real estate lending policies must reflect the Interagency Guidelines for Real Estate Lending Policies that have been adopted by the federal banking agencies.
Limits on Loans to One Borrower. Square 1 Bank is subject to North Carolina law with respect to limits on loans to one borrower. Generally, the maximum amount that a bank can lend to a single borrower under North Carolina law is 15% of capital and surplus and up to an additional 10% if the excess is fully secured by specified readily marketable collateral having a market value at least equal to the amount of the loan outstanding.
Restrictions on Transactions with Affiliates. Square 1 Bank is subject to the provisions of Sections 23A and 23B of the Federal Reserve Act which restrict a bank’s ability to enter into certain types of transactions with its “affiliates,” including its parent holding company or any subsidiaries of its parent company. Among other things, Section 23A limits on the amount of:
| • | a bank’s loans or extensions of credit to, or investment in, its affiliates; |
| • | assets a bank may purchase from affiliates, except for real and personal property exempted by the Federal Reserve; |
| • | the amount of loans or extensions of credit by a bank to third parties which are collateralized by the securities or obligations of the bank’s affiliates; and |
| • | a bank’s guarantee, acceptance or letter of credit issued on behalf of one of its affiliates. |
Transactions of the type described above are limited in amount, as to any one affiliate, to 10 percent of a bank’s capital and surplus and, as to all affiliates combined, to 20% of a bank’s capital and surplus. In addition to the amount limitations, each of the above transactions must also meet specified collateral requirements. Square 1 Bank also must comply with other provisions designed to avoid the taking of low-quality assets from an affiliate.
Section 23B, among other things, prohibits a bank or its subsidiaries generally from engaging in transactions with its affiliates unless the transactions are on terms substantially the same, or at least as favorable to the bank or its subsidiaries, as those prevailing at the time for comparable transactions with nonaffiliated companies.
Federal law also places restrictions on Square 1 Bank’s ability to extend credit to its executive officers, directors, principal shareholders and their related interests. These extensions of credit:
| • | must be made on substantially the same terms, including interest rates and collateral, as those prevailing at the time for comparable transactions with unrelated third parties; and |
| • | must not involve more than the normal risk of repayment or present other unfavorable features. |
State banks also are subject to the federal restrictions on loans to executive officers, directors and greater than 10% shareholders (collectively, “insiders”). Generally, loans to insiders and certain related interests must be approved in advance by a majority of the board of directors of the institution, with any “interested” director not participating in the voting, if the loan exceeds the greater of $25,000 or 5% of the institution’s capital. Loans aggregating $500,000 are subject to the approval requirements in all cases. Loans to insiders must be made on terms substantially the same as offered in comparable transactions to outside parties and that do not present more than the normal risk of loss or present any other unfavorable features. There is an exception for extensions of credit made to officers and directors as part of a bank-wide compensation or benefit program that does not favor directors or officers over other employees. There are further restrictions on loans that can be made to executive officers.
Dividend Restrictions. Under North Carolina law, Square 1 Bank may pay dividends only from its undivided profits. However, if Square 1 Bank’s surplus is less than 50% of its paid-in capital stock, then its directors may not declare any cash dividend until Square 1 Bank has transferred from undivided profits to surplus 25% of its undivided profits or any lesser percentage necessary to raise its surplus to an amount equal to 50% of its paid-in capital stock. However, effective October 1, 2012, recently-passed amendments to the North Carolina Banking Code became effective. Under Section 53-4-7 of the revised Banking Code, North Carolina-chartered banks are permitted to pay dividends under state law so long as they maintain regulatory capital ratios sufficient to be considered “adequately capitalized” for regulatory purposes.
103
Table of Contents
In addition to the restrictions described above, other state and federal statutory and regulatory restrictions apply to Square 1 Bank’s payment of cash dividends. As an insured depository institution, federal law prohibits Square 1 Bank from making any capital distributions, including the payment of a cash dividend if it is “undercapitalized” (as that term is defined in the Federal Deposit Insurance Act), or after making the distribution would become undercapitalized. If the FDIC believes that Square 1 Bank is engaged in, or about to engage in, an unsafe or unsound practice, the FDIC may require, after notice and hearing, that the bank cease and desist from that practice. The FDIC has indicated that paying dividends that deplete a depository institution’s capital base to an inadequate level would be an unsafe and unsound banking practice. The FDIC has issued policy statements that provide that insured banks generally should pay dividends only from their current operating earnings, and, under the Federal Deposit Insurance Act, no dividend may be paid by an insured bank while it is in default on any assessment due the FDIC. Square 1 Bank’s payment of dividends also could be affected or limited by other factors, such as events or circumstances which lead the FDIC to require (as further described below) that it maintain capital in excess of regulatory guidelines.
In the future, Square 1 Bank’s ability to declare and pay cash dividends will be subject to its Board of Directors’ evaluation of Square 1 Bank’s operating results, capital levels, financial condition, future growth plans, general business and economic conditions, and tax and other relevant considerations.
Enforcement. The NCCOB has extensive enforcement authority over North Carolina banks. Such authority includes the ability to issue cease and desist orders, civil money penalties and to remove directors or officers. The NCCOB may also take possession of a North Carolina bank whose capital is impaired and seek to have a receiver appointed by a court.
The FDIC has primary federal enforcement responsibility over state banks under its jurisdiction, including the authority to bring enforcement action against all “institution-related parties,” including shareholders, and any attorneys, appraisers and accountants who knowingly or recklessly participate in wrongful action likely to have an adverse effect on an institution. Formal enforcement action may range from the issuance of a capital directive or cease and desist order to removal of officers and/or directors, receivership, conservatorship or termination of deposit insurance. Civil money penalties cover a wide range of violations and actions, and range up to $25,000 per day or even up to $1 million per day (in the most egregious cases). Criminal penalties for most financial institution crimes include fines of up to $1 million and imprisonment for up to 30 years.
Community Reinvestment Act. Under the Community Reinvestment Act, as implemented by FDIC regulations, a bank has a continuing and affirmative obligation, consistent with its safe and sound operation, to help meet the credit needs of its entire community, including low and moderate income neighborhoods. The Community Reinvestment Act does not establish specific lending requirements or programs for financial institutions, nor does it limit an institution’s discretion to develop the types of products and services that it believes are best suited to its particular community. The Community Reinvestment Act requires the FDIC, in connection with its examination of a bank, to assess the institution’s record of meeting the credit needs of its community and to take the record into account in its evaluation of certain applications by the institution. The Community Reinvestment Act also requires all institutions to make public disclosure of their Community Reinvestment Act ratings. Square 1 Bank is designated as a wholesale bank by the FDIC for purposes of the Community Reinvestment Act.
North Carolina Assessments. North Carolina banks are required to pay annual assessments to the NCCOB office to cover the cost of regulating North Carolina institutions. By law, current assessments are $6,000 on the first $50.0 million of assets; on assets over $50.0 million but less than $25.0 million, $12.00 per $100,000; on assets over $250.0 million but less than $500.0 million, $9.00 per $100,000; on assets over $500.0 million but less than $1.0 billion, $7.00 per $100,000; and on assets over $1.0 billion but less than $10.0 billion, $5.00 per $100,000.
Federal Deposit Insurance and Assessments. Square 1 Bank’s deposits are insured by the FDIC to the full extent provided in the Federal Deposit Insurance Corporation Act, and Square 1 Bank pays assessments to the FDIC for that insurance coverage. The Dodd-Frank Act established a permanent $250,000 limit for federal deposit insurance coverage. The FDIC may terminate Square 1 Bank’s deposit insurance if it finds that the bank has engaged in unsafe and unsound practices, is in an unsafe or unsound condition to continue operations, or has violated applicable laws, regulations, rules or orders.
Under the Federal Deposit Insurance Act, the FDIC uses a revised risk-based assessment system to determine the amount of Square 1 Bank’s deposit insurance assessment based on an evaluation of the probability that the Deposit Insurance Fund will incur a loss with respect to the bank. That evaluation takes into consideration risks attributable to different categories and concentrations of Square 1 Bank’s assets and liabilities and any other factors the FDIC considers to be relevant, including information obtained from the Commissioner. A higher assessment rate results in an increase in the assessments Square 1 Bank pays to the FDIC for deposit insurance.
104
Table of Contents
The FDIC is responsible for maintaining the adequacy of the Deposit Insurance Fund, and the amount Square 1 Bank pays for deposit insurance is influenced not only by the assessment of the risk it poses to the Deposit Insurance Fund, but also by the adequacy of the insurance fund at any time to cover the risk posed by all insured institutions. Because the Deposit Insurance Fund reserve ratio had fallen below the minimum level required by law, during 2008 the FDIC adopted a restoration plan to return the reserve ratio to the minimum level and, during 2009, it imposed a special assessment on insured institutions, increased regular assessment rates, and required that insured institutions prepay their regular quarterly assessments through 2012. More recently, as required by the Dodd-Frank Act, the FDIC has increased the minimum Deposit Insurance Fund reserve ratio to 1.35% which might be achieved by September 30, 2020. Although the Dodd-Frank Act requires the FDIC to offset the effect of the higher minimum ratio on insured depository institutions with assets of less than $10 billion, FDIC insurance assessments could be increased substantially in the future if the FDIC finds such an increase to be necessary in order to adequately maintain the insurance fund.
Change in Bank Control Act. The acquisition of 10% or more of the common stock outstanding of a depository institution may trigger the provisions of the Change in Bank Control Act. The FDIC has also adopted a regulation under the Change in Bank Control Act that generally requires persons who at any time intend to acquire control of a nonmember commercial bank, such as Square 1 Bank, to provide 60 days prior written notice and certain financial and other information to the FDIC.
The 60-day notice period does not commence until the information is deemed to be substantially complete. “Control” for the purpose of the Change in Bank Control Act exists in situations in which the acquiring party has voting control of at least 25% of any class of Square 1 Financial’s voting stock or the power to direct the management or policies of Square 1 Financial. However, under FDIC regulations, control is presumed to exist where the acquiring party has voting control of at least 10% of any class of Square 1 Financial voting securities if specified “control factors” are present. The statute and underlying regulations authorize the FDIC to disapprove a proposed acquisition on certain specified grounds.
Federal Reserve System. The Federal Reserve regulations require depository institutions to maintain noninterest-earning reserves against their transaction accounts (primarily NOW and regular checking accounts). The Federal Reserve regulations generally require that Square 1 Bank maintain average daily reserves equal to 3% on aggregate transaction accounts of up to $89.0 million, plus 10% on the remainder. The first $13.3 million of transaction accounts are exempt. This percentage is subject to adjustment by the Federal Reserve. Because required reserves must be maintained in the form of vault cash or in a noninterest-bearing account at a Federal Reserve Bank, the effect of the reserve requirement is to reduce the amount of the institution’s interest-earning assets. Square 1 Bank is in compliance with these requirements.
Federal Home Loan Bank System. Square 1 Bank is a member of the Federal Home Loan Bank System, which consists of 12 regional Federal Home Loan Banks. The Federal Home Loan Bank provides a central credit facility primarily for member institutions. Members of the Federal Home Loan Bank are required to acquire and hold shares of capital stock in the Federal Home Loan Bank. Square 1 Bank was in compliance with this requirement with an investment in stock of the Federal Home Loan Bank of Atlanta at December 31, 2013 of $2.2 million.
The Federal Home Loan Banks are required to provide funds for certain purposes including the resolution of insolvent thrifts in the late 1980s and to contributing funds for affordable housing programs. These requirements could reduce the amount of dividends that the Federal Home Loan Banks pay to their members and result in the Federal Home Loan Banks imposing a higher rate of interest on advances to their members. If dividends were reduced, or interest on future Federal Home Loan Bank advances increased, a member bank affected by such reduction or increase would likely experience a reduction in its net interest income. There can be no assurance that such dividends will continue in the future. Further, there can be no assurance that the impact of recent or future legislation on the Federal Home Loan Banks also will not cause a decrease in the value of the Federal Home Loan Bank stock held by Square 1 Bank.
Holding Company Regulation
Square 1 Financial is subject to examination, regulation, and periodic reporting under the Bank Holding Company Act of 1956, as amended, as administered by the Federal Reserve. Prior Federal Reserve approval would be required for Square 1 Financial to: (i) acquire direct or indirect ownership or control of any voting shares of any bank if, after the acquisition, the bank holding company will directly or indirectly own or control more than 5 percent of the bank’s voting shares; (ii) acquire all or substantially all of the assets of any bank; or (iii) merge or consolidate with any other bank holding company. In
105
Table of Contents
addition to the approval of the Federal Reserve, prior approval may also be necessary from other agencies having supervisory jurisdiction over the bank to be acquired before any bank acquisition can be completed.
A bank holding company is generally prohibited from engaging in nonbanking activities, or acquiring direct or indirect control of more than 5% of the voting securities of any company engaged in nonbanking activities. One of the principal exceptions to this prohibition is for activities found by the Federal Reserve to be so closely related to banking or managing or controlling banks as to be a proper incident thereto. Some of the principal activities that the Federal Reserve has determined by regulation to be so closely related to banking are: (i) making or servicing loans; (ii) performing certain data processing services; (iii) providing discount brokerage services; (iv) acting as fiduciary, investment or financial advisor; (v) leasing personal or real property; (vi) making investments in corporations or projects designed primarily to promote community welfare; and (vii) acquiring a savings and loan association whose direct and indirect activities are limited to those permitted for bank holding companies.
The Gramm-Leach-Bliley Act of 1999 authorizes a bank holding company that meets specified conditions, including being “well capitalized” and “well managed,” to opt to become a “financial holding company” and thereby engage in a broader array of financial activities than previously permitted. Such activities can include insurance underwriting and investment banking.
Square 1 Financial is subject to the Federal Reserve’s capital adequacy guidelines for bank holding companies (on a consolidated basis) substantially similar to those of the FDIC for Square 1 Bank.
A bank holding company is generally required to give the Federal Reserve prior written notice of any purchase or redemption of then outstanding equity securities if the gross consideration for the purchase or redemption, when combined with the net consideration paid for all such purchases or redemptions during the preceding 12 months, is equal to 10% or more of the company’s consolidated net worth. The Federal Reserve may disapprove such a purchase or redemption if it determines that the proposal would constitute an unsafe and unsound practice, or would violate any law, regulation, Federal Reserve order or directive, or any condition imposed by, or written agreement with, the Federal Reserve. The Federal Reserve has adopted an exception to this approval requirement for well-capitalized bank holding companies that meet certain other conditions.
The Federal Reserve has issued a policy statement regarding the payment of dividends by bank holding companies. In general, the Federal Reserve’s policies provide that dividends should be paid only out of current earnings and only if the prospective rate of earnings retention by the bank holding company appears consistent with the organization’s capital needs, asset quality and overall financial condition. The Federal Reserve’s policies also require that a bank holding company serve as a source of financial strength to its subsidiary banks by standing ready to use available resources to provide adequate capital funds to those banks during periods of financial stress or adversity and by maintaining the financial flexibility and capital-raising capacity to obtain additional resources for assisting its subsidiary banks where necessary. Under the prompt corrective action laws, the ability of a bank holding company to pay dividends may be restricted if a subsidiary bank becomes undercapitalized. These regulatory policies could affect the ability of Square 1 Financial to pay dividends or otherwise engage in capital distributions.
Under the Federal Deposit Insurance Act, depository institutions are liable to the FDIC for losses suffered or anticipated by the FDIC in connection with the default of a commonly controlled depository institution or any assistance provided by the FDIC to such an institution in danger of default.
The status of Square 1 Financial as a registered bank holding company under the Bank Holding Company Act will not exempt them from certain federal and state laws and regulations applicable to corporations generally, including, without limitation, certain provisions of the federal securities laws.
Square 1 Financial and Square 1 Bank will be affected by the monetary and fiscal policies of various agencies of the United States Government, including the Federal Reserve System. In view of changing conditions in the national economy and in the money markets, it is impossible for management to accurately predict future changes in monetary policy or the effect of such changes on the business or financial condition of Square 1 Financial or Square 1 Bank.
106
Table of Contents
Dodd-Frank Act
On July 21, 2010, the Dodd-Frank Wall Street Reform and Consumer Protection Act of 2010, or the Dodd-Frank Act, was enacted. The Dodd-Frank Act aims to restore responsibility and accountability to the financial system by significantly altering the regulation of financial institutions and the financial services industry. Full implementation of the Dodd-Frank Act will require many new rules to be issued by federal regulatory agencies over the next several years, which will profoundly affect how financial institutions will be regulated in the future. The ultimate effect of the Dodd-Frank Act and its implementing regulations on the financial services industry in general, and on us in particular, is uncertain at this time.
The Dodd-Frank Act, among other things:
| • | establishes the Consumer Financial Protection Bureau, an independent organization within the Federal Reserve with centralized responsibility for promulgating and enforcing federal consumer protection laws applicable to all entities offering consumer financial products or services; |
| • | establishes the Financial Stability Oversight Council, tasked with the authority to identify and monitor institutions and systems that pose a systemic risk to the financial system; |
| • | changes the assessment base for federal deposit insurance from the amount of insured deposits held by the depository institution to the institution’s average total consolidated assets less tangible equity; |
| • | increases the minimum reserve ratio for the Deposit Insurance Fund from 1.15% to 1.35%; |
| • | permanently increases the deposit insurance coverage amount from $100,000 to $250,000; |
| • | requires the FDIC to make its capital requirements for insured depository institutions countercyclical, so that capital requirements increase in times of economic expansion and decrease in times of economic contraction; |
| • | requires bank holding companies and banks to be “well capitalized” and “well managed” in order to acquire banks located outside of their home state and requires any bank holding company electing to be treated as a financial holding company to be “well capitalized” and “well managed”; |
| • | directs the Federal Reserve to establish interchange fees for debit cards under a restrictive “reasonable and proportional cost” per transaction standard; |
| • | limits the ability of banking organizations to sponsor or invest in private equity and hedge funds and to engage in proprietary trading; |
| • | increases regulation of consumer protections regarding mortgage originations, including originator compensation, minimum repayment standards, and prepayment consideration; |
| • | restricts the preemption of select state laws by federal banking law applicable to national banks and disallow subsidiaries and affiliates of national banks from availing themselves of such preemption; |
| • | authorizes national and state banks to establish de novo branches in any state that would permit a bank chartered in that state to open a branch at that location; and |
| • | repeals the federal prohibition on the payment of interest on demand deposits, thereby permitting depository institutions to pay interest on business transaction and other accounts. |
Some of these provisions may have the consequence of increasing our expenses, decreasing our revenues, and changing the activities in which we choose to engage. The environment in which banking organizations will operate after the financial crisis, including legislative and regulatory changes affecting capital, liquidity, supervision, permissible activities, corporate governance and compensation, changes in fiscal policy and steps to eliminate government support for banking organizations, may have long-term effects on the business model and profitability of banking organizations that cannot now be foreseen. The specific impact on our current activities or new financial activities we may consider in the future, our financial performance and the market in which we operate will depend on the manner in which the relevant agencies develop and implement the required rules and the reaction of market participants to these regulatory developments. Many aspects of the Dodd-Frank Act are subject to further rulemaking and will take effect over several years. While we cannot predict what effect any presently contemplated or future changes in the laws or regulations or their interpretations would have on us, these changes could be materially adverse to our investors.
107
Table of Contents
Source of Strength Doctrine for Bank Holding Companies
Under longstanding Federal Reserve policy which has been codified by the Dodd-Frank Act, we are expected to act as a source of financial strength to, and to commit resources to support, Square 1 Bank. This support may be required at times when we may not be inclined to provide it. In addition, any capital loans that we make to Square 1 Bank are subordinate in right of payment to deposits and to certain other indebtedness of Square 1 Bank. In the event of our bankruptcy, any commitment by us to a federal bank regulatory agency to maintain the capital of Square 1 Bank will be assumed by the bankruptcy trustee and entitled to a priority of payment.
Incentive Compensation Guidance
The federal banking agencies have issued comprehensive guidance on incentive compensation policies intended to ensure that the incentive compensation policies of banking organizations do not undermine the safety and soundness of those organizations by encouraging excessive risk-taking. The incentive compensation guidance sets expectations for banking organizations concerning their incentive compensation arrangements and related risk-management, control and governance processes. The incentive compensation guidance, which covers all employees that have the ability to materially affect the risk profile of an organization, either individually or as part of a group, is based upon three primary principles: (1) balanced risk-taking incentives, (2) compatibility with effective controls and risk management, and (3) strong corporate governance. Any deficiencies in compensation practices that are identified may be incorporated into the organization’s supervisory ratings, which can affect its ability to make acquisitions or take other actions. In addition, under the incentive compensation guidance, a banking organization’s federal supervisor may initiate enforcement action if the organization’s incentive compensation arrangements pose a risk to the safety and soundness of the organization.
The Volcker Rule
Under provisions of the Dodd-Frank Act referred to as the “Volcker Rule” certain limitations are placed on the ability of bank holding companies and their affiliates to engage in sponsoring, investing in and transacting with certain investment funds, including hedge funds and private equity funds (collectively “covered funds”). The Volcker Rule also places restrictions on proprietary trading, which could impact certain hedging activities. The Volcker Rule becomes fully effective in July 2015. The Volcker Rule is not expected to have a material impact on us.
Future Legislation and Regulatory Reform
New regulations and statutes are regularly proposed that contain wide-ranging proposals for altering the structures, regulations and competitive relationships of financial institutions operating in the United States. We cannot predict whether or in what form any proposed regulation or statute will be adopted or the extent to which our business may be affected by any new regulation or statute. Future legislation and policies, and the effects of that legislation and those policies, may have a significant influence on our business, activities and growth and the overall growth and distribution of loans, investments and deposits. Such legislation and policies have had a significant effect on the operating results of commercial banks in the past and are expected to continue.
108
Table of Contents
CERTAIN MATERIAL U.S. FEDERAL INCOME TAX CONSEQUENCES
FOR NON-U.S. HOLDERS OF COMMON STOCK
The following is a summary of certain material United States federal income tax consequences relevant to non-U.S. holders, as defined below, of the purchase, ownership and disposition of our common stock. The following summary is based on current provisions of the Internal Revenue Code of 1986, as amended, Treasury regulations and judicial and administrative authority, all of which are subject to change, possibly with retroactive effect. This section does not consider state, local, estate or foreign tax consequences, nor does it address tax consequences to special classes of investors including, but not limited to, tax-exempt organizations, insurance companies, banks or other financial institutions, partnerships or other entities classified as partnerships for United States federal income tax purposes, dealers in securities, persons liable for the alternative minimum tax, traders in securities that elect to use a mark-to-market method of accounting for their securities holdings, persons who have acquired our common stock as compensation or otherwise in connection with the performance of services, or persons that will hold our common stock as a position in a hedging transaction, “straddle,” “conversion transaction” or other risk reduction transaction. Tax consequences may vary depending upon the particular status of an investor. The summary is limited to non-U.S. holders who will hold our common stock as “capital assets” (generally, property held for investment). Each potential investor should consult its own tax advisor as to the United States federal, state, local, foreign and any other tax consequences of the purchase, ownership and disposition of our common stock.
You are a non-U.S. holder if you are a beneficial owner of our common stock for United States federal income tax purposes that is (1) a nonresident alien individual; (2) a corporation (or other entity that is taxable as a corporation) not created or organized in the United States or under the laws of the United States or of any State (or the District of Columbia); (3) an estate whose income falls outside of the federal income tax jurisdiction of the United States, regardless of the source of such income; or (4) a trust that is not subject to United States federal income tax on a net income basis on income or gain from our shares.
If an entity or arrangement treated as a partnership for United States federal income tax purposes holds our common stock, the tax treatment of a partner in the partnership will generally depend upon the status of the partner and the activities of the partnership. If you are treated as a partner in such an entity holding our common stock, you should consult your tax advisor as to the United States federal income tax consequences applicable to you.
Distributions
Distributions with respect to our common stock will be treated as dividends when paid to the extent of our current or accumulated earnings and profits as determined for United States federal income tax purposes. Except as described below, if you are a non-U.S. holder of our shares, dividends paid to you are subject to withholding of United States federal income tax at a 30% rate or at a lower rate if you are eligible for the benefits of an income tax treaty that provides for a lower rate. Even if you are eligible for a lower treaty rate, we and other payors will generally be required to withhold at a 30% rate (rather than the lower treaty rate) on dividends paid to you, unless you have furnished to us or another payor:
| • | A valid Internal Revenue Service Form W-8BEN or an acceptable substitute form upon which you certify, under penalties of perjury, your status as a non-United States person and your entitlement to the lower treaty rate with respect to such payments, or; |
| • | In the case of payments made outside the United States to an offshore account (generally, an account maintained by you at an office or branch of a bank or other financial institution at any location outside the United States), other documentary evidence establishing your entitlement to the lower treaty rate in accordance with United States Treasury regulations. |
If you are eligible for a reduced rate of U.S. withholding tax under a tax treaty, you may obtain a refund of any amounts withheld in excess of that rate by timely filing a refund claim with the Internal Revenue Service.
109
Table of Contents
If dividends paid to you are “effectively connected” with your conduct of a trade or business within the United States, and, if required by a tax treaty, the dividends are attributable to a permanent establishment that you maintain in the United States, we and other payors generally are not required to withhold tax from the dividends, provided that you have furnished to us or another payor a valid Internal Revenue Service Form W-8ECI or an acceptable substitute form upon which you represent, under penalties of perjury, that:
| • | You are a non-United States person, and; |
| • | The dividends are effectively connected with your conduct of a trade or business within the United States and are includible in your gross income. |
“Effectively connected” dividends are taxed at rates applicable to United States citizens, resident aliens and domestic United States corporations. If you are a corporate non-U.S. holder, “effectively connected” dividends that you receive may, under certain circumstances, be subject to an additional “branch profits tax” at a 30% rate or at a lower rate if you are eligible for the benefits of an income tax treaty that provides for a lower rate.
Sale or Redemption
If you are a non-U.S. holder, you generally will not be subject to United States federal income or withholding tax on gain realized on the sale, exchange or other disposition of our common stock unless (i) you are an individual, you hold our shares as a capital asset, you are present in the United States for 183 or more days in the taxable year of the sale and certain other conditions exist, or (ii) the gain is “effectively connected” with your conduct of a trade or business in the United States, and the gain is attributable to a permanent establishment that you maintain in the United States, if that is required by an applicable income tax treaty as a condition to subjecting you to United States taxation on a net income basis.
Information Reporting and Backup Withholding
Payment of dividends, and the tax withheld on those payments, are subject to information reporting requirements. These information reporting requirements apply regardless of whether withholding was reduced or eliminated by an applicable income tax treaty. Under the provisions of an applicable income tax treaty or agreement, copies of the information returns reporting such dividends and withholding may also be made available to the tax authorities in the country in which the non-U.S. holder resides. U.S. backup withholding will generally apply on payment of dividends to non-U.S. holders unless such non-U.S. holders furnish to the payor a Form W-8BEN (or other applicable form), or otherwise establish an exemption and the payor does not have actual knowledge or reason to know that the holder is a U.S. person, as defined under the Code, that is not an exempt recipient.
Payment of the proceeds of a sale of our common stock within the United States or conducted through certain U.S.-related financial intermediaries is subject to information reporting and, depending on the circumstances, backup withholding, unless the non-U.S. holder, or beneficial owner thereof, as applicable, certifies that it is a non-U.S. holder on Form W-8BEN (or other applicable form), or otherwise establishes an exemption and the payor does not have actual knowledge or reason to know the holder is a U.S. person, as defined under the Internal Revenue Code, that is not an exempt recipient.
Any amount withheld under the backup withholding rules from a payment to a non-U.S. holder is allowable as a credit against the non-U.S. holder’s United States federal income tax, which may entitle the non-U.S. holder to a refund, provided that the non-U.S. holder timely provides the required information to the Internal Revenue Service. Moreover, certain penalties may be imposed by the Internal Revenue Service on a non-U.S. holder who is required to furnish information but does not do so in the proper manner. Non-U.S. holders should consult their tax advisors regarding the application of backup withholding in their particular circumstances and the availability of and procedure for obtaining an exemption from backup withholding under current Treasury regulations.
Legislation Relating to Foreign Accounts
Under current legislation, certain payments made after December 31, 2012 to certain foreign financial institutions, investment funds and other non-United States persons that fail to comply with information reporting requirements in respect of their direct and indirect U.S. shareholders will be subject to withholding at a rate of 30%. These payments would include dividends and the gross proceeds from the sale or other disposition of our shares. However, under current Treasury
110
Table of Contents
regulations, withholding would only apply to payments of dividends made on or after January 1, 2014, and to payments of gross proceeds from a sale or other disposition of our shares made on or after January 1, 2017.
Non-U.S. holders are encouraged to consult with their tax advisors regarding the possible implications of the legislation on their investment in our common stock.
We and the selling shareholders are offering the shares of our common stock described in this prospectus in an underwritten offering in which we, the selling shareholders and Sandler O’Neill & Partners, L.P., as representative of the underwriters for the offering, will enter into an underwriting agreement with respect to the common stock being offered. Subject to the terms and conditions contained in the underwriting agreement, the underwriters named below have agreed, severally and not jointly, to purchase the respective number of shares of our common stock set forth opposite their respective names below:
| Underwriter |
Number of Shares | |||
| Sandler O’Neill & Partners, L.P. |
[·] | |||
| Keefe, Bruyette & Woods, Inc. |
[·] | |||
|
|
|
|||
| Total |
[·] | |||
|
|
|
|||
The underwriting agreement provides that the underwriters’ obligation to purchase shares of our common stock depends on the satisfaction of the conditions contained in the underwriting agreement, including:
| • | the representations and warranties made by us are true and agreements have been performed; |
| • | there is no material adverse change in their determination in the financial markets or in our business; and |
| • | we deliver customary closing documents. |
Subject to these conditions, the underwriters are committed to purchase and pay for all of the shares of our common stock offered by this prospectus, if any such shares are purchased. However, the underwriters are not obligated to take or pay for the shares of our common stock covered by the underwriters’ purchase option described below, unless and until that option is exercised. The underwriting agreement also provides that if an underwriter defaults, the purchase commitments of nondefaulting underwriters may be increased or the offering may be terminated.
Purchase Option
We have granted the underwriters an option, exercisable no later than 30 days after the date of the underwriting agreement, to purchase up to an aggregate of 468,750 additional shares of common stock at the initial public offering price, less the underwriting discounts and commissions set forth on the cover page of this prospectus. In addition, the selling shareholders have granted the underwriters an option, exercisable no later than 30 days after the date of the underwriting agreement, to purchase up to an aggregate of 413,417 additional shares of common stock at the public offering price, less the underwriting discounts and commissions set forth on the cover page of this prospectus. We and the selling shareholders will be obligated to sell these shares of common stock to the underwriters to the extent the purchase option is exercised.
Commission and Discounts
The underwriters propose to offer our common stock directly to the public at the offering price set forth on the cover page of this prospectus and to dealers at the public offering price less a concession not in excess of $[·] per share. After the public offering of our common stock, the underwriters may change the offering price, concessions and other selling terms. The underwriters reserve the right to reject an order for the purchase of shares, in whole or in part.
111
Table of Contents
The following table shows the per share and total underwriting discounts and commissions that we will pay to the underwriters and the proceeds we will receive before expenses. These amounts are shown assuming both no exercise and full exercise of the underwriters’ purchase option.
| Per Share | No Exercise | Full Exercise | ||||||||||
| Assumed initial public offering price |
$ | [ | ·] | [ | ·] | [ | ·] | |||||
| Underwriting discount to be paid by: |
||||||||||||
| Us |
$ | [ | ·] | [ | ·] | [ | ·] | |||||
| The selling shareholders |
$ | [ | ·] | [ | ·] | [ | ·] | |||||
| Proceeds to us, before expenses |
$ | [ | ·] | [ | ·] | [ | ·] | |||||
| Proceeds to the selling shareholders, before expenses |
$ | [ | ·] | [ | ·] | [ | ·] | |||||
In addition to the underwriting discount, we will reimburse the underwriters for certain reasonable out-of-pocket expenses up to $300,000 incurred in connection with their engagement as underwriters, regardless of whether this offering is consummated, including, without limitation, legal fees and expenses, marketing, syndication and travel expenses. We estimate that the total expenses of this offering, exclusive of the underwriting discounts and commissions, will be approximately $1.1 million, and are payable by us.
Offering Price Determination
Prior to this offering, there has been no public market for our common stock. The initial public offering price will be negotiated between the representative, the selling shareholders and us. In determining the initial public offering price of our common stock, the representative will consider:
| • | the history and prospects for the industry in which we compete; |
| • | our financial information; |
| • | our earnings prospects; |
| • | our book value; |
| • | the prevailing securities markets at the time of this offering; and |
| • | the recent market prices of and the demand for publicly traded stock of comparable companies. |
Indemnification
We and the selling shareholders have agreed to indemnify the underwriters, and persons who control the underwriters, against certain liabilities, including liabilities under the Securities Act, and to contribute to payments that the underwriters may be required to make in respect of these liabilities.
Lock-Up Agreements
Our directors and executive officers, those persons participating in the directed share program and shareholders who have registration rights as described below have entered into lock-up agreements with the underwriters. Under these agreements, for a period of 180 days after the date of the underwriting agreement, we and each of these persons may not, without the prior written approval of the underwriters, subject to limited exceptions,
| • | offer, pledge, sell, contract to sell, sell any option or contract to purchase, purchase any option or contract to sell, grant any option, right or warrant for the sale of, or otherwise dispose of or transfer any of our common stock or any securities convertible into or exchangeable or exercisable for our common stock, whether now owned or hereafter acquired or with respect to which such person has or hereafter acquires the power of disposition, or file any registration statement under the Securities Act, with respect to any of the foregoing; or |
| • | enter into any swap or any other agreement or any transaction that transfers, in whole or in part, directly or indirectly, the economic consequence of ownership of our common stock, whether any such swap or transaction is to be settled by delivery of our common stock or other securities, in cash or otherwise. |
112
Table of Contents
Directed Share Program
The underwriters have reserved out of the shares of common stock being offered by this prospectus 125,000 shares for sale at the initial public offering price to our directors, senior officers and certain other persons identified by us who have expressed an interest in purchasing our common stock in the offering. The number of shares available for sale to the general public in the offering will be reduced to the extent these persons purchase the reserved shares. Any reserved shares not so purchased will be offered by the underwriters to the general public on the same terms as the other shares. Any shares sold in the directed share program to directors and officers will be subject to the 180-day lock-up agreements described above.
However, because these indications of interest are not binding agreements or commitments to purchase, the underwriters may determine to sell more, less or no shares in this offering to these persons, or these persons may determine to purchase more, less or no shares in this offering.
Stabilization
In connection with this offering, the underwriters may, but are not obligated to, engage in stabilizing transactions, overallotment transactions, syndicate covering transactions and penalty bids.
| • | Stabilizing transactions permit bids to purchase shares of common stock so long as the stabilizing bids do not exceed a specified maximum, and are engaged in for the purpose of preventing or mitigating a decline in the market price of the common stock while the offering is in progress. |
| • | Over-allotment transactions involve sales by the underwriters of shares of common stock in excess of the number of shares the underwriters are obligated to purchase. This creates a syndicate short position that may be either a covered short position or a naked short position. In a covered short position, the number of shares of common stock over-allotted by the underwriters is not greater than the number of shares that they may purchase in the overallotment option. In a naked short position, the number of shares involved is greater than the number of shares in the over-allotment option. The underwriters may close out any short position by exercising their over-allotment option and/or purchasing shares in the open market. |
| • | Syndicate covering transactions involve purchases of common stock in the open market after the distribution has been completed in order to cover syndicate short positions. In determining the source of shares to close out the short position, the underwriters will consider, among other things, the price of shares available for purchase in the open market as compared with the price at which they may purchase shares through exercise of the over-allotment option. If the underwriters sell more shares than could be covered by exercise of the over-allotment option and, therefore, have a naked short position, the position can be closed out only by buying shares in the open market. A naked short position is more likely to be created if the underwriters are concerned that after pricing there could be downward pressure on the price of the shares in the open market that could adversely affect investors who purchase in the offering. |
| • | Penalty bids permit the underwriters to reclaim a selling concession from a syndicate member when the common stock originally sold by that syndicate member is purchased in stabilizing or syndicate covering transactions to cover syndicate short positions. |
These stabilizing transactions, syndicate covering transactions and penalty bids may have the effect of raising or maintaining the market price of our common stock or preventing or mitigating a decline in the market price of our common stock. As a result, the price of our common stock in the open market may be higher than it would otherwise be in the absence of these transactions. Neither we nor the underwriters make any representation or prediction as to the effect that the transactions described above may have on the price of our common stock. These transactions may be effected on the Nasdaq Global Market, in the over-the-counter market or otherwise and, if commenced, may be discontinued at any time.
Electronic Distribution
This prospectus may be made available in electronic format on websites or through other online services maintained by one or more of the underwriters, or by their affiliates.
113
Table of Contents
Other than this prospectus in electronic format, information on such websites and any information contained in any other website maintained by the underwriters or any of their affiliates is not part of this prospectus or registration statement of which the prospectus forms a part, has not been approved or endorsed by us or the underwriters in their capacities as underwriters and should not be relied on by investors.
Our Relationship with the Underwriters
Certain of the underwriters and/or their affiliates have engaged, and may in the future engage, in investment banking transactions with us in the ordinary course of their business. They have received, and expect to receive, customary compensation and expense reimbursement for these investment banking transactions.
The validity of the shares of our common stock offered by this prospectus will be passed upon for us by Kilpatrick Townsend & Stockton LLP, Washington, DC, and for the underwriters by Silver, Freedman, Taff & Tiernan LLP, Washington, DC. Christina M. Gattuso, a partner in the law firm of Kilpatrick Townsend & Stockton LLP, beneficially owns 2,000 shares of Square 1 Financial common stock and 25 shares of Square 1 Financial Capital Trust I Convertible Capital Securities.
The audited consolidated financial statements, included in this prospectus and elsewhere in the registration statement, have been so included in reliance upon the report of Grant Thornton LLP, independent registered public accountants, upon the authority of said firm as experts in accounting and auditing.
WHERE YOU CAN FIND MORE INFORMATION
This prospectus, which constitutes a part of a registration statement on Form S-1 filed with the SEC, does not contain all of the information set forth in the registration statement and the related exhibits and schedules. Some items are omitted in accordance with the rules and regulations of the SEC. Accordingly, we refer you to the complete registration statement, including its exhibits and schedules, for further information about us and the shares of common stock to be sold in this offering. Statements or summaries in this prospectus as to the contents of any contract or other document referred to in this prospectus are not necessarily complete and, where that contract or document is filed as an exhibit to the registration statement, each statement or summary is qualified in all respects by reference to the exhibit to which the reference relates. You may read and copy the registration statement, including the exhibits and schedules to the registration statement, at the SEC’s Public Reference Room at 100 F Street, NE, Room 1580, Washington, DC 20549. Information about the operation of the Public Reference Room may be obtained by calling the SEC at 1-800-SEC-0330. Our filings with the SEC, including the registration statement, are also available to you for free on the SEC’s Internet website at www.sec.gov.
Upon completion of the offering, we will become subject to the informational and reporting requirements of the Exchange Act and, in accordance with those requirements, will file reports and proxy and information statements with the SEC. You will be able to inspect and copy these reports and proxy and information statements and other information at the addresses set forth above. We intend to furnish to our shareholders our annual reports containing our audited consolidated financial statements certified by an independent public accounting firm.
We also maintain an Internet website at www.square1bank.com. On our website, we will make available our Annual Reports on Form 10-K, Quarterly Reports on Form 10-Q, Current Reports on Form 8-K and any amendments to those reports filed or furnished pursuant to Section 13(a) or 15(d) of the Exchange Act as soon as reasonably practicable after we electronically file such materials with, or furnish them to, the SEC. This reference to our website is for the convenience of investors as required by the SEC and shall not be deemed to incorporate any information on, or accessible through, our website into this prospectus.
114
Table of Contents
INDEX TO CONSOLIDATED FINANCIAL STATEMENTS
115
Table of Contents
| REPORT OF INDEPENDENT REGISTERED PUBLIC ACCOUNTING FIRM | Grant Thornton LLP 201 S College St. Suite 2500 Charlotte, NC 28244
T 704.632.3500 F 704.334.7701 www.GrantThornton.com |
Board of Directors and Shareholders
Square 1 Financial, Inc.
We have audited the accompanying consolidated balance sheets of Square 1 Financial, Inc. (a Delaware corporation) and subsidiaries (the “Company”) as of December 31, 2013 and 2012, and the related consolidated statements of operations, consolidated comprehensive income, changes in shareholders’ equity, and cash flows for each of the three years in the period ended December 31, 2013. These financial statements are the responsibility of the Company’s management. Our responsibility is to express an opinion on these financial statements based on our audits.
We conducted our audits in accordance with the standards of the Public Company Accounting Oversight Board (United States). Those standards require that we plan and perform the audit to obtain reasonable assurance about whether the financial statements are free of material misstatement. An audit includes examining, on a test basis, evidence supporting the amounts and disclosures in the financial statements. An audit also includes assessing the accounting principles used and significant estimates made by management, as well as evaluating the overall financial statement presentation. We believe that our audits provide a reasonable basis for our opinion.
In our opinion, the consolidated financial statements referred to above present fairly, in all material respects, the financial position of Square 1 Financial, Inc. and subsidiaries as of December 31, 2013 and 2012, and the results of their operations and their cash flows for each of the three years in the period ended December 31, 2013 in conformity with accounting principles generally accepted in the United States of America.
/s/ GRANT THORNTON LLP
Charlotte, North Carolina
Date February 28, 2014
Grant Thornton LLP
U.S. member firm of Grant Thornton International Ltd
F-1
Table of Contents
Square 1 Financial, Inc.
| (In thousands, except share and per share data) | ||||||||
| December 31, 2013 |
December 31, 2012 |
|||||||
| Assets |
||||||||
| Cash and cash equivalents |
$ | 105,730 | $ | 48,971 | ||||
| Investment in time deposits |
1,250 | 1,251 | ||||||
| Investment securities—available for sale, at fair value |
924,229 | 776,160 | ||||||
| Investment securities—held to maturity, at amortized cost |
154,255 | 67,022 | ||||||
| Loans, net of unearned income of $4.5 million and $4.0 million |
1,082,536 | 863,081 | ||||||
| Less allowance for loan losses |
(18,379 | ) | (13,843 | ) | ||||
|
|
|
|
|
|||||
| Net loans |
1,064,157 | 849,238 | ||||||
|
|
|
|
|
|||||
| Premises and equipment, net |
3,061 | 3,171 | ||||||
| Deferred income tax assets, net |
15,620 | 8,548 | ||||||
| Bank owned life insurance |
31,706 | 20,633 | ||||||
| Intangible assets |
2,065 | 987 | ||||||
| Other receivables |
2,592 | 1,799 | ||||||
| Warrant valuation |
5,105 | 4,780 | ||||||
| Prepaid expenses |
1,309 | 3,260 | ||||||
| Accrued interest receivable and other assets |
15,348 | 17,461 | ||||||
|
|
|
|
|
|||||
| Total assets |
$ | 2,326,427 | $ | 1,803,281 | ||||
|
|
|
|
|
|||||
| Liabilities and Shareholders’ Equity |
||||||||
| Deposits: |
||||||||
| Demand, noninterest-bearing |
$ | 1,380,024 | $ | 1,061,191 | ||||
| Demand, interest-bearing |
103,638 | — | ||||||
| Money market deposit accounts |
596,247 | 442,285 | ||||||
| Time deposits |
26,818 | 15,853 | ||||||
|
|
|
|
|
|||||
| Total deposits |
2,106,727 | 1,519,329 | ||||||
| Repurchase agreements |
12,737 | — | ||||||
| Borrowings |
6,207 | 96,204 | ||||||
| Accrued interest payable and other liabilities |
11,607 | 11,022 | ||||||
|
|
|
|
|
|||||
| Total liabilities |
$ | 2,137,278 | $ | 1,626,555 | ||||
|
|
|
|
|
|||||
| Commitments and contingencies (Notes 12, 13 and 16) |
||||||||
| Shareholders’ equity: |
||||||||
| Convertible preferred stock, $.01 par value; 10,000,000 shares authorized, 5,000 issued and outstanding as of 2013 and 2012 |
— | — | ||||||
| Common stock, $.01 par value; 45,000,000 shares authorized, 23,611,746 and 23,491,697 issued and outstanding as of 2013 and 2012 |
236 | 235 | ||||||
| Additional paid in capital |
183,716 | 182,135 | ||||||
| Accumulated other comprehensive (loss) income |
(4,096 | ) | 7,195 | |||||
| Retained earnings (deficit) |
9,293 | (12,839 | ) | |||||
|
|
|
|
|
|||||
| Total shareholders’ equity |
189,149 | 176,726 | ||||||
|
|
|
|
|
|||||
| Total liabilities and shareholders’ equity |
$ | 2,326,427 | $ | 1,803,281 | ||||
|
|
|
|
|
|||||
The accompanying notes are an integral part of these consolidated financial statements.
F-2
Table of Contents
Square 1 Financial, Inc.
Consolidated Statements of Operations
| (In thousands except per share data) | ||||||||||||
| 2013 | 2012 | 2011 | ||||||||||
| Interest income: |
||||||||||||
| Loans including fees on loans |
$ | 58,230 | $ | 50,814 | $ | 42,980 | ||||||
| Investment securities |
19,071 | 16,578 | 17,506 | |||||||||
| Federal funds and other short-term investments |
361 | 284 | 341 | |||||||||
|
|
|
|
|
|
|
|||||||
| Total interest income |
77,662 | 67,676 | 60,827 | |||||||||
|
|
|
|
|
|
|
|||||||
| Interest expense: |
||||||||||||
| Deposits |
656 | 473 | 858 | |||||||||
| Borrowings and repurchase agreements |
672 | 669 | 644 | |||||||||
|
|
|
|
|
|
|
|||||||
| Total interest expense |
1,328 | 1,142 | 1,502 | |||||||||
|
|
|
|
|
|
|
|||||||
| Net interest income |
76,334 | 66,534 | 59,325 | |||||||||
| Provision for loan losses |
13,300 | 9,371 | 7,300 | |||||||||
|
|
|
|
|
|
|
|||||||
| Net interest income after provision for loan losses |
63,034 | 57,163 | 52,025 | |||||||||
|
|
|
|
|
|
|
|||||||
| Noninterest income: |
||||||||||||
| Service charges and fees |
6,535 | 5,695 | 4,573 | |||||||||
| Foreign exchange fees |
4,864 | 3,768 | 3,586 | |||||||||
| Loan documentation fees |
429 | 401 | 344 | |||||||||
| Investment impairment |
(1,720 | ) | (1,484 | ) | (1,828 | ) | ||||||
| Net gain (loss) on securities |
1,696 | 1,126 | (7,128 | ) | ||||||||
| Letters of credit fees |
1,247 | 1,048 | 719 | |||||||||
| Warrant income (loss) |
3,750 | (73 | ) | 1,084 | ||||||||
| Gain on sale of loans |
2,033 | 2,575 | 2,399 | |||||||||
| Bank owned life insurance |
1,073 | 633 | — | |||||||||
| Other |
5,401 | 1,871 | 3,108 | |||||||||
|
|
|
|
|
|
|
|||||||
| Total noninterest income |
25,308 | 15,560 | 6,857 | |||||||||
|
|
|
|
|
|
|
|||||||
| Noninterest expense: |
||||||||||||
| Personnel |
35,759 | 30,507 | 26,885 | |||||||||
| Occupancy |
2,779 | 2,687 | 2,739 | |||||||||
| Data processing |
3,097 | 3,043 | 2,540 | |||||||||
| Furniture and equipment |
2,536 | 2,692 | 2,562 | |||||||||
| Advertising and promotions |
1,255 | 973 | 779 | |||||||||
| Professional fees |
3,232 | 3,646 | 4,026 | |||||||||
| Telecommunications |
1,172 | 1,152 | 1,449 | |||||||||
| Travel |
1,099 | 954 | 870 | |||||||||
| FDIC assessment |
1,293 | 1,295 | 2,308 | |||||||||
| Other |
3,699 | 4,199 | 5,005 | |||||||||
|
|
|
|
|
|
|
|||||||
| Total noninterest expense |
55,921 | 51,148 | 49,163 | |||||||||
|
|
|
|
|
|
|
|||||||
| Income before income tax expense/benefit |
32,421 | 21,575 | 9,719 | |||||||||
| Income tax expense |
10,038 | 7,203 | 4,372 | |||||||||
|
|
|
|
|
|
|
|||||||
| Net income |
22,383 | 14,372 | 5,347 | |||||||||
| Dividends on preferred stock |
250 | 250 | 250 | |||||||||
|
|
|
|
|
|
|
|||||||
| Net income available to common shareholders |
$ | 22,133 | $ | 14,122 | $ | 5,097 | ||||||
|
|
|
|
|
|
|
|||||||
| Earnings per share—basic |
$ | 0.94 | $ | 0.67 | $ | 0.25 | ||||||
| Earnings per share—diluted |
$ | 0.93 | $ | 0.67 | $ | 0.25 | ||||||
The accompanying notes are an integral part of these consolidated financial statements.
F-3
Table of Contents
Square 1 Financial, Inc.
Consolidated Statements of Comprehensive Income
| (In thousands) | ||||||||||||
| 2013 | 2012 | 2011 | ||||||||||
| Net income |
$ | 22,383 | $ | 14,372 | $ | 5,347 | ||||||
| Other comprehensive income, net of tax: |
||||||||||||
| Unrealized gains on securities: |
||||||||||||
| Unrealized holding (losses) gains arising during period |
(10,346 | ) | 14,868 | 11,573 | ||||||||
| Less: reclassification adjustment for gains included in net income |
(945 | ) | (1,147 | ) | — | |||||||
|
|
|
|
|
|
|
|||||||
| Other comprehensive income (loss) |
(11,291 | ) | 13,721 | 11,573 | ||||||||
|
|
|
|
|
|
|
|||||||
| Comprehensive income |
11,092 | 28,093 | 16,920 | |||||||||
| Dividends on preferred stock |
250 | 250 | 250 | |||||||||
|
|
|
|
|
|
|
|||||||
| Comprehensive income available to common shareholders |
$ | 10,842 | $ | 27,843 | $ | 16,670 | ||||||
|
|
|
|
|
|
|
|||||||
The accompanying notes are an integral part of these consolidated financial statements.
F-4
Table of Contents
Square 1 Financial, Inc.
Consolidated Statements of Changes in Shareholders’ Equity
| (Dollars in thousands) | ||||||||||||||||||||||||||||||||
| Preferred Stock | Common Stock | Additional Paid in Capital |
Accumulated Other Comprehensive Income (Loss) |
Retained Deficit |
Total | |||||||||||||||||||||||||||
| Shares | Amount | Shares | Amount | |||||||||||||||||||||||||||||
| Balance at December 31, 2010 |
5,000 | $ | — | 20,093,977 | $ | 201 | $ | 156,960 | $ | (18,099 | ) | $ | (32,058 | ) | $ | 107,004 | ||||||||||||||||
| Stock-based compensation |
— | — | — | — | 705 | — | — | 705 | ||||||||||||||||||||||||
| Dividends on preferred stock |
(250 | ) | (250 | ) | ||||||||||||||||||||||||||||
| Net income |
— | — | — | — | — | — | 5,347 | 5,347 | ||||||||||||||||||||||||
| Unrealized gain on securities net of tax of $7.9 million |
— | — | — | — | — | 11,573 | — | 11,573 | ||||||||||||||||||||||||
|
|
|
|
|
|
|
|
|
|
|
|
|
|
|
|
|
|||||||||||||||||
| Balance at December 31, 2011 |
5,000 | $ | — | 20,093,977 | $ | 201 | $ | 157,665 | $ | (6,526 | ) | $ | (26,961 | ) | $ | 124,379 | ||||||||||||||||
| Issuance of common stock, net issuance costs of $303 thousand |
— | — | 3,397,720 | 34 | 23,170 | — | — | 23,204 | ||||||||||||||||||||||||
| Stock-based compensation |
— | — | — | — | 1,300 | — | — | 1,300 | ||||||||||||||||||||||||
| Dividends on preferred stock |
— | — | — | — | — | — | (250 | ) | (250 | ) | ||||||||||||||||||||||
| Net income |
— | — | — | — | — | — | 14,372 | 14,372 | ||||||||||||||||||||||||
| Unrealized gain on securities net of tax of $8.1 million |
— | — | — | — | — | 13,721 | — | 13,721 | ||||||||||||||||||||||||
|
|
|
|
|
|
|
|
|
|
|
|
|
|
|
|
|
|||||||||||||||||
| Balance at December 31, 2012 |
5,000 | $ | — | 23,491,697 | $ | 235 | $ | 182,135 | $ | 7,195 | $ | (12,839 | ) | $ | 176,726 | |||||||||||||||||
|
|
|
|
|
|
|
|
|
|
|
|
|
|
|
|
|
|||||||||||||||||
| Issuance of common stock, net issuance costs of $1 thousand |
— | — | 120,049 | 1 | 36 | — | — | 37 | ||||||||||||||||||||||||
| Stock-based compensation |
— | — | — | — | 1,545 | — | — | 1,545 | ||||||||||||||||||||||||
| Dividends on preferred stock |
— | — | — | — | — | — | (251 | ) | (251 | ) | ||||||||||||||||||||||
| Net income |
— | — | — | — | — | — | 22,383 | 22,383 | ||||||||||||||||||||||||
| Unrealized loss on securities net of tax of $6.3 million |
— | — | — | — | — | (11,291 | ) | — | (11,291 | ) | ||||||||||||||||||||||
|
|
|
|
|
|
|
|
|
|
|
|
|
|
|
|
|
|||||||||||||||||
| Balance at December 31, 2013 |
5,000 | $ | — | 23,611,746 | $ | 236 | $ | 183,716 | $ | (4,096 | ) | $ | 9,293 | $ | 189,149 | |||||||||||||||||
|
|
|
|
|
|
|
|
|
|
|
|
|
|
|
|
|
|||||||||||||||||
The accompanying notes are an integral part of these consolidated financial statements.
F-5
Table of Contents
Square 1 Financial, Inc.
Consolidated Statements of Cash Flows
| (In thousands) | Years ended December 31, | |||||||||||
| 2013 | 2012 | 2011 | ||||||||||
| Net income(loss) |
$ | 22,383 | $ | 14,372 | $ | 5,347 | ||||||
| Adjustments to reconcile net income (loss) to net cash provided by operating activities: |
||||||||||||
| Depreciation and amortization |
1,086 | 1,314 | 1,392 | |||||||||
| Amortization on investment securities, net |
15,832 | 13,001 | 11,313 | |||||||||
| Provision for loan losses |
13,300 | 9,371 | 7,300 | |||||||||
| Stock-based compensation |
1,545 | 1,300 | 705 | |||||||||
| (Gain) Loss on sale of securities available for sale |
(1,696 | ) | (1,126 | ) | 7,128 | |||||||
| Investment impairment |
1,720 | 1,484 | 1,828 | |||||||||
| Gain on acquisition |
(446 | ) | — | — | ||||||||
| Deferred income tax (benefit) provision |
(651 | ) | (509 | ) | 4,139 | |||||||
| Earnings on bank owned life insurance |
(1,073 | ) | (633 | ) | — | |||||||
| Changes in assets and liabilities: |
||||||||||||
| Accrued interest receivable and other assets |
2,746 | (3,275 | ) | 4,308 | ||||||||
| Accrued interest payable and other liabilities |
588 | 2,147 | 1,644 | |||||||||
|
|
|
|
|
|
|
|||||||
| Net cash provided by operating activities |
55,334 | 37,446 | 45,104 | |||||||||
|
|
|
|
|
|
|
|||||||
| Cash flows from investing activities: |
||||||||||||
| Net increase in investment in time deposits |
— | — | 100 | |||||||||
| Purchase of securities available for sale |
(437,656 | ) | (418,619 | ) | (645,677 | ) | ||||||
| Purchase of securities held to maturity |
(61,907 | ) | (38,099 | ) | (6,714 | ) | ||||||
| Proceeds from calls/maturities of securities available for sale |
149,928 | 131,787 | 150,449 | |||||||||
| Proceeds from sales of securities available for sale |
77,984 | 195,216 | 628,664 | |||||||||
| Proceeds from paydowns of securities held to maturity |
2,497 | 3,411 | 1,133 | |||||||||
| Net increase in loans |
(223,577 | ) | (159,337 | ) | (225,132 | ) | ||||||
| Purchase of bank owned life insurance |
(10,000 | ) | (20,000 | ) | — | |||||||
| (Purchases) sales of premises and equipment |
(916 | ) | (528 | ) | (704 | ) | ||||||
| Net cash paid in acquisition |
(4,849 | ) | — | — | ||||||||
|
|
|
|
|
|
|
|||||||
| Net cash used in investing activities |
(508,496 | ) | (306,169 | ) | (97,881 | ) | ||||||
|
|
|
|
|
|
|
|||||||
| Cash flows from financing activities: |
||||||||||||
| Net increase in deposits |
587,398 | 10,500 | 46,916 | |||||||||
| Net increase in repurchase agreements |
12,737 | — | (928 | ) | ||||||||
| (Decrease) increase in FHLB borrowings |
(90,000 | ) | 90,000 | — | ||||||||
| Preferred dividends paid |
(250 | ) | (250 | ) | (250 | ) | ||||||
| Proceeds from issuance of common stock, net of issuance costs |
36 | 23,204 | — | |||||||||
|
|
|
|
|
|
|
|||||||
| Net cash provided by financing activities |
509,921 | 123,454 | 45,738 | |||||||||
|
|
|
|
|
|
|
|||||||
| Net change in cash and cash equivalents |
56,759 | (145,269 | ) | (7,039 | ) | |||||||
| Cash and cash equivalents at beginning of year |
48,971 | 194,240 | 201,279 | |||||||||
|
|
|
|
|
|
|
|||||||
| Cash and cash equivalents at end of year |
$ | 105,730 | $ | 48,971 | $ | 194,240 | ||||||
|
|
|
|
|
|
|
|||||||
| Supplemental statement of cash flow disclosures |
||||||||||||
| Interest paid |
$ | 1,328 | $ | 1,142 | $ | 1,502 | ||||||
| Income taxes paid |
10,479 | 8,443 | — | |||||||||
| Recognition of debt discount on subordinated debentures |
(3 | ) | (11 | ) | (10 | ) | ||||||
| Schedule of noncash investing transactions |
||||||||||||
| Fair value of tangible assets acquired |
12,288 | — | — | |||||||||
| Other intangible assets acquired |
800 | — | — | |||||||||
The accompanying notes are an integral part of these consolidated financial statements.
F-6
Table of Contents
Notes to the Consolidated Financial Statements
| 1. | ORGANIZATION AND NATURE OF OPERATIONS |
Square 1 Financial, Inc. (the “Company”) is a bank holding company incorporated under the laws of Delaware on October 6, 2004. The Company’s primary function is to serve as the holding company for its wholly-owned subsidiary, Square 1 Bank. Square 1 Bank (the “Bank”) was incorporated under the laws of North Carolina on July 11, 2005 and commenced operations on August 8, 2005. The Bank is not a member of the Federal Reserve System. The Bank provides a full range of commercial banking services primarily to companies that have received institutional investment, typically from venture capital sources. The Bank’s primary source of revenue is interest earned from loans to customers and from invested cash and securities and non-interest income derived from various fees. During 2007, the Company formed Square 1 Ventures, LLC (a Delaware limited liability company); a wholly-owned subsidiary established to sponsor a fund of funds. Square 1 Ventures, LLC is consolidated into the Company’s financial statements.
The Bank operates one branch in Durham, NC and loan production offices in Silicon Valley, Seattle, Los Angeles, Campbell, CA, Austin, New York, Denver, Boston, San Diego and the District of Columbia. The Company’s corporate headquarters are located in Durham, NC.
In September 2008, the Company formed Square 1 Financial Capital Trust I (the “Trust”), a wholly owned subsidiary formed in order to facilitate the issuance of convertible trust preferred securities. The Trust has invested the total proceeds from the sales of the convertible trust preferred securities in convertible junior subordinated deferrable interest debentures issued by the Company. The assets of the trust are not assets of the Company and are not consolidated into the Company’s consolidated financial statements. The subordinated debentures issued by the Company to the Trust are included in borrowings, and the Company’s equity interests in the Trust are included in other assets.
In 2013, Square 1 Bank formed Square 1 Asset Management, a wholly owned subsidiary of the Bank in order to provide an investment alternative for clients.
On December 31, 2013, the Company acquired the business operations and key employees of Sand Hill Finance LLC, a factoring company located in California, as part of the Company’s strategy to continue to grow its asset-based lending portfolio. Square 1 Bank acquired approximately $11.9 million of factoring loans from Sand Hill Finance LLC and certain other assets for a total purchase price of approximately $12.4 million which included $7.2 million in debt settlement. Additionally, Square 1 Bank assumed obligations under the real estate lease for the company’s primary place of business and hired the company’s seven employees. The Bank intends to integrate the factoring product into its existing suite of asset-based lending products, and will not operate Sand Hill Finance LLC as a separate division of Square 1 Bank. The acquisition does not meet the significance threshold and therefore, separate pro forma disclosures are not required.
Basis of Presentation
These financial statements have been prepared in accordance with accounting principles generally accepted in the United States of America (“GAAP”). Certain prior year amounts have been reclassified to conform to current year presentation.
| 2. | SUMMARY OF SIGNIFICANT ACCOUNTING POLICIES |
The preparation of financial statements in conformity with GAAP requires us to interpret and apply accounting standards and to develop and follow accounting policies consistent with such standards. The following is a summary of the significant accounting policies used in preparing the Company’s consolidated financial statements.
F-7
Table of Contents
Principles of Consolidation
The consolidated financial statements include the financial statements of Square 1 Financial and its consolidated subsidiaries and other entities in which it has a controlling financial interest. All significant intercompany balances and transactions have been eliminated in consolidation. In addition, the Company evaluates its relationships with other entities to identify whether they are variable interest entities and to assess whether it is the primary beneficiary of such entities. If the determination is made that the Company is the primary beneficiary, then that entity is included in the consolidated financial statements. If an entity is not a variable interest entity, the Company also evaluates arrangements in which there is a general partner or managing member to determine whether consolidation is appropriate.
Square 1 Venture 1 L.P.—The Company owns approximately a 2% partnership interest in Square 1 Venture 1 L.P., which was formed for the primary purpose of sponsoring a fund of funds. The Company has determined that Square 1 Venture 1 L.P. is not a VIE for all periods presented; accordingly, Square 1 Venture 1 L.P. is not consolidated. The Company accounts for the investment in Square 1 Venture 1 L.P. using the equity method of accounting. For the year ended December 31, 2013, gains of $0.2 million were recognized. For the year ended December 31, 2012, losses of $0.6 million were recognized. For the year ended December 31, 2011, gains of $1.5 million were recognized. The fair value of the investment at December 31, 2013 and 2012, was $1.0 million and $0.8 million, respectively, and is included in other assets on the balance sheet.
Use of Estimates in the Preparation of Financial Statements
The preparation of consolidated financial statements in conformity with GAAP requires management to make estimates and assumptions that affect the reported amounts of assets and liabilities and disclosure of contingent assets and liabilities at the date of the consolidated financial statements and the reported amounts of revenues and expenses during the reporting period. Actual results could differ from those estimates. The more significant estimates that are particularly susceptible to significant change relate to the determination of the allowance for loan losses, the valuation of investment securities, recognition and measurement of income tax assets and liabilities and the valuation of equity warrant assets and foreclosed assets.
Cash and Cash Equivalents
Cash and cash equivalents include noninterest-earning and interest-earning deposits at other institutions, federal funds sold and other short term investments. Generally, federal funds are purchased and sold for one-day periods. At times, the Bank places deposits with high credit quality financial institutions in amounts which may be in excess of federally insured limits. The Bank is required to maintain reserve and clearing balances with the Federal Reserve Bank. Accordingly, the Bank has amounts restricted for this purpose of $12.0 million and $5.5 million in the consolidated balance sheet at December 31, 2013 and 2012, respectively.
Investment Securities
Investments in securities are classified into three categories and accounted for as follows:
Securities Held to Maturity—Debt securities that the Company has the positive intent and ability to hold to maturity are classified as held to maturity and reported at amortized cost; or
Trading Securities—Debt and equity securities that are bought and held principally for the purpose of selling in the near term are classified as trading securities and reported at fair value, with unrealized gains and losses included in earnings; or
Securities Available for Sale—Debt and equity securities not classified as either held to maturity securities or trading securities are classified as available for sale securities and reported at fair value, with unrealized gains and losses excluded from earnings and reported as other comprehensive income, a separate component of shareholders’ equity.
F-8
Table of Contents
The Company intends to hold its securities classified as available for sale securities for an indefinite period of time but may sell them prior to maturity. All other securities, which the Company has the positive intent and ability to hold to maturity, are classified as held to maturity securities. The initial classification of securities is determined at the date of purchase. Gains and losses on sales of securities, computed based on specific identification of the adjusted cost of each security, are included in noninterest income at the time of the sales.
We analyze marketable securities for other-than-temporary impairment (OTTI) as required under Accounting Standards Codification (ASC) 820-10. Market valuations represent the current fair value of a security at a specified point in time and do not represent the risk of repayment of the principal due to our ability to hold the security to maturity. As such, fair value is analogous to market value and is different than assessing and measuring OTTI. Our OTTI methodology identifies how much of the impairment is related to credit versus market risk. If the analysis indicates that credit losses exist, then the impairment is increased through earnings to cover that portion related to the credit losses.
A credit downgrade represents an increased level of risk of OTTI, and will only be recognized if we assess the downgrade to challenge the issuer’s ability to service the debt and to repay the principal at contractual maturity.
There are numerous factors to be considered when estimating whether a credit loss exists and the period over which the debt security is expected to recover. The following list is not meant to be all inclusive. All of the following factors shall be considered:
| • | The length of time and the extent to which the fair value has been less than the amortized cost basis (severity and duration); |
| • | Adverse conditions specifically related to the security, an industry, or geographic area; for example changes in the financial condition of the issuer of the security, or in the case of an asset-backed debt security, changes in the financial condition of the underlying loan obligors. Examples of those changes include any of the following: |
| • | Changes in technology; |
| • | The discontinuance of a segment of the business that may affect the future earnings potential of the issuer or underlying loan obligors of the security; and |
| • | Changes in the quality of the credit enhancement. |
| • | The historical and implied volatility of the fair value of the security; |
| • | The payment structure of the debt security and the likelihood of the issuer being able to make payments that increase in the future; |
| • | Failure of the issuer of the security to make scheduled interest or principal payments; |
| • | Any changes to the rating of the security by a rating agency; and |
| • | Recoveries or additional declines in fair value after the balance sheet date. |
We use actual principal repayment experience to amortize purchased discounts and premiums on mortgage-backed securities (“MBS”) and other amortizing debt securities. Both the pro-rata and level yield methods are used to amortize the discounts and premiums. As principal is paid down on the amortizing securities a commensurate amount of premium or discount is also amortized into income.
Premiums and discounts on non-amortizing securities are recognized in interest income using the level interest yield method over the period to maturity, or when the debt securities are called or significantly repriced.
As a member of the Federal Home Loan Bank (“FHLB”), we are required to hold shares of FHLB stock under the Bank’s borrowing agreement. At December 31, 2013 and 2012, we had $2.2 million and $6.5 million, respectively, in FHLB stock which is recorded at cost as a component of other assets.
F-9
Table of Contents
Bank Owned Life Insurance
The Bank maintains life insurance on certain employees. The policies were purchased during 2012 and 2013. The cash surrender value of the life insurance policies at December 31, 2013 and 2012, was $31.7 million and $20.6 million.
Loans, Net of Unearned Income and Allowance for Loan Losses
Loans are stated at the amount of unpaid principal, reduced by an allowance for loan losses and net deferred loan origination fees and direct costs. The balance is further reduced by deferred income from equity warrant positions received in connection with certain loans. Interest on loans is calculated by using the simple interest method on daily balances of the principal amount outstanding. Deferred loan fees, direct costs and discounts related to warrant position are amortized to interest income over the contractual life of the loan using the level yield method, taking into consideration scheduled payments and prepayments.
A loan is considered impaired, based on current information and events, if it is probable that the Bank will be unable to collect the scheduled payments of principal and interest when due according to the contractual terms of the loan agreement. Uncollateralized loans are measured for impairment based on the present value of expected future cash flows discounted at the historical effective interest rate, while all collateral-dependent loans are measured for impairment based on the fair value of the collateral.
The Bank uses several factors in determining if a loan is impaired. The internal asset classification procedures include a thorough review of significant loans and lending relationships and include the accumulation of related data. This data includes loan payment status, borrowers’ financial data and borrowers’ operating factors such as cash flows, operating income or loss, etc. It is possible that these factors and management’s evaluation of the adequacy of the allowance for loan losses will change.
The allowance for loan losses is established through a provision for loan losses charged to expense. Loans are charged against the allowance for loan losses when management believes that the collectability of the principal is unlikely. The evaluations take into consideration such factors as changes in the nature and volume of the loan portfolio, overall portfolio quality, review of specific problem loans, and current economic conditions and trends that may affect the borrower’s ability to pay.
The allowance for loan losses is based on a formula allocation for similarly risk-rated loans and individually for impaired loans. The formula allocation is determined on a monthly basis by utilizing a historical loan loss migration model, which is a statistical model used to estimate an appropriate allowance for outstanding loan balances by calculating the amount and likelihood of a loan being charged-off based on its credit risk rating using historical loan performance data from our portfolio. The historical loan loss migration statistical model utilizes loss history over the trailing six-month period, over the trailing twelve-month period and since Square 1 Bank’s adoption of its allowance methodology. These three loss rates are annualized and averaged equally to provide a charge-off rate that is reflective of both current market conditions and cumulative bank experience. This average rate is then applied using three methodologies that are based on industry, stage of company and structure of debt. An allowance for loan losses is calculated using each of these methodologies. The results of the three calculations are then averaged for each risk-rating category and applied to the respective period-end client loan balances for each corresponding risk-rating category in order to provide an estimation of the aggregate allowance for loan losses. Equal weighting is given to each historical time frame and to each methodology, and is applied across all loan categories. The application of these methodologies has been applied consistently for all periods.
Square 1 Bank applies qualitative allocations to the results obtained through our historical loan loss migration model to ascertain the total allowance for loan losses. These qualitative allocations are based upon management’s assessment of the risks that may lead to a loan loss experience different from our historical loan loss experience. These risks are aggregated to become our qualitative allocation. Based on
F-10
Table of Contents
management’s prediction or estimate of changing risks in the lending environment, the qualitative allocation may vary significantly from period to period and includes, but is not limited to, consideration of the following factors:
| • | changes in lending policies and procedures, including underwriting standards and collections, and charge-off and recovery practices; |
| • | changes in national and local economic business conditions, including the market and economic condition of our clients’ industry sectors; |
| • | changes in the nature of our loan portfolio; |
| • | changes in experience, ability, and depth of lending management and staff; |
| • | changes in the trend of the volume and severity of past due and classified loans; |
| • | changes in the trend of the volume of nonaccrual loans, troubled debt restructurings, and other loan modifications; |
| • | reserve floor for portfolio segments that would not draw a minimum reserve based on the lack of historical loan loss experience; |
| • | reserve for large funded loan exposure; and |
| • | other factors as determined by management from time to time. |
The Bank will generally charge off a loan when it determines that the loan is uncollectible, meaning that all economically sensible means of recovery have been exhausted. Charge offs are approved by the Chief Credit Officer or designee.
Loan Documentation Fees
The Bank requires legal representation in connection with the negotiation of loan transactions and the preparation of documentation related to such transactions with its borrowers. As is customary in the banking industry, the borrower is responsible for paying the Bank’s legal expenses in these transactions. The Bank’s legal department includes several attorneys and paralegals dedicated to representing the Bank in loan transactions, and the Bank charges a fee to the borrowers for providing this representation. The amount of the fees and related recognition vary based on the type of work performed.
ASC 310-20-35 defines loan fees that should be deferred and amortized over the life of the loan. We apply this guidance to determine the appropriate treatment of loan documentation fees. As a result, loan documentation fees that are received in connection with the origination of a loan or an amendment of loan terms such as an increase in the amount of the loan facility or a change in the interest rate of the loan, are deferred and amortized into interest income over the life of the loan. Other fees that are not related to loan origination or amendment of loan terms as described above, such as payoff letters, notices of default or consent letters, are considered maintenance fees and are therefore not implicit yield adjustments but rather are recognized immediately as a component of noninterest income.
Concentration of Credit Risk
Assets that potentially expose the Company to concentration of credit risk consist primarily of investments in securities and loans. The Company invests from time to time in securities with high-credit quality. Loans are generally diversified due to the high number of entities comprising the Company’s customer base and their dispersion across diverse geographical regions.
F-11
Table of Contents
Credit Quality
It is the Bank’s policy to accurately risk rate all credit facilities. For each client, an internal credit risk rating is established for that loan. Each loan is given a credit risk rating of 1 through 7. Loans risk rated 1 through 3.5 are performing loans and translate to an internal rating of “Pass”. A risk rating of 4 is considered “Special Mention”. A special mention credit has potential weaknesses that deserve management’s close attention and are classified as criticized loans. A risk rating of 5 is considered to be “Substandard”. A credit is rated substandard when it is inadequately protected by the net worth and/or repayment capacity of the borrower. The collateral, if any, is deemed insufficient to repay the loan in full. Loans in this risk rating may or may not be considered impaired and may or may not be on nonaccrual status. If they are not impaired, they are classified as criticized performing loans. Loans risk rated 6 are “Doubtful”. These loans are considered impaired and are on nonaccrual status. Loans rated 7 are considered a “Loss” and have been charged off.
We manage our credit risk exposure through credit controls including: (i) evaluation of credit applications, borrowers, collateral packages and liquidity, (ii) a detailed loan approval process and (iii) rigorous monitoring procedures with respect to our existing loan portfolio. Our regional managers and portfolio analysts monitor loan covenants on a daily basis, our borrowers’ performance on a monthly basis and our portfolio quality on at least an annual basis. We maintain a database that provides us with detailed loan performance information.
Troubled Debt Restructurings (“TDRs”)
A TDR arises from the modification of a loan where the Bank has granted a concession to the borrower that would not have otherwise been considered, for economic or legal reasons related to the borrower’s financial difficulties. These concessions may include: (1) interest rate reductions for the remaining original life of the debt; (2) extension of the maturity date; (3) principal forgiveness; and/or (4) reduction of accrued interest.
Income Recognition on Impaired and Nonaccrual Loans
Loans, including impaired loans, are generally classified as nonaccrual if they are past due as to maturity or payment of principal or interest for a period of more than 90 days, unless such loans are well-secured and in the process of collection. If a loan or a portion of a loan is classified as doubtful or as partially charged off, the loan is generally classified as nonaccrual. Loans that are on a current payment status or past due less than 90 days may also be classified as nonaccrual if repayment in full of principal and/or interest is in doubt.
Loans may be returned to accrual status when all principal and interest amounts contractually due (including arrearages) are reasonably assured of repayment within an acceptable period of time, and there is a sustained period of repayment performance (generally a minimum of six months) of interest and principal by the borrower in accordance with the contractual terms.
While a loan is classified as nonaccrual and the future collectability of the recorded loan balance is doubtful, collections of interest and principal are generally applied as a reduction to the principal outstanding.
Foreclosed Assets
Upon acquisition, foreclosed assets are initially recorded at the fair value of the asset less cost to sell. Subsequently, foreclosed assets are carried at the lower of carrying value or net realizable value. Any excess of the recorded investment over the fair value of the property received is charged to the allowance for loan losses. Reviews will be performed quarterly by management and any subsequent write-downs due to the carrying value of a property exceeding its estimated fair value (less estimated costs to sell) are charged against other expenses. Foreclosed assets, which amounted to $0.1 million and $0.1 million at December 31, 2013 and 2012, respectively, are included in other assets in the accompanying consolidated balance sheets.
F-12
Table of Contents
Premises and Equipment, Net
Premises and equipment are reported at cost less accumulated depreciation and amortization. Depreciation and amortization are computed using the straight-line method based on estimated service lives of assets. Useful lives are 5 years for leasehold improvements. Useful lives range from 3 to 7 years for furniture and equipment. Repairs and maintenance are charged to expense as incurred.
Upon disposition, the asset and related accumulated depreciation or amortization is removed from the accounts and any resulting gain or loss is included in operations.
Income Taxes
The Company and its subsidiaries file a consolidated U.S. federal income tax return.
Deferred tax assets and liabilities resulting from temporary differences between the financial reporting and tax bases of assets and liabilities are measured at the balance sheet date using enacted tax rates expected to apply to taxable income in the years the temporary differences are expected to reverse.
The realization of deferred tax assets depends upon the existence of sufficient taxable income within the carry-back or carry-forward periods under the tax law in the applicable tax jurisdiction. Valuation allowances are established when management determines, based on available information, that it is more likely than not that deferred income tax assets will not be realized. Significant judgment is required in determining whether valuation allowances should be established as well as the amount of such allowances. When making such determination, consideration is given to, among other things, the following:
| • | Future taxable income; |
| • | Future reversals of existing taxable temporary differences; |
| • | Taxable income in prior carry-back years; and |
| • | Tax planning strategies. |
The Company classifies tax related interest and penalties as a component of income taxes. Interest and penalties for all years presented were immaterial.
Prepaid Expenses
Prepaid expenses include prepaid insurance and other prepaid expenses, including prepaid FDIC insurance. In 2009, the FDIC required insured depository institutions to prepay their quarterly risk-based assessments for the fourth quarter of 2009, and for the years ended December 31, 2012, 2011 and 2010, by December 30, 2009. At December 31, 2012, prepaid expenses include $2.3 million for prepaid FDIC insurance. In June 2013, the FDIC refunded any unused portion of prepaid FDIC insurance to depository institutions. We received a $2.0 million refund leaving the balance at zero.
Derivatives
The Company receives equity warrants with net settlement terms in connection with extending loan commitments to certain of its customers. We hold these equity warrants for future investment gains, rather than to hedge economic risks. In general, the equity warrants entitle the Company to buy a specific number of shares of the customer’s stock at a specific price over a specific time period. The warrants may also include contingent provisions which provide for additional shares to be purchased at a specific price if defined future events occur, such as future rounds of equity financing by the customer, or upon additional borrowings by the customer. All of the Company’s equity warrants contain net share settlement provisions, which permit the customer to deliver to the Company, upon the Company’s exercise of the warrant, the amount of shares with a current fair value equal to the net gain under the warrant agreement.
F-13
Table of Contents
ASC 815 Derivatives and Hedging requires that all derivative instruments be recorded on the balance sheet at fair value. Equity warrants with net share settlement provisions are considered derivatives. The Bank estimates the initial fair value of the equity warrants using a Black-Scholes option pricing model to approximate fair market value. The model estimates market value for each warrant based on the most recent equity offerings for each issuing company, the warrant specific exercise price, the warrant’s expected life, a risk-free interest rate based on a duration matched U.S. Treasury rate and volatility factors derived from indices of comparable publicly traded companies. Our equity warrants portfolio is primarily comprised of holdings in non-public companies as our practice is to monetize our positions as soon as an open market is available. On a monthly basis, the Bank adjusts the value of equity warrants in non-public companies based on changes to the risk-free interest rate, the volatility rate and the warrant’s expected life. The Bank also adjusts the value of equity warrants in public companies on a monthly basis based on the companies’ stock closing prices on the last trading day of the month. See Note 17 for further information regarding the fair value of our equity warrants.
The grant date fair values of equity warrants received in connection with extending loan commitments are considered to be loan fees and are recognized over the life of the loan commitment as an adjustment of loan yield through loan interest income. At December 31, 2013 and 2012, unearned income on loans included $1.2 million and $0.8 million, respectively, related to the initial valuation of equity warrant assets. For the years ended December 31, 2013, 2012 and 2011, we recognized $1.3 million, $1.2 million and $1.4 million, respectively, in income from the amortization of loan fees related to initial valuation of equity warrant assets.
Any changes from the grant date in the fair value of equity warrant assets will be recognized as increases or decreases to warrant valuation and as net gains or losses in non-interest income. When a portfolio company completes an initial public offering on a publicly reported market or is acquired, we may exercise these equity warrant assets for shares or cash. Warrants held, which amounted to $5.1 million held in 451 companies and $4.8 million held in 396 companies at December 31, 2013 and 2012, respectively, are shown as warrant valuation in the accompanying consolidated balance sheets. At December 31, 2013, included in the $5.1 million in equity warrant assets in 451 companies are $1.0 million of equity warrant assets held in three publicly traded companies, which the Company intends to monetize upon expiration of the respective lock-up periods. We did not hold any equity warrant assets in publicly traded companies at December 31, 2012.
F-14
Table of Contents
The following table presents gains and losses on equity warrant exercises and the number of companies on which warrants were exercised by stage of emerging companies:
| (In thousands except number of companies) | Years ended December 31, | |||||||||||
| 2013 | 2012 | 2011 | ||||||||||
| Equity warrant assets: |
||||||||||||
| Gains: |
||||||||||||
| Early stage |
$ | 468 | $ | 12 | $ | 8 | ||||||
| Expansion stage |
3,840 | 1,378 | 1,791 | |||||||||
| Late stage |
672 | 439 | 530 | |||||||||
|
|
|
|
|
|
|
|||||||
| Total gains on exercise of equity warrant assets |
4,980 | 1,829 | 2,329 | |||||||||
| Losses: |
||||||||||||
| Early stage |
— | — | — | |||||||||
|
|
|
|
|
|
|
|||||||
| Total losses on exercise of equity warrant assets |
— | — | — | |||||||||
|
|
|
|
|
|
|
|||||||
| Net gains on exercise of equity warrant assets |
4,980 | 1,829 | 2,329 | |||||||||
| Non-monetized write off of warrant assets |
(445 | ) | (327 | ) | (67 | ) | ||||||
|
|
|
|
|
|
|
|||||||
| Net realized gains on equity warrants |
4,535 | 1,502 | 2,262 | |||||||||
| Change in fair value of equity warrant assets |
(785 | ) | (1,575 | ) | (1,178 | ) | ||||||
|
|
|
|
|
|
|
|||||||
| Warrant income (loss) |
$ | 3,750 | $ | (73 | ) | $ | 1,084 | |||||
|
|
|
|
|
|
|
|||||||
| Number of companies on which cash warrant gains or losses were realized: |
||||||||||||
| Early stage |
4 | 2 | 3 | |||||||||
| Expansion stage |
25 | 16 | 12 | |||||||||
| Late stage |
2 | 4 | 3 | |||||||||
|
|
|
|
|
|
|
|||||||
| Total number of companies |
31 | 22 | 18 | |||||||||
|
|
|
|
|
|
|
|||||||
Fair Value Measurements
Our marketable investment securities and derivative instruments are financial instruments recorded at fair value on a recurring basis. We make estimates regarding valuation of assets and liabilities measured at fair value in preparing our consolidated financial statements.
ASC 820, Fair Value Measurements and Disclosures defines fair value as the price that would be received to sell an asset or paid to transfer a liability (the “exit price”) in an orderly transaction between market participants at the measurement date. Fair value is a market-based measurement considered from the perspective of a market participant who holds the asset or owes the liability rather than an entity-specific measurement.
ASC 820 establishes a three-level hierarchy for disclosure of assets and liabilities recorded at fair value. The classification of assets and liabilities within the hierarchy is based on whether the inputs to the valuation methodology used for measurement are observable or unobservable. Observable inputs reflect market-derived or market-based information obtained from independent sources, while unobservable inputs reflect our estimates about market data. The three levels for measuring fair value are based on the reliability of inputs and are as follows:
| Level 1 |
Valuations based on quoted prices in active markets for identical assets or liabilities that we have the ability to access. Valuation adjustments and block discounts are not applied to instruments utilizing Level 1 inputs. Since valuations are based on quoted prices that are readily available in an active market, valuation of these products does not entail a significant degree of judgment. Assets utilizing Level 1 inputs include exchange-traded equity securities. |
F-15
Table of Contents
| Level 2 |
Valuations based on quoted prices in markets that are not active or for which all significant inputs are observable, directly or indirectly. Assets and liabilities utilizing Level 2 inputs include: U.S. treasury and agency securities: mortgage-backed securities: collateralized mortgage obligations: commercial mortgage-backed securities: municipal bonds and notes: Over-the-Counter (“OTC”) derivative instruments (foreign exchange forwards and option contracts, interest rate swaps related to our senior notes, subordinated notes and junior subordinated debentures): and, equity warrant assets for shares of public company capital stock. | |
| Level 3 |
Valuations based on inputs that are unobservable and significant to the overall fair value measurement. Assets utilizing Level 3 inputs include: limited partnership interests in private equity funds, direct equity investments in private companies, mortgage-backed securities, and equity warrant assets for shares of private company capital stock. | |
For inactive markets, there is little information, if any, to evaluate if individual transactions are orderly. Accordingly, we are required to estimate, based upon all available facts and circumstances, the degree to which orderly transactions are occurring. Price quotes based upon transactions that are not orderly are not considered to be determinative of fair value and are given little, if any, weight in measuring fair value. Price quotes based upon transactions that are orderly are considered in determining fair value, with the weight given based upon the facts and circumstances. If sufficient information is not available to determine if price quotes are based upon orderly transactions, less weight is given to the price quote relative to other transactions that are known to be orderly.
To the extent that valuation is based on models or inputs that are less observable or unobservable in the market, the determination of fair value requires more judgment. Accordingly, the degree of judgment that we use to determine fair value is greatest for instruments categorized in Level 3. In certain cases, the inputs used to measure fair value may fall into different levels of the fair value hierarchy. In such cases, for disclosure purposes the level in the fair value hierarchy within which the fair value measurement is determined is based on the lowest level input that is significant to the fair value measurement in its entirety.
Fee-Based Services Revenue Recognition
Letters of Credit and Standby Letters of Credit Fee Income
Fees generated from letters of credit and standby letters of credit are deferred as a component of other liabilities and recognized in noninterest income over the commitment period using the straight-line method, based on the likelihood that the commitment being drawn down will be remote.
Other Fee Income
Credit card fees and deposit service charge fee income are recognized as earned on a monthly basis.
Stock-Based Compensation
The Company applies the provisions of ASC 718 Stock-Based Compensation. ASC 718 requires entities to recognize expense related to the fair value of stock-based compensation awards, including employee stock options. Accordingly, the Company measures the cost of employee services received in exchange for an award of equity instruments based on the grant-date fair value of the award and recognizes compensation expense on a straight-line basis over the vesting period.
Earnings Per Share
Basic and diluted earnings per share are computed based on the weighted average number of shares outstanding during each period. Diluted earnings per share reflects the potential dilution that could occur if
F-16
Table of Contents
Convertible Preferred Stock, Convertible Capital Securities, stock options or warrants were exercised, resulting in the issuance of common stock that then shared in the net income of the Company.
Our basic and diluted earnings per common share are calculated as follows:
| (In thousands except per share data) | Years ended December 31, | |||||||||||
| 2013 | 2012 | 2011 | ||||||||||
| Basic: |
||||||||||||
| Net income |
$ | 22,383 | $ | 14,372 | $ | 5,347 | ||||||
| Less: dividends on preferred stock |
250 | 250 | 250 | |||||||||
| Net income attributable to common shares |
22,133 | 14,122 | 5,097 | |||||||||
| Basic weighted-average common shares outstanding |
23,508 | 20,926 | 20,094 | |||||||||
|
|
|
|
|
|
|
|||||||
| Earnings per share—basic |
$ | 0.94 | $ | 0.67 | $ | 0.25 | ||||||
|
|
|
|
|
|
|
|||||||
| Diluted: |
||||||||||||
| Net income attributable to diluted common shares |
$ | 22,133 | $ | 14,122 | $ | 5,097 | ||||||
|
|
|
|
|
|
|
|||||||
| Basic weighted-average common shares outstanding |
23,508 | 20,926 | 20,094 | |||||||||
| Effect of dilutive employee stock options and warrants(1) |
351 | 211 | 106 | |||||||||
|
|
|
|
|
|
|
|||||||
| Diluted weighted-average common shares outstanding |
23,859 | 21,137 | 20,200 | |||||||||
|
|
|
|
|
|
|
|||||||
| Earnings per share—diluted |
$ | 0.93 | $ | 0.67 | $ | 0.25 | ||||||
|
|
|
|
|
|
|
|||||||
| (1) | Excludes anti-dilutive warrants, preferred stock and trust preferred securities representing 1,312 shares, 1,312 shares and 1,342 shares at December 31, 2013, 2012 and 2011, respectively. |
In 2010, in connection with the equity raise, the Company issued warrants to purchase 750,000 shares of common stock at any time. The exercise price of the warrants is $5.15 per share. Half of the warrants expire on February 23, 2015. The remainder expires on May 20, 2015. These warrants were valued at $1.8 million using a Black-Scholes-Merton fair value model and are included in additional paid in capital in the accompanying consolidated balance sheet.
In 2008, the Company issued Convertible Capital Securities that are convertible into common shares of the Company. The Capital Securities are convertible at $10 per share at any time after September 30, 2013, until expiration on September 30, 2038. At December 31, 2013 and 2012, the Capital Securities could be converted into 741,500 shares of common shares of the Company. Also in 2008, the Company issued Convertible Preferred Stock that is convertible at $10 per share into common shares of the Company at any time. At December 31, 2013 and December 31, 2012, the Preferred Stock could be converted into 500,000 shares of common shares of the Company.
In 2004, the organizers received warrants to purchase one additional share of common stock for every share of common stock purchased and expire 10 years after issuance. At December 31, 2013, there were 70,000 warrants outstanding with an exercise price of $10 per share. For the years ended December 31, 2013, 2012 and 2011, the warrants were not included in the calculation of fully diluted earnings per share because the estimated value of the Company’s stock price was below the strike price on the warrants.
F-17
Table of Contents
Accumulated Other Comprehensive Income (Loss)
The Company’s only components of accumulated other comprehensive income (loss) relate to unrealized gains and losses on available for sale securities and their related tax effects. Information concerning the Company’s accumulated other comprehensive income (loss) at December 31, 2013 and 2012, follows:
| (In thousands) | Years ended December 31, | |||||||
| 2013 | 2012 | |||||||
| Unrealized gains (losses) on securities available for sale |
$ | (5,020 | ) | $ | 13,295 | |||
| Related tax effect |
1,870 | (4,953 | ) | |||||
| Reclassification adjustment for (gains) losses included in net income |
(1,507 | ) | (1,828 | ) | ||||
| Related tax effect |
561 | 681 | ||||||
|
|
|
|
|
|||||
| Other comprehensive income (loss) |
$ | (4,096 | ) | $ | 7,195 | |||
|
|
|
|
|
|||||
New Accounting Pronouncements
The FASB issued Accounting Standards Update (ASU) 2011-04—Amendments to Achieve Common Fair Value Measurement and Disclosure Requirements in U.S. GAAP (Generally Accepted Accounting Principles) and IFRS (International Financial Reporting Standards), to substantially converge the guidance in U.S. GAAP and IFRS on fair value measurements and disclosures. The guidance includes provisions for application of the concepts of highest and best use and valuation premise, introduction of an option to measure groups of offsetting assets and liabilities on a net basis, incorporation of certain premiums and discounts in fair value measurement, and measurement of the fair value of certain instruments classified in shareholders’ equity. In addition, the amended guidance includes several new disclosure requirements. The adoption of this statement and update did not have a material impact on the consolidated financial statements.
In April 2011, the FASB issued ASU 2011-02, A Creditor’s Determination of Whether a Restructuring Is a Troubled Debt Restructuring, to provide creditors with additional guidance in evaluating whether a restructuring of debt is a troubled debt restructuring. The amended guidance confirms that a creditor should consider all aspects of a restructuring to determine whether it has granted a concession to the borrower. The ASU also provides guidance for evaluating whether a debtor is experiencing financial difficulties, including a requirement that creditors must consider the probability of a borrower’s default in the foreseeable future, even though the borrower may not be in default at the restructuring date. The adoption of ASU 2011-02 did not have a material impact on the Company’s financial position or results of operations.
The FASB issued ASU 2011-05, Presentation of Comprehensive Income, which requires entities to present comprehensive income either in a single continuous financial statement or in two separate but consecutive financial statements. Entities will no longer have the option under U.S. GAAP to present components of other comprehensive income (OCI) as part of the statement of changes in shareholders’ equity. In addition, the amended guidance requires entities to show the effects of items reclassified from OCI to net income on the face of the financial statements. The adoption of ASU 2011-05 did not have a material impact on the Company’s financial position or results of operations.
The FASB issued ASU 2011-12, Deferral of the Effective Date for Amendments to the Presentation of Reclassifications of Items Out of Accumulated Other Comprehensive Income in Accounting Standards Update No. 2011-05, to indefinitely defer the effective date of the requirement to reclassification adjustments from other comprehensive income (OCI) to net income by component under ASU 2011-05, Presentation of Comprehensive Income, to allow time for reconsideration of these provisions. The adoption of ASU 2011-12 did not have a material impact on the Company’s financial position or results of operations.
F-18
Table of Contents
In July 2012, the FASB issued ASU 2012-02, Testing Indefinite-Lived Intangible Assets for Impairment, which allows an entity to first assess qualitative factors to determine whether it is necessary to perform a quantitative impairment test. Under the amendment, an entity is not required to calculate the fair value of an indefinite-lived intangible asset unless the entity determines, based on qualitative assessment, that it is not more likely than not, the indefinite-lived intangible asset is impaired. The adoption of ASU 2012-02 did not have a material impact on the Company’s financial position or results of operations.
The FASB issued ASU 2013-02, Reporting of Amounts Reclassified Out of Accumulated Other Comprehensive Income, to improve the transparency of reporting reclassifications out of accumulated other comprehensive income (OCI) by requiring entities to present in one place information about significant amounts reclassified and, in some cases, to provide cross-references to related footnote disclosures. The amendments do not change the current requirements for reporting net income or OCI in the financial statements, nor do they require new information to be disclosed. The amendments should be applied prospectively and are effective for public entities in reporting periods beginning after December 15, 2012. For nonpublic companies, this revised guidance is effective on a prospective basis for interim and annual periods beginning January 1, 2014. Other than additional disclosures or a change in the presentation on the statement of comprehensive income, this revised guidance does not impact the Company’s consolidated results of operations or financial position.
In June 2013, the FASB issued ASU 2013-08, Financial Services—Investment Companies (ASC Topic 946): Amendments to the Scope, Measurement and Disclosure Requirement. This ASU modifies the guidance in ASC 946 for determining whether an entity is an investment company, as well as the measurement and disclosure requirements for investment companies. The ASU does not change current accounting where a noninvestment company parent retains the specialized accounting applied by an investment company subsidiary in consolidation. ASU 2013-08 will be applied prospectively for all periods beginning after December 15, 2013. The Company does not expect this ASU to have a material effect on results of operations or financial position.
| 3. | INVESTMENT SECURITIES |
Investment securities at December 31, 2013 and 2012, are summarized as follows:
| (In thousands) | At December 31, 2013 | |||||||||||||||
| Amortized Cost |
Gross Unrealized Gains |
Gross Unrealized Losses |
Fair Value |
|||||||||||||
| Available for sale securities: |
||||||||||||||||
| Agency Direct Obligations |
$ | 34,853 | $ | 208 | $ | — | $ | 35,061 | ||||||||
| SBA Pools |
127,309 | 1,958 | (56 | ) | 129,211 | |||||||||||
| Agency MBS |
445,855 | 4,395 | (2,400 | ) | 447,850 | |||||||||||
| Corporates |
148,288 | 1,173 | (3,644 | ) | 145,817 | |||||||||||
| Municipal Bonds |
97,532 | — | (5,503 | ) | 92,029 | |||||||||||
| Non-Agency MBS |
54,134 | 371 | (2,335 | ) | 52,170 | |||||||||||
| Other ABS |
22,787 | 112 | (808 | ) | 22,091 | |||||||||||
|
|
|
|
|
|
|
|
|
|||||||||
| Total |
$ | 930,758 | $ | 8,217 | $ | (14,746 | ) | $ | 924,229 | |||||||
|
|
|
|
|
|
|
|
|
|||||||||
| Held to maturity securities: |
||||||||||||||||
| Agency MBS |
$ | 18,666 | $ | 188 | $ | (608 | ) | $ | 18,246 | |||||||
| Municipal Bonds |
127,339 | 426 | (5,756 | ) | 122,009 | |||||||||||
| Corporates |
8,250 | — | (1,951 | ) | 6,299 | |||||||||||
| Other |
— | — | — | — | ||||||||||||
|
|
|
|
|
|
|
|
|
|||||||||
| Total |
$ | 154,255 | $ | 614 | $ | (8,315 | ) | $ | 146,554 | |||||||
|
|
|
|
|
|
|
|
|
|||||||||
F-19
Table of Contents
| (In thousands) | At December 31, 2012 | |||||||||||||||
| Amortized Cost |
Gross Unrealized Gains |
Gross Unrealized Losses |
Fair Value |
|||||||||||||
| Available for sale securities: |
||||||||||||||||
| SBA Pools |
$ | 161,364 | $ | 3,762 | $ | (6 | ) | $ | 165,120 | |||||||
| Agency MBS |
399,167 | 10,744 | (740 | ) | 409,171 | |||||||||||
| Corporates |
66,375 | 2,096 | (65 | ) | 68,406 | |||||||||||
| Municipal Bonds |
106,433 | 4,302 | — | 110,735 | ||||||||||||
| Non-Agency MBS |
26,352 | 36 | (7,372 | ) | 19,016 | |||||||||||
| Other ABS |
5,002 | — | (1,290 | ) | 3,712 | |||||||||||
|
|
|
|
|
|
|
|
|
|||||||||
| Total |
$ | 764,693 | $ | 20,940 | $ | (9,473 | ) | $ | 776,160 | |||||||
|
|
|
|
|
|
|
|
|
|||||||||
| Held to maturity securities: |
||||||||||||||||
| Agency MBS |
$ | 15,311 | $ | 549 | $ | — | $ | 15,860 | ||||||||
| Municipal Bonds |
39,594 | 263 | (467 | ) | 39,390 | |||||||||||
| Corporates |
8,227 | — | (2,377 | ) | 5,850 | |||||||||||
| Other |
3,890 | — | — | 3,890 | ||||||||||||
|
|
|
|
|
|
|
|
|
|||||||||
| Total |
$ | 67,022 | $ | 812 | $ | (2,844 | ) | $ | 64,990 | |||||||
|
|
|
|
|
|
|
|
|
|||||||||
Investment securities with a fair value of $343.7 million and $168.8 million at December 31, 2013 and 2012, respectively, were pledged to secure customer repurchase agreements and to secure prospective borrowing capacities at Union Bank, the Federal Reserve Bank, and the Federal Home Loan Bank of Atlanta.
The following tables show the gross unrealized losses and fair value of the Company’s investments with unrealized losses that are not deemed to be other-than-temporarily impaired. Investment securities contained in the table are aggregated by investment category and length of time that individual securities have been in a continuous unrealized loss position, at December 31, 2013 and 2012:
| (In thousands) | December 31, 2013 | |||||||||||||||||||||||
| Less Than 12 Months | 12 Months or Greater | Total | ||||||||||||||||||||||
| Fair Value | Unrealized Losses |
Fair Value | Unrealized Losses |
Fair Value | Unrealized Losses |
|||||||||||||||||||
| Available for sale securities: |
||||||||||||||||||||||||
| SBA Pools |
$ | 13,724 | $ | (56 | ) | $ | — | $ | — | $ | 13,724 | $ | (56 | ) | ||||||||||
| Agency MBS |
126,563 | (1,801 | ) | 24,288 | (599 | ) | 150,851 | (2,400 | ) | |||||||||||||||
| Corporates |
72,092 | (3,644 | ) | — | — | 72,092 | (3,644 | ) | ||||||||||||||||
| Municipal Bonds |
92,029 | (5,503 | ) | — | — | 92,029 | (5,503 | ) | ||||||||||||||||
| Non-Agency MBS |
22,422 | (410 | ) | 14,138 | (1,925 | ) | 36,560 | (2,335 | ) | |||||||||||||||
| Other ABS |
— | — | 4,852 | (808 | ) | 4,852 | (808 | ) | ||||||||||||||||
|
|
|
|
|
|
|
|
|
|
|
|
|
|||||||||||||
| $ | 326,830 | $ | (11,414 | ) | $ | 43,278 | $ | (3,332 | ) | $ | 370,108 | $ | (14,746 | ) | ||||||||||
|
|
|
|
|
|
|
|
|
|
|
|
|
|||||||||||||
| Held to maturity securities: |
||||||||||||||||||||||||
| Agency MBS |
$ | 13,575 | $ | (608 | ) | $ | — | $ | — | $ | 13,575 | $ | (608 | ) | ||||||||||
| Municipal Bonds |
77,344 | (3,313 | ) | 16,368 | (2,443 | ) | 93,712 | (5,756 | ) | |||||||||||||||
| Corporates |
— | — | 6,299 | (1,951 | ) | 6,299 | (1,951 | ) | ||||||||||||||||
|
|
|
|
|
|
|
|
|
|
|
|
|
|||||||||||||
| $ | 90,919 | $ | (3,921 | ) | $ | 22,667 | $ | (4,394 | ) | $ | 113,586 | $ | (8,315 | ) | ||||||||||
|
|
|
|
|
|
|
|
|
|
|
|
|
|||||||||||||
F-20
Table of Contents
| (In thousands) | December 31, 2012 | |||||||||||||||||||||||
| Less Than 12 Months | 12 Months or Greater | Total | ||||||||||||||||||||||
| Fair Value | Unrealized Losses |
Fair Value | Unrealized Losses |
Fair Value | Unrealized Losses |
|||||||||||||||||||
| Available for sale securities: |
||||||||||||||||||||||||
| SBA Pools |
$ | 6,735 | $ | (6 | ) | $ | — | $ | — | $ | 6,735 | $ | (6 | ) | ||||||||||
| Agency MBS |
79,222 | (740 | ) | — | — | 79,222 | (740 | ) | ||||||||||||||||
| Corporates |
3,320 | (65 | ) | — | — | 3,320 | (65 | ) | ||||||||||||||||
| Non-Agency MBS |
— | — | 18,713 | (7,372 | ) | 18,713 | (7,372 | ) | ||||||||||||||||
| Other ABS |
— | — | 3,641 | (1,290 | ) | 3,641 | (1,290 | ) | ||||||||||||||||
|
|
|
|
|
|
|
|
|
|
|
|
|
|||||||||||||
| Total |
$ | 89,277 | $ | (811 | ) | $ | 22,354 | $ | (8,662 | ) | $ | 111,631 | $ | (9,473 | ) | |||||||||
|
|
|
|
|
|
|
|
|
|
|
|
|
|||||||||||||
| Held to maturity securities: |
||||||||||||||||||||||||
| Municipal Bonds |
$ | 19,628 | $ | (467 | ) | $ | — | $ | — | $ | 19,628 | $ | (467 | ) | ||||||||||
| Corporates |
— | — | 5,850 | (2,377 | ) | 5,850 | (2,377 | ) | ||||||||||||||||
|
|
|
|
|
|
|
|
|
|
|
|
|
|||||||||||||
| Total |
$ | 19,628 | $ | (467 | ) | $ | 5,850 | $ | (2,377 | ) | $ | 25,478 | $ | (2,844 | ) | |||||||||
|
|
|
|
|
|
|
|
|
|
|
|
|
|||||||||||||
At December 31, 2013, there were a total of 104 available for sale securities that were in an unrealized loss position, of which 25 investments totaling $43.3 million with unrealized losses of $3.3 million had fair values less than their amortized cost for a period of time greater than 12 months. At December 31, 2012, there were a total of 42 available for sale securities that were in an unrealized loss position, of which 31 investments totaling $22.4 million with unrealized losses of $8.7 million had fair values less than their amortized cost for a period of time greater than 12 months.
The Company performs extensive ongoing evaluations of the investment portfolio at the individual bond level, including market valuations and impairment analyses. The Company had recorded $1.7 million, $1.5 million and $1.8 million of impairment on certain mortgage-related securities for the periods ended December 31, 2013, 2012 and 2011, respectively. The Company had deemed these securities permanently impaired and unlikely to receive full principal, even if the investments were held to maturity. The Company expects the remainder of the investment portfolio, based on the evaluation performed, to be paid in full and that any temporary impairment be fully recoverable prior to or at maturity. The Company has the ability and intent to hold the investment securities for a reasonable period of time sufficient for a forecasted recovery of fair value or until maturity.
F-21
Table of Contents
The amortized cost of securities at December 31, 2013, by contractual maturity is shown below. Expected maturities will differ from contractual maturities because borrowers may have the right to call or prepay obligations with or without call or prepayment penalties.
| (In thousands) | December 31, 2013 |
|||||||||||||||||||
| Total Amortized Cost |
Less than One Year Amortized Cost |
After One Year to Five Years Amortized Cost |
After Five Years to Ten Years Amortized Cost |
After TenYears Amortized Cost |
||||||||||||||||
| Available for sale securities: |
||||||||||||||||||||
| Contractual maturity |
||||||||||||||||||||
| Agency Direct Obligations |
$ | 34,853 | $ | 3,890 | $ | 30,963 | $ | — | $ | — | ||||||||||
| SBA Pools |
127,309 | — | — | 60,384 | 66,925 | |||||||||||||||
| Agency MBS |
445,855 | — | — | 29,190 | 416,665 | |||||||||||||||
| Corporates |
148,288 | — | 55,610 | 12,945 | 79,733 | |||||||||||||||
| Municipal Bonds |
97,532 | — | — | 6,002 | 91,530 | |||||||||||||||
| Non-Agency MBS |
54,134 | — | — | — | 54,134 | |||||||||||||||
| Other ABS |
22,787 | — | 17,127 | — | 5,660 | |||||||||||||||
|
|
|
|
|
|
|
|
|
|
|
|||||||||||
| Total |
$ | 930,758 | $ | 3,890 | $ | 103,700 | $ | 108,521 | $ | 714,647 | ||||||||||
|
|
|
|
|
|
|
|
|
|
|
|||||||||||
| Held to maturity securities: |
||||||||||||||||||||
| Contractual maturity |
||||||||||||||||||||
| Agency MBS |
18,666 | $ | — | $ | — | $ | — | $ | 18,666 | |||||||||||
| Municipal Bonds |
127,339 | — | — | 6,815 | 120,524 | |||||||||||||||
| Corporates |
8,250 | — | — | — | 8,250 | |||||||||||||||
|
|
|
|
|
|
|
|
|
|
|
|||||||||||
| $ | 154,255 | $ | — | $ | — | $ | 6,815 | $ | 147,440 | |||||||||||
|
|
|
|
|
|
|
|
|
|
|
|||||||||||
In 2013, six securities in the available for sale portfolio were determined to be held to maturity and were transferred into the held to maturity portfolio. The amortized cost transferred was $23.7 million. The fair value was $23.7 million. The Company determined it has the intent and, based on the the Company’s liquidity position, it has the ability to hold these securities to maturity. In 2012, one security in the available for sale portfolio was determined to be held to maturity and was transferred into the held to maturity portfolio. The security had previously been impaired and; therefore, had no carrying value and had no corresponding gain or loss.
F-22
Table of Contents
| 4. | LOANS AND ALLOWANCE FOR LOAN LOSSES |
Loans
The composition of loans, net of unearned income, broken out by portfolio segment at December 31, 2013 and 2012, are as follows:
| (In thousands) | December 31, 2013 |
December 31, 2012 |
||||||
| Commercial loans: |
||||||||
| Technology |
$ | 493,337 | $ | 416,657 | ||||
| Life sciences |
199,069 | 168,481 | ||||||
| Venture capital/private equity |
143,468 | 132,621 | ||||||
| Asset-Based Loans |
186,702 | 104,988 | ||||||
| SBA and USDA |
23,719 | 8,887 | ||||||
| Other |
1,424 | 1,406 | ||||||
|
|
|
|
|
|||||
| Total commercial loans |
1,047,719 | 833,040 | ||||||
| Real estate loans: |
||||||||
| SBA and USDA |
27,504 | 26,389 | ||||||
|
|
|
|
|
|||||
| Total real estate loans |
27,504 | 26,389 | ||||||
| Construction loans: |
||||||||
| SBA and USDA |
287 | — | ||||||
|
|
|
|
|
|||||
| Total construction loans |
287 | — | ||||||
| Credit cards |
11,575 | 7,693 | ||||||
| Less unearned income, net |
(4,549 | ) | (4,041 | ) | ||||
|
|
|
|
|
|||||
| Total loans, net of unearned income |
$ | 1,082,536 | $ | 863,081 | ||||
|
|
|
|
|
|||||
Directors and executive officers of the Company, including their immediate families and companies in which they have an interest, may be loan customers in the normal course of business. The Company had 3 loans totaling $7.5 million to these parties at December 31, 2013. The Company had 18 loans totaling $13.4 million to these parties at December 31, 2012.
During 2011, the Bank began making loans under the Small Business Administration (SBA) and United States Department of Agriculture (USDA) programs. At December 31, 2013 and 2012, the outstanding balance was $114.6 million and $82.0 million, respectively. The SBA/USDA guaranteed portion of 21 and 19 of these loans has been sold to the secondary market during 2013 and 2012, respectively. The outstanding sold balance at December 31, 2013 and 2012, was $63.1 million and $45.7 million, respectively.
The Company accounts for loan servicing rights or liabilities under Accounting Standards Codification (ASC) 860, “Transfers and Servicing.” ASC requires the Company to recognize a servicing asset or servicing liability each time it undertakes an obligation to service a financial asset. Changes in the fair value of the servicing asset are recognized in other noninterest income. The valuation methodology estimates the present value of future cash flows based on the unique characteristics of the loan, market-based assumptions for prepayment speeds, and discount rate assumptions. At December 31, 2013 and 2012, the Company recorded a servicing asset of $1.3 million and $1.0 million, respectively. The servicing asset is recorded in intangible assets in the financial statements.
F-23
Table of Contents
The following schedule summarizes the activity for servicing assets for the periods ended December 31, 2013 and 2012:
| (In thousands) | ||||||||
| December 31, 2013 |
December 31, 2012 |
|||||||
| Beginning Balance |
$ | 987 | $ | 478 | ||||
| Loans sold |
370 | 537 | ||||||
| Loans disposed of |
— | (31 | ) | |||||
| Changes in fair value |
(92 | ) | 3 | |||||
|
|
|
|
|
|||||
| Ending Balance |
$ | 1,265 | $ | 987 | ||||
|
|
|
|
|
|||||
Allowance for Loan Losses
The following tables summarize the activity in the allowance for loan losses during the years ended December 31, 2013 and 2012, broken out by portfolio segment:
| (In thousands) | December 31, 2013 | |||||||||||||||||||||||||||
| Beginning Balance |
Charge Offs |
Recoveries | Provision (Benefit) |
Ending Balance |
Ending Balance: Individually Evaluated for Impairment |
Ending Balance: Collectively Evaluated for Impairment |
||||||||||||||||||||||
| Commercial loans |
||||||||||||||||||||||||||||
| Technology |
$ | 10,548 | $ | 9,344 | $ | 699 | $ | 10,573 | $ | 12,476 | $ | 4,830 | $ | 7,646 | ||||||||||||||
| Life sciences |
804 | — | — | 1,090 | 1,894 | — | 1,894 | |||||||||||||||||||||
| Venture capital/private equity |
152 | — | — | 45 | 197 | — | 197 | |||||||||||||||||||||
| Asset Based Loans |
1,205 | — | — | 689 | 1,894 | — | 1,894 | |||||||||||||||||||||
| SBA and USDA |
381 | 269 | 150 | 365 | 627 | 132 | 495 | |||||||||||||||||||||
| Other |
4 | — | — | (2 | ) | 2 | — | 2 | ||||||||||||||||||||
|
|
|
|
|
|
|
|
|
|
|
|
|
|
|
|||||||||||||||
| Total commercial loans |
13,094 | 9,613 | 849 | 12,760 | 17,090 | 4,962 | 12,128 | |||||||||||||||||||||
| Real estate loans: |
||||||||||||||||||||||||||||
| SBA and USDA |
680 | — | — | 483 | 1,163 | 481 | 682 | |||||||||||||||||||||
|
|
|
|
|
|
|
|
|
|
|
|
|
|
|
|||||||||||||||
| Total real estate loans |
680 | — | — | 483 | 1,163 | 481 | 682 | |||||||||||||||||||||
| Construction: |
||||||||||||||||||||||||||||
| SBA and USDA |
— | — | — | 10 | 10 | — | 10 | |||||||||||||||||||||
|
|
|
|
|
|
|
|
|
|
|
|
|
|
|
|||||||||||||||
| Total construction loans |
— | — | — | 10 | 10 | — | 10 | |||||||||||||||||||||
| Credit cards |
69 | — | — | 47 | 116 | — | 116 | |||||||||||||||||||||
|
|
|
|
|
|
|
|
|
|
|
|
|
|
|
|||||||||||||||
| Total loans |
$ | 13,843 | $ | 9,613 | $ | 849 | $ | 13,300 | $ | 18,379 | $ | 5,443 | $ | 12,936 | ||||||||||||||
|
|
|
|
|
|
|
|
|
|
|
|
|
|
|
|||||||||||||||
F-24
Table of Contents
| (In thousands) | December 31, 2012 | |||||||||||||||||||||||||||
| Beginning Balance |
Charge Offs |
Recoveries | Provision (Benefit) |
Ending Balance |
Ending Balance: Individually Evaluated for Impairment |
Ending Balance: Collectively Evaluated for Impairment |
||||||||||||||||||||||
| Commercial loans |
||||||||||||||||||||||||||||
| Technology |
$ | 8,469 | $ | 4,940 | $ | 553 | $ | 6,466 | $ | 10,548 | $ | 3,338 | $ | 7,210 | ||||||||||||||
| Life sciences |
1,550 | 500 | 188 | (434 | ) | 804 | — | 804 | ||||||||||||||||||||
| Venture capital/private equity |
156 | — | — | (4 | ) | 152 | — | 152 | ||||||||||||||||||||
| Asset Based Loans |
895 | — | — | 310 | 1,205 | — | 1,205 | |||||||||||||||||||||
| SBA and USDA |
266 | 2,461 | — | 2,576 | 381 | — | 381 | |||||||||||||||||||||
| Other |
5 | — | — | (1 | ) | 4 | — | 4 | ||||||||||||||||||||
|
|
|
|
|
|
|
|
|
|
|
|
|
|
|
|||||||||||||||
| Total commercial loans |
11,341 | 7,901 | 741 | 8,913 | 13,094 | 3,338 | 9,756 | |||||||||||||||||||||
| Real estate loans: |
||||||||||||||||||||||||||||
| SBA and USDA |
245 | — | — | 435 | 680 | — | 680 | |||||||||||||||||||||
|
|
|
|
|
|
|
|
|
|
|
|
|
|
|
|||||||||||||||
| Total real estate loans |
245 | — | — | 435 | 680 | — | 680 | |||||||||||||||||||||
| Construction: |
||||||||||||||||||||||||||||
| SBA and USDA |
— | — | — | — | — | — | — | |||||||||||||||||||||
|
|
|
|
|
|
|
|
|
|
|
|
|
|
|
|||||||||||||||
| Total construction loans |
— | — | — | — | — | — | — | |||||||||||||||||||||
| Credit cards |
46 | — | — | 23 | 69 | — | 69 | |||||||||||||||||||||
|
|
|
|
|
|
|
|
|
|
|
|
|
|
|
|||||||||||||||
| Total loans |
$ | 11,632 | $ | 7,901 | $ | 741 | $ | 9,371 | $ | 13,843 | $ | 3,338 | $ | 10,505 | ||||||||||||||
|
|
|
|
|
|
|
|
|
|
|
|
|
|
|
|||||||||||||||
Credit Quality
The following table summarizes the aging of gross loans, broken out by portfolio segment at December 31, 2013 and 2012. See Note 2 for a discussion of credit quality indicators.
| (In thousands) | At December 31, 2013 | |||||||||||||||||||||||||||
| 30-59 Days Past Due |
60-89 Days Past Due |
90+ Days Past Due |
Total Loans Past Due |
Current | Total Loans | Loans 90+ Days Past Due Still Accruing |
||||||||||||||||||||||
| Commercial loans: |
||||||||||||||||||||||||||||
| Technology |
$ | 411 | $ | — | $ | 2,372 | $ | 2,783 | $ | 490,554 | $ | 493,337 | $ | — | ||||||||||||||
| Life sciences |
— | — | — | — | 199,069 | 199,069 | — | |||||||||||||||||||||
| Venture capital/private equity |
— | — | — | — | 143,468 | 143,468 | — | |||||||||||||||||||||
| Asset Based Loans |
— | — | — | — | 186,702 | 186,702 | — | |||||||||||||||||||||
| SBA and USDA |
— | — | 648 | 648 | 23,071 | 23,719 | — | |||||||||||||||||||||
| Other |
— | — | — | — | 1,424 | 1,424 | — | |||||||||||||||||||||
|
|
|
|
|
|
|
|
|
|
|
|
|
|
|
|||||||||||||||
| Total commercial loans |
411 | — | 3,020 | 3,431 | 1,044,288 | 1,047,719 | — | |||||||||||||||||||||
| Real estate loans: |
||||||||||||||||||||||||||||
| SBA and USDA |
— | — | 1,665 | 1,665 | 25,839 | 27,504 | — | |||||||||||||||||||||
|
|
|
|
|
|
|
|
|
|
|
|
|
|
|
|||||||||||||||
| Total real estate loans |
— | — | 1,665 | 1,665 | 25,839 | 27,504 | — | |||||||||||||||||||||
| Construction |
— | 287 | 287 | — | ||||||||||||||||||||||||
| Credit cards |
— | — | 95 | 95 | 11,480 | 11,575 | — | |||||||||||||||||||||
|
|
|
|
|
|
|
|
|
|
|
|
|
|
|
|||||||||||||||
| Total loans, gross |
$ | 411 | $ | — | $ | 4,780 | $ | 5,191 | $ | 1,081,894 | $ | 1,087,085 | $ | — | ||||||||||||||
|
|
|
|
|
|
|
|
|
|
|
|
|
|
|
|||||||||||||||
F-25
Table of Contents
| (In thousands) | At December 31, 2012 | |||||||||||||||||||||||||||
| 30-59 Days Past Due |
60-89 Days Past Due |
90+ Days Past Due |
Total Loans Past Due |
Current | Total Loans | Loans 90+ Days Past Due Still Accruing |
||||||||||||||||||||||
| Commercial loans: |
||||||||||||||||||||||||||||
| Technology |
$ | — | $ | — | $ | 1,460 | $ | 1,460 | $ | 415,197 | $ | 416,657 | $ | 1,460 | ||||||||||||||
| Life sciences |
— | — | — | — | 168,481 | 168,481 | — | |||||||||||||||||||||
| Venture capital/private equity |
— | — | — | — | 132,621 | 132,621 | — | |||||||||||||||||||||
| Asset Based Loans |
— | — | — | — | 104,988 | 104,988 | — | |||||||||||||||||||||
| SBA and USDA |
— | — | — | — | 8,887 | 8,887 | — | |||||||||||||||||||||
| Other |
— | — | — | — | 1,406 | 1,406 | — | |||||||||||||||||||||
|
|
|
|
|
|
|
|
|
|
|
|
|
|
|
|||||||||||||||
| Total commercial loans |
— | — | 1,460 | 1,460 | 831,580 | 833,040 | 1,460 | |||||||||||||||||||||
| Real estate loans: |
||||||||||||||||||||||||||||
| SBA and USDA |
— | — | 368 | 368 | 26,021 | 26,389 | — | |||||||||||||||||||||
|
|
|
|
|
|
|
|
|
|
|
|
|
|
|
|||||||||||||||
| Total real estate loans |
— | — | 368 | 368 | 26,021 | 26,389 | — | |||||||||||||||||||||
| Construction |
— | — | — | — | — | — | — | |||||||||||||||||||||
| Credit cards |
13 | — | — | 13 | 7,680 | 7,693 | — | |||||||||||||||||||||
|
|
|
|
|
|
|
|
|
|
|
|
|
|
|
|||||||||||||||
| Total loans, gross |
$ | 13 | $ | — | $ | 1,828 | $ | 1,841 | $ | 865,281 | $ | 867,122 | $ | 1,460 | ||||||||||||||
|
|
|
|
|
|
|
|
|
|
|
|
|
|
|
|||||||||||||||
The following tables summarize impaired loans as they relate to allowance for loan losses, broken out by portfolio segment at December 31, 2013 and 2012:
| (in thousands) | ||||||||||||||||||||
| At December 31, 2013 | ||||||||||||||||||||
| Allowance for loan losses related to impaired loans |
Impaired loans with related allowance for loan losses |
Impaired loans with no related allowance for loan losses |
Recorded investment in impaired loans |
Total of unpaid principal of impaired loans |
||||||||||||||||
| Commercial loans: |
||||||||||||||||||||
| Technology |
$ | 4,830 | $ | 12,153 | $ | — | $ | 12,153 | $ | 13,745 | ||||||||||
| SBA and USDA |
132 | 648 | — | 648 | 648 | |||||||||||||||
|
|
|
|
|
|
|
|
|
|
|
|||||||||||
| Total commercial loans |
4,962 | 12,801 | — | 12,801 | 14,393 | |||||||||||||||
| Real estate loans: |
||||||||||||||||||||
| SBA and USDA |
481 | 1,665 | — | 1,665 | 1,665 | |||||||||||||||
|
|
|
|
|
|
|
|
|
|
|
|||||||||||
| Total real estate loans |
481 | 1,665 | — | 1,665 | 1,665 | |||||||||||||||
|
|
|
|
|
|
|
|
|
|
|
|||||||||||
| Total loans, gross |
$ | 5,443 | $ | 14,466 | $ | — | $ | 14,466 | $ | 16,058 | ||||||||||
|
|
|
|
|
|
|
|
|
|
|
|||||||||||
| (in thousands) | ||||||||||||||||||||
| At December 31, 2012 | ||||||||||||||||||||
| Allowance for loan losses related to impaired loans |
Impaired loans with related allowance for loan losses |
Impaired loans with no related allowance for loan losses |
Recorded investment in impaired loans |
Total of unpaid principal of impaired loans |
||||||||||||||||
| Commercial loans: |
||||||||||||||||||||
| Technology |
$ | 3,338 | $ | 10,919 | $ | 3,230 | $ | 14,149 | $ | 14,593 | ||||||||||
| SBA and USDA |
— | — | 368 | 368 | 368 | |||||||||||||||
|
|
|
|
|
|
|
|
|
|
|
|||||||||||
| Total commercial loans |
3,338 | 10,919 | 3,598 | 14,517 | 14,961 | |||||||||||||||
|
|
|
|
|
|
|
|
|
|
|
|||||||||||
| Total loans, gross |
$ | 3,338 | $ | 10,919 | $ | 3,598 | $ | 14,517 | $ | 14,961 | ||||||||||
|
|
|
|
|
|
|
|
|
|
|
|||||||||||
F-26
Table of Contents
The following table summarizes average impaired loans, broken out by portfolio segment during 2013, 2012 and 2011.
| (in thousands) | ||||||||||||||||||||||||
| Years ended December 31, | ||||||||||||||||||||||||
| 2013 | 2012 | 2011 | ||||||||||||||||||||||
| Average recorded investment in impaired loans |
Interest income recognized |
Average recorded investment in impaired loans |
Interest income recognized |
Average recorded investment in impaired loans |
Interest income recognized |
|||||||||||||||||||
| Commercial loans: |
||||||||||||||||||||||||
| Technology |
$ | 13,926 | $ | — | $ | 10,622 | $ | — | $ | 6,682 | $ | — | ||||||||||||
| Life sciences |
— | — | 1,100 | — | 579 | — | ||||||||||||||||||
| SBA and USDA |
604 | — | — | — | — | — | ||||||||||||||||||
|
|
|
|
|
|
|
|
|
|
|
|
|
|||||||||||||
| Total commercial loans |
14,530 | — | 11,722 | — | 7,261 | — | ||||||||||||||||||
| Real estate loans: |
||||||||||||||||||||||||
| SBA and USDA |
416 | — | 496 | — | — | — | ||||||||||||||||||
|
|
|
|
|
|
|
|
|
|
|
|
|
|||||||||||||
| Total real estate loans |
416 | — | 496 | — | — | — | ||||||||||||||||||
|
|
|
|
|
|
|
|
|
|
|
|
|
|||||||||||||
| Total loans, gross |
$ | 14,946 | $ | — | $ | 12,218 | $ | — | $ | 7,261 | $ | — | ||||||||||||
|
|
|
|
|
|
|
|
|
|
|
|
|
|||||||||||||
The following table summarizes the credit quality indicators, broken out by portfolio segment at December 31, 2013 and 2012:
| (In thousands) | ||||||||||||||||
| At December 31, 2013 | ||||||||||||||||
| Pass | Performing (Criticized) |
Impaired | Total | |||||||||||||
| Commercial loans: |
||||||||||||||||
| Technology |
$ | 430,256 | $ | 50,928 | $ | 12,153 | $ | 493,337 | ||||||||
| Life sciences |
185,257 | 13,812 | — | 199,069 | ||||||||||||
| Venture capital/private equity |
143,468 | — | — | 143,468 | ||||||||||||
| Asset Based Loans |
180,460 | 6,242 | — | 186,702 | ||||||||||||
| SBA and USDA |
22,063 | 1,008 | 648 | 23,719 | ||||||||||||
| Other |
1,424 | — | — | 1,424 | ||||||||||||
|
|
|
|
|
|
|
|
|
|||||||||
| Total commercial loans |
962,928 | 71,990 | 12,801 | 1,047,719 | ||||||||||||
| Real estate loans: |
||||||||||||||||
| SBA and USDA |
19,852 | 5,987 | 1,665 | 27,504 | ||||||||||||
|
|
|
|
|
|
|
|
|
|||||||||
| Total real estate loans |
19,852 | 5,987 | 1,665 | 27,504 | ||||||||||||
| Construction |
287 | — | — | 287 | ||||||||||||
| Credit cards |
11,575 | — | — | 11,575 | ||||||||||||
|
|
|
|
|
|
|
|
|
|||||||||
| Total loans, gross |
$ | 994,642 | $ | 77,977 | $ | 14,466 | $ | 1,087,085 | ||||||||
|
|
|
|
|
|
|
|
|
|||||||||
F-27
Table of Contents
| (In thousands) | ||||||||||||||||
| At December 31, 2012 | ||||||||||||||||
| Pass | Performing (Criticized) |
Impaired | Total | |||||||||||||
| Commercial loans: |
||||||||||||||||
| Technology |
$ | 347,405 | $ | 55,103 | $ | 14,149 | $ | 416,657 | ||||||||
| Life sciences |
167,171 | 1,310 | — | 168,481 | ||||||||||||
| Venture capital/private equity |
132,621 | — | — | 132,621 | ||||||||||||
| Asset Based Loans |
103,601 | 1,387 | — | 104,988 | ||||||||||||
| SBA and USDA |
5,687 | 2,832 | 368 | 8,887 | ||||||||||||
| Other |
1,406 | — | — | 1,406 | ||||||||||||
|
|
|
|
|
|
|
|
|
|||||||||
| Total commercial loans |
757,891 | 60,632 | 14,517 | 833,040 | ||||||||||||
| Real estate loans: |
||||||||||||||||
| SBA and USDA |
22,046 | 4,343 | — | 26,389 | ||||||||||||
|
|
|
|
|
|
|
|
|
|||||||||
| Total real estate loans |
22,046 | 4,343 | — | 26,389 | ||||||||||||
| Construction |
— | — | — | — | ||||||||||||
| Credit cards |
7,693 | — | — | 7,693 | ||||||||||||
|
|
|
|
|
|
|
|
|
|||||||||
| Total loans, gross |
$ | 787,630 | $ | 64,975 | $ | 14,517 | $ | 867,122 | ||||||||
|
|
|
|
|
|
|
|
|
|||||||||
Troubled debt restructurings (“TDRs”)
Uncollateralized loans are measured for impairment based on the present value of expected future cash flows, discounted at the historical effective interest rate, while all collateral-dependent loans are measured for impairment based on the fair value of the collateral.
The following tables summarize our loans classified as TDRs, broken out by portfolio segment during the periods ended December 31, 2013 and 2012:
| (dollars in thousands) | ||||||||||||||||||||
| Year ended December 31, 2013 | ||||||||||||||||||||
| Modifications | TDRs That Subsequently Defaulted |
|||||||||||||||||||
| Number of Contracts |
Pre-Modification Outstanding Recorded Investment |
Post- Modification Outstanding Recorded Investment |
Number of Contracts |
Recorded Investment |
||||||||||||||||
| Commercial loans: |
||||||||||||||||||||
| Technology |
1 | $ | 2,522 | $ | 2,522 | 1 | $ | 545 | ||||||||||||
|
|
|
|
|
|
|
|
|
|
|
|||||||||||
| Total commercial loans |
1 | 2,522 | 2,522 | 1 | 545 | |||||||||||||||
|
|
|
|
|
|
|
|
|
|
|
|||||||||||
| Total loans, gross |
1 | $ | 2,522 | $ | 2,522 | 1 | $ | 545 | ||||||||||||
|
|
|
|
|
|
|
|
|
|
|
|||||||||||
F-28
Table of Contents
The loan identified as a TDR during the year ended December 31, 2013, was restructured to a below market interest rate. The loan is considered a nonperforming loan and, as such, was individually considered for allowance for loan losses calculations.
| (dollars in thousands) | ||||||||||||||||||||
| Year ended December 31, 2012 | ||||||||||||||||||||
| Modifications | TDRs That Subsequently Defaulted |
|||||||||||||||||||
| Number of Contracts |
Pre-Modification Outstanding Recorded Investment |
Post- Modification Outstanding Recorded Investment |
Number of Contracts |
Recorded Investment |
||||||||||||||||
| Commercial loans: |
||||||||||||||||||||
| Technology |
3 | $ | 3,183 | $ | 3,183 | 1 | $ | 1,659 | ||||||||||||
|
|
|
|
|
|
|
|
|
|
|
|||||||||||
| Total commercial loans |
3 | 3,183 | 3,183 | 1 | 1,659 | |||||||||||||||
|
|
|
|
|
|
|
|
|
|
|
|||||||||||
| Total loans, gross |
3 | $ | 3,183 | $ | 3,183 | 1 | $ | 1,659 | ||||||||||||
|
|
|
|
|
|
|
|
|
|
|
|||||||||||
The three loans identified as TDRs during the year ended December 31, 2012, were each restructured to a below market interest rate. The three loans are all considered nonperforming loans and, as such, were individually considered for allowance for loan losses calculations.
| (dollars in thousands) | ||||||||||||||||||||
| Year ended December 31, 2011 | ||||||||||||||||||||
| Modifications | TDRs That Subsequently Defaulted |
|||||||||||||||||||
| Number of Contracts |
Pre-Modification Outstanding Recorded Investment |
Post- Modification Outstanding Recorded Investment |
Number of Contracts |
Recorded Investment |
||||||||||||||||
| Commercial loans: |
||||||||||||||||||||
| Technology |
3 | $ | 2,547 | $ | 2,547 | 1 | $ | 649 | ||||||||||||
|
|
|
|
|
|
|
|
|
|
|
|||||||||||
| Total commercial loans |
3 | 2,547 | 2,547 | 1 | 649 | |||||||||||||||
|
|
|
|
|
|
|
|
|
|
|
|||||||||||
| Total loans, gross |
3 | $ | 2,547 | $ | 2,547 | 1 | $ | 649 | ||||||||||||
|
|
|
|
|
|
|
|
|
|
|
|||||||||||
Of the three loans identified as TDRs during the year ended December 31, 2011, two had an aggregate post-TDR recorded investment of $0.7 million and were each restructured to a below market interest rate. The third restructured loan had a post-TDR recorded investment of $1.8 million and was restructured to reduce the principal payments. The three loans are all considered nonperforming loans and, as such, were individually considered for allowance for loan losses calculations.
The Bank has no commitments to lend to borrowers currently with loans identified as TDRs.
F-29
Table of Contents
| 5. | PREMISES AND EQUIPMENT |
Premises and equipment at December 31, 2013 and 2012, are as follows:
| (In thousands) | At December 31, | |||||||
| 2013 | 2012 | |||||||
| Leasehold improvements |
$ | 3,411 | $ | 3,712 | ||||
| Furniture and equipment |
8,559 | 9,049 | ||||||
| Assets in progress |
528 | 109 | ||||||
|
|
|
|
|
|||||
| 12,498 | 12,870 | |||||||
| Less accumulated depreciation and amortization |
(9,437 | ) | (9,699 | ) | ||||
|
|
|
|
|
|||||
| $ | 3,061 | $ | 3,171 | |||||
|
|
|
|
|
|||||
Depreciation and amortization expense for the periods ended December 31, 2013, 2012 and 2011, amounted to $1.1 million, $1.3 million, and $1.4 million, respectively, and is included in occupancy expense on the accompanying consolidated statements of operations.
| 6. | DEPOSITS |
Time deposits in denominations of $100,000 or more were approximately $26.6 million and $15.7 million at December 31, 2013 and 2012, respectively. Interest expense paid on time deposits individually exceeding $100,000 totaled $60 thousand, $49 thousand and $55 thousand for the years ending December 31, 2013, 2012 and 2011, respectively. At December 31, 2013, time deposits scheduled to mature on or before December 31, 2014 totaled $26.5 million. Time deposits totaling $0.1 million have maturity dates that extend beyond one year.
| 7. | REPURCHASE AGREEMENTS |
Securities sold under agreements to repurchase generally mature within one to four days from the transaction date. Securities sold under agreements to repurchase are reflected at the amount of cash received in connection with the transaction. The Company may be required to provide additional collateral based on the fair value of the underlying securities. Repurchase agreements outstanding at December 31, 2013 were $12.7 million. There were no repurchase agreements outstanding at December 31, 2012.
| 8. | BORROWINGS |
The Company may purchase federal funds through unsecured federal funds lines of credit totaling $60 million. This line is intended for short-term borrowings and is subject to restrictions limiting the frequency and terms of advances. The line of credit is payable on demand and bears interest based upon the daily federal funds rate. The Company also has the ability to utilize short-term borrowings from the Federal Reserve Bank with interest based upon the Federal Reserve US Primary Credit Discount Rate. This $111.1 million line is secured by loans and investment securities. There were no outstanding borrowings for these lines at December 31, 2013 and 2012.
In addition, the Company has the ability to borrow longer term from the FHLB, with a $226.1 million line of credit available. The rate on these advances varies based on borrowing terms. Advances from this line of credit must be adequately collateralized with securities. There were no outstanding borrowings for this line at December 31, 2013. At December 31, 2012, there were $90.0 million in outstanding borrowings from the FHLB.
F-30
Table of Contents
In September 2008, the Company issued $7.4 million of convertible trust preferred securities. These securities were placed through Square 1 Financial Capital Trust I (“Trust”). The Trust holds, as its sole asset, the subordinated debentures issued by the Company. The Company does not consolidate the Trust into its consolidated financial statements. The subordinated debentures issued by the Company amounted to $7.6 million. A debt discount of $1.5 million was recorded and will be amortized over 30 years. As of December 31, 2013 and 2012, the remaining balance of the debt discount was $1.4 million and $1.4 million, respectively. The investment of $230 thousand in the common stock of the Trust is included in other assets.
The trust preferred securities pay interest at an annual rate of 8.0% and have a conversion price of $10.00 per share. The trust preferred securities have a term of 30 years and will be callable after the fifth year, with earlier calls allowed upon the occurrence of certain special events at a premium to the Company. The trust preferred securities qualify as Tier I capital for regulatory capital purposes subject to certain limitations. For the years ended December 31, 2013, 2012 and 2011, interest expense on the trust preferred securities was $0.6 million, $0.6 million and $0.6 million respectively.
| 9. | ISSUANCE OF PREFERRED STOCK |
In December 2008, the Company issued 5,000 shares of Series A, 5% Fixed Rate Cumulative Convertible Preferred Stock. Net proceeds amounted to $4.95 million. Dividends are paid quarterly, in arrears. Upon any voluntary or involuntary liquidation, the preferred stock holders then outstanding are entitled to be paid out prior to any distributions made to holders of common stock or any junior securities.
The preferred stock is convertible into shares of the Company’s common stock at the option of the holder and has a conversion price of $10.00 per share.
| 10. | ISSUANCE OF COMMON STOCK |
In May 2010, the Company issued 9,417,477 shares of common stock. Net proceeds amounted to $45.4 million.
In 2012, the Company issued 3,397,720 shares of common stock. The stock was issued in three phases during the months of September, November and December. Net proceeds amounted to $23.2 million.
In 2013, the Company issued 94,049 shares of common stock related to vesting of restricted stock units issued under the stock-based incentive compensation plan. The Company issued 26,000 shares of common stock related to the exercise of stock options issued under the stock-based incentive compensation plan.
| 11. | INCOME TAXES |
Allocation of federal and state income taxes between current and deferred portions is as follows for 2013, 2012 and 2011:
| (In thousands) | Years ended December 31, | |||||||||||
| 2013 | 2012 | 2011 | ||||||||||
| Current provision: |
||||||||||||
| Federal |
$ | 9,800 | $ | 7,130 | $ | 223 | ||||||
| State |
895 | 582 | 10 | |||||||||
| Deferred expense (benefit): |
||||||||||||
| Federal |
(868 | ) | (616 | ) | 4,026 | |||||||
| State |
207 | — | 214 | |||||||||
|
|
|
|
|
|
|
|||||||
| 10,034 | 7,096 | 4,473 | ||||||||||
|
|
|
|
|
|
|
|||||||
| Change in valuation allowance |
4 | 107 | (101 | ) | ||||||||
|
|
|
|
|
|
|
|||||||
| Total income tax expense (benefit) |
$ | 10,038 | $ | 7,203 | $ | 4,372 | ||||||
|
|
|
|
|
|
|
|||||||
F-31
Table of Contents
A reconciliation of the difference between the statutory federal income tax rate and the effective tax rates 2013, 2012 and 2011 is as follows:
| (In thousands) | Years ended December 31, |
|||||||||||
| 2013 | 2012 | 2011 | ||||||||||
| Amount of tax computed using the Federal statutory rate of 35% |
11,347 | 7,458 | 3,402 | |||||||||
| Increases (decreases) resulting from effects of: |
||||||||||||
| State taxes, net of federal benefit |
582 | 447 | 285 | |||||||||
| Valuation allowance deferred taxes |
4 | 107 | (101 | ) | ||||||||
| Other |
(1,895 | ) | (809 | ) | 786 | |||||||
|
|
|
|
|
|
|
|||||||
| Income tax expense |
10,038 | 7,203 | 4,372 | |||||||||
|
|
|
|
|
|
|
|||||||
| Effective tax rate |
31.0 | % | 33.4 | % | 45.0 | % | ||||||
|
|
|
|
|
|
|
|||||||
Significant components of deferred income tax assets and liabilities at December 31, 2013, 2012 and 2011, are as follows:
| (In thousands) | At December 31, |
|||||||
| 2013 | 2012 | |||||||
| Deferred income tax assets: |
||||||||
| Allowance for loan losses |
$ | 6,946 | $ | 5,185 | ||||
| Startup and organization expenses |
85 | 100 | ||||||
| Net operating loss carryforwards |
327 | 486 | ||||||
| Unrealized security losses |
2,432 | — | ||||||
| Depreciation |
433 | 485 | ||||||
| Impairment reserve |
2,589 | 4,652 | ||||||
| Unrealized loss on warrants |
428 | — | ||||||
| Other |
4,192 | 3,837 | ||||||
|
|
|
|
|
|||||
| Total deferred income tax assets |
17,432 | 14,745 | ||||||
| Valuation allowance |
(311 | ) | (306 | ) | ||||
|
|
|
|
|
|||||
| Net deferred income tax assets |
17,121 | 14,439 | ||||||
|
|
|
|
|
|||||
| Deferred income tax liabilities: |
||||||||
| Prepaid expenses |
(485 | ) | (335 | ) | ||||
| Debt discount |
(589 | ) | (570 | ) | ||||
| Unrealized gains on warrants |
— | (192 | ) | |||||
| Unrealized security gains |
— | (4,271 | ) | |||||
| Other |
(427 | ) | (523 | ) | ||||
|
|
|
|
|
|||||
| Total deferred income tax liabilities |
(1,501 | ) | (5,891 | ) | ||||
|
|
|
|
|
|||||
| Net deferred income tax assets |
$ | 15,620 | $ | 8,548 | ||||
|
|
|
|
|
|||||
Realization of the Company’s net deferred tax assets is dependent upon the Company generating sufficient taxable income in future years to obtain a benefit from the reversal of deductible temporary differences and from tax loss carry-forwards. The Company has concluded that, based on expected future results and the future reversals of existing taxable temporary differences, it is more likely than not that its deferred tax assets will be realized, except for a $0.3 million valuation allowance for North Carolina. The Company’s net operating loss carry-forwards will begin to expire in 2029.
F-32
Table of Contents
The Company recognizes the financial statement benefit of a tax position only after determining that the relevant tax authority would more-likely-than-not sustain the position following an audit. For tax positions meeting the more-likely-than-not threshold, the amount recognized in the financial statements is the largest benefit that has a greater than 50% likelihood of being realized upon ultimate settlement with the relevant tax authority. At December 31, 2013 and 2012, the Company did not record a liability for uncertain tax positions because no material positions existed.
The Company is generally no longer subject to the assessment of tax with respect to returns that have been filed for years prior to 2009.
| 12. | LEASES |
The Company has non-cancelable operating leases for its corporate office and loan production offices that expire at various dates through 2018. The future minimum lease payments under the non-cancelable leases for years subsequent to December 31, 2013 are as follows:
| (In thousands) | ||||
| 2014 |
$ | 2,424 | ||
| 2015 |
2,177 | |||
| 2016 |
1,445 | |||
| 2017 |
1,230 | |||
| 2018 |
— | |||
| Thereafter |
— | |||
|
|
|
|||
| $ | 7,276 | |||
|
|
|
The leases contain options to extend for various periods at most of its leased facilities. The cost of such rentals is not included above. Total rent expense for the years ended December 31, 2013, 2012 and 2011, amounted to $2.2 million, $2.2 million, and $2.2 million, respectively.
| 13. | REGULATORY MATTERS AND RESTRICTIONS |
The Company and the Bank are subject to various regulatory capital requirements administered by the federal and state banking agencies. Failure to meet minimum capital requirements can initiate certain mandatory and possibly additional discretionary, actions by regulators that, if undertaken, could have a direct material effect on the consolidated financial statements. Quantitative measures established by regulation to ensure capital adequacy require the Bank to maintain minimum amounts and ratios, as set forth in the table below. Management believes that as of December 31, 2013, the Company meets all capital requirements to which it is subject and is “well-capitalized”.
The Bank, as a North Carolina banking corporation, may pay dividends only out of undivided profits as determined pursuant to North Carolina General Statutes Section 53-87. Regulatory authorities may further limit payment of dividends by any bank when it is determined that such a limitation is in the public interest and is necessary to ensure financial soundness of the bank.
To be categorized as well capitalized, the Company and the Bank must maintain minimum amounts of capital and capital ratios. Both the Company and the Bank have met their capital adequacy requirements.
F-33
Table of Contents
The Company’s actual capital amounts and ratios at December 31, 2013 and 2012, and the minimum requirements are presented in the following table.
| (Dollars in thousands) | Minimum Requirements to be: | |||||||||||||||||||||||
| COMPANY | Actual | Adequately Capitalized | Well Capitalized | |||||||||||||||||||||
| Amount | Ratio | Amount | Ratio | Amount | Ratio | |||||||||||||||||||
| December 31, 2013 |
||||||||||||||||||||||||
| Total risk-based capital ratio |
$ | 217,345 | 13.24 | % | $ | 131,374 | 8.00 | % | 164,218 | 10.00 | % | |||||||||||||
| Tier 1 risk-based capital ratio |
198,430 | 12.08 | 65,687 | 4.00 | 98,531 | 6.00 | ||||||||||||||||||
| Tier 1 leverage ratio |
198,430 | 8.34 | 95,205 | 4.00 | 119,007 | 5.00 | ||||||||||||||||||
| December 31, 2012 |
||||||||||||||||||||||||
| Total risk-based capital ratio |
$ | 189,560 | 15.42 | % | $ | 98,369 | 8.00 | % | 122,962 | 10.00 | % | |||||||||||||
| Tier 1 risk-based capital ratio |
175,558 | 14.28 | 49,185 | 4.00 | 73,777 | 6.00 | ||||||||||||||||||
| Tier 1 leverage ratio |
175,558 | 9.53 | 73,655 | 4.00 | 92,068 | 5.00 | ||||||||||||||||||
The Bank’s actual capital amounts and ratios at December 31, 2013 and 2012, and the minimum requirements are presented in the following table.
| (Dollars in thousands) | Minimum Requirements to be: | |||||||||||||||||||||||
| BANK | Actual | Adequately Capitalized | Well Capitalized | |||||||||||||||||||||
| Amount | Ratio | Amount | Ratio | Amount | Ratio | |||||||||||||||||||
| December 31, 2013 |
||||||||||||||||||||||||
| Total risk-based capital ratio |
$ | 212,821 | 12.97 | % | $ | 131,227 | 8.00 | % | 164,033 | 10.00 | % | |||||||||||||
| Tier 1 risk-based capital ratio |
193,906 | 11.82 | 65,613 | 4.00 | 98,420 | 6.00 | ||||||||||||||||||
| Tier 1 leverage ratio |
193,906 | 8.16 | 95,053 | 4.00 | 118,817 | 5.00 | ||||||||||||||||||
| December 31, 2012 |
||||||||||||||||||||||||
| Total risk-based capital ratio |
$ | 178,144 | 14.54 | % | $ | 98,114 | 8.00 | % | 122,642 | 10.00 | % | |||||||||||||
| Tier 1 risk-based capital ratio |
164,301 | 13.40 | 49,057 | 4.00 | 73,585 | 6.00 | ||||||||||||||||||
| Tier 1 leverage ratio |
164,301 | 8.94 | 73,491 | 4.00 | 91,864 | 5.00 | ||||||||||||||||||
| 14. | RETIREMENT PLAN |
The Company approved in January 2006 the establishment of an employee benefit plan (the “Plan”) pursuant to Section 401(k) of the Internal Revenue Code for the benefit of its employees. The Plan includes provisions for discretionary employee contributions, subject to limitation under the Internal Revenue Code. Under the Plan, employees may contribute up to an annual maximum as determined by the Internal Revenue Code. During 2013 and 2012, the Company matched 100% of the first 3% of employee contributions and 50% on contributions between 3-5%. The expense related to the plan for the years ended December 31, 2013, 2012 and 2011, amounted to $0.8 million, $0.7 million and $0.5 million, respectively.
| 15. | STOCK OPTION PLAN |
The Company maintains a stock-based incentive compensation plan covering certain officers, directors and employees. Grants of options are made by the Board or the Compensation Committee. Excluding minimal exceptions, all grants must be at no less than fair market value on the date of grant, must be exercised no later than 7 years from the date of grant, and may be subject to some vesting provisions. Grants generally vest over 5 years from the date of grant. This plan provides for the issuance of up to 2,700,000 restricted stock units and options to purchase shares of the Company’s stock. At December 31, 2013, 612,715 shares of common stock remained available for future issuance through stock options or restricted stock units.
F-34
Table of Contents
The fair value of options granted in 2013, 2012, and 2011 is estimated on the date of grant using the Black-Scholes-Merton option pricing model based on the assumptions provided in the table below:
| December 31, | ||||||
| 2013 | 2012 | 2011 | ||||
| Dividend yield |
— % | — % | — % | |||
| Expected volatility |
52.58% | 38.5%-54.0% | 49.5%-53.2% | |||
| Weighted-average expected volatility |
52.58% | 48.70% | 50.73% | |||
| Risk-free interest rate |
0.65% | 0.4%-0.9% | 0.9%-2.3% | |||
| Weighted-average risk-free interest rate |
0.65% | 0.63% | 1.79% | |||
| Expected life |
5 years | 5 years | 5 years | |||
The expected volatility is based on the historical volatility of certain public entities whose operations are similar to those of the Company, as the Company does not possess sufficient historical transactions of its own shares on which to base expected volatility. The risk-free interest rate is based on the U.S. Treasury rates at the date of grant with maturity dates approximately equal to the expected life of the grant. The expected life of these options is based on evaluations of expected future employee exercise behavior. The Company has not issued dividends since the date of inception.
A summary of the activity during the years ending December 31, 2013, 2012 and 2011, of the Company’s stock option plans, including the weighted average exercise price (“WAEP”) is presented below:
| At December 31, | ||||||||||||||||||||||||
| 2013 | 2012 | 2011 | ||||||||||||||||||||||
| Shares | WAEP | Shares | WAEP | Shares | WAEP | |||||||||||||||||||
| Outstanding at beginning of year |
1,521,700 | $ | 6.11 | 1,524,650 | $ | 6.06 | 1,417,900 | $ | 6.07 | |||||||||||||||
| Granted |
1,000 | 7.50 | 413,500 | 6.36 | 424,000 | 6.00 | ||||||||||||||||||
| Exercised |
(26,000 | ) | 6.00 | — | — | — | — | |||||||||||||||||
| Forfeited |
(102,150 | ) | 6.03 | (416,450 | ) | 6.19 | (317,250 | ) | 6.00 | |||||||||||||||
|
|
|
|
|
|
|
|||||||||||||||||||
| Outstanding at end of year |
1,394,550 | $ | 6.12 | 1,521,700 | $ | 6.11 | 1,524,650 | $ | 6.06 | |||||||||||||||
|
|
|
|
|
|
|
|
|
|
|
|
|
|||||||||||||
| Options exercisable at year-end |
791,060 | $ | 6.06 | 599,390 | $ | 6.03 | 266,830 | $ | 6.35 | |||||||||||||||
|
|
|
|
|
|
|
|
|
|
|
|
|
|||||||||||||
The following table summarizes information about the Company’s stock options at December 31, 2013:
| Exercise Price |
Number Outstanding |
Weighted Average Remaining Contractual Life in Years |
Number Exercisable |
Weighted Average Remaining Contractual Life in Years |
||||||||||||
| $6.000 |
1,189,050 | 4.07 | 725,560 | 4.10 | ||||||||||||
| $6.500 |
30,000 | 3.33 | 30,000 | 3.33 | ||||||||||||
| $6.750 |
45,000 | 5.25 | 9,400 | 5.25 | ||||||||||||
| $6.875 |
130,500 | 5.66 | 26,100 | 5.66 | ||||||||||||
|
|
|
|
|
|||||||||||||
| 1,394,550 | 4.24 | 791,060 | 4.14 | |||||||||||||
|
|
|
|
|
|
|
|
|
|||||||||
At December 31, 2013 and 2012, there was not any intrinsic value associated with options exercised. Through December 31, 2013, 26,000 options have been exercised. No options were exercised during 2013 or 2012 and there was not any intrinsic value associated with options vested during 2013, 2012 or 2011.
Cash received from option exercises under the stock option plan for the years ended December 31, 2013, 2012 and 2011, was $156 thousand, $0, and $0, respectively. There was no related tax benefit recorded for the years ended December 31, 2013, 2012 and 2011.
F-35
Table of Contents
The Company’s pre-tax compensation cost for stock-based employee compensation was $1.6 million, $1.3 million, and $0.7 million for the years ended December 31, 2013, 2012, and 2011, respectively. At December 31, 2013, there was $5.3 million of unrecognized compensation cost related to non-vested stock-based compensation under this plan to be recognized over five years.
The following table provides information for restricted stock units issued under the stock-based incentive compensation plan:
| Shares | Weighted Average Grant Date Fair Value |
|||||||
| Nonvested at December 31, 2011 |
— | — | ||||||
| Granted |
313,448 | 6.875 | ||||||
| Vested |
(17,448 | ) | 6.875 | |||||
| Forfeited |
— | — | ||||||
|
|
|
|||||||
| Nonvested at December 31, 2012 |
296,000 | 6.875 | ||||||
|
|
|
|
|
|||||
| Nonvested at December 31, 2012 |
296,000 | 6.875 | ||||||
| Granted |
350,649 | 8.643 | ||||||
| Vested |
(107,356 | ) | 6.909 | |||||
| Forfeited |
(6,833 | ) | 7.170 | |||||
|
|
|
|||||||
| Nonvested at December 31, 2013 |
532,460 | 8.029 | ||||||
|
|
|
|
|
|||||
| 16. | OFF-BALANCE SHEET RISK, COMMITMENTS AND CONTINGENCIES |
To meet the financial needs of its customers, the Company is party to financial instruments with off-balance sheet risk in the normal course of business. These financial instruments were comprised of unfunded lines of credit and financial standby letters of credit. These instruments involve, to varying degrees, elements of credit risk in excess of the amounts recognized in the accompanying consolidated balance sheet.
The Company’s exposure to credit loss in the event of nonperformance by the other party is represented by the contractual amount of these instruments. The Company uses the same credit policies in making these commitments as they do for on-balance sheet instruments. The amount of collateral obtained, if deemed necessary by the Company, upon extension of credit is based on management’s credit evaluation of the borrower. Collateral held varies but may include trade accounts receivable, property, plant, and equipment. Since many of the commitments are expected to expire without being drawn upon, the total commitment amounts do not necessarily represent future cash requirements.
At December 31, 2013 and 2012, unfunded lines of credit were $977.3 million and $741.2 million, respectively and outstanding standby letters of credit amounted to $89.2 million and $83.2 million, respectively.
From time to time, the Company is party, either as a defendant or plaintiff, to lawsuits in the normal course of our business. While any litigation involves an element of uncertainty, management is of the opinion that the liability, if any, resulting from pending legal proceedings will not have a material adverse effect on our financial condition, liquidity or results of operations.
| 17. | FAIR VALUE OF FINANCIAL INSTRUMENTS |
ASC 820 defines fair value, established a framework for measuring fair value under generally accepted accounting principles and expands disclosures about fair value measurements. ASC 820 applies whenever
F-36
Table of Contents
other accounting pronouncements require or permit assets or liabilities to be measured at fair value. Accordingly, ASC 820 does not expand the use of fair value in any new circumstances. ASC 825-10 provides an option to report selected financial assets and liabilities at fair value. The Company has not elected to measure any financial assets or liabilities using the fair value option under ASC 825-10.
Investment securities are recorded at fair value on a recurring basis. Fair value measurement is based upon quoted market prices, if available. If quoted market prices are not available, fair values are measured using independent pricing models or other model-based valuation techniques such as the present value of future cash flows, adjusted for the security’s credit rating, prepayment assumptions and other factors such as credit loss assumptions.
The types of instruments valued based on quoted market prices in active markets include the Company’s U.S. government and agency securities, mortgage-backed securities and asset-backed securities (“ABS”). Such instruments are generally classified within level 1 or level 2 of the fair value hierarchy. As required by ASC 820, the Company does not adjust the quoted price for such instruments.
Level 3 valuations are for instruments that are not traded in active markets or are subject to transfer restrictions, and may be adjusted to reflect illiquidity and/or non-transferability, with such adjustment generally based on available market evidence. In the absence of such evidence, management’s best estimate is used. Such instruments in this category include some investment securities, all impaired loans, warrants and foreclosed assets.
Below is a summary of the valuation techniques used for each class of Level 3 assets:
| (Dollars in thousands) | Fair Value at December 31, 2013 |
Valuation Technique |
Unobservable Input | |||||
| Available for sale securities: |
||||||||
| Corporates |
$ | 26,301 | Sensitivity analyses | Indicative pricing | ||||
| Non-Agency MBS |
52,170 | Volatility-driven, multi-dimensional spread tables, OAS model and prepayment model | Indicative pricing, collateral performance | |||||
| Other ABS |
22,091 | Multi-dimensional, collateral specific spread tables | Indicative pricing, collateral performance | |||||
| Warrants |
5,105 | Black-Scholes option pricing model | Estimated market price, stated strike prices, option expiration prices, risk-free interest rates, option volatility assumptions | |||||
| Servicing asset |
1,265 | Discounted cash flow | Discount rates, default rates, prepayment rates, servicing costs | |||||
| Debt, venture capital and private equity fund investments |
4,066 | Private company equity pricing | Actual and forecasted results, cash position, market comparable companies | |||||
F-37
Table of Contents
| (Dollars in thousands) | Fair Value at December 31, 2012 |
Valuation Technique |
Unobservable Input | |||||
| Available for sale securities: |
||||||||
| Corporates |
$ | 11,715 | Sensitivity analyses | Indicative pricing | ||||
| Non-Agency MBS |
19,016 | Volatility-driven, multi-dimensional spread tables, OAS model and prepayment model | Indicative pricing, collateral performance | |||||
| Other ABS |
2,643 | Multi-dimensional, collateral specific spread tables | Indicative pricing, collateral performance | |||||
| Warrants |
4,781 | Black-Scholes option pricing model | Estimated market price, stated strike prices, option expiration prices, risk-free interest rates, option volatility assumptions | |||||
| Servicing asset |
987 | Discounted cash flow | Discount rates, default rates, prepayment rates, servicing costs | |||||
| Debt, venture capital and private equity fund investments |
3,303 | Private company equity pricing | Actual and forecasted results, cash position, market comparable companies | |||||
Following are tables that presents information about our investment securities, warrants, servicing asset, and debt, venture capital and private equity fund investments measured at fair value on a recurring basis:
| (In thousands) | ||||||||||||||||
| At December 31, 2013 | ||||||||||||||||
| Quoted Prices in Active Markets for Identical Assets |
Significant Other Observable Inputs |
Significant Unobservable Inputs |
Ending Balance |
|||||||||||||
| (Level 1) | (Level 2) | (Level 3) | ||||||||||||||
| Available for sale securities: |
||||||||||||||||
| Agency Direct Obligations |
$ | 35,061 | $ | — | $ | — | $ | 35,061 | ||||||||
| SBA Pools |
$ | — | $ | 129,211 | $ | — | 129,211 | |||||||||
| Agency MBS |
— | 447,850 | — | 447,850 | ||||||||||||
| Corporates |
— | 119,516 | 26,301 | 145,817 | ||||||||||||
| Municipal Bonds |
— | 92,029 | — | 92,029 | ||||||||||||
| Non-Agency MBS |
— | — | 52,170 | 52,170 | ||||||||||||
| Other ABS |
— | — | 22,091 | 22,091 | ||||||||||||
|
|
|
|
|
|
|
|
|
|||||||||
| Total available for sale securities |
$ | 35,061 | $ | 788,606 | $ | 100,562 | $ | 924,229 | ||||||||
|
|
|
|
|
|
|
|
|
|||||||||
| Warrants |
$ | — | $ | — | $ | 5,105 | $ | 5,105 | ||||||||
|
|
|
|
|
|
|
|
|
|||||||||
| Servicing asset |
$ | — | $ | — | $ | 1,265 | $ | 1,265 | ||||||||
|
|
|
|
|
|
|
|
|
|||||||||
| Debt, venture capital and private equity fund investments |
$ | — | $ | — | $ | 4,066 | $ | 4,066 | ||||||||
|
|
|
|
|
|
|
|
|
|||||||||
F-38
Table of Contents
| (In thousands) | ||||||||||||||||
| At December 31, 2012 | ||||||||||||||||
| Quoted Prices in Active Markets for Identical Assets |
Significant Other Observable Inputs |
Significant Unobservable Inputs |
Ending Balance |
|||||||||||||
| (Level 1) | (Level 2) | (Level 3) | ||||||||||||||
| Available for sale securities: |
||||||||||||||||
| SBA Pools |
$ | — | $ | 165,120 | $ | — | $ | 165,120 | ||||||||
| Agency MBS |
— | 409,171 | — | 409,171 | ||||||||||||
| Corporates |
— | 56,691 | 11,715 | 68,406 | ||||||||||||
| Municipal Bonds |
— | 110,735 | — | 110,735 | ||||||||||||
| Non-Agency MBS |
— | — | 19,016 | 19,016 | ||||||||||||
| Other ABS |
— | 1,069 | 2,643 | 3,712 | ||||||||||||
|
|
|
|
|
|
|
|
|
|||||||||
| Total available for sale securities |
$ | — | $ | 742,786 | $ | 33,374 | $ | 776,160 | ||||||||
|
|
|
|
|
|
|
|
|
|||||||||
| Warrants |
$ | — | $ | — | $ | 4,781 | $ | 4,781 | ||||||||
|
|
|
|
|
|
|
|
|
|||||||||
| Servicing asset |
$ | — | $ | — | $ | 987 | $ | 987 | ||||||||
|
|
|
|
|
|
|
|
|
|||||||||
| Debt, venture capital and private equity fund investments |
$ | — | $ | — | $ | 3,303 | $ | 3,303 | ||||||||
|
|
|
|
|
|
|
|
|
|||||||||
Following is a table that presents information about our foreclosed assets measured at fair value on a non-recurring basis:
| (In thousands) | ||||||||||||||||
| Quoted Prices in Active Markets for Identical Assets (Level 1) |
Significant Other Observable Inputs (Level 2) |
Significant Unobservable Inputs (Level 3) |
Ending Balance |
|||||||||||||
| December 31, 2013 |
||||||||||||||||
| Foreclosed assets |
$ | — | $ | — | $ | 119 | $ | 119 | ||||||||
|
|
|
|
|
|
|
|
|
|||||||||
| Impaired loans |
$ | — | $ | — | $ | 9,022 | $ | 9,022 | ||||||||
|
|
|
|
|
|
|
|
|
|||||||||
| December 31, 2012 |
||||||||||||||||
| Foreclosed assets |
$ | — | $ | — | $ | 119 | $ | 119 | ||||||||
|
|
|
|
|
|
|
|
|
|||||||||
| Impaired loans |
$ | — | $ | — | $ | 11,179 | $ | 11,179 | ||||||||
|
|
|
|
|
|
|
|
|
|||||||||
F-39
Table of Contents
The following table presents additional information about Level 3 securities, impaired loans, warrants and servicing assets measured at fair value on a recurring basis.
| (dollars in thousands) | Available for sale securities | |||||||||||||||||||||||||||
| Corporates | Non-Agency MBS |
Other ABS |
Debt, Venture Capital and Private Equity Fund Investments |
Servicing Asset |
Warrants | Total | ||||||||||||||||||||||
| Balance at December 31, 2010 |
$ | — | $ | — | $ | — | $ | — | $ | — | $ | 5,788 | $ | 5,788 | ||||||||||||||
| Transfers into Level 3 |
— | — | — | 1,501 | — | — | 1,501 | |||||||||||||||||||||
| Transfers out of Level 3 |
— | — | — | — | — | — | — | |||||||||||||||||||||
| Total gains (losses) |
— | — | — | 1,546 | (49 | ) | 1,084 | 2,581 | ||||||||||||||||||||
| included in other comprehensive income |
— | — | — | — | — | — | — | |||||||||||||||||||||
| Purchases, sales, issuances and settlements |
||||||||||||||||||||||||||||
| Purchases |
— | — | — | 623 | — | — | 623 | |||||||||||||||||||||
| Sales |
— | — | — | — | — | (2,515 | ) | (2,515 | ) | |||||||||||||||||||
| Issuances |
— | — | — | — | 527 | 1,574 | 2,101 | |||||||||||||||||||||
| Settlements |
— | — | — | (202 | ) | — | — | (202 | ) | |||||||||||||||||||
|
|
|
|
|
|
|
|
|
|
|
|
|
|
|
|||||||||||||||
| Balance at December 31, 2011 |
$ | — | $ | — | $ | — | $ | 3,468 | $ | 478 | $ | 5,931 | $ | 9,877 | ||||||||||||||
|
|
|
|
|
|
|
|
|
|
|
|
|
|
|
|||||||||||||||
| Transfers into Level 3 |
11,388 | 26,353 | 3,161 | — | — | — | 40,902 | |||||||||||||||||||||
| Transfers out of Level 3 |
— | — | — | — | — | — | — | |||||||||||||||||||||
| Total gains (losses) |
— | — | — | (188 | ) | (28 | ) | (73 | ) | (289 | ) | |||||||||||||||||
| included in other comprehensive income |
327 | (7,337 | ) | (518 | ) | — | — | — | (7,528 | ) | ||||||||||||||||||
| Purchases, sales, issuances and settlements |
||||||||||||||||||||||||||||
| Purchases |
— | — | — | 421 | — | — | 421 | |||||||||||||||||||||
| Sales |
— | — | — | — | — | (2,058 | ) | (2,058 | ) | |||||||||||||||||||
| Issuances |
— | — | — | — | 537 | 980 | 1,517 | |||||||||||||||||||||
| Settlements |
— | — | — | (398 | ) | — | — | (398 | ) | |||||||||||||||||||
|
|
|
|
|
|
|
|
|
|
|
|
|
|
|
|||||||||||||||
| Balance at December 31, 2012 |
$ | 11,715 | $ | 19,016 | $ | 2,643 | $ | 3,303 | $ | 987 | $ | 4,780 | $ | 42,444 | ||||||||||||||
|
|
|
|
|
|
|
|
|
|
|
|
|
|
|
|||||||||||||||
| Transfers into Level 3 |
3,680 | — | 1,467 | — | — | — | 5,147 | |||||||||||||||||||||
| Transfers out of Level 3 |
— | — | — | — | — | — | — | |||||||||||||||||||||
| Total gains (losses) |
— | — | — | 1,140 | (92 | ) | 3,750 | 4,798 | ||||||||||||||||||||
| included in other comprehensive income |
3,989 | 1,964 | — | — | — | — | 5,953 | |||||||||||||||||||||
| Purchases, sales, issuances and settlements |
||||||||||||||||||||||||||||
| Purchases |
6,917 | 31,268 | 17,981 | 379 | — | — | 56,545 | |||||||||||||||||||||
| Sales |
— | (78 | ) | — | — | — | (5,290 | ) | (5,368 | ) | ||||||||||||||||||
| Issuances |
— | — | — | — | 370 | 1,865 | 2,235 | |||||||||||||||||||||
| Settlements |
— | — | — | (756 | ) | — | — | (756 | ) | |||||||||||||||||||
|
|
|
|
|
|
|
|
|
|
|
|
|
|
|
|||||||||||||||
| Balance at December 31, 2013 |
$ | 26,301 | $ | 52,170 | $ | 22,091 | $ | 4,066 | $ | 1,265 | $ | 5,105 | $ | 110,998 | ||||||||||||||
|
|
|
|
|
|
|
|
|
|
|
|
|
|
|
|||||||||||||||
F-40
Table of Contents
During 2013, three available for sale securities were transferred from Level 2 due to lack of observable inputs to substantiate a Level 2 valuation.
Investments in Entities that Calculate Net Asset Value Per Share
FASB guidance (ASC 825-10-50-6A) requires disclosures about the fair value measurements of investments in certain entities that calculate net asset value per share or its equivalents. These disclosures include the fair value of funds; significant investment strategies of the investees; for investments that cannot be redeemed, estimates of the time periods over which underlying assets are expected to be liquidated; the amounts of the Company’s unfunded commitments; redemption features of the investments; restrictions on the ability to sell the investments; and information of about sales in certain circumstances.
The Company has investments in debt, venture capital and private equity funds that calculate net asset value per share. The Company’s investments in debt, venture capital and private equity funds generally cannot be redeemed. Alternatively, the Company expects distributions, if any, to be received primarily through M&A activity and IPOs of the underlying assets of the fund. The Company currently does not have any plans to sell any of these fund investments. If the Company decides to sell these investments in the future, generally the investee fund’s management must approve of the buyer before the sale of the investments can be completed. The fair values of the fund investments have been estimated using the net asset value per share of the investments, adjusted for any differences between our measurement date and the date of the fund investment’s net asset value based on the most recently available financial information from the investee general partner. The most recently available financial information is generally as of the end of the previous quarter. For example, the Company’s December 31, 2013 consolidated financial statements reflect the September 30, 2013 financial information from the investee general partner, adjusted for any contributions paid, distributions received from the investment, and significant fund transactions or market events during the reporting period.
The following table is a summary of the estimated fair values of these investments and remaining unfunded commitments for these investments at December 31, 2013:
| (In thousands) | Carrying Value | Fair Value | Unfunded Commitments |
|||||||||
| Debt, venture capital and private equity fund investments |
$ | 4,066 | $ | 4,066 | $ | 1,006 | ||||||
|
|
|
|
|
|
|
|||||||
| Total |
$ | 4,066 | $ | 4,066 | $ | 1,006 | ||||||
|
|
|
|
|
|
|
|||||||
Debt, venture capital and private equity fund investments include investments made by Square 1 Financial, Inc. and Square 1 Bank. These investments represent commitments to debt, venture capital and private equity funds that invest in or lend money to primarily U.S. and global technology and life sciences companies and invest in U.S. based venture capital funds themselves. It is estimated that the Company will receive distributions from the fund investments over the next 10 to 13 years, depending on the age of the funds and any potential extensions of terms of the funds.
Financial Instruments Not Carried at Fair Value
FASB issued guidance over financial instruments (ASC 825-10-65) requires that we disclose estimated fair values for our financial instruments not carried at fair value. Fair value estimates, methods and assumptions, set forth below for our financial instruments, are made solely to comply with the requirements of ASC 825.
Fair values are based on estimates or calculations at the transaction level using present value techniques in instances where quoted market prices are not available. Because broadly traded markets do not exist for
F-41
Table of Contents
many of our financial instruments, the fair value calculations attempt to incorporate the effect of current market conditions at a specific time. Fair valuations are management’s estimates of the values, and they are calculated based on indicator prices corroborated by observable market quotes or pricing models, the economic and competitive environment, the characteristics of the financial instruments, expected losses, and other such factors.
These calculations are subjective in nature, involve uncertainties and matters of significant judgment, and do not include tax ramifications; therefore, the results cannot be determined with precision or substantiated by comparison to independent markets, and they may not be realized in an actual sale or immediate settlement of the instruments. There may be inherent weaknesses in any calculation technique, and changes in the underlying assumptions used, including discount rates and estimates of future cash flows, could significantly affect the results. For all of these reasons, the aggregation of the fair value calculations presented herein does not represent, and should not be construed to represent, the underlying value of the Company.
The following describes the methods and assumptions used in estimating the fair values of financial instruments, excluding financial instruments already recorded at fair value as described above.
Cash and due from banks, federal funds sold and short-term investments
The carrying amounts for cash and due from banks, federal funds sold and short-term investments approximate fair value because of the short maturities of those instruments.
Loans
The fair value of the net loan portfolio has been estimated based on management’s assumptions with respect to present value of expected cash flows, discounted at an interest rate giving consideration to estimated prepayment risk and credit loss factors. There is no material difference between carrying value and fair value of loans.
Investment securities—held to maturity
The fair value of investment securities held to maturity are based on quoted prices in markets that are not active or for which all significant inputs are observable, directly or indirectly.
FHLB stock
The carrying amount of FHLB stock approximates fair value as it is not practicable to determine the fair value due to restrictions placed on its transferability.
Accrued Interest Receivable
The carrying amount of accrued interest receivable approximates fair value due to the short-term nature of the balance.
Deposits
The fair value of deposits with no stated maturities are predominately at variable rates and, accordingly, the fair values have been estimated to equal the carrying amounts (the amount payable on demand). The fair values of certificates of deposits are estimated by discounting the future cash flows using the current rates offered for similar deposits with the same remaining maturities.
F-42
Table of Contents
Short-term borrowings
The Company’s short-term borrowings include securities sold under repurchase agreements, federal funds purchased and short-term lines of credit. The carrying amount is a reasonable estimate of fair value because of the relatively short time between the origination of the borrowing and its contractual maturity.
Long-term debt
The Company’s long-term debt includes the Company’s convertible subordinated debentures. Fair value of long-term debt is estimated by discounting the future cash flows using current rates offered with the same maturities, price indications from reputable dealers or utilizing observable market prices of the underlying instrument, whichever is deemed more reliable.
Financial instruments with off-balance sheet risk
With regard to financial instruments with off-balance sheet risk discussed in Note 16, the fair value of future financing commitments is immaterial.
The following tables present the estimated fair values of our financial instruments that are not carried at fair value:
| (In thousands) | ||||||||||||||||||||
| At December 31, 2013 | ||||||||||||||||||||
| Carrying Value |
Quoted Prices in Active Markets for Identical Assets (Level 1) |
Significant Other Observable Inputs (Level 2) |
Significant Unobservable Inputs (Level 3) |
Ending Balance |
||||||||||||||||
| Financial assets: |
||||||||||||||||||||
| Cash and cash equivalents |
$ | 105,730 | $ | 105,730 | $ | — | $ | — | $ | 105,730 | ||||||||||
| Investment in time deposits |
1,250 | 1,250 | — | — | 1,250 | |||||||||||||||
| Investment securities—held to maturity |
154,255 | — | 140,255 | 6,300 | 146,555 | |||||||||||||||
| Loans, net of unearned income |
1,082,536 | — | — | 1,088,062 | 1,088,062 | |||||||||||||||
| FHLB stock |
2,162 | — | — | 2,162 | 2,162 | |||||||||||||||
| Accrued interest receivable |
9,023 | — | 9,023 | — | 9,023 | |||||||||||||||
| Financial liabilities: |
||||||||||||||||||||
| Non-maturity deposits(1) |
2,079,909 | 2,046,398 | — | — | 2,046,398 | |||||||||||||||
| Time deposits |
26,818 | — | 26,851 | — | 26,851 | |||||||||||||||
| Short-term borrowings |
— | — | — | — | — | |||||||||||||||
| Long-term debt |
6,207 | — | 5,753 | — | 5,753 | |||||||||||||||
| Off-balance sheet financial assets: |
— | |||||||||||||||||||
| Future financing commitments |
— | — | — | 977,262 | 977,262 | |||||||||||||||
| (1) | Includes noninterest demand deposits, interest-bearing demand deposits and money market deposits. |
F-43
Table of Contents
| (In thousands) | ||||||||||||||||||||
| At December 31, 2012 | ||||||||||||||||||||
| Carrying Value |
Quoted Prices in Active Markets for Identical Assets (Level 1) |
Significant Other Observable Inputs (Level 2) |
Significant Unobservable Inputs (Level 3) |
Ending Balance |
||||||||||||||||
| Financial assets: |
||||||||||||||||||||
| Cash and cash equivalents |
$ | 48,971 | $ | 48,971 | $ | — | $ | — | $ | 48,971 | ||||||||||
| Investment in time deposits |
1,251 | 1,251 | — | — | 1,251 | |||||||||||||||
| Investment securities—held to maturity |
67,022 | — | 59,140 | 5,850 | 64,990 | |||||||||||||||
| Loans, net of unearned income |
863,081 | — | — | 861,203 | 861,203 | |||||||||||||||
| FHLB stock |
6,517 | — | — | 6,517 | 6,517 | |||||||||||||||
| Accrued interest receivable |
7,272 | — | 7,272 | — | 7,272 | |||||||||||||||
| Financial liabilities: |
||||||||||||||||||||
| Non-maturity deposits(1) |
1,503,476 | 1,503,476 | — | — | 1,503,476 | |||||||||||||||
| Time deposits |
15,853 | — | 15,718 | — | 15,718 | |||||||||||||||
| Short-term borrowings |
90,000 | 90,000 | — | — | 90,000 | |||||||||||||||
| Long-term debt |
6,204 | — | 6,686 | — | 6,686 | |||||||||||||||
| Off-balance sheet financial assets: |
— | |||||||||||||||||||
| Future financing commitments |
— | — | — | 815,200 | 815,200 | |||||||||||||||
| (1) | Includes noninterest demand deposits, interest-bearing demand deposits and money market deposits. |
| 18. | SUBSEQUENT EVENTS |
Subsequent events were evaluated through February 28, 2014, the date these financial statements were available to be issued.
F-44
Table of Contents
5,881,126 Shares
|
|
|
Common Stock
PROSPECTUS
|
SANDLER O’NEILL + PARTNERS, L.P. |
|
The date of this prospectus is [·], 2014
Through and including [·], 2014 (25 days after the date of this prospectus), all dealers that buy, sell or trade our common stock, whether or not participating in this offering, may be required to deliver a prospectus. This delivery requirement is in addition to the obligation of dealers to deliver a prospectus when acting as underwriters and with respect to their unsold allotments or subscriptions.
Table of Contents
PART II
INFORMATION NOT REQUIRED IN PROSPECTUS
| Item 13. | Other Expenses of Issuance and Distribution. |
The following table sets forth the various fees and expenses, other than underwriting discounts and commissions and expenses, to be incurred in connection with the preparation of this Registration Statement and the sale and distribution of the common stock being registered hereby, all of which will be borne by us. All amounts shown are estimates except the SEC and FINRA filing fees.
| SEC filing fee |
$ | 7,406 | ||
| FINRA filing fee |
$ | 9,125 | ||
| EDGAR and printing |
$ | 60,000 | ||
| Legal fees and expenses |
$ | 700,000 | ||
| Accounting fees and expenses |
$ | 350,000 | ||
|
|
|
|||
| Total |
$ | 1,126,531 | ||
|
|
|
| Item 14. | Indemnification of Directors and Officers. |
Articles TENTH and ELEVENTH of the Company’s Amended and Restated Certificate of Incorporation provide as follows:
TENTH:
A. Each person who was or is made a party or is threatened to be made a party to or is otherwise involved in any action, suit or proceeding, whether civil, criminal, administrative or investigative (hereinafter a “proceeding”), by reason of the fact that he or she is or was a Director or an Officer of the Corporation or is or was serving at the request of the Corporation as a Director, Officer, employee or agent of another corporation or of a partnership, joint venture, trust or other enterprise, including service with respect to an employee benefit plan (hereinafter an “indemnitee”), whether the basis of such proceeding is alleged action in an official capacity as a Director, Officer, employee or agent or in any other capacity while serving as a Director, Officer, employee or agent, shall be indemnified and held harmless by the Corporation to the fullest extent authorized by the Delaware General Corporation Law, as the same exists or may hereafter be amended (but, in the case of any such amendment, only to the extent that such amendment permits the Corporation to provide broader indemnification rights than such law permitted the Corporation to provide prior to such amendment), against all expense, liability and loss (including attorneys’ fees, judgments, fines, ERISA excise taxes or penalties and amounts paid in settlement) reasonably incurred or suffered by such indemnitee in connection therewith; provided, however, that, except as provided in Section C hereof with respect to proceedings to enforce rights to indemnification, the Corporation shall indemnify any such indemnitee in connection with a proceeding (or part thereof) initiated by such indemnitee only if such proceeding (or part thereof) was authorized by a majority vote of the Directors who are not parties to such proceeding, even though less than a quorum.
B. The right to indemnification conferred in Section A of this Article TENTH shall include the right to be paid by the Corporation the expenses incurred in defending any such proceeding in advance of its final disposition (hereinafter an “advancement of expenses”); provided, however, that, if the Delaware General Corporation Law requires, an advancement of expenses incurred by an indemnitee in his or her capacity as a Director or Officer (and not in any other capacity in which service was or is rendered by such indemnitee, including, without limitation, services to an employee benefit plan) shall be made only upon delivery to the Corporation of an undertaking (hereinafter an “undertaking”), by or on behalf of such indemnitee, to repay all amounts so advanced if it shall ultimately be determined by final judicial decision from which there is no further right to appeal (hereinafter a “final adjudication”) that such indemnitee is not entitled to be indemnified for such expenses under this Section or otherwise. The rights to indemnification and to the advancement of expenses conferred in Sections A and B of this Article TENTH shall be contract rights and such rights shall continue as to an indemnitee who has ceased to be a Director, Officer, employee or agent and shall inure to the benefit of the indemnitee’s heirs, executors and administrators.
C. If a claim under Section A or B of this Article TENTH is not paid in full by the Corporation within sixty days after a written claim has been received by the Corporation, except in the case of a claim for an advancement of expenses, in which case the applicable period shall be twenty days, the indemnitee may at any time thereafter bring suit against the Corporation to recover the unpaid amount of the claim. If successful in whole or in part in any such suit, or in a suit brought by the Corporation to recover an advancement of expenses pursuant to the terms of an undertaking, the indemnitee shall be entitled to be paid also the expenses of prosecuting or defending such suit. In (i) any suit brought by
Table of Contents
the indemnitee to enforce a right to indemnification hereunder (but not in a suit brought by the indemnitee to enforce a right to an advancement of expenses) it shall be a defense that, and (ii) in any suit by the Corporation to recover an advancement of expenses pursuant to the terms of an undertaking the Corporation shall be entitled to recover such expenses upon a final adjudication that, the indemnitee has not met any applicable standard for indemnification set forth in the Delaware General Corporation Law. Neither the failure of the Corporation (including its Board of Directors, independent legal counsel, or its stockholders) to have made a determination prior to the commencement of such suit that indemnification of the indemnitee is proper in the circumstances because the indemnitee has met the applicable standard of conduct set forth in the Delaware General Corporation Law, nor an actual determination by the Corporation (including its Board of Directors, independent legal counsel, or its stockholders) that the indemnitee has not met such applicable standard of conduct, shall create a presumption that the indemnitee has not met the applicable standard of conduct or, in the case of such a suit brought by the indemnitee, be a defense to such suit. In any suit brought by the indemnitee to enforce a right to indemnification or to an advancement of expenses hereunder, or by the Corporation to recover an advancement of expenses pursuant to the terms of an undertaking, the burden of proving that the indemnitee is not entitled to be indemnified, or to such advancement of expenses, under this Article TENTH or otherwise shall be on the Corporation.
D. The rights to indemnification and to the advancement of expenses conferred in this Article TENTH shall not be exclusive of any other right which any person may have or hereafter acquire under any statute, the Corporation’s Certificate of Incorporation, Bylaws, agreement, vote of stockholders or Disinterested Directors or otherwise.
E. The Corporation may maintain insurance, at its expense, to protect itself and any Director, Officer, employee or agent of the Corporation or subsidiary or Affiliate or another corporation, partnership, joint venture, trust or other enterprise against any expense, liability or loss, whether or not the Corporation would have the power to indemnify such person against such expense, liability or loss under the Delaware General Corporation Law.
F. The Corporation may, to the extent authorized from time to time by a majority vote of the Directors who are not parties to such proceeding, even though less than a quorum, grant rights to indemnification and to the advancement of expenses to any employee or agent of the Corporation to the fullest extent of the provisions of this Article TENTH with respect to the indemnification and advancement of expenses of Directors and Officers of the Corporation.
ELEVENTH: A Director of this Corporation shall not be personally liable to the Corporation or its stockholders for monetary damages for breach of fiduciary duty as a Director, except for liability: (i) for any breach of the Director’s duty of loyalty to the Corporation or its stockholders; (ii) for acts or omissions not in good faith or which involve intentional misconduct or a knowing violation of law; (iii) under Section 174 of the Delaware General Corporation Law; or (iv) for any transaction from which the Director derived an improper personal benefit. If the Delaware General Corporation Law is amended to authorize corporate action further eliminating or limiting the personal liability of Directors, then the liability of a Director of the Corporation shall be eliminated or limited to the fullest extent permitted by the Delaware General Corporation Law, as so amended.
Any repeal or modification of the foregoing paragraph by the stockholders of the Corporation shall not adversely affect any right or protection of a Director of the Corporation existing at the time of such repeal or modification.
| Item 15. | Recent Sales of Unregistered Securities. |
The following sets forth information regarding unregistered securities that were sold by the Registrant within the past three years.
Between September and December 2012, we sold 1,443,975 shares of our Class A common stock in a private placement to institutional and accredited investors and to certain of our officers and directors, generating gross proceeds of approximately $9.9 million. In addition, during that same period, we also sold 1,936,297 of our Class B nonvoting common stock to institutional investors generating gross proceeds of approximately $13.3 million. There were no underwriting discounts or commissions on these sales.
The issuances of securities described above were made in reliance upon exemptions from federal securities registration under Section 4(2) of the Securities Act, and Rule 506 thereunder, as transactions not constituting a public offering of securities because the shares were issued privately without general solicitation.
Table of Contents
| Item 16. | Exhibits and Financial Statement Schedules. |
The exhibits filed as a part of this Registration Statement are as follows:
| (a) | List of Exhibits |
Some of the agreements included as exhibits to this registration statement contain representations and warranties by the parties to the applicable agreement. These representations and warranties were made solely for the benefit of the other parties to the applicable agreement and (1) were not intended to be treated as categorical statements of fact, but rather as a way of allocating the risk to one of the parties if those statements prove to be inaccurate; (2) may have been qualified in such agreement by disclosures that were made to the other party in connection with the negotiation of the applicable agreement; (3) may apply contract standards of “materiality” that are different from “materiality” under the applicable securities laws; and (4) were made only as of the date of the applicable agreement or such other date or dates as may be specified in the agreement.
| Exhibit |
Description |
Location | ||
| 1.1 | Underwriting Agreement between Square 1 Financial, Inc., Square 1 Bank and Sandler O’Neill & Partners, L.P. | Previously filed | ||
| 3.1 | Amended and Restated Certificate of Incorporation of Square 1 Financial, Inc. | Previously filed | ||
| 3.2 | Bylaws of Square 1 Financial, Inc. | Previously filed | ||
| 4.1 | Specimen Stock Certificate for Class A Common Stock of Square 1 Financial, Inc. | Previously filed | ||
| 5.1 | Opinion of Kilpatrick Townsend & Stockton LLP regarding legality | Filed herewith | ||
| 10.1 | Square 1 Bank Amended and Restated Corporate Incentive Plan+ | Previously filed | ||
| 10.2 | Square 1 Financial, Inc. 2009 Stock Incentive Plan+ | Previously filed | ||
| 10.3 | Employment Agreement by and between Square 1 Financial, Inc., Square 1 Bank and Douglas H. Bowers, as amended+ | Previously filed | ||
| 10.4 | Employment Agreement by and between Square 1 Financial, Inc., Square 1 Bank and Samir Bhaumik, as amended+ | Previously filed | ||
| 10.5 | Employment Agreement by and between Square 1 Financial, Inc., Square 1 Bank and Diane Earle, as amended+ | Previously filed | ||
| 10.6 | Amended and Restated Employment Agreement by and between Square 1 Financial, Inc., Square 1 Bank and Judith E. Erwin+ | Previously filed | ||
| 10.7 | Employment Agreement by and between Square 1 Financial, Inc., Square 1 Bank and Patrick Oakes, as amended+ | Previously filed | ||
| 10.8 | Employment Agreement by and between Square 1 Financial, Inc., Square 1 Bank and Gregory Thompson, as amended+ | Previously filed | ||
| 10.9 | Amended and Restated Employment Agreement by and between Square 1 Financial, Inc., Square 1 Bank and Christopher Woolley, as amended+ | Previously filed | ||
| 10.10 | Square 1 Bank and Square 1 Financial, Inc. Amended and Restated Warrant Incentive Compensation Plan+ | Previously filed | ||
| 10.11 | Stock Purchase Agreement, dated March 2, 2010, as amended, between Square 1 Financial Inc. and each of Northaven Partners, L.P., Northaven Partners II, L.P., Northaven Offshore, Ltd. and Northaven Capital Partners, L.P. | Previously filed | ||
| 10.12 | Registration Rights Agreement, dated March 2, 2010, between Square 1 Financial Inc. and each of Northaven Partners, L.P., Northaven Partners II, L.P., Northaven Offshore, Ltd. and Northaven Capital Partners, L.P. | Previously filed | ||
Table of Contents
| Exhibit |
Description |
Location | ||
| 10.13 | Stock Purchase Agreement, dated September 26, 2012, between Square 1 Financial, Inc. and each of Patriot Financial Partners, L.P., Patriot Financial Partners Parallel, L.P., Endicott Opportunity Partners III, L.P. and Castle Creek Capital Partners IV, L.P. | Previously filed | ||
| 10.14 | Registration Rights Agreement, dated September 26, 2012, between Square 1 Financial Inc. and each of Basswood Opportunity Partners, L.P., Basswood Opportunity Fund, Inc., Basswood Financial Fund, L.P., Basswood Financial Enhanced Fund, L.P., Patriot Financial Partners, L.P., Patriot Financial Partners Parallel, L.P., Endicott Opportunity Partners III, L.P. and Castle Creek Partners IV, L.P. | Previously filed | ||
| 10.15 | Guarantee Agreement between Square 1 Financial, Inc. and Wilmington Trust Company, dated September 30, 2008 | Previously filed | ||
| 10.16 | Form of Debt Security | Previously filed | ||
| 10.17 | Split Dollar Life Insurance Agreement by and between Square 1 Bank and Douglas H. Bowers+ | Previously filed | ||
| 10.18 | Split Dollar Life Insurance Agreement by and between Square 1 Bank and Judith Erwin+ | Previously filed | ||
| 10.19 | Split Dollar Life Insurance Agreement by and between Square 1 Bank and Gregory Thompson+ | Previously filed | ||
| 10.20 | Split Dollar Life Insurance Agreement by and between Square 1 Bank and Patrick Oakes+ | Previously filed | ||
| 21.0 | List of Subsidiaries | Previously filed | ||
| 23.1 | Consent of Grant Thornton | Filed herewith | ||
| 23.2 | Consent of Kilpatrick Townsend & Stockton LLP | Contained in Exhibit 5.1 | ||
| 24.0 | Power of Attorney | Previously filed | ||
| + | Management contract or compensation plan or arrangement. |
| (b) | Financial Statement Schedules |
All schedules have been omitted as not applicable or not required under the rules of Regulation S-X.
| Item 17. | Undertakings. |
The undersigned registrant hereby undertakes to provide to the underwriters at the closing specified in the underwriting agreement certificates in such denominations and registered in such names as required by the underwriters to permit prompt delivery to each purchaser.
Insofar as indemnification for liabilities arising under the Securities Act of 1933 may be permitted to directors, officers and controlling persons of the registrant pursuant to the foregoing provisions, or otherwise, the registrant has been advised that in the opinion of the Securities and Exchange Commission, such indemnification is against public policy as expressed in the Securities Act and is, therefore, unenforceable. In the event that a claim for indemnification against such liabilities (other than the payment by the registrant of expenses incurred or paid by a director, officer or controlling person of the registrant in the successful defense of any action, suit or proceeding) is asserted by such director, officer or controlling person in connection with the securities being registered, the registrant will, unless in the opinion of its counsel the matter has been settled by controlling precedent, submit to a court of appropriate jurisdiction the question whether such indemnification by it is against public policy as expressed in the Act and will be governed by the final adjudication of such issue.
Table of Contents
The registrant hereby further undertakes that:
(1) For purposes of determining any liability under the Securities Act of 1933, the information omitted from the form of prospectus filed as part of this Registration Statement in reliance upon Rule 430A and contained in a form of prospectus filed by the Registrant pursuant to Rule 424(b)(1) or (4) or 497(h) under the Securities Act shall be deemed to be part of this Registration Statement as of the time it was declared effective; and
(2) For purposes of determining any liability under the Securities Act of 1933, each post-effective amendment that contains a form of prospectus shall be deemed to be a new registration statement relating to the securities offered therein, and the offering of such securities at that time shall be deemed to be the initial bona fide offering thereof.
Table of Contents
SIGNATURES
Pursuant to the requirements of the Securities Act of 1933, the registrant has duly caused this registration statement to be signed on its behalf by the undersigned, thereunto duly authorized, in the City of Durham, State of North Carolina on March 25, 2014.
| Square 1 Financial, Inc. | ||
| By: | /s/ Douglas H. Bowers | |
| Douglas H. Bowers President and Chief Executive Officer | ||
Pursuant to the requirements of the Securities Act of 1933, this registration statement has been signed by the following persons in the capacities and on the dates indicated.
| Name |
Title |
Date | ||
| /s/ Douglas H. Bowers Douglas H. Bowers |
President, Chief Executive Officer and Director (principal executive officer) | March 25, 2014 | ||
| /s/ Patrick Oakes Patrick Oakes |
Executive Vice President and Chief Financial Officer (principal financial and accounting officer) | March 25, 2014 | ||
| * Robert S. Muehlenbeck |
Chairman | |||
| * Paul R. Burke |
Director | |||
| * Susan G. Casey |
Director | |||
| * Norman P. Creighton |
Director | |||
| * William F. Grant III |
Director | |||
| * Daniel R. Mathis |
Director | |||
| * John T. Pietrzak |
Director | |||
| * Seth A. Rudnick |
Director | |||
| * Robert H. Scott |
Director | |||
| * Robert I. Usdan |
Director | |||
| * W. Kirk Wycoff |
Director | |||
Table of Contents
| * | Pursuant to the power of attorney previously filed as Exhibit 24.0 to the Registrant’s Registration Statement on Form S-1 filed on January 6, 2014. |
| By: |
/s/ Douglas H. Bowers Douglas H. Bowers Attorney-in-Fact |
March 25, 2014 | ||||