Attached files
| file | filename |
|---|---|
| 8-K - 8-K - Bristow Group Inc | d696874d8k.htm |
 Howard Weil 42
nd
Annual Energy
Conference
Bristow Group Inc.
March 23 -
27, 2014
Exhibit 99.1 |
 2
Forward-looking statements
This
presentation
may
contain
“forward-looking
statements”
within
the
meaning
of
the
Private
Securities
Litigation
Reform
Act
of
1995.
Forward-looking
statements
include
statements
about
our
future
business,
operations,
capital
expenditures,
fleet
composition,
capabilities
and
results;
modeling
information,
earnings
and
adjusted
earnings
growth
guidance,
expected
operating
margins,
cash
flow
stability
and
other
financial
projections;
future
dividends,
share
repurchases
and
other
uses
of
excess
cash;
plans,
strategies
and
objectives
of
our
management,
including
our
plans
and
strategies
to
grow
earnings
and
our
business,
our
general
strategy
going
forward,
our
business
model
and
our
operational
excellence
initiative;
expected
actions
by
us
and
by
third
parties,
including
our
customers,
competitors
and
regulators;
impact
of
grounding
and
the
effects
thereof;
the
valuation
of
our
company
and
its
valuation
relative
to
relevant
financial
indices;
assumptions
underlying
or
relating
to
any
of
the
foregoing,
including
assumptions
regarding
factors
impacting
our
business,
financial
results
and
industry;
expected
input
of
our
investment
in
Eastern
Airways;
and
other
matters.
Our
forward-looking
statements
reflect
our
views
and
assumptions
on
the
date
of
this
presentation
regarding
future
events
and
operating
performance.
They
involve
known
and
unknown
risks,
uncertainties
and
other
factors,
many
of
which
may
be
beyond
our
control,
that
may
cause
actual
results
to
differ
materially
from
any
future
results,
performance
or
achievements
expressed
or
implied
by
the
forward-looking
statements.
These
risks,
uncertainties
and
other
factors
include
fluctuations
in
the
demand
for
our
services;
fluctuations
in
worldwide
prices
of
and
demand
for
natural
gas
and
oil;
fluctuations
in
levels
of
natural
gas
and
oil
exploration
and
development
activities;
the
impact
of
competition;
actions
by
customers;
the
risk
of
reductions
in
spending
on
helicopter
services
by
governmental
agencies;
changes
in
tax
and
other
laws
and
regulations;
changes
in
foreign
exchange
rates
and
controls;
risks
associated
with
international
operations;
operating
risks
inherent
in
our
business,
including
the
possibility
of
declining
safety
performance;
general
economic
conditions
including
the
capital
and
credit
markets;
our
ability
to
obtain
financing;
the
risk
of
grounding
of
segments
of
our
fleet
for
extended
periods
of
time
or
indefinitely;
our
ability
to
re-deploy
our
aircraft
to
regions
with
greater
demand;
our
ability
to
acquire
additional
aircraft
and
dispose
of
older
aircraft
through
sales
into
the
aftermarket;
the
possibility
that
we
do
not
achieve
the
anticipated
benefit
of
our
fleet
investment
program;
availability
of
employees;
political
instability,
war
or
acts
of
terrorism
in
any
of
the
countries
where
we
operate;
and
those
discussed
under
the
captions
“Risk
Factors”
and
“Management’s
Discussion
and
Analysis
of
Financial
Condition
and
Results
of
Operations”
in
our
Annual
Report
on
Form
10-K
for
the
fiscal
year
ended
March
31,
2013
and
our
Quarterly
Report
on
Form
10-Q
for
the
quarter
ended
December
31,
2013.
We
do
not
undertake
any
obligation,
other
than
as
required
by
law,
to
update
or
revise
any
forward-looking
statements,
whether
as
a
result
of
new
information,
future
events
or
otherwise. |
 3
Bristow is the leading provider of helicopter services
and is a unique investment in oil field services
•
Ticker: BRS; stock price
*
of
$73.58/share with a market cap
*
~$2.7 billion
•
471 aircraft in ~20 countries with
~3,700 employees
•
Rated “Investment Grade”
by
Standard and Poor’s
•
Quarterly dividend of $0.25/share
(historic growth ~30% annually)
•
Bristow Helicopters Ltd. recently
acquired a 60% interest in Eastern
Airways Ltd.
*NOTE:
Based
on
36.8
million
fully
diluted
weighted
average
shares
outstanding
for
the
three
months
ended
12/31/2013
and
stock
price
as
of
03/14/2014;
Standard
and
Poor’s
secured
rating
is
BBB-
with
the
unsecured
rating
of
BB-
Bristow flies crews for oil and gas
companies and provides search
and rescue (SAR) services for
them and governments alike |
 4
TARGET ZERO,
our industry leading safety program,
creates differentiation and client loyalty
•
Safety is our primary core value
•
Bristow’s ‘Target Zero’
program is now the leading
example emulated industry-wide
•
Safety performance accounts for 25% of management
incentive compensation
•
Flight Safety Foundation (FSF) awarded its 2012
President’s Citation to Bristow Group’s Target Zero
program |
 5
Bristow services are utilized in every phase of
offshore oil and gas growth, especially production
•
Largest share of revenues (>60%) relates to
oil and gas production, providing stability and
growth opportunities
•
There are ~ 8,000 offshore production
installations worldwide —
compared with
>600 exploratory drilling rigs
•
~1,700 helicopters are servicing the
worldwide oil and gas industry of which
Bristow’s fleet is approximately one-third
•
Bristow revenues are primarily driven by
operating expenditures
Typical revenues by segment
Exploration
20%
Development
10%
Production
60%
Other 10%
ABANDONMENT
EXPLORATION
SEISMIC
DEVELOPMENT
PRODUCTION
H e l i c o p t e r t r a n s p o r t a t i o
n s e r v i c e s |
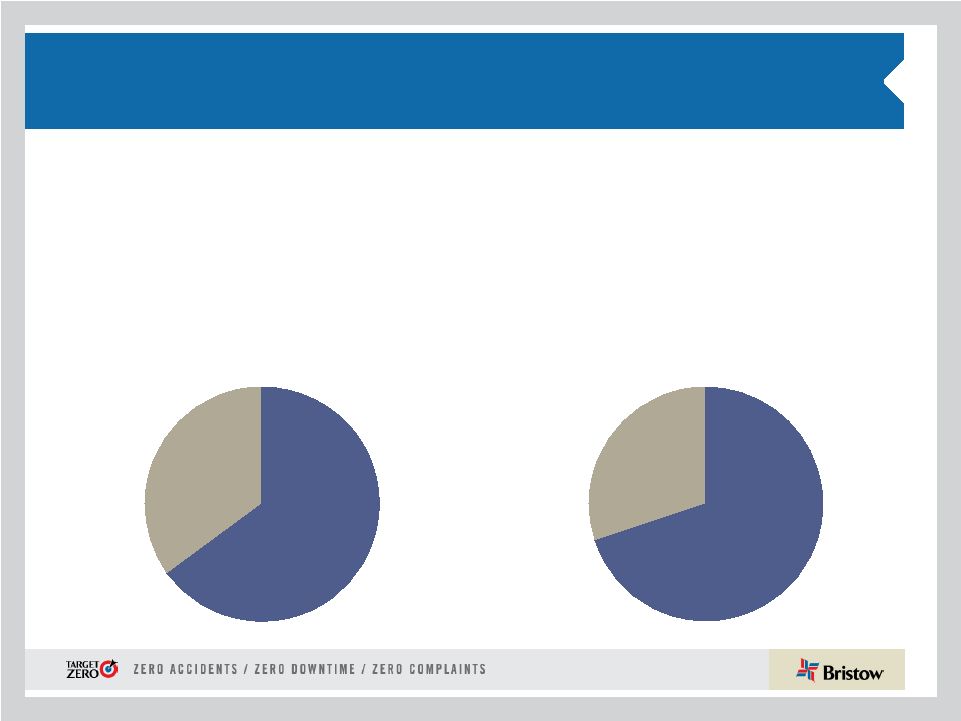 6
Fixed
monthly
65%
Variable
hourly
35%
Fixed
monthly
70%
Variable
hourly
30%
Bristow’s contract structure generates predictable
income and cash flow
Significant operating leverage
Revenue sources
•
Two-tiered contract structure includes both:
–
Fixed monthly standing charge to reserve helicopter capacity
–
Variable fees based on hours flown with fuel pass-through
•
Bristow contracts earn 65% of revenue without flying
Operating income |
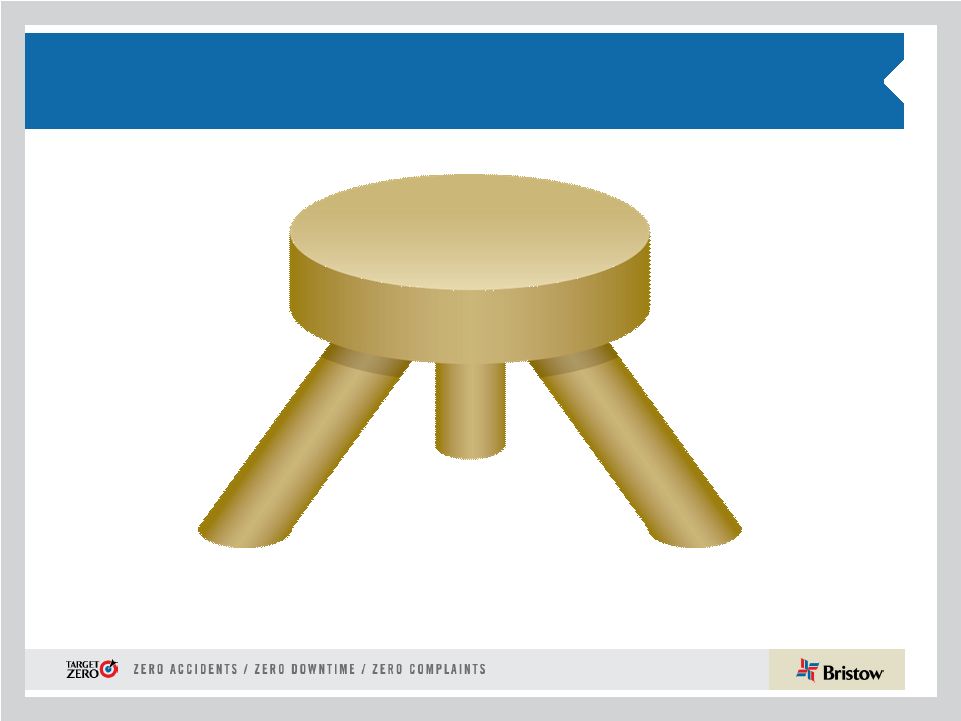 7
Our value proposition will continue to be based on
secular growth, financial safety and balanced return
Long term value for
our shareholders
2. Prudent balance
sheet management
with ample liquidity
1. Growth not dependent
on economic or
commodity cycles
3. Capital return
through dividends and
opportunistic share repurchases
Investment:
FY 2012 -
2016 |
 8
$278.0
$311.0
$33.0
$5.2
$5.2
YTD FY13
Operations
Corporate and Other
FX Changes
YTD FY14
$2.77
$3.11
$0.33
$0.11
$0.10
YTD FY13
Operations
Corporate and Other
FX Changes
YTD FY14
Financial highlights YTD:
Adjusted EPS and adjusted EBITDAR summary
YTD FY13 to YTD FY14 adjusted EPS bridge
YTD FY13 to YTD FY14 adjusted EBITDAR bridge (in millions)
*
Adjusted
EPS
and
EBITDAR
amounts
exclude
gains
and
losses
on
dispositions
of
assets
and
any
special
items
during
the
nine
months
ended
December
31,
2013
and
2012.
See
reconciliation
of
these
items
to
GAAP
in
the
appendix
hereto
and
in
our
earnings
release
for
the
quarter
ended
December
31,
2013. |
 9
CHANGE:
Bristow Helicopters is making an investment in Eastern Airways,
a UK regional fixed-wing oil and gas focused transport company
•
Bristow Helicopters Limited (Bristow Helicopters)
purchased a 60% interest in the privately owned
Eastern Airways International Limited (Eastern
Airways)
•
Eastern Airways is a regional fixed-wing operator
with both charter and scheduled flights servicing
UK oil and gas industry transport from its main
operational hub in Aberdeen
•
Bristow Helicopters investment is £27M with a
possible £6M earn out over three years and
includes:
A 60% interest in Eastern Airways with
proportional voting and economic rights, with
the existing owners retaining the remaining
40%
30 fixed-wing aircraft as of February 7, 2014
Financial results from Eastern Airways will be
consolidated within Bristow’s EBU
This investment will strengthen our ability to provide a complete suite of
point- to-point transportation services for our existing European based
passengers |
 10
Charter services
Scheduled services
Eastern Airways provides scale, stability and positive financial
impact (with less capital) for EBU
This investment expands helicopter services in certain areas like the Shetland
Islands and will create a more integrated logistics solution for our global
clients •
Bristow
Helicopters
and
Eastern
Airways
are
culturally
aligned
with
shared
core
values
of
safety,
quality
and
service
•
Bristow
Helicopters
and
Eastern
Airways
have
a
long
standing
relationship
working
together
on
several
contracts,
including
the
IAC
Scatsta
contract
•
Bristow
Helicopters
and
Eastern
Airways
together
are
positioned
to
facilitate
and
expand
passengers’
transport
experience
from
home
to
offshore
bases,
a
market
niche
underserved
by
major
airlines
•
Eastern
Airways
has
recently
been
awarded
a
contract
by
a
major
oil
company
to
provide
fixed
wing
services
to
Sumburgh
to
be
combined
with
separately
awarded
Bristow
Helicopters
contract
•
Financially
relatively
small
investment
with
expected
positive
EBITDAR,
BVA
and
EPS
impact
See
10-Q
Note
11
“Subsequent
Events”
for
more
information |
 11
Opportunity tracker FY15-FY19:
558 Bristow a/c growth opportunities identified |
 12
We manage our opportunities through the purchase of
104 a/c options and committed orders
6 on
order
558 aircraft opportunities identified
83 high
probability targets
47 orders
298 demand for new aircraft
185 realistic bid
opportunities
57 options
•
Bristow uses specific
opportunities to create
our order book
•
Opportunities are
condensed to 185
realistic bids
•
83 high probability
targets are derived from
a view that we have an
~33% bid success rate
•
Our order book is then
managed primarily using
capital efficient a/c
options with our original
equipment manufacturers
Source: Bristow business development February 2014 |
 13
Our
TSR
has
been
highly
correlated
to
year-over-
year
improvement
in
Bristow
Value
Added
(BVA)
.
.
.
* Based on a study using Capital IQ data as of August 26, 2013. Analyzed the
current members of the Oilfield Services Index (OSX) The correlation statistic is derived from a
regression of actual enterprise value vs. predicted enterprise value.
Predicted enterprise value based on next twelve months (NTM) estimated BVA in perpetuity using a 10.5%
required
return
(NTM
BVA$/10.5%).
Similar
studies
conducted
over
time
have
produced
consistent
results.
Bristow BVA vs. Bristow TSR
•
Overall, BVA shows a much
stronger correlation to
market trading values and
therefore total shareholder
return (TSR)
•
Correlations are particularly
strong for the oil field
services sector at an “R
Squared”
of over 95%*
•
Bristow’s year-over-year
change in BVA has
historically been a leading
indicator of TSR |
 14
. . .with Bristow’s three year total shareholder return
(TSR)
over 90% since adopting BVA
Source: Factset |
 15
. . . and strong cash generation for a balanced return
as demonstrated in the past several years. . .
Share
repurchase
•
FY12 quarterly dividend initiated at $0.15/share
•
Dividend increased by 33% to $0.20/share in June
2012 quarter and increased by another 25% to
$0.25/share in August 2013
•
Bristow has a 20 -
30% target payout ratio of
forward adjusted EPS
•
In Q3 FY14 and January 2014 Bristow spent ~$33M
to repurchase 450,000 shares at average price of
~$75 and subsequently renewed its $100 million
share repurchase authorization
•
Value is key to our repurchasing decision with net
book value/share and our fleet NAV/share (including
the implied NAV for UK SAR) being the guide posts
Regular
dividend |
 16
…
with FY14 guidance reaffirmed
•
FY14 adjusted EPS guidance reaffirmed on February 7, 2014 to
$4.25 -
$4.55, excluding special items and a/c sales. Other
specific items include:
* Assuming FY14 revenue earned in same regions and same mix as in FY13
Long term adjusted EPS growth of 10 -
15% combined with a 20 -
30%
dividend payout policy reflects management’s commitment to deliver a
more stable, growing and predictable total return for shareholders
Average LACE
~160 - 164
Interest expense
~ $30 - $35M
Average LACE rate
~ $8.95 - $9.25M
Rent expense (a/c only)
~$85 - $90M
G & A expense (all inclusive)
~ $175 - $185M
Tax rate*
~ 20 - 24%
Depreciation expense
~ $90 - $95M
Adj. EPS guidance
$4.25 - $4.55
FY14 guidance |
 17
Conclusions
•
Safety
continues
to
be
our
#1
core
value
as
we
strive
to
achieve
Target
Zero
and
participate
in
industry
efforts
to
share
best
practices.
Bristow
believes
the
UK
CAA
CAP1145
safety
mandate
will
make
the
helicopter
industry
safer
as
we
continue
to
serve
our
clients’
logistics
needs
•
Despite
industry
concerns
of
soft
activity
in
the
oilfield
services
and
equipment
space,
Bristow
continues
to
see
good
secular
growth
with
meaningful
LACE
and
LACE
rate
increases
as
clients
turn
to
Bristow
as
their
provider
of
choice
due
to
our
global
reach,
financial
strength
and
ongoing
Operational
Excellence
performance
•
Although
the
third
quarter
results
were
lower
sequentially
and
year-over-year,
some
of
this
was
expected,
which
is
why
we
confirmed
annual
FY14
guidance
on
our
Q3
FY14
earnings
call
•
Bristow
Helicopters’
investment
in
Eastern
Airways
expands
services
in
certain
areas
like
the
Shetland
Islands
and
creates
a
more
integrated
logistics
solution
for
our
global
clients |
 18
Appendix |
 19
Organizational chart -
as of December 31, 2013
Business Unit
(% of Q3 FY14 operating revenue)
Corporate
Region
( # of a/c / # of Locations)
Joint Venture
(# of a/c)
Key
Operated Aircraft
Bristow owned and/or operated 345
aircraft as of December 31, 2013
Affiliated Aircraft
Bristow affiliates and joint
ventures operated 126 aircraft
as of December 31, 2013
* Includes corporate and other |
  20
Aircraft Fleet –
medium and large
as of December 31, 2013
Next Generation Aircraft
Medium capacity 12-16 passengers
Large capacity 16-25 passengers
Mature Aircraft
Fair
market
value
of
our
owned
fleet
is
~$1.9
billion
and
leased
fleet
is
~$900
million
Aircraft
Type
No. of PAX
Engine
Consl
Unconsl
Total
Ordered
Large Helicopters
AS332 L Super Puma
18
Twin Turbine
19
-
19
-
AW189
16
Twin Turbine
-
-
-
17
EC175
16
Twin Turbine
-
-
-
5
EC225
19
Twin Turbine
20
-
20
3
Mil MI 8
20
Twin Turbine
7
-
7
-
Sikorsky S-61
18
Twin Turbine
2
-
2
-
Sikorsky S-92
19
Twin Turbine
56
7
63
10
104
7
111
35
LACE
102
Medium Helicopters
AW139
12
Twin Turbine
14
2
16
4
Bell 212
12
Twin Turbine
-
14
14
-
Bell 412
13
Twin Turbine
28
17
45
-
EC155
13
Twin Turbine
1
-
1
-
Sikorsky S-76A/A++
12
Twin Turbine
4
5
9
-
Sikorsky S-76C/C++
12
Twin Turbine
51
34
85
-
Sikorsky S-76D
12
Twin Turbine
2
-
2
8
100
72
172
12
LACE
48 |
 21
Aircraft Fleet –
small, training and fixed
as of December 31, 2013 (continued)
Mature Aircraft
Small capacity 4-7 passengers
Training capacity 2-6 passengers
* LACE does not include held for sale, training helicopters and fixed wing
Next Generation Aircraft
Aircraft
Type
No. of PAX
Engine
Consl
Unconsl
Total
Ordered
Small Helicopters
AS350BB
4
Turbine
-
2
2
-
Bell 206B
4
Turbine
1
2
3
-
Bell 206 L Series
6
Turbine
19
6
25
-
Bell 407
6
Turbine
36
-
36
-
BK 117
7
Twin Turbine
2
-
2
-
BO-105
4
Twin Turbine
2
-
2
-
EC135
7
Twin Turbine
3
3
6
-
63
13
76
-
LACE
13
Training Helicopters
AS 355
5
Twin turbine
3
-
3
-
Bell 206B
4
Single Engine
12
-
12
-
Robinson R22
2
Piston
10
-
10
-
Robinson R44
4
Piston
5
-
5
-
Sikorsky 300CB/CBi
2
Piston
44
-
44
-
Fixed Wing
1
-
1
-
75
-
75
-
Fixed Wing
3
34
37
-
Total
345
126
471
47
TOTAL LACE (Large Aircraft Equivalent)*
162 |
 22
Operating lease strategy: lowering the cost and amount of
capital needed to grow
•
Of
the
81
a/c
currently
leased
in
our
fleet,
52
are
commercial
(39
LACE)
and
29
are
training
•
39
LACE
a/c
represent
approximately
24%
of
our
commercial
fleet
•
Our
goal
is
for
commercial
fleet
operating
leases
to
account
for
approximately
30-35%
of
our
LACE
Leased aircraft as of December 31, 2013
*
The
percentage
of
LACE
leased
is
calculated
by
taking
the
total
LACE
for
leased
aircraft
divided
by
the
total
LACE
for
all
aircraft
we
operate,
including
both
owned
and
leased
aircraft.
See
10-Q
Note
5
“Commitments
and
contingencies”
for
more
information
provided
on
operating
leases.
Small
Medium
Large
Total
Leased LACE
Total LACE
% Leased
EBU
-
1
21
22
22
59
37%
WASBU
-
1
1
2
2
22
7%
NABU
4
13
3
20
11
34
31%
AUSBU
2
2
4
8
6
20
28%
OIBU
-
-
-
-
-
28
-
Total
6
17
29
52
39
162
24%
* |
 23
Consolidated fleet changes and aircraft sales for
Q3 FY14
See
10-Q
Note
5
“Commitments
and
contingencies”
for
more
information
provided
on
operating
leases.
Additionally,
during
Q3
FY14
we
sold
six
aircraft
for
$72.4M,
which
we
subsequently
leased
back.
Leased aircraft in consolidated fleet
Small
Medium
Large
Training
Total
EBU
-
1
21
-
22
WASBU
-
1
1
-
2
NABU
4
13
3
-
20
AUSBU
2
2
4
-
8
OIBU
-
-
-
-
-
Academy
-
-
-
29
29
Total
6
17
29
29
81
Q1 FY14
Q2 FY14
Q3 FY14
YTD
Fleet Count Beginning
351
353
350
351
Delivered
Large
3
2
4
9
Medium
2
3
3
8
Total Delivered
5
5
7
17
Removed
Sales
(4)
(4)
(11)
(19)
Other*
1
(4)
(1)
(4)
Total Removed
(3)
(8)
(12)
(23)
353
350
345
345
* Includes lease returns and commencements
Fleet changes
Held for sale aircraft in consolidated fleet
Small
Medium
Large
Training
Total
EBU
-
-
2
-
2
WASBU
-
2
-
-
2
NABU
11
-
-
-
11
AUSBU
-
-
-
-
-
OIBU
1
3
-
-
4
Academy
-
-
-
2
2
Total
12
5
2
2
21
# of a/c Sold
Cash
received*
Q1 FY14
4
2.0
$
Q2 FY14
4
7.9
Q3 FY14
11
14.3
Total
19
24.2
$
* Amounts stated in millions |
 24
Op revenue
1
LACE
LACE rate
2,3
EBU
$452
59
$10.30
WASBU
231
22
14.17
NABU
174
34
6.75
AUSBU
108
20
7.21
OIBU
95
28
4.58
Total
$1,091
162
$8.97
Operating Revenue, LACE, and LACE rate by BU
as of December 31, 2013
Operating revenue, LACE and LACE rate by BU
4
1)
$ in millions
2)
LACE rate is annualized
3)
$ in millions per LACE
4)
Excludes Bristow Academy |
 25
Historical LACE by BU
Q1
Q2
Q3
Q4
Q1
Q2
Q3
Q4
Q1
Q2
Q3
Q4
EBU
45
45
45
42
42
43
48
46
44
46
46
45
WASBU
23
23
24
25
24
24
21
22
23
22
22
22
NABU
39
36
36
36
39
35
34
29
30
29
30
30
AUSBU
20
20
22
22
20
23
24
20
19
20
20
19
OIBU
36
34
34
35
33
33
33
38
39
38
38
34
Consolidated
163
158
161
160
157
158
159
154
154
154
155
149
Q1
Q2
Q3
Q4
Q1
Q2
Q3
EBU
47
45
51
55
57
59
59
WASBU
22
22
20
21
21
21
22
NABU
30
31
39
37
37
33
34
AUSBU
18
17
17
19
19
19
20
OIBU
32
28
27
27
27
28
28
Consolidated
147
142
154
158
161
160
162
LACE
FY11
FY12
FY10
FY13
FY14 |
 26
Historical LACE rate by BU
1) $ in millions
2) LACE rate is annualized
Q1
Q2
Q3
Q4
Q1
Q2
Q3
Q4
Q1
Q2
Q3
Q4
EBU
$8.36
$8.28
$8.40
$8.76
$8.20
$8.50
$7.90
$8.40
$9.80
$9.60
$9.63
$10.09
WASBU
9.08
8.81
8.66
8.34
9.70
9.40
10.70
9.90
9.10
10.30
11.17
11.46
NABU
5.05
5.44
5.26
5.23
5.40
6.10
6.00
6.60
5.80
6.30
5.89
5.79
AUSBU
5.38
5.56
5.59
5.67
6.80
6.00
6.00
7.50
8.60
7.10
6.96
7.78
OIBU
3.66
4.09
4.06
3.78
3.90
4.10
4.40
3.90
3.50
3.70
3.78
4.22
Consolidated
$6.31
$6.52
$6.49
$6.45
$6.70
$6.90
$6.90
$7.10
$7.30
$7.40
$7.43
$7.89
Q1
Q2
Q3
Q4
Q1
Q2
Q3
EBU
$10.60
$11.03
$9.74
$9.13
$9.63
$9.95
$10.30
WASBU
12.35
12.24
13.71
13.28
14.26
14.62
14.17
NABU
7.05
7.11
5.84
6.12
6.34
7.13
6.75
AUSBU
8.48
9.29
9.55
8.58
8.04
7.74
7.21
OIBU
4.22
4.62
4.76
4.94
4.97
4.73
4.58
Consolidated
$8.55
$8.95
$8.49
$8.35
$8.78
$9.07
$8.97
LACE rate
1,2
FY10
FY11
FY12
FY13
FY14 |
 27
Order and options book as of December 31, 2013
1)
22 large a/c on order and 13 large a/c on option are subject to the
successful development and certification of the aircraft 2)
One oil and gas full SAR /c is under contract
ORDER BOOK¹
#
Helicopter
Class
Delivery Date
Location
Contracted
1
Medium
March 2014
OIBU
1 of 1
1
Medium
March 2014
NABU
2
Large
March 2014
EBU
1 of 2
3
Medium
June 2014
OIBU
1 of 3
2
Large
June 2014
AUSBU
1 of 2
1
Large
June 2014
OIBU
1
Large
June 2014
WASBU
6
Medium
September 2014
WASBU
1
Medium
September 2014
NABU
3
Large
September 2014
EBU
2 of 32
1
Large
September 2014
AUSBU
1 of 1
1
Large
December 2014
EBU
1
Large
March 2015
OIBU
1
Large
March 2015
NABU
1 of 1
1
Large
March 2015
AUSBU
1
Large
March 2015
EBU
1
Large
June 2015
EBU
1
Large
June 2015
AUSBU
1
Large
September 2015
NABU
1
Large
December 2015
NABU
1
Large
March 2016
EBU
2
Large
March 2016
NABU
1
Large
June 2016
NABU
1
Large
June 2016
EBU
36
8 of 36
OPTIONS BOOK
#
Helicopter
Class
Delivery Date
2
Medium
March 2015
1
Large
June 2015
3
Medium
June 2015
3
Large
September 2015
2
Medium
September 2015
3
Large
December 2015
2
Medium
December 2015
2
Large
March 2016
3
Medium
March 2016
3
Large
June 2016
3
Medium
June 2016
4
Large
September 2016
2
Medium
September 2016
5
Large
December 2016
1
Medium
December 2016
3
Large
March 2017
1
Medium
March 2017
3
Large
June 2017
1
Medium
June 2017
3
Large
September 2017
1
Medium
September 2017
4
Large
December 2017
1
Medium
December 2017
1
Large
March 2018
57 |
 28
Order and options book as of December 31, 2013
(continued)
UK SAR CONFIGURED ORDER BOOK
#
Helicopter
Class
Delivery Date
Location
Contracted
1
Large
June 2014
EBU
1 of 1
3
Large
September 2014
EBU
3 of 3
2
Large
December 2014
EBU
2 of 2
2
Large
March 2015
EBU
2 of 2
2
Large
March 2015
EBU
2 of 2
2
Large
June 2015
EBU
2 of 2
2
Large
September 2015
EBU
2 of 2
2
Large
September 2015
EBU
2 of 2
2
Large
December 2015
EBU
2 of 2
18
18 of 18
The aircraft that are indicated in grey italic will be leased upon delivery
|
 29
Adjusted EBITDAR margin* trend
*
Adjusted
EBITDAR
excludes
special
items
and
asset
dispositions
and
margin
is
calculated
by
taking
adjusted
EBITDAR
divided
by
operating
revenue
FY11
FY12
Q1
Q2
Q3
Q4
Full Year
Q1
Q2
Q3
Q4
Full Year
EBU
29.8%
31.5%
34.6%
34.4%
32.7%
33.0%
31.4%
30.7%
36.1%
32.9%
WASBU
33.7%
36.9%
35.8%
34.3%
35.2%
29.5%
35.5%
37.2%
36.6%
35.0%
NABU
20.8%
25.8%
15.9%
8.5%
18.5%
14.3%
20.6%
14.8%
19.4%
17.3%
AUSBU
33.2%
26.1%
27.0%
31.1%
29.3%
20.2%
14.4%
23.5%
35.6%
24.3%
OIBU
18.3%
40.2%
37.4%
59.4%
39.3%
48.1%
19.1%
47.8%
42.9%
39.5%
Consolidated
23.8%
27.5%
25.9%
29.6%
26.7%
23.4%
24.0%
27.6%
31.2%
26.6%
FY13
FY14
Q1
Q2
Q3
Q4
Full Year
Q1
Q2
Q3
EBU
32.2%
34.6%
39.5%
38.3%
36.2%
30.3%
35.3%
35.3%
WASBU
31.9%
26.5%
35.0%
31.8%
31.5%
31.3%
30.4%
33.5%
NABU
23.2%
20.7%
29.1%
29.5%
25.7%
29.2%
31.0%
33.1%
AUSBU
27.0%
28.0%
27.3%
26.0%
27.1%
17.7%
21.0%
15.0%
OIBU
36.2%
44.2%
55.7%
51.6%
46.6%
67.4%
39.3%
33.2%
Consolidated
26.3%
26.1%
31.5%
29.4%
28.3%
28.5%
28.7%
27.0% |
 30
Adjusted EBITDAR* reconciliation
* Adjusted EBITDAR excludes special items and asset dispositions
Fiscal year ended,
3/31/2011
3/31/2012
($ in millions)
Q1
Q2
Q3
Q4
Full Year
Q1
Q2
Q3
Q4
Full Year
Net income
$20.9
$38.8
$42.3
$31.2
$133.3
$21.2
$3.0
$26.5
$14.6
$65.2
Income tax expense
8.5
3.3
-11.8
7.1
7.1
6.6
-1.9
7.1
2.4
14.2
Interest expense
11.1
11.5
13.8
9.9
46.2
9.0
9.5
9.8
10.0
38.1
Gain on disposal of assets
-1.7
-1.9
0.0
-5.1
-8.7
-1.4
1.6
2.9
28.6
31.7
Depreciation and amortization
19.3
21.0
21.3
27.7
89.4
22.7
25.4
22.7
25.3
96.1
Special items
0.0
0.0
-1.2
2.4
1.2
0.0
24.6
0.0
3.4
28.1
EBITDA Subtotal
58.1
72.7
64.4
73.3
268.5
58.1
62.1
68.9
84.3
273.4
Rental expense
6.6
6.1
8.7
7.7
29.2
9.0
9.1
12.8
15.1
46.0
Adjusted EBITDAR
$64.7
$78.8
$73.1
$81.1
$297.7
$67.0
$71.2
$81.8
$99.5
$319.5
3/31/2013
3/31/2014
($ in millions)
Q1
Q2
Q3
Q4
Full Year
Q1
Q2
Q3
Net income
$24.2
$30.4
$36.7
$40.4
$131.7
$26.9
$109.9
$19.0
Income tax expense
6.2
8.3
7.8
12.7
35.0
7.6
41.1
2.9
Interest expense
8.8
8.6
14.7
10.3
42.4
20.4
9.1
7.3
Gain on disposal of assets
5.3
1.3
-7.4
-7.2
-8.1
1.7
3.1
-4.0
Depreciation and amortization
21.4
23.3
24.9
26.7
96.3
22.8
23.9
23.7
Special items
2.2
-2.8
14.9
1.9
16.2
0.0
-101.8
23.5
EBITDA Subtotal
68.0
69.2
91.6
84.8
313.5
79.4
85.2
72.4
Rental expense
16.3
15.3
17.6
18.3
67.4
23.1
23.3
28.3
Adjusted EBITDAR
$84.3
$84.5
$109.2
$103.0
$381.0
$102.5
$108.5
$100.7 |
 31
Bristow stock price reflects improved operational
performance and increasing shareholder returns
Note:
The
net
asset
FMV
per
share
does
not
include
our
UK
SAR
aircraft |
 32
Net asset fair market value (FMV) per share
calculation as of December 31, 2013
(in millions)
(+) FMV of a/c
1,949
$
(+) FMV of leased a/c
873
(+) NBV of PPE w/o a/c
540
(+) Working capital
481
(-) LT debt
(833)
(-) Leased imputed debt
(394)
(-) Pension liability
(125)
Net asset FMV
2,492
$
# of common shares
37
Net asset FMV per share
67.71
$ |
 33
Bristow Value Added (BVA)
Sample calculation for Q2 FY14 and Q2 FY13
Bristow Value Added = Gross Cash Flow –
(Gross Operating Assets X Capital Charge)
BVA
=
GCF
-
(
GOA
X
10.5%**
)
Bristow Value Added calculation for Q2 FY14
$22.4
=
$109.2*
-
(
$3,309*
X
2.625%**)
Bristow Value Added calculation for Q2 FY13
$2.1
=
$78.8*
-
(
$2,922*
X
2.625%**)
* Reconciliation for these items follows right after this
slide ** Quarterly capital charge of 2.625% is based on annual
capital charge of 10.5% |
 34
Bristow Value Added (BVA)
Sample calculation for Q3 FY14 and Q3 FY13
Bristow Value Added = Gross Cash Flow –
(Gross Operating Assets X Capital Charge)
BVA
=
GCF
-
(
GOA
X
10.5%**
)
Bristow Value Added calculation for Q3 FY14
$12.1
=
$100.8*
-
(
$3,378*
X
2.625%**)
Bristow Value Added calculation for Q3 FY13
$9.3
=
$95.1*
-
(
$3,269*
X
2.625%**)
* Reconciliation for these items follows right after this
slide ** Quarterly capital charge of 2.625% is based on annual
capital charge of 10.5% |
 35
Gross cash flow reconciliation |
 36
Adjusted gross operating assets reconciliation
(in millions)
Adjusted gross operating assets reconciliation
Q2 FY13
Q3 FY13
Q2 FY14
Q3 FY14
Total assets
$2,785
$3,051
$3,166
$3,277
Accumulated depreciation
464
480
518
530
Capitalized operating leases
225
244
373
419
Cash and cash equivalents
(348)
(232)
(314)
(323)
Investment in unconsolidated entities
(215)
(267)
(272)
(255)
Goodwill
(30)
(30)
(30)
(30)
Intangibles
(4)
(4)
(2)
(2)
Assets held for sale: net
(20)
(15)
(27)
(22)
Assets held for sale: gross
83
76
56
48
Adj. for gains and losses on assets sales
120
108
(8)
(5)
Accounts payable
(56)
(63)
(70)
(60)
Accrued maintenance and repairs
(19)
(18)
(17)
(17)
Other accrued taxes
(8)
(8)
(10)
(8)
Accrued wages, benefits and related taxes
(45)
(51)
(49)
(67)
Other accrued liabilities
(27)
(27)
(24)
(145)
Income taxes payable
(13)
(13)
(33)
(20)
Deferred revenue
(13)
(20)
(21)
(23)
ST deferred taxes
(15)
(12)
(2)
(2)
LT deferred taxes
(144)
(147)
(155)
(146)
Adjusted gross operating assets before Lider
$2,723
$3,053
$3,079
$3,150
Adjusted gross operating assets-Lider proportional
199
216
230
228
Adjusted gross operating assets after Lider
$2,922
$3,269
$3,309
$3,378 |
 37
GAAP reconciliation
(i) See information about special items in 10-Q or earnings release for Q3 FY14 (ii)
These amounts are presented after applying the appropriate tax effect to each item and dividing by the weighted average shares outstanding during the related period to calculate the earnings per share impact |
 38
Leverage reconciliation
*Adjusted EBITDAR excludes gains and losses on dispositions of assets
Debt
Investment
Capital
Leverage
(a)
(b)
(c) = (a) + (b)
(a) / (c)
(in millions)
As of December 31, 2013
$
841.6
$ 1,762.9
$ 2,604.5
32.3%
Adjust for:
Unfunded Pension Liability
125.0
125.0
NPV of Lease Obligations
393.6
393.6
Letters of credit
2.4
2.4
Adjusted
$
1,362.6
(d)
$ 1,762.9
$ 3,125.5
43.6%
Calculation of debt to adjusted EBITDAR multiple
TTM Adjusted EBITDAR*:
FY 2014
$
414.0
(e)
= (d) / (e)
3.29:1 |
 39
Bristow Group Inc. (NYSE: BRS)
2103
City
West
Blvd.,
4
th
Floor
Houston, Texas 77042
t
713.267.7600
f
713.267.7620
bristowgroup.com
Contact Us |