Attached files
| file | filename |
|---|---|
| 8-K - 8-K - STIFEL FINANCIAL CORP | d694854d8k.htm |
 March 2014
Stifel Investor Presentation
Exhibit 99.1 |
 Disclaimer
Forward-Looking Statements
This
presentation
may
contain
“forward-looking
statements”
within
the
meaning
of
the
Private
Securities
Litigation
Reform
Act
of
1995
that
involve
significant
risks,
assumptions,
and
uncertainties,
including
statements
relating
to
the
market
opportunity
and
future
business
prospects
of
Stifel
Financial
Corp.,
as
well
as
Stifel,
Nicolaus
&
Company,
Incorporated
and
its
subsidiaries
(collectively,
“SF”
or
the
“Company”).
These
statements
can
be
identified
by
the
use
of
the
words
“may,”
“will,”
“should,”
“could,”
“would,”
“plan,”
“potential,”
“estimate,”
“project,”
“believe,”
“intend,”
“anticipate,”
“expect,”
and
similar
expressions.
In
particular,
these
statements
may
refer
to
our
goals,
intentions,
and
expectations,
our
business
plans
and
growth
strategies,
our
ability
to
integrate
and
manage
our
acquired
businesses,
estimates
of
our
risks
and
future
costs
and
benefits,
and
forecasted
demographic
and
economic
trends
relating
to our
industry.
You
should
not
place
undue
reliance
on
any
forward-looking
statements,
which
speak
only
as
of
the
date
they
were
made.
We
will
not
update
these
forward-looking
statements,
even
though
our
situation
may
change
in
the
future,
unless
we
are
obligated
to
do
so
under
federal securities laws.
Actual
results
may
differ
materially
and
reported
results
should
not
be
considered
as
an
indication
of
future
performance.
Factors
that
could
cause
actual
results
to
differ
are
included
in
the
Company’s
annual
and
quarterly
reports
and
from
time
to
time
in
other
reports
filed
by
the
Company
with
the
Securities
and
Exchange
Commission
and
include,
among
other
things,
changes
in
general
economic and
business conditions, actions of competitors, regulatory and legal actions,
changes in legislation, and technology changes. Use of Non-GAAP
Financial Measures The
Company
utilized
non-GAAP
calculations
of
presented
net
revenues,
compensation
and
benefits,
non-compensation
operating
expenses,
income
before
income
taxes,
provision
for
income
taxes,
net
income,
compensation
and
non-compensation
operating
expense
ratios,
pre-tax
margin
and
diluted
earnings
per
share
as
an
additional
measure
to
aid
in
understanding
and
analyzing
the
Company’s
financial
results
for
the
year
ended
December
31,
2013.
Specifically,
the
Company
believes
that
the
non-GAAP
measures
provide
useful
information
by
excluding
certain
items
that
may
not
be
indicative
of
the
Company’s
core
operating
results
and
business
outlook.
The
Company
believes
that
these
non-GAAP
measures
will
allow
for
a
better
evaluation
of
the
operating
performance
of
the
business
and
facilitate
a
meaningful
comparison
of
the
Company’s
results
in
the
current
period
to
those
in
prior
periods
and
future
periods.
Reference
to
these
non-GAAP
measures
should
not
be
considered
as
a
substitute
for
results
that
are
presented
in
a
manner
consistent
with
GAAP.
These
non-GAAP
measures
are
provided
to
enhance
investors'
overall
understanding
of
the
Company’s financial
performance. |
 Market Overview |
 Domestic Equity
Flows Equity Risk Premium
(1)
4
Market Overview
Source:
Investment
Company
Institute.
(
1)
Based
on
the
Daily
Treasury
Yield
Curve
Rates,
10
year. |
 Stifel Overview |
 6
Stifel Overview
Global Wealth Management
Institutional Group
Independent Research
Institutional Equity & Fixed Income
Brokerage
Equity & Fixed Income Capital Raising
M&A Advisory / Restructuring
Private Client
Stifel Bank & Trust
Customer Financing
Asset Management
(1)
As
of
3/10/14.
(2)
Insider
ownership
percentage
includes
all
fully
diluted
shares,
units
outstanding,
options
outstanding,
as
well
as
shares
owned
by
Stifel’s
former
Chairman
as
of
3/7/14.
Stifel Financial (NYSE: SF)
Financial
services
firm
demonstrating
growth,
scale
and
stability
$3.1
billion
market
capitalization
(1)
2013
Represented
Stifel’s
18
th
year
of
consecutive
record
net
revenues
Balanced business model
Top performing financial stock over the past ten years
34%
Insider
ownership
(2)
National presence with over 2,000
Financial Advisors
$166 billion in total client assets
Largest U.S. equity research platform
Broad product portfolio & industry
expertise |
 7
Stifel’s Market Opportunity
Stifel’s Differentiated Value Proposition: Growth, Scale, and
Stability Bulge Bracket
Middle Market
Firm focus
Good research
Growth investor access
Issues
Lack of focus
Banker turnover
Lack of commitment
Research indifference
Lack of growth investors
Issues
Financial / firm stability
Trading support
Few with retail
Size / scale
Firm focus
Stability (financial &
personnel)
Large distribution
Growth investor access
Trading
Outstanding research
Retail
Size / scale
Large distribution
Trading
Retail |
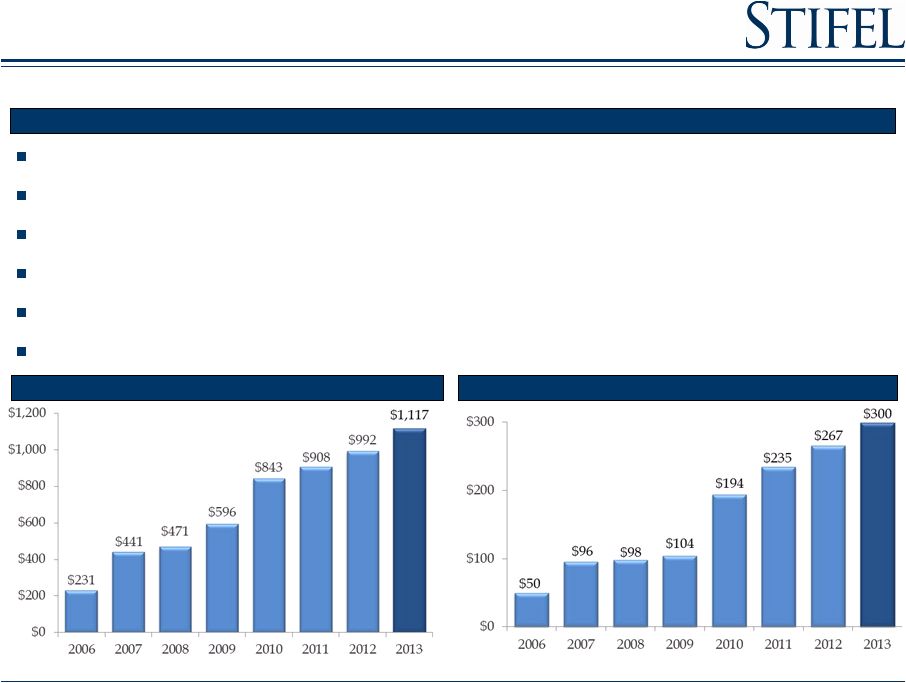
 Strategy:
Building
the
Premier
Investment
Bank
8
Unburdened by capital constraints
Low leverage business model and conservative risk management
Built the Company through 13 acquisitions since 2005; prudently evaluate
all opportunities Select growth of high-quality talent
Drive revenue synergies by leveraging the global wealth and institutional
businesses 18
th
Consecutive Year of Record Net Revenues
Positioned to Take Advantage of Opportunities
Net Revenues ($MM) |
 (1)
Years 2012 and 2013 represents non-GAAP net income from continuing
operations. (2)
Client assets –
Includes FDIC-insured products as of 12/31/13 for years 2008-2013.
(3)
Includes Independent Contractors.
(4)
Book Value Per Share adjusted for April 2011 three-for-two stock
split (2006-2010). A Growth Story…
CAGR: 23%
CAGR: 24%
CAGR: 22%
CAGR: 16%
CAGR: 25%
9
Net Revenues ($MM)
Core Net Income ($MM)
(1)
Total Equity ($MM)
Total Client Assets ($BN)
(2)
Book Value Per Share
(4)
CAGR: 38%
Financial Advisors
(3)
CAGR reflects years 2006 to 2013. |
 10
Building Scale…
Growth Focused
Investment Banking
Research, Sales and Trading
Achieved cost efficiencies
July 2010
Private Client
Revenue production has exceeded
expectations
October 2009
Significant enhancement to our
Capital Markets business
Achieved cost savings objectives
December 2005
Bank holding company
Financial holding company
Grown assets from ~ $100M to $5.0B
April 2007
Private Client
Public Finance
Seamless & efficient integration
December 2008
Fixed Income IB
Fixed Income Sales and Trading
Private Client
Seamless & efficient integration
October 2011
FIG Investment Banking
FIG Sales and Trading
FIG Research
February 2013
Private Client
Capital Markets
Achieved cost savings objectives
February 2007
Each merger has been accretive to Stifel
Retention remains high
Restructuring advisory
December 2012
Fixed Income Sales and
Trading –
U.S. & Europe
Fixed Income Research
July 2013
Asset Management
November 2013
Clean portfolio of 1-4 family
residential mortgages
October 2013 |
 11
Recent Merger Update
Announced the acquisition of De La Rosa on January 30, 2014 and is
expected to close in the first quarter. Plan to integrate under
Stifel brand immediately. Investment bank and bond underwriter
with a 25-year operating history. Stifel will become #1
underwriter in California negotiated underwriting in par value
and number of issues.
Stifel
will
become
#1
underwriter
in
California
in
the
following
categories:
•
K-12
•
COP & Lease Revenue Bonds
•
Tax Increment
•
Economical Development
•
Water & Sewer.
Substantially all of the senior leadership has executed
continuation agreements with Stifel.
|
 12
IFR Awards: 2013 US Mid-Market Equity House of the Year
IFR Recognizes Stifel’s Leadership Position As
The Premier Middle Market Investment Bank
“For its leadership among mid-market firms and
strong momentum in securing bookrunner roles,
Stifel is IFR’s US Mid-Market Equity House of the
Year”
“Stifel has been able to steer clear of the client conflicts
that have muddied perceptions of the bulge brackets
and in some cases act as a check on bulge bracket
execution”
“Winning mandates against bulge brackets with large
balance sheets at their disposal means a heavier
relative investment in research, seen in the firm’s
coverage of 1,300 stocks, up from 537 in 2005”
“Stifel is the largest US equity research provider bar
none, at a time when many bulge brackets have
downgraded their research capabilities amid
regulatory restrictions”
Source:
“US
Mid-market
Equity
House:
Stifel.”
International
Financing
Review’s
(IFR)
Americas
Review
of
the
Year
2013.
Web.
December
13,
2013. |
 Stability Achieved Through A Balanced Business Model
13
Net Revenues
Balanced business model facilitates growth during volatile markets
Stable GWM business is augmented by profitable and growing Institutional
Group Proven ability to grow all businesses
Operating Contribution
2012
2013
2012
2013
Note:
Net
revenues
and
operating
contribution
excludes
the
Other
segment.
13 |
 14
Leverage Ratio
Total Assets ($ in Billions)
Book
Value
Per
Share
(1)
Total Capitalization ($ in Billions)
(1)
Per
share
information
adjusted
for
April
2011
three-for-two
stock
split
Strong Balance Sheet Facilitates Growth
As December 31, 2013 |
 15
Top Performing Stock
Cumulative Price Appreciation As of December 31, 2013
|
 Attract and retain high-quality talent
Continue to expand our private client footprint in the U.S.
Continue to expand investment banking capabilities
Focus on quality asset generation within Stifel Bank
Expand traditional asset management capabilities
Approach acquisition opportunities with discipline
Opportunities Drive our Growth
16
Initiatives |
 Global Wealth Management |
 (1)
Includes Independent Contractors.
(2)
CAGR reflects years 2006 to 2013.
Global Wealth Management
Provides Securities Brokerage Services and Stifel Bank Products
CAGR: 29%
CAGR: 25%
18
Grown
from
600+
financial
advisors
in
2005
to
over
2,000
(1)
financial
advisors
currently
Proven organic growth and acquirer of private client business (56 UBS
branches, Butler Wick, Ryan Beck) Retail investors are generally
mid- to long-term buyers
Goal of providing price stability and support to the institutional order
book Strategy of recruiting experienced advisors with established
client relationships Expanding U.S. footprint
Net Revenues ($MM)
(2)
Overview
Operating
Contribution
($MM)
(2) |
 (1)
Includes Independent Contractors. (2) Client assets include
FDIC-insured products as of 12/31/13 for years 2008-2013.
Global Wealth Management
19
Opportunity Through Growth
GWM Account Growth
GWM Broker Growth
(1)
GWM
Assets
Under
Management
Growth
($MM)
(2)
GWM Branch Growth |
 Global Wealth Management –
Stifel Bank & Trust
Offers banking products (securities based loans and
mortgage loans) within the GWM client base,
including establishing trust services
Built-in source of business
High net worth clients
Highly efficient due to lack of “brick and mortar”
deposit focused facilities
Overview
Strength of Brokerage Position
20
Acquired FirstService Bank, a St. Louis-based,
Missouri-chartered commercial bank, in April 2007
Stifel Financial became a bank holding company and
financial services holding company
Balance sheet growth with low-risk assets
Funded by Stifel Nicolaus client deposits
Maintain high levels of liquidity
Interest
Earnings
Assets
(1)
Investment Portfolio
Loan Portfolio (Gross)
Total: $4.2 Billion
Total: $3.1 Billion
(2)
Total: $1.5 Billion
(3)
Data as of 12/31/13. (1) Average interest earning assets as of 12/31/13.
(2) MBS makes up less than 1% of Investment Portfolio. (3) Construction and Land & Commercial Real Estate make up less than 1% of the loan portfolio. |
 Institutional Group |
 (1) Based on 2013 U.S. trading volume per Bloomberg. (2)
Includes TWPG historical investment banking and brokerage revenues for years 2006 through September 30, 2010.
(3) 2012 includes realized and unrealized gains on the Company’s
investment in Knight Capital Group, Inc. of $39.0 million.
Institutional Group
22
Net
Revenues
($MM)
(2)(3)
Equity
Brokerage
+
Investment
Banking
(2)
(3)
Fixed Income Brokerage + Investment Banking
Overview
Provides securities brokerage, trading, research,
underwriting and corporate advisory services
Largest providers of U.S. Equity Research
2
nd
largest Equity trading platform in the U.S.
outside
of
the
Bulge
Bracket
(1)
Full Service Investment Bank
Comprehensive Fixed Income platform |
 Largest provider of U.S. equity research
113 analyst across 12 sectors
Largest provider of Financial Services coverage
Ranked #2 in the FT/Starmine 2013 Survey
Stifel analysts ranked #1 & #2 in Earnings
Estimators among 4,000 analysts
Largest U.S. Equity Research Platform
U.S. Equity Research Coverage
(1)
Coverage Balanced Across All Market Caps
(2)
Institutional Group –
Research
Stifel Research Highlights
23
Companies Under Coverage
Rank
Firm
Overall
Small Cap
(2)
1
Stifel / Keefe, Bruyette & Woods
1,376
426
2
Bank of America Merrill Lynch
1,178
148
3
JPMorgan
1,105
140
4
Goldman Sachs
1,059
76
5
Wells Fargo Securities
1,020
152
6
Raymond James
989
285
7
Credit Suisse
976
146
8
Barclays
966
96
9
Citi
934
96
10
Deutsche Bank
906
118
11
Jefferies LLC
892
166
12
Morgan Stanley
867
84
13
RBC Capital Markets
856
104
14
UBS
766
60
15
Robert W Baird & Co
690
154
16
Sidoti & Company LLC
665
432
17
Morningstar, Inc.
658
N/A
18
Cowen & Co LLC
581
149
19
William Blair & Co LLC
572
150
20
BMO Capital Markets
555
91
21
Piper Jaffray & Co
538
176
22
Keybanc Capital Markets
535
114
23
Oppenheimer & Co Inc
532
108
24
Sterne, Agee & Leach
487
96
25
Macquarie Group
469
N/A
(1) Source: StarMine rankings as of 3/4/14. Does not include Closed End
Funds. (2) Small Cap includes market caps less than $1 billion; Mid
Cap includes market caps less than $5 billion.
Note: Bold font indicates middle–market firms. Research coverage
distribution as of 3/4/14. Small Cap
29%
Mid Cap 36%
Large Cap
35% |
 Institutional Equity Sales
100 person sales force, commission based
Experts in small and mid cap growth and value
Team based sales model with 2-4 sales people per
account
Team leaders have an average of 15 years experience
Offices in all major institutional markets in North
America & Europe
Accounts range from large mutual funds to small
industry focused investors
Managed over 780 non-deal roadshow days in 2013
Extensive experience with traditional and overnight
corporate finance transactions
Equity Trading
53 sales traders located in
Baltimore, New York, Boston, Dallas, San
Francisco, and London
24 position traders covering each major industry
8 specialized traders focused on: Option Trading,
Convertible and ETF Trading
Profitable model with advantages of scale
Institutional Group –
Equity Sales and Trading
Powerful Platform Spanning North America and Europe
24
Extensive Distribution Network
Relationships with over 3,500 institutional accounts globally
Active daily market maker in over 3,700 stocks
Traded over 11.7 billion shares in 2013
Complete coverage of North America and Europe for North American
listed equities
Major liquidity provider to largest equity money management
complexes Multi-execution venues: high-touch, algorithms,
program trading, and direct market access Dedicated convertible
sales, trading, and research desk |
 Overview
Strong Fixed Income Capital Markets Capabilities
Institutional Group –
Fixed Income
Client Distribution
(1)(2)
Platform & Products
(1)
Client
Distribution
is
for
1/1/12
–
10/31/13.
(2)
Other
category
includes:
Corporation,
Hedge
Fund,
Pension
Fund,
Trust
Company,
Foundation,
Endowment,
University
&
Non-Profit.
25
Comprehensive platform
90 traders with annual client trade volume
approaching $400 billion
28-person Fixed Income Research and Strategy
Group
9 person US Debt Capital Markets Group
Widespread distribution
Nearly 200 Institutional sales professionals
covering over 6,200 accounts
36 institutional fixed income offices nationwide
European offices in London and Zurich
Focus on long-only money
managers and income
funds versus hedge funds
Consistency of execution
Identification of relative
value through security
selection
Agency/Gov't Securities
Money Markets
Mortgages & MBS
Reverse MBS
Asset-Backed Securities
Investment Grade Credit
High Yield & Distressed
Aircraft Finance & Credit
Solutions
Whole Loans
Municipals
Emerging Markets
Structured Products
Stifel Capital Advisors
Hybrid Securities
Dedicated Loan Trading Group
Capable UK Sales & Trading
platform (former Knight team) |
 Accomplished U.S. Equity Underwriting Franchise –
All Equity Transactions
Investment Banking
Bookrun Equity Deals Since 2010
All Managed Equity Deals Since 2010
26
($ in billions)
# of
$
Rank
Firm
Deals
Volume
1
Bank of America Merrill Lynch
893
$524.7
2
JPMorgan
883
$510.4
3
Citi
833
$505.4
4
Morgan Stanley
789
$487.1
5
Barclays
732
$423.8
6
Deutsche Bank
715
$424.1
6
Wells Fargo Securities
715
$373.2
8
Credit Suisse
710
$420.0
9
Stifel / Keefe, Bruyette & Woods
695
$246.4
10
RBC Capital Markets
642
$304.2
11
Goldman Sachs
631
$425.8
12
UBS
570
$320.3
13
Raymond James
469
$226.9
14
Piper Jaffray & Co
347
$158.0
15
Robert W Baird & Co
343
$92.5
16
Jefferies LLC
336
$70.6
17
Oppenheimer & Co Inc
310
$77.1
18
JMP Securities LLC
306
$57.5
19
William Blair & Co LLC
246
$67.5
19
Cowen & Co LLC
246
$54.8
($ in billions)
# of
$
Rank
Firm
Deals
Volume
1
Bank of America Merrill Lynch
813
$97.5
2
JPMorgan
777
$100.7
3
Citi
724
$93.0
4
Morgan Stanley
722
$110.5
5
Barclays
601
$85.4
6
Credit Suisse
568
$71.6
7
Goldman Sachs
563
$95.6
8
Deutsche Bank
556
$61.7
9
Wells Fargo Securities
500
$39.4
10
UBS
391
$39.3
11
Jefferies LLC
271
$15.9
12
RBC Capital Markets
245
$18.9
13
Stifel / Keefe, Bruyette & Woods
223
$10.6
14
Raymond James
138
$7.3
15
Piper Jaffray & Co
119
$5.3
16
Cowen & Co LLC
97
$3.1
17
Roth Capital Partners
86
$1.7
18
Robert W Baird & Co
79
$3.6
19
Leerink Partners LLC
75
$2.9
20
Lazard Capital Markets
62
$1.8
Source:
Dealogic.
Rank
eligible
SEC
registered
IPOs
and
Follow-On
offerings
since
2010.
Includes
demutualizations.
As
of
2/28/14.
Overlapping
deals
between
Stifel
and
its
acquired
firms
have
been
removed.
Note: $ Volume represents full credit to underwriter for All Managed
Equity Deals and apportioned credit to bookrunner for Bookrun Equity Deals. Bold font indicates middle-market firms. |
 Financial Results |
 28
Stifel Financial Results
Three months ended December 31, 2013
($ in thousands, except per share amounts)
Non-GAAP
Non-Core
GAAP
12/31/12
% Change
9/30/13
% Change
Total revenues
576,236
$
(2,080)
$
574,156
$
419,885
$
37.2%
491,169
$
17.3%
Interest expense
11,555
75
11,630
8,602
34.3%
11,535
0.2%
Net revenues
564,681
(2,155)
562,526
411,283
37.3%
479,634
$
17.7%
Compensation and benefits
347,263
5,944
353,207
258,148
34.5%
297,374
16.8%
Non-comp operating expenses
126,990
4,340
131,330
92,784
36.9%
116,817
8.7%
Total non-interest expenses
474,253
10,284
484,537
350,932
35.1%
414,191
14.5%
Income from continuing operations before income taxes
90,428
(12,439)
77,989
60,351
49.8%
65,443
38.2%
Provision for income taxes
30,609
(4,746)
25,863
17,067
79.3%
25,795
18.7%
Net income from continuing operations
59,819
$
(7,693)
$
52,126
$
43,284
$
38.2%
39,648
$
50.9%
Discontinued operations:
Loss from discontinued operations, net
-
(3,857)
(3,857)
(3,330)
nm
-
-
Net income
59,819
$
(11,550)
$
48,269
$
39,954
$
49.7%
39,648
$
50.9%
Earnings per diluted common share:
Income from continuing operations
0.79
$
(0.10)
$
0.69
$
0.80
$
(1.3%)
0.53
$
49.1%
Loss from discontinued operations
-
(0.05)
(0.05)
$
(0.06)
-
Earnings per diluted common share
0.79
$
(0.15)
$
0.64
$
0.74
$
6.8%
0.53
$
49.1%
Weighted average number of shares outstanding:
Diluted
75,495
75,495
63,301
19.3%
75,191
0.4%
Ratios to net revenues:
Compensation and benefits
61.5%
62.8%
62.7%
62.0%
Non-comp operating expenses
22.5%
23.3%
22.6%
24.4%
Income from continuing operations before income taxes
16.0%
13.9%
14.7%
13.6%
Three Months Ended December 31, 2013
Three Months Ended
(1)
Non-core adjustments consist of merger-related revenues and
expenses associated with our acquisitions of KBW, the Knight Capital Fixed Income business, and Miller Buckfire and
discontinued operations of SN Canada.
(2)
Core (non-GAAP) results for the three months ended December 31, 2012
are the same as GAAP results. Results for the three months ended September 30, 2013 are Core (non-GAAP).
(1)
(2)
(2) |
 29
Stifel Financial Results
Year ended December 31, 2013
($ in thousands, except per share amounts)
Non-GAAP
Non-Core
GAAP
12/31/12
% Change
Total revenues
2,024,538
$
(4,724)
$
2,019,814
$
1,627,483
$
24.4%
Interest expense
46,198
170
46,368
33,370
38.4%
Net revenues
1,978,340
(4,894)
1,973,446
1,594,113
24.1%
Compensation and benefits
1,236,991
74,395
1,311,386
1,010,140
22.5%
Non-comp operating expenses
446,265
30,566
476,831
354,226
26.0%
Total non-interest expenses
1,683,256
104,961
1,788,217
1,364,366
23.4%
Income from continuing operations before income taxes
295,084
(109,855)
185,229
229,747
28.4%
Provision for income taxes
110,426
(98,104)
12,322
84,451
30.8%
Net income from continuing operations
184,658
$
(11,751)
$
172,907
$
145,296
$
27.1%
Discontinued operations:
Loss from discontinued operations, net
-
(10,894)
(10,894)
(6,723)
(100.0%)
Net income
184,658
$
(22,645)
$
162,013
$
138,573
$
33.3%
Earnings per diluted common share:
Income from continuing operations
2.51
$
(0.16)
$
2.35
$
2.31
$
8.7%
Loss from discontinued operations, net
-
(0.15)
(0.15)
(0.11)
(100.0%)
Earnings per diluted common share
2.51
$
(0.31)
$
2.20
$
2.20
$
14.1%
Weighted average number of shares outstanding:
Diluted
73,504
73,504
62,937
16.8%
Ratios to net revenues
:
Compensation and benefits
62.5%
66.5%
63.4%
Non-comp operating expenses
22.6%
24.1%
22.2%
Income from continuing operations before income taxes
14.9%
9.4%
14.4%
Year Ended December 31, 2013
Year Ended
(1)
Non-core
adjustments
consist
of
charges
related
to
expensing
stock
awards
issued
as
retention
in
connection
with
the
acquisitions
of
KBW
and
the
Knight
Capital
Fixed
Income
business
and
other
merger-related
revenues
and
expenses
associated
with
our
acquisitions
of
KBW,
the
Knight
Capital
Fixed
Income
business,
Miller
Buckfire
and
a
U.S.
tax
benefit
in
connection
with
discontinuing
operations of SN Canada.
(2)
Core (non-GAAP) results for the year ended December 31, 2012 are the
same as GAAP results. (1)
(2) |
 30
Sources of Revenues
($ in thousands)
12/31/13
12/31/12
%
Change
9/30/13
%
Change
12/31/13
12/31/12
%
Change
Commissions
152,451
$
131,327
$
16.1%
145,837
$
4.5%
598,949
$
501,434
$
19.4%
Principal transactions
118,815
97,515
21.8%
122,583
(3.1%)
459,968
408,935
12.5%
Brokerage revenues
271,266
228,842
18.5%
268,420
1.1%
1,058,917
910,369
16.3%
Capital raising
71,379
46,320
54.1%
53,665
33.0%
246,631
185,761
32.8%
Advisory
87,481
26,618
228.7%
39,186
123.2%
201,429
95,519
110.9%
Investment banking
158,860
72,938
117.8%
92,851
71.1%
448,060
281,280
59.3%
Asset mgt and service fees
83,928
68,971
21.7%
76,710
9.4%
305,639
257,981
18.5%
Other
19,391
19,157
1.2%
13,063
48.4%
64,659
69,148
(6.5%)
Total operating revenues
533,445
389,908
36.8%
451,044
18.3%
1,877,275
1,518,778
23.6%
Interest revenue
40,711
29,977
35.8%
39,130
4.0%
142,539
108,705
31.1%
Total revenues
574,156
419,885
36.7%
490,174
17.1%
2,019,814
1,627,483
24.1%
Interest expense
11,630
8,602
35.2%
11,535
0.8%
46,368
33,370
39.0%
Net revenues
562,526
$
411,283
$
36.8%
478,639
$
17.5%
1,973,446
$
1,594,113
$
23.8%
Three Months Ended
Year Ended |
 31
Core Non-Interest Expenses
Three months ended December 31, 2013
($ in thousands)
12/31/13
(1)
12/31/12
% Change
9/30/13
% Change
12/31/13
(1)
12/31/12
9/30/13
Net revenues
564,681
$
411,283
$
37.3%
479,634
$
17.7%
100.0%
100.0%
100.0%
Compensation and benefits
324,569
237,465
36.7%
275,503
17.8%
57.5%
57.7%
57.4%
Transitional pay
(2)
22,694
20,683
9.7%
21,871
3.8%
4.0%
5.0%
4.6%
Total compensation and benefits
347,263
258,148
34.5%
297,374
16.8%
61.5%
62.8%
62.0%
Occupancy and equipment rental
40,892
33,589
21.7%
39,856
2.6%
7.2%
8.2%
8.3%
Communication and office supplies
24,974
19,291
29.5%
25,105
(0.5%)
4.4%
4.7%
5.2%
Commissions and floor brokerage
8,213
7,271
13.0%
9,775
(16.0%)
1.5%
1.8%
2.0%
Other operating expenses
52,911
32,633
62.1%
42,080
25.7%
9.3%
7.9%
8.7%
Total non-comp operating expenses
126,990
92,784
36.9%
116,816
8.7%
22.4%
22.6%
24.4%
Total non-interest expense
474,253
350,932
35.1%
414,190
14.5%
84.0%
85.3%
86.4%
Income from continuing operations before income taxes
90,428
60,351
49.8%
65,444
38.2%
16.0%
14.7%
13.6%
Provision for income taxes
30,609
17,067
79.3%
25,795
18.7%
5.4%
4.0%
5.4%
Non-GAAP net income from continuing operations
59,819
$
43,284
$
38.2%
39,649
$
50.9%
10.6%
10.5%
8.3%
Non-core expenses (after-tax)
(7,693)
-
35,280
GAAP net income from continuing operations
52,126
$
43,284
$
74,929
$
Three Months Ended
% of Net revenues
(1)
Excludes non-core adjustments consisting of merger-related
revenues and expenses associated with our acquisitions of KBW, the Knight Capital Fixed Income business, and Miller Buckfire.
(2)
Transition pay includes amortization of retention awards, signing bonuses,
and upfront notes. |
 32
Core Non-Interest Expenses
Year ended December 31, 2013
($ in thousands)
12/31/13
(1)
12/31/12
% Change
12/31/13
(1)
12/31/12
Net revenues
1,978,340
$
1,594,113
$
24.1%
100.0%
100.0%
Compensation and benefits
1,150,883
937,066
22.8%
58.2%
58.8%
Transitional pay
86,108
73,074
17.8%
4.4%
4.6%
Total compensation and benefits
1,236,991
1,010,140
22.5%
62.5%
63.4%
Occupancy and equipment rental
149,488
128,365
16.5%
7.6%
8.1%
Communication and office supplies
95,539
79,406
20.3%
4.8%
5.0%
Commissions and floor brokerage
35,812
29,610
20.9%
1.8%
1.9%
Other operating expenses
165,426
116,845
41.6%
8.4%
7.3%
Total non-comp operating expenses
446,265
354,226
26.0%
22.6%
22.2%
Total non-interest expense
1,683,256
1,364,366
23.4%
85.1%
85.6%
Income from continuing operations before income taxes
295,084
229,747
28.4%
14.9%
14.4%
Provision for income taxes
110,426
84,451
30.8%
5.6%
5.2%
Non-GAAP net income from continuing operations
184,658
$
145,296
$
27.1%
9.3%
9.1%
Non-core expenses (after-tax)
(11,751)
-
GAAP net income from continuing operations
172,907
$
145,296
$
Year Ended
% of Net revenues
(1)
Excludes non-core adjustments consisting of charges related to
expensing stock awards issued as retention in connection with the acquisitions of KBW and the Knight Capital Fixed Income business and other
merger-related
revenues
and
expenses
associated
with
our
acquisitions
of
KBW,
the
Knight
Capital
Fixed
Income
business,
Miller
Buckfire
and
a
U.S.
tax
benefit
in
connection
with
discontinuing
operations
of
SN
Canada. |
 33
Segment Comparison -
Core
($ in thousands)
12/31/13
12/31/12
(1)
%
Change
9/30/13
%
Change
12/31/13
12/31/12
(1)
%
Change
Net revenues:
Global Wealth Management
292,836
$
253,775
$
15.4%
274,669
$
6.6%
1,117,179
$
991,597
$
12.7%
Institutional Group
267,282
160,693
66.3%
205,132
30.3%
861,158
604,654
42.4%
Other
4,563
(3,185)
(243.3%)
(167)
nm
3
(2,138)
(100.1%)
564,681
$
411,283
$
37.3%
479,634
$
17.7%
1,978,340
$
1,594,113
$
24.1%
Operating contribution:
Global Wealth Management
79,022
$
68,737
$
15.0%
72,128
$
9.6%
299,572
$
266,669
$
12.3%
Institutional Group
48,590
21,678
124.1%
34,986
38.9%
142,889
101,487
40.8%
Other
(37,184)
(30,064)
23.7%
(41,671)
(10.8%)
(147,377)
(138,409)
6.5%
90,428
$
60,351
$
49.8%
65,443
$
38.2%
295,084
$
229,747
$
28.4%
Operating contribution
(2)
Global Wealth Management
27.0
27.1
26.3
26.8
26.9
Institutional Group
18.2
13.5
17.1
16.6
16.8
Other
(6.6)
(7.3)
(8.7)
(7.4)
(8.7)
16.0
14.7
13.6
14.9
14.4
As a percentage of net revenues:
Three Months Ended
Year Ended
(1)
Core
(non-GAAP)
results
for
the
three
and
twelve
months
ended
December
31,
2012
are
the
same
as
GAAP
results.
(2)
Contribution margin for the other segment is divided by consolidated net
revenues. |
 34
Global Wealth Management
($ in thousands)
12/31/13
12/31/12
% Change
9/30/13
% Change
12/31/13
12/31/12
% Change
Commissions
104,149
$
93,043
$
11.9%
99,427
$
4.7%
410,238
$
361,871
$
13.4%
Principal transactions
55,809
53,542
4.2%
58,658
(4.9%)
227,087
225,007
0.9%
Asset management & service fees
82,964
68,631
20.9%
76,667
8.2%
304,541
257,257
18.4%
Net interest
31,092
21,182
46.8%
27,665
12.4%
104,748
79,328
32.0%
Investment banking
9,568
10,818
(11.6%)
9,394
1.8%
45,400
44,919
1.1%
Other income
9,254
6,559
41.1%
2,858
223.9%
25,165
23,215
8.4%
Net revenues
292,836
253,775
15.4%
274,669
6.6%
1,117,179
991,597
12.7%
Compensation and benefits
167,980
146,311
14.8%
159,949
5.0%
648,681
576,744
12.5%
Non-comp operating expenses
45,834
38,727
18.4%
42,592
7.6%
168,926
148,184
14.0%
Total non-interest expenses
213,814
185,038
15.6%
202,541
5.6%
817,607
724,928
12.8%
Income before income taxes
79,022
$
68,737
$
15.0%
72,128
$
9.6%
299,572
$
266,669
$
12.3%
Compensation and benefits
57.4%
57.7%
58.2%
58.1%
58.2%
Non-comp operating expenses
15.6%
15.2%
15.5%
15.1%
14.9%
Income before income taxes
27.0%
27.1%
26.3%
26.8%
26.9%
Three Months Ended
Year Ended
Ratios to net revenues
: |
 35
Stifel Bank & Trust (an operating unit of GWM)
As of
12/31/13
12/31/12
% Change
9/30/13
% Change
Assets
$
5,027,023
$
3,650,235
37.7
$
4,547,071
10.6
Investment securities
3,062,549
2,327,316
31.6
2,949,080
3.8
Retained loans, net
1,412,136
822,711
71.6
1,061,313
33.1
Loans held for sale
109,110
214,531
(49.1)
75,440
44.6
Deposits
4,663,323
3,346,133
39.4
4,228,405
10.3
Allowance for loan losses
12,668
$
8,145
$
55.5
13,233
$
(4.3)
Allowance as a percentage of loans
0.89
%
0.99
%
1.23
%
Non-performing loans
1,504
$
1,808
$
(16.8)
14,759
$
(89.8)
Other non-performing assets
131
373
(64.9)
-
100.0
Non-performing assets
1,635
$
2,181
$
(25.0)
14,759
$
(88.9)
Non-performing assets as a percentage of
total assets
0.03
%
0.06
%
0.32
%
As of |
 36
Institutional Group
($ in thousands)
12/31/13
12/31/12
% Change
9/30/13
% Change
12/31/13
12/31/12
% Change
Net revenues
267,282
$
160,693
$
66.3%
205,132
$
30.3%
861,158
$
604,654
$
42.4%
Compensation and benefits
165,779
105,025
57.8%
119,874
38.3%
524,870
380,185
38.1%
Non-comp operating expenses
52,913
33,990
55.7%
50,272
5.3%
193,399
122,982
57.3%
Total non-interest expenses
218,692
139,015
57.3%
170,146
28.5%
718,269
503,167
42.7%
Income before income taxes
48,590
$
21,678
$
124.1%
34,986
$
38.9%
142,889
$
101,487
$
40.8%
Ratios to net revenues
:
Compensation and benefits
62.0%
65.4%
58.4%
60.9%
62.9%
Non-comp operating expenses
19.8%
21.1%
24.5%
22.5%
20.3%
Income before income taxes
18.2%
13.5%
17.1%
16.6%
16.8%
Three Months Ended
Year Ended |
 37
Institutional Group Revenues
($ in thousands)
12/31/13
12/31/12
% Change
9/30/13
% Change
12/31/13
12/31/12
% Change
Institutional brokerage:
Equity
60,204
$
38,659
$
55.7%
58,677
$
2.6%
232,392
$
151,308
$
53.6%
Fixed income
51,103
43,598
17.2%
51,658
(1.1%)
189,200
172,183
9.9%
111,307
82,257
35.3%
110,335
0.9%
421,592
323,491
30.3%
Investment Banking:
Capital raising
Equity
46,634
16,947
175.2%
30,739
51.7%
142,636
81,818
74.3%
Fixed income
14,677
18,555
(20.9%)
13,531
8.5%
58,096
59,024
(1.6%)
61,311
35,502
72.7%
44,270
38.5%
200,732
140,842
42.5%
Advisory fees
87,981
26,618
230.5%
39,186
124.5%
201,928
95,519
111.4%
Investment banking
149,292
62,120
140.3%
83,456
78.9%
402,660
236,361
70.4%
Other
(1)
6,683
16,316
(59.0%)
11,341
(41.1%)
36,906
44,802
(17.6%)
Total net revenue
267,282
$
160,693
$
66.3%
205,132
$
30.3%
861,158
$
604,654
$
42.4%
Three Months Ended
Year Ended
(1)
Includes net interest and other income. |