Attached files
| file | filename |
|---|---|
| 8-K - CHINA FUND INC | fp0009976_8k.htm |
|
Feb 28, 2014
|
Monthly Insight
The China Fund, Inc. (CHN)
|
|
Investment Objective
|
The investment objective of the Fund is to achieve long term capital appreciation. The Fund seeks to achieve its objective through investment in the equity securities of companies and other entities with significant assets, investments, production activities, trading or other business interests in China or which derive a significant part of their revenue from China.
The Fund has an operating policy that the Fund will invest at least 80% of its assets in China companies. For this purpose, ‘China companies’ are (i) companies for which the principal securities trading market is in China; (ii) companies for which the principal securities trading market is outside of China or in companies organized outside of China, that in both cases derive at least 50% of their revenues from goods or services sold or produced, or have a least 50% of their assets in China; or (iii) companies organized in China. Under the policy, China means the People’s Republic of China, including Hong Kong, and Taiwan. The Fund will provide its stockholders with at least 60 days’ prior notice of any change to this policy.
|
Performance Overview
|
|
Performance History
|
1 month
|
3 months
|
YTD
|
1 Year
|
3 Years (p.a.)
|
5 Years (p.a.)
|
10 Years (p.a.)
|
Since Inception
|
|
NAV (%)
|
2.48
|
-1.58
|
-1.30
|
10.23
|
1.34
|
18.31
|
12.71
|
10.88
|
|
Market price (%)
|
2.82
|
-2.21
|
-3.80
|
6.99
|
-0.43
|
18.01
|
9.37
|
9.82
|
|
Benchmark (%)
|
2.86
|
-3.99
|
-2.78
|
2.82
|
2.58
|
16.66
|
8.14
|
N/A
|
|
Performance History
|
2013
|
2012
|
2011
|
2010
|
2009
|
2008
|
2007
|
2006
|
|
NAV (%)
|
17.03
|
12.07
|
-24.37
|
27.25
|
72.82
|
-46.95
|
86.20
|
57.10
|
|
Market price (%)
|
11.48
|
20.46
|
-27.51
|
23.60
|
72.19
|
-40.65
|
50.24
|
65.67
|
|
Benchmark (%)
|
7.25
|
22.65
|
-18.36
|
13.60
|
67.12
|
-49.37
|
37.97
|
39.50
|
Source: State Street Bank and Trust Company. Source for index data: MSCI as at Feb 28, 2014.
|
Portfolio Analysis
|
|
Sector allocation (%)
|
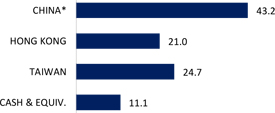
Country allocation (%)
|
 |
 |
|
Source: State Street Bank and Trust Company as at Feb 28, 2014.
|
* China includes A-shares (0.8%), A-share equity linked securities (8.2%), B-shares (0.0%), H-shares (21.2%) and Red-chips (13.0%).
|

The China Fund, Inc. (CHN)
|
Portfolio Analysis (continued)
|
|
Top 10 Holdings
|
Sector
|
%
|
|
BEIJING ENTERPRISES HOLDINGS, LTD.
|
INDUSTRIALS
|
4.5
|
|
HUTCHISON WHAMPOA, LTD.
|
INDUSTRIALS
|
3.7
|
|
TENCENT HOLDINGS, LTD.
|
I.T.
|
3.7
|
|
CHINA MINSHENG BANKING CORP., LTD.
|
FINANCIALS
|
3.6
|
|
TAIWAN SEMICONDUCTOR MANUFACTURING CO., LTD.
|
I.T.
|
3.1
|
|
TONG HSING ELECTRONIC INDUSTRIES
|
I.T.
|
3.0
|
|
LI & FUNG, LTD.
|
CONSUMER DISCRETIONARY
|
3.0
|
|
PETROCHINA CO., LTD
|
ENERGY
|
2.8
|
|
HERMES MICROVISION, INC.
|
I.T.
|
2.8
|
|
PING AN INSURANCE, LTD.
|
FINANCIALS
|
2.6
|
|
Total
|
32.8
|
|
Source: State Street Bank and Trust Company as at Feb 28, 2014.
|
Fund Details
|
|
NAV
|
$22.72
|
|
Market price
|
$20.02
|
|
Premium/Discount
|
-11.96%
|
|
Market cap
|
US$313.95m
|
|
Shares outstanding
|
15,682,029
|
|
Exchange listed
|
NYSE
|
|
Listing date
|
July 10, 1992
|
|
Benchmark
|
MSCI Golden Dragon Index (Total Return)
|
|
Fund Manager
|
Christina Chung
|
|
Listed and direct investment manager
|
RCM Asia Pacific Limited
|
Source: State Street Bank and Trust Company as at Feb 28, 2014.
|
Distribution History (10 years)
|
|
Declaration
date
|
Ex-dividend
date
|
Record
date
|
Payable
date
|
Dividend/
Share
|
Income
|
Long-term Capital
|
Short-term Capital
|
|
13 Dec 2013
|
19 Dec 2013
|
23 Dec 2013
|
27 Dec 2013
|
3.3140
|
0.4387
|
2.8753
|
0.0000
|
|
10 Dec 2012
|
20 Dec 2012
|
24 Dec 2012
|
28 Dec 2012
|
3.2517
|
0.3473
|
2.9044
|
0.0000
|
|
8 Dec 2011
|
21 Dec 2011
|
23 Dec 2011
|
29 Dec 2011
|
2.9964
|
0.1742
|
2.8222
|
0.0000
|
|
8 Dec 2010
|
21 Dec 2010
|
24 Dec 2010
|
29 Dec 2010
|
2.2742
|
0.3746
|
1.8996
|
0.0000
|
|
9 Dec 2009
|
22 Dec 2009
|
24 Dec 2009
|
29 Dec 2009
|
0.2557
|
0.2557
|
0.0000
|
0.0000
|
|
8 Dec 2008
|
22 Dec 2008
|
24 Dec 2008
|
23 Jan 2009
|
5.8174
|
0.4813
|
5.3361
|
0.0000
|
|
7 Dec 2007
|
19 Dec 2007
|
21 Dec 2007
|
25 Jan 2008
|
12.1200
|
0.2800
|
9.0000
|
2.8400
|
|
8 Dec 2006
|
19 Dec 2006
|
21 Dec 2006
|
29 Dec 2006
|
4.0117
|
0.2996
|
2.7309
|
0.9812
|
|
9 Dec 2005
|
19 Dec 2005
|
21 Dec 2005
|
29 Dec 2005
|
2.5119
|
0.2172
|
2.2947
|
0.0000
|
|
13 Dec 2004
|
20 Dec 2004
|
22 Dec 2004
|
7 Jan 2005
|
3.5701
|
0.1963
|
3.2664
|
0.1074
|
Source: State Street Bank and Trust Company as at December 31, 2013. Dividend/Share includes Income, Long-term Capital gains and Short-term Capital gains.
2
The China Fund, Inc. (CHN)
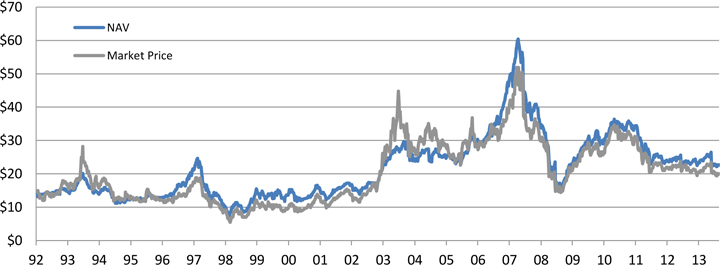
The China Fund Inc. NAV Performance of USD $10,000 since inception (with dividends reinvested at NAV price)

Past performance is not a guide to future returns.
Source: State Street Bank and Trust Company as at Feb 28, 2014.
The China Fund Inc. Premium / Discount
Past performance is not a guide to future returns.
Source: State Street Bank and Trust Company as at Feb 28, 2014.
3
The China Fund, Inc. (CHN)
Manager’s Commentary
The Chinese equity markets rebounded during the month after a sharp sell-off in late January. The ride was bumpy due to the recent renminbi volatility, continued lackluster macro-economic data and tightened lending policies impacting the property sector. Stocks relating to the internet, environment and clean energy continued to perform strongly ahead of the National People’s Congress (“NPC”) and the second plenary session of 18th Central Committee of the Communist Party of China (“CPC”) held in early March. News of Sinopec looking to sell as much as 30% of its retail business lifted market optimism on stated-owned enterprise reform. In addition, there are expectations for managing local government debt problems, regulating shadow banking and internet finance, and promoting environmental protection and new energy.
Tencent and Macau gaming stocks continued to be in favor with the former driven by news of merger and acquisitions in the internet sector while the latter was supported by the strong year-to- date gaming revenue figures.
In Taiwan, as per a recent release of more encouraging economic data, the pace of economic recovery is picking up. While the non- tech name valuations are rich after the rebound from the drop in the fourth quarter of 2013, tech names are looking more appealing in the medium term for their relatively attractive valuations and recovery of the IT sector globally.
Fund Review
The Fund underperformed the benchmark for the month. An overweight in information technology and stock selection in industrials contributed the most to relative returns, while stock selection in financials and consumer discretionary detracted. The top two contributors for the month were Hermes Microvision and Beijing Enterprises. Hermes Microvision reported better than expected fourth quarter earnings results, driven by improved profit margins. It is expected that the company will benefit from the increasing demand for semiconductor wafer inspection tools. There was no material or specific news on Beijing Enterprises, however, stocks relating to clean energy themes overall outperformed ahead of the NPC and CPC meetings held in early March with expectation of favorable government policies on environmental protection. Conversely, one of the main detractors was Semiconductor Manufacturing International Corporation (SMIC). The company posted a worse-than-expected fourth quarter earnings result. However, we remain positive on the company, riding on the strong growth of the IT sector in China in the medium term. Another top detractor was Li & Fung, as the share price pulled back after the strong performance in January. The company will benefit from the US economic recovery and its restructuring exercise.
Outlook
The Hong Kong and China equity markets will continue to be range bound. Reform initiatives and low valuations will provide downside share price support. However, currency volatility coupled with political uncertainties in the global arena will undermine fund flow into emerging markets including China. Against this backdrop, we will continue to focus on stock selection to drive portfolio returns.
In Taiwan, despite a potential increase in volatility of global equity markets, we believe the Taiwan stock market will stay on its uptrend, supported by recovering exports and the broader economy as well as the corporate earnings growth.
Source : RCM Asia Pacific Limited as at February 28, 2014.
The China Fund, Inc. (CHN)
Portfolio Holdings
|
CUSIP
|
Security Description
|
Cost Base
|
Base MV
|
Shares
|
Percentage of Net Assets
|
|
608169900
|
Beijing Enterprises Holdings, Ltd.
|
12,981,141
|
16,127,952
|
1,683,500
|
4.5
|
|
644806002
|
Hutchison Whampoa, Ltd.
|
10,763,479
|
13,140,788
|
975,000
|
3.7
|
|
B01CT3905
|
Tencent Holdings, Ltd.
|
4,429,340
|
13,017,962
|
162,300
|
3.7
|
|
B57JY2909
|
China Minsheng Banking Corp., Ltd.
|
14,491,196
|
12,958,264
|
13,027,000
|
3.6
|
|
688910900
|
Taiwan Semiconductor Manufacturing Co., Ltd.
|
8,470,505
|
11,103,703
|
3,115,000
|
3.1
|
|
B1L8PB906
|
Tong Hsing Electronic Industries, Ltd.
|
9,584,674
|
10,847,350
|
2,067,000
|
3.0
|
|
628625907
|
Li & Fung, Ltd.
|
11,326,774
|
10,473,233
|
8,016,000
|
3.0
|
|
622657906
|
PetroChina Co., Ltd.
|
9,815,518
|
10,055,759
|
9,564,000
|
2.8
|
|
B3WH02907
|
Hermes Microvision, Inc.
|
7,867,215
|
10,032,676
|
269,000
|
2.8
|
|
B01FLR903
|
Ping An Insurance (Group) Company of China, Ltd.
|
9,814,375
|
9,371,040
|
1,153,500
|
2.6
|
|
637248907
|
MediaTek, Inc.
|
7,101,686
|
9,209,024
|
627,000
|
2.6
|
|
671815900
|
Qingling Motors Co., Ltd.
|
8,718,221
|
8,582,454
|
28,960,000
|
2.4
|
|
635186901
|
Digital China Holdings, Ltd.
|
14,515,900
|
8,507,330
|
8,597,000
|
2.4
|
|
B00G0S903
|
CNOOC, Ltd.
|
10,305,318
|
8,457,109
|
5,160,000
|
2.4
|
|
17313A533
|
Gree Electric Appliances, Inc. Access Product (expiration 01/16/15)
|
6,453,442
|
8,334,129
|
1,838,546
|
2.3
|
|
626073902
|
Delta Electronics, Inc.
|
4,010,493
|
7,925,028
|
1,425,000
|
2.2
|
|
607355906
|
China Mobile, Ltd.
|
8,371,940
|
7,754,205
|
816,000
|
2.2
|
|
658444906
|
Merida Industry Co., Ltd.
|
6,624,016
|
7,562,908
|
1,126,000
|
2.1
|
|
B1DYPZ905
|
China Merchants Bank Co., Ltd.
|
9,119,882
|
7,556,188
|
4,312,000
|
2.1
|
|
B2R2ZC908
|
CSR Corp., Ltd.
|
7,466,210
|
7,433,794
|
9,930,000
|
2.1
|
|
663094902
|
China Everbright International, Ltd.
|
2,128,912
|
7,125,478
|
4,868,000
|
2.0
|
|
674347901
|
Semiconductor Manufacturing International Corp.
|
7,943,834
|
6,880,300
|
79,698,000
|
1.9
|
|
685992000
|
Sun Hung Kai Properties, Ltd.
|
7,077,680
|
6,662,748
|
521,000
|
1.9
|
|
B1G1QD902
|
Industrial & Commercial Bank of China, Ltd.
|
6,201,503
|
5,959,387
|
9,925,000
|
1.7
|
|
674842901
|
Ruentex Development Co., Ltd.
|
2,674,949
|
5,880,931
|
3,311,904
|
1.7
|
|
620267906
|
Advantech Co., Ltd.
|
2,851,925
|
5,739,059
|
908,000
|
1.6
|
|
ACI009HH0
|
China Suntien Green Energy Corp., Ltd.
|
4,612,718
|
5,419,781
|
12,785,000
|
1.6
|
|
B58J1S907
|
Chailease Holding Co., Ltd.
|
5,196,680
|
5,242,392
|
2,132,000
|
1.5
|
|
645166901
|
Largan Precision Co., Ltd.
|
3,937,557
|
5,238,299
|
118,000
|
1.5
|
|
B236JB905
|
Tiangong International Co., Ltd.
|
5,449,044
|
5,119,476
|
18,480,000
|
1.4
|
|
B0Y91C906
|
China National Building Material Co., Ltd.
|
5,073,552
|
4,426,597
|
4,630,000
|
1.2
|
|
B633D9904
|
Zhongsheng Group Holdings, Ltd.
|
3,919,603
|
4,324,316
|
2,996,500
|
1.2
|
|
644094906
|
Taiwan FamilyMart Co., Ltd.
|
482,446
|
4,322,382
|
685,652
|
1.2
|
|
613623909
|
Hengan International Group Co., Ltd.
|
3,889,897
|
4,073,870
|
375,500
|
1.1
|
|
ACI07WMD5
|
China International Travel Service Corp., Ltd. (expiration 08/25/15)
|
3,801,918
|
3,883,803
|
626,632
|
1.1
|
|
B688XD907
|
Beijing Jingneng Clean Energy Co., Ltd.
|
3,525,009
|
3,773,296
|
6,244,000
|
1.1
|
|
665157905
|
Comba Telecom Systems Holdings, Ltd.
|
7,565,579
|
3,671,213
|
10,958,500
|
1.0
|
|
913BMZ902
|
Ping An Insurance (Group) Company of China, Ltd. Access Product (expiration 06/30/15)
|
3,600,309
|
3,408,433
|
541,933
|
1.0
|
|
17313X574
|
China State Construction Engineering Corp., Ltd. (expiration 01/16/15)
|
4,674,320
|
3,400,231
|
7,375,772
|
1.0
|
|
643280902
|
Chipbond Technology Corp.
|
3,949,251
|
3,275,754
|
1,916,000
|
0.9
|
|
B45BF9907
|
Sanan Optoelectronics Co., Ltd. (expiration date 02/15/16)
|
3,541,260
|
3,220,462
|
871,809
|
0.9
|
|
ACI07LD80
|
Dongxu Optoelectronic Technology Co., Ltd. (expiration 06/30/15)
|
2,846,947
|
3,144,374
|
962,760
|
0.9
|
|
B16NHT900
|
Shui On Land, Ltd.
|
4,155,621
|
3,034,192
|
11,055,500
|
0.8
|
|
993HWH901
|
Daqin Railway Co., Ltd. Access Product (expiration 11/02/16)
|
2,786,924
|
2,721,670
|
2,449,968
|
0.8
|
|
B3VN92906
|
HAND Enterprise Solutions Co., Ltd.
|
141,735
|
2,666,409
|
755,073
|
0.8
|
|
651795908
|
Natural Beauty Bio-Technology, Ltd.
|
4,906,910
|
2,643,400
|
47,710,000
|
0.7
|
|
42751U205
|
Hermes Microvision, Inc.
|
1,368,073
|
1,748,901
|
46,900
|
0.5
|
|
B1B25Q909
|
Daqin Railway Co., Ltd. Access Product (expiration 01/20/15)
|
1,246,037
|
1,189,084
|
1,070,283
|
0.3
|
|
BK33KZ907
|
Poly Culture Group Corp., Ltd.
|
316,106
|
40,304
|
73,600
|
0.0
|
|
ACI0090H8
|
Zong Su Foods
|
15,000,034
|
—
|
2,677
|
0.0
|
Source: State Street Bank and Trust Company as at Feb 28, 2014.
5
The China Fund, Inc. (CHN)
|
The information contained herein has been obtained from sources believed to be reliable but RCM (an Allianz Global Investors company) and its affiliates do not warrant the information to be accurate, complete or reliable. The opinions expressed herein are subject to change at any time and without notice. Past performance is not indicative of future results. This material is not intended as an offer or solicitation for the purchase or sale of any financial instrument. Investors should consider the investment objectives, risks, charges and expenses of any mutual fund carefully before investing. This and other information is contained in the fund’s annual and semiannual reports, proxy statement and other fund information, which may be obtained by contacting your financial advisor or visiting the fund’s website at www.chinafundinc.com. This information is unaudited and is intended for informational purposes only. It is presented only to provide information on investment strategies and opportunities. The Fund seeks to achieve its objective through investment in the equity securities of companies and other entities with significant assets, investments, production activities, trading or other business interests in China or which derive a significant part of their revenue from China. Investing in non-U.S. securities entails additional risks, including political and economic risk and the risk of currency fluctuations, as well as lower liquidity. These risks, which can result in greater price volatility, will generally be enhanced in less diversified funds that concentrate investments in a particular geographic region. The Fund is a closed-end exchange traded management investment company. This material is presented only to provide information and is not intended for trading purposes. Closed-end funds, unlike open- end funds, are not continuously offered. After the initial public offering, shares are sold on the open market through a stock exchange, where shares may trade at a premium or a discount. Holdings are subject to change daily.
|