Attached files
| file | filename |
|---|---|
| 8-K - 8-K - TWO HARBORS INVESTMENT CORP. | a14-8369_18k.htm |
| EX-99.2 - EX-99.2 - TWO HARBORS INVESTMENT CORP. | a14-8369_1ex99d2.htm |
|
|
Fourth Quarter 2013 Investor Presentation |
|
|
Safe Harbor Statement FORWARD-LOOKING STATEMENTS This presentation includes “forward-looking statements” within the meaning of the safe harbor provisions of the United States Private Securities Litigation Reform Act of 1995. Actual results may differ from expectations, estimates and projections and, consequently, readers should not rely on these forward-looking statements as predictions of future events. Words such as “expect,” “target,” “assume,” “estimate,” “project,” “budget,” “forecast,” “anticipate,” “intend,” “plan,” “may,” “will,” “could,” “should,” “believe,” “predicts,” “potential,” “continue,” and similar expressions are intended to identify such forward-looking statements. These forward-looking statements involve significant risks and uncertainties that could cause actual results to differ materially from expected results, including, among other things, those described in our Annual Report on Form 10-K for the year ended December 31, 2013, and any subsequent Quarterly Reports on form 10-Q, under the caption “Risk Factors.” Factors that could cause actual results to differ include, but are not limited to, higher than expected operating costs, changes in prepayment speeds of mortgages underlying our residential mortgage-backed securities (RMBS), the rates of default or decreased recovery on the mortgages underlying our non-Agency securities, failure to recover credit losses in our portfolio, changes in interest rates and the market value of our assets, the availability of financing, the availability of target assets at attractive prices, our ability to manage various operational risks associated with our business, our ability to maintain our REIT qualification, limitations imposed on our business due to our REIT status and our exempt status under the Investment Company Act of 1940, the impact of new legislation or regulatory changes on our operations, the impact of any deficiencies in the servicing or foreclosure practices of third parties and related delays in the foreclosure process, our ability to acquire mortgage loans or securitize the mortgage loans we acquire, our involvement in securitization transactions, the timing and profitability of our securitization transactions, the risks associated with our securitization transactions, our ability to acquire mortgage servicing rights, the impact of new or modified government mortgage refinance or principal reduction programs, unanticipated changes in overall market and economic conditions, and our exposure to claims and litigation, including litigation arising from our involvement in securitization transactions. Readers are cautioned not to place undue reliance upon any forward-looking statements, which speak only as of the date made. Two Harbors does not undertake or accept any obligation to release publicly any updates or revisions to any forward-looking statement to reflect any change in its expectations or any change in events, conditions or circumstances on which any such statement is based. Additional information concerning these and other risk factors is contained in Two Harbors’ most recent filings with the Securities and Exchange Commission (SEC). All subsequent written and oral forward looking statements concerning Two Harbors or matters attributable to Two Harbors or any person acting on its behalf are expressly qualified in their entirety by the cautionary statements above. This presentation may include industry and market data obtained through research, surveys, and studies conducted by third parties and industry publications. We have not independently verified any such market and industry data from third-party sources. This presentation is provided for discussion purposes only and may not be relied upon as legal or investment advice, nor is it intended to be inclusive of all the risks and uncertainties that should be considered. This presentation does not constitute an offer to purchase or sell any securities, nor shall it be construed to be indicative of the terms of an offer that the parties or their respective affiliates would accept. Readers are advised that the financial information in this presentation is based on company data available at the time of this presentation and, in certain circumstances, may not have been audited by the company’s independent auditors. 2 |
|
|
Mission Based Strategy OUR MISSION IS TO BE RECOGNIZED AS THE INDUSTRY-LEADING MORTGAGE REIT: Largest hybrid mortgage REIT investing in residential mortgage assets Market capitalization of approximately $3.8 billion(1) Provider of permanent capital to the U.S. mortgage market over the long-term BENEFITS OF OUR HYBRID MORTGAGE REIT MODEL: Flexibility to take advantage of opportunities across Agency and non-Agency RMBS sectors and unsecuritized mortgage assets, including: RMBS Residential mortgage loans Mortgage servicing rights (MSR) Other financial assets IMPERATIVES: Rigorous risk management system Strong administrative infrastructure Best practice disclosure and corporate governance 3 (1) Source: Bloomberg as of February 28, 2014 |

|
|
2013 In Review 4 ADVANCING STRATEGIC INITIATIVES First Quarter 2013 Completed accretive public offering of common stock for net proceeds of approximately $762.9 million Second Quarter 2013 Acquired Matrix Financial Services Corporation, which has seller-servicer approvals Repurchased 1 million shares of our common stock at average price of $10.50 per share (accretive) Third Quarter 2013 Acquired two small bulk MSR portfolios Completed first securitization using our own depositor Repurchased 1.45 million shares of our common stock at average price of $9.23 per share (accretive) Fourth Quarter 2013 Finalized a two-year flow sale agreement to acquire MSR from PHH Mortgage Corporation Acquired substantial bulk MSR portfolio from Flagstar Bank Wholly-owned subsidiary granted membership in the Federal Home Loan Bank of Des Moines (FHLB) Added staff and built infrastructure to support strategic initiatives Increased total market capitalization by approximately $400 million in 2013 after giving effect to the Silver Bay common stock dividend amounting to $345.8 million(1) (1) $345.8 million represents the tax value of the distribution of Silver Bay common stock. |

|
|
AGENCY RMBS NON-AGENCY RMBS MACROECONOMIC & POLICY CONSIDERATIONS Fourth Quarter 2013 Market Overview Federal Reserve remains the largest buyer in the mortgage market Federal Reserve tapering can create opportunities; uncertainty remains on timing Non-Agency fundamental performance is strong Continued improvements in housing metrics were good for portfolio Strong technical factor in place Supply remains muted 5 Source: CoreLogic Home Price Index rolling 12-month change as of January 31, 2014 Macroeconomic considerations include: Policy considerations include: Rising treasury and mortgage rates Improving unemployment metrics Improving home prices; CoreLogic Home Price Index +12%(1) on a rolling 12-month basis New Federal Housing Finance Agency (FHFA) Director Mel Watt New Federal Reserve Chair Janet Yellen Future of Federal Reserve’s Quantitative easing plan GSE Reform Final Qualified Mortgage (QM) and proposed Qualified Residential Mortgage (QRM) rules |
|
|
Delivering Total Return Since inception, we have generated total stockholder return of 111%,(1) which compares favorably to the Pine River Mortgage REIT Index. (1) Two Harbors’ total stockholder return is calculated for the period October 29, 2009 through February 28, 2014. Total stockholder return is defined as stock price appreciation including dividends. Source: Bloomberg. (2) Pine River Mortgage REIT index total stockholder return for the period October 29, 2009 through February 28, 2014. Pine River Mortgage REIT index includes: AGNC, NLY, ANH, ARR, CMO, CIM, CYS, HTS, IVR, MFA, PMT, RWT, TWO, MITT, MTGE, AMTG, DX, NYMT, WMC and NRZ. Source: Bloomberg. 6 TWO Pine River Mortgage REIT Index(2) 111% 45% |
|
|
TARGETED CAPITAL ALLOCATION HIGHLIGHTS – DECEMBER 31, 2013 PORTFOLIO COMPOSITION Portfolio Composition 7 Capital allocation was 57% Rates(3) and 43% Credit(4) Agencies declined to 44% of capital allocation while MSR increased to 13% Expect capital allocation to MSR to increase going forward as operational platform continues to be built Credit allocation substantially focused on assets that benefit from HPA, servicer actions and better borrower performance Rates(3) $10.2B Credit(4) $3.5B AS OF DECEMBER 31, 2013 $13.7B Portfolio $ Millions 30-Year Fixed $5,649 15-Year Fixed $72 HECM(1) $1,793 Other-Fixed $720 IO and IIO(2) $475 Hybrid ARMs $1,007 Mezzanine $469 Senior $2,282 Other $281 CSL $425 MSR $514 Home Equity Conversion Mortgage loans (HECMs) are loans that allow the homeowner to convert home equity into cash collateralized by the value of their home. Includes Agency Derivatives (IIO) of $218.5 million. Assets in the “Rates” category include Agency securities and MSR. Assets in the “Credit” category include non-Agency securities, prime jumbo loans, net economic interest in securitization trusts and credit sensitive loans (CSL). |

|
|
MSR in a Portfolio Context 8 Amount ($) Yield (%)(1) 10bps Rate Increase (%) 10bps Basis Increase (%) Agency RMBS $800 3.40% (6.00%) (6.00%) Agency Repo $700 (0.40%) 5-year Swap Cost $1,200 (1.45%) 6.00% --% MSR $-- --% --% --% Total 7.00% --% (6.00%) ROE: 7.00% Debt-to-equity: 7.0x Impact to Book Value of 10bps RMBS spread widening: (6.00%) PORTFOLIO WITH MSR PORTFOLIO WITHOUT MSR Begin with $100 initial capital investment, 100% allocated to Agency RMBS Assumes 7x debt-to-equity on Agency RMBS Begin with $100 initial capital investment, 25% allocated to Agency RMBS and 75% to MSR; still meeting whole pool test Assumes 7x debt-to-equity on Agency RMBS and no leverage on MSR Illustrative market yields as of January 31, 2014. Note: The above scenarios are intended to illustrate the potential benefits to a mortgage REIT portfolio that holds MSR. The numbers used in the scenarios above are hypothetical amounts and are not based on our financial results, nor are they projections of our results. The above scenarios are provided for illustration purposes only and may not represent all assumptions used. Actual results of a portfolio may differ materially. MORTGAGE REIT PORTFOLIOS WITH MSR COULD HAVE HIGHER ROE, LOWER LEVERAGE AND REDUCED BASIS RISK Amount ($) Yield (%)(1) 10bps Rate Increase (%) 10bps Basis Increase (%) Agency RMBS $200 3.40% (1.50%) (1.50%) Agency Repo $175 (0.40%) 5-year Swap Cost $-- (1.45%) --% --% MSR $75 8.00% 1.50% 1.90% Total 12.10% --% 0.40% ROE: 12.10% Debt-to-equity: 1.75x Impact to Book Value of 10bps RMBS spread widening: 0.40% |

|
|
Mortgage Loan Conduit & Securitization EXPANDING TWO HARBORS’ CONDUIT PROGRAM IS A KEY A FOCUS IN 2014 Diversifying business model by building an operational business structure Aim to generate attractive credit investments for portfolio while providing capital to the U.S. mortgage market Control and manage purchased and securitized loans via robust mortgage acquisition process and infrastructure, including credit and servicing oversight Ongoing progress building mortgage loan conduit: Approximately 30 originators in various stages of approval Target of 40 originators by year-end 2014 Ability to source a variety of products, creating mutually beneficial relationships with originator partners Opportunities include: Prime loans MSR Non-QM Loans: both prime and non-prime loans 9 |

|
|
Two Harbors’ Infrastructure SUBSTANTIAL PROGRESS BUILDING AN EFFICIENT AND SCALABLE CORE PLATFORM THAT ALLOWS TWO HARBORS TO RESPOND QUICKLY TO A BROAD ARRAY OF MARKET OPPORTUNITIES Our external manager hired over 30 full-time employees who are dedicated to Two Harbors and serve in key leadership and staff roles in MSR operations, technology, compliance and risk management serving the MSR and Conduit platforms Key transaction management processes and teams are in place Due diligence Contract management Seller-servicer onboarding and implementation Core technology infrastructure and oversight teams in place to provide active surveillance and performance management of our sub-servicer and originator partners Efficiencies between strategies due to infrastructure overlap 10 |
|
|
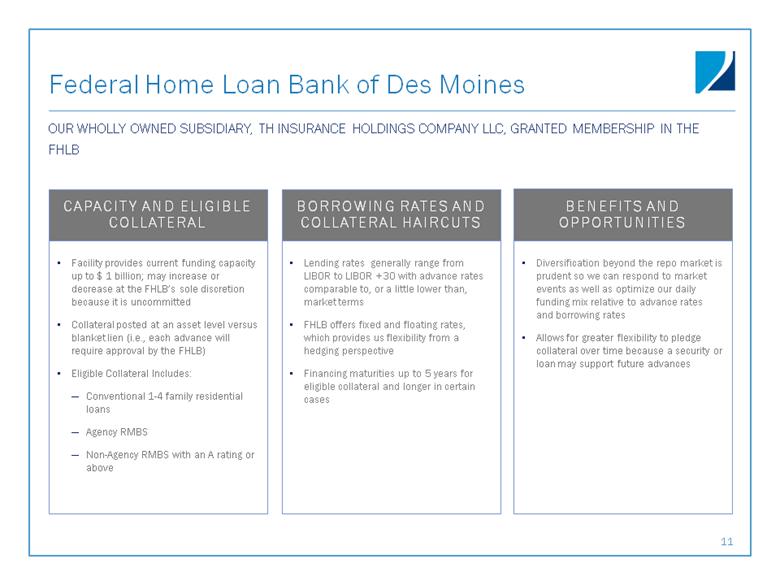
Federal Home Loan Bank of Des Moines Facility provides current funding capacity up to $ 1 billion; may increase or decrease at the FHLB’s sole discretion because it is uncommitted Collateral posted at an asset level versus blanket lien (i.e., each advance will require approval by the FHLB) Eligible Collateral Includes: Conventional 1-4 family residential loans Agency RMBS Non-Agency RMBS with an A rating or above CAPACITY AND ELIGIBLE COLLATERAL Lending rates generally range from LIBOR to LIBOR +30 with advance rates comparable to, or a little lower than, market terms FHLB offers fixed and floating rates, which provides us flexibility from a hedging perspective Financing maturities up to 5 years for eligible collateral and longer in certain cases BORROWING RATES AND COLLATERAL HAIRCUTS Diversification beyond the repo market is prudent so we can respond to market events as well as optimize our daily funding mix relative to advance rates and borrowing rates Allows for greater flexibility to pledge collateral over time because a security or loan may support future advances BENEFITS AND OPPORTUNITIES 11 OUR WHOLLY OWNED SUBSIDIARY, TH INSURANCE HOLDINGS COMPANY LLC, GRANTED MEMBERSHIP IN THE FHLB |
|
|
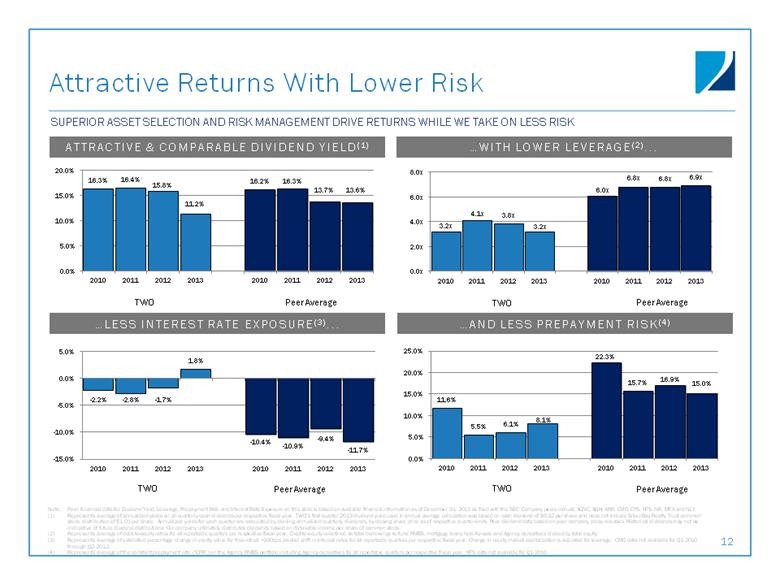
LESS INTEREST RATE EXPOSURE(3) Attractive Returns With Lower Risk 12 ATTRACTIVE & COMPARABLE DIVIDEND YIELD(1) WITH LOWER LEVERAGE(2) SUPERIOR ASSET SELECTION AND RISK MANAGEMENT DRIVE RETURNS WHILE WE TAKE ON LESS RISK TWO Peer Average TWO Peer Average TWO Peer Average AND LESS PREPAYMENT RISK(4) TWO Peer Average Note: Peer financial data for Dividend Yield, Leverage, Prepayment Risk and Interest Rate Exposure on this slide is based on available financial information as of December 31, 2013 as filed with the SEC. Company peers include AGNC, ANH, ARR, CMO, CYS, HTS, IVR, MFA and NLY. Represents average of annualized yields on all quarterly cash dividends per respective fiscal year. TWO’s first quarter 2013 dividend yield used in annual average calculation was based on cash dividend of $0.32 per share and does not include Silver Bay Realty Trust common stock distribution of $1.01 per share. Annualized yields for each quarter are calculated by dividing annualized quarterly dividends, by closing share price as of respective quarter-ends. Peer dividend data based on peer company press releases. Historical dividends may not be indicative of future dividend distributions. Our company ultimately distributes dividends based on its taxable income per share of common stock. Represents average of debt-to-equity ratios for all reportable quarters per respective fiscal year. Debt-to-equity is defined as total borrowings to fund RMBS, mortgage loans held-for-sale and Agency derivatives divided by total equity. Represents average of estimated percentage change in equity value for theoretical +100bps parallel shift in interest rates for all reportable quarters per respective fiscal year. Change in equity market capitalization is adjusted for leverage. CMO data not available for Q1-2010 through Q2-2012. Represents average of the constant prepayment rate (“CPR”) on the Agency RMBS portfolio including Agency derivatives for all reportable quarters per respective fiscal year. HTS data not available for Q1-2010. (1) (2) (3) (4) |
|
|
Appendix 13 |
|
|
Agency Securities as of December 31, 2013 14 Par Value (M) Market Value (M) % of Agency Portfolio Amortized Cost Basis (M) Weighted Average Coupon Weighted Average Age (Months) 30-Year Fixed 3.0-3.5% $719 $715 7.4% $765 3.5% 19 4.0-4.5% 3,855 4,008 41.3% 4,185 4.1% 19 > 5.0% 837 926 9.5% 909 5.5% 60 $5,411 $5,649 58.2% $5,859 4.3% 26 15-Year Fixed 3.0-3.5% $68 $69 0.7% $67 3.0% 38 4.0-4.5% 2 2 0.0% 2 4.0% 43 > 5.0% 1 1 0.0% 1 6.7% 105 $71 $72 0.7% $70 3.1% 38 HECM $1,641 $1,793 18.4% $1,747 4.7% 26 Hybrid ARMs 994 1,007 10.4% 1,001 2.5% 22 Other-Fixed 658 720 7.4% 715 4.9% 73 IO and IIO 4,670 475(1) 4.9% 485 4.2% 65 Total $13,445 $9,716 100.0% $9,877 4.2% 31 Represents the market value of $256.4 million of IO and $218.5 million of Agency Derivatives. (1) |
|
|
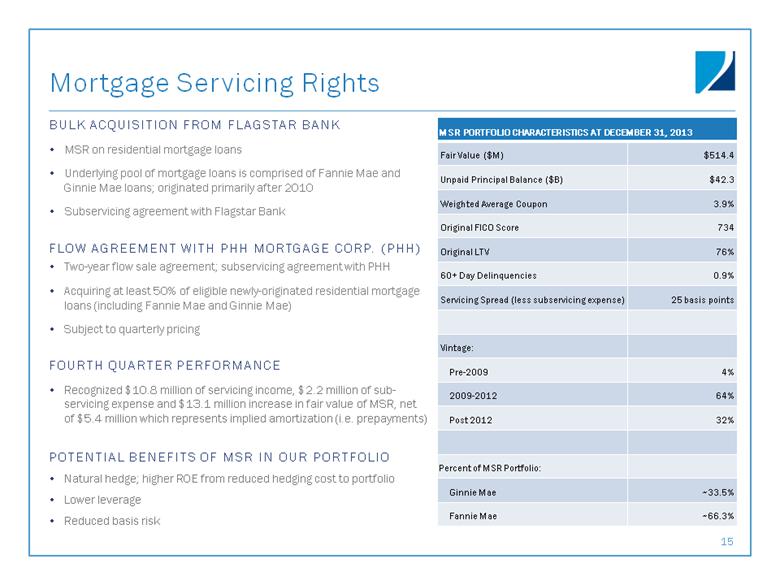
Mortgage Servicing Rights BULK ACQUISITION FROM FLAGSTAR BANK MSR on residential mortgage loans Underlying pool of mortgage loans is comprised of Fannie Mae and Ginnie Mae loans; originated primarily after 2010 Subservicing agreement with Flagstar Bank FLOW AGREEMENT WITH PHH MORTGAGE CORP. (PHH) Two-year flow sale agreement; subservicing agreement with PHH Acquiring at least 50% of eligible newly-originated residential mortgage loans (including Fannie Mae and Ginnie Mae) Subject to quarterly pricing FOURTH QUARTER PERFORMANCE Recognized $10.8 million of servicing income, $2.2 million of sub-servicing expense and $13.1 million increase in fair value of MSR, net of $5.4 million which represents implied amortization (i.e. prepayments) POTENTIAL BENEFITS OF MSR IN OUR PORTFOLIO Natural hedge; higher ROE from reduced hedging cost to portfolio Lower leverage Reduced basis risk 15 MSR PORTFOLIO CHARACTERISTICS AT DECEMBER 31, 2013 Fair Value ($M) $514.4 Unpaid Principal Balance ($B) $42.3 Weighted Average Coupon 3.9% Original FICO Score 734 Original LTV 76% 60+ Day Delinquencies 0.9% Servicing Spread (less subservicing expense) 25 basis points Vintage: Pre-2009 4% 2009-2012 64% Post 2012 32% Percent of MSR Portfolio: Ginnie Mae ~33.5% Fannie Mae ~66.3% |
|
|
Non-Agency Securities as of December 31, 2013 16 Senior Bonds Mezzanine Bonds Total P&I Bonds Portfolio Characteristics Carrying Value ($M) $2,282 $469 $2,751 % of Non-Agency Portfolio 83.0% 17.0% 100.0% Average Purchase Price(1) $52.58 $59.09 $53.69 Average Coupon 2.5% 1.6% 2.3% Weighted Average Market Price(2) $65.27 $72.70 $66.43 Collateral Attributes Average Loan Age (months) 86 99 88 Average Loan Size ($K) $263 $196 $252 Average Original Loan-to-Value 73.1% 72.6% 73.0% Average Original FICO(3) 614 647 620 Current Performance 60+ Day Delinquencies 32.7% 26.6% 31.7% Average Credit Enhancement(4) 9.0% 20.8% 11.0% 3-Month CPR(5) 3.5% 5.6% 3.8% Average purchase price utilized carrying value for weighting purposes. If current face were utilized for weighting purposes, the average purchase price for senior, mezzanine and total non-Agency RMBS, excluding our non-Agency interest-only portfolio, would have been $47.97, $56.37 and $49.28, respectively. Weighted average market price utilized current face for weighting purposes. FICO represents a mortgage industry accepted credit score of a borrower, which was developed by Fair Isaac Corporation. Average credit enhancement remaining on our non-Agency RMBS portfolio, which is the average amount of protection available to absorb future credit losses due to defaults on the underlying collateral. 3-Month CPR is reflective of the prepayment speed on the underlying securitization; however, it does not necessarily indicate the proceeds received on our investment tranche. Proceeds received for each security are dependent on the position of the individual security within the structure of each deal. |
|
|
DIVERSE COUNTERPARTIES(2) HIGH-QUALITY COUNTERPARTIES(3) Financing Profile(1) 17 Laddered repo maturities; averaged 72 days to maturity with 20 counterparties at year-end Agency and non-Agency repo held with counterparties having credit default swap (CDS) spreads lower than 150 bps; implies low overall counterparty risk 54% of Agency and 61% of non-Agency repo held with North American counterparties As of December 31, 2013. Reflects the counterparty percentage of our outstanding repurchase agreements for our Agency and non-Agency portfolio. Reflects the CDS Spread for our Agency and non-Agency portfolio repo counterparties. |

|
|
BV EXPOSURE TO +100 BPS CHANGE IN RATES(1) SWAPS, SWAPTIONS AND IO(2) HEDGING Hedging Strategy 18 HEDGING STRATEGY Protect book value regardless of interest rate environment Use a variety of hedging tools to protect book value, including swaps, swaptions, interest-only bonds and short To Be Announced (TBA) contracts Daily interest rate exposure monitoring FOURTH QUARTER HEDGE POSITION Low overall exposure to rates Exposure includes duration measures for MSR, non-Agency RMBS and loan positions, as well as all associated rate hedges Low leverage and Agency RMBS positioning drives low basis risk exposure Represents estimated percentage change in equity value for theoretical +100bps parallel shift in interest rates. Change in equity value is total net asset change. Positions as of December 31, 2013. Notional amounts do not include $1.0 billion of notional interest rate swaps economically hedging our trading securities, $3.1 billion of notional interest rate swaps hedging our available-for-sale securities, and $1.1 billion of notional interest rate swaps economically hedging our TBA contracts and MSR. $Billions |

|
|
INTEREST RATE SWAPS(2) FINANCING Financing and Hedging Strategy(1) 19 As of December 31, 2013. Notional amounts do not include $1.0 billion of notional interest rate swaps economically hedging our trading securities, $3.1 billion of notional interest rate swaps hedging our available-for-sale securities, and $1.1 billion of notional interest rate swaps economically hedging our TBA contracts and MSR. Does not include repurchase agreements collateralized by U.S. Treasuries of $1.0 billion and mortgage loans held-for-sale of $147.3 million. Swaps Maturities Notional Amounts ($M) Average Fixed Pay Rate Average Receive Rate Average Maturity (Years) 2014 $ 3,900 0.300% 0.245% 0.76 2015 1,000 0.383% 0.244% 1.04 2016 2,950 0.626% 0.246% 2.42 2017 5,300 0.920% 0.217% 3.49 2018 and after 1,275 1.406% 0.242% 5.04 $ 14,425 0.698% 0.235% 2.50 Repurchase Agreements: RMBS and Agency Derivatives(3) Amount ($M) Percent (%) Within 30 days $3,832 35% 30 to 59 days 2,014 18% 60 to 89 days 2,226 20% 90 to 119 days 1,386 12% 120 to 364 days 1,448 13% One year and over 200 2% $11,106 |
|
|
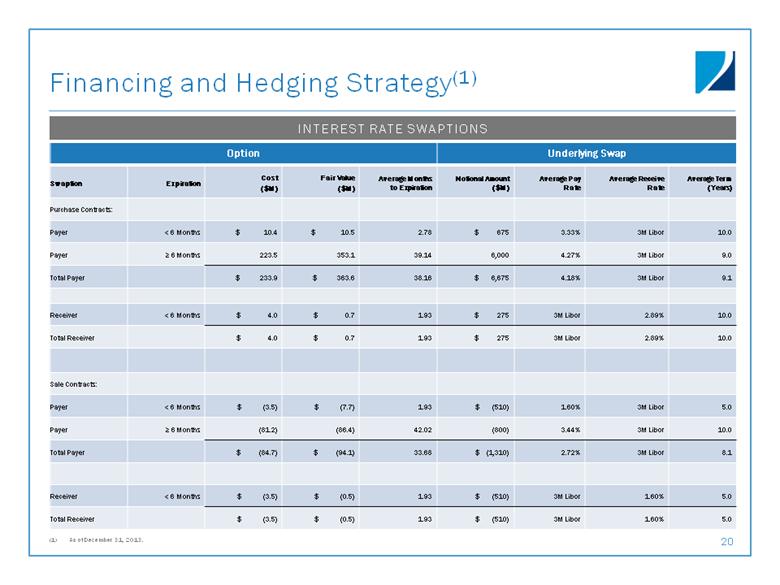
INTEREST RATE SWAPTIONS Financing and Hedging Strategy(1) 20 As of December 31, 2013. Option Underlying Swap Swaption Expiration Cost ($M) Fair Value ($M) Average Months to Expiration Notional Amount ($M) Average Pay Rate Average Receive Rate Average Term (Years) Purchase Contracts: Payer < 6 Months $ 10.4 $ 10.5 2.78 $ 675 3.33% 3M Libor 10.0 Payer > 6 Months 223.5 353.1 39.14 6,000 4.27% 3M Libor 9.0 Total Payer $ 233.9 $ 363.6 38.16 $ 6,675 4.18% 3M Libor 9.1 Receiver < 6 Months $ 4.0 $ 0.7 1.93 $ 275 3M Libor 2.89% 10.0 Total Receiver $ 4.0 $ 0.7 1.93 $ 275 3M Libor 2.89% 10.0 Sale Contracts: Payer < 6 Months $ (3.5) $ (7.7) 1.93 $ (510) 1.60% 3M Libor 5.0 Payer > 6 Months (81.2) (86.4) 42.02 (800) 3.44% 3M Libor 10.0 Total Payer $ (84.7) $ (94.1) 33.68 $ (1,310) 2.72% 3M Libor 8.1 Receiver < 6 Months $ (3.5) $ (0.5) 1.93 $ (510) 3M Libor 1.60% 5.0 Total Receiver $ (3.5) $ (0.5) 1.93 $ (510) 3M Libor 1.60% 5.0 |
|
|
EXECUTIVE OFFICERS Overview of Two Harbors Team 21 CHIEF FINANCIAL OFFICER BRAD FARRELL Most recently served as Two Harbors’ Controller from 2009 to 2011 Previously Vice President and Executive Director of Financial Reporting at GMAC ResCap from 2007 to 2009 and held financial roles at XL Capital Ltd from 2002 to 2007; began his career with KPMG SIGNIFICANT OPERATIONS AND RMBS EXPERTISE Substantial operations team; deep servicing and mortgage operations experience Strong RMBS team focused on trading, investment analysis and research Leverages proprietary analytical systems INVESTMENT & OPERATIONS TEAM CHIEF EXECUTIVE OFFICER THOMAS SIERING Also serves as Pine River Capital Management Partner 33 years of investing and management experience; commenced career at Cargill Previously Partner and head of Value Investment Group at EBF & Associates CHIEF INVESTMENT OFFICER WILLIAM ROTH Also serves as Pine River Capital Management Partner 33 years in mortgage securities market Managing Director in proprietary trading group at Citi and Salomon Brothers prior to Two Harbors |

|
|
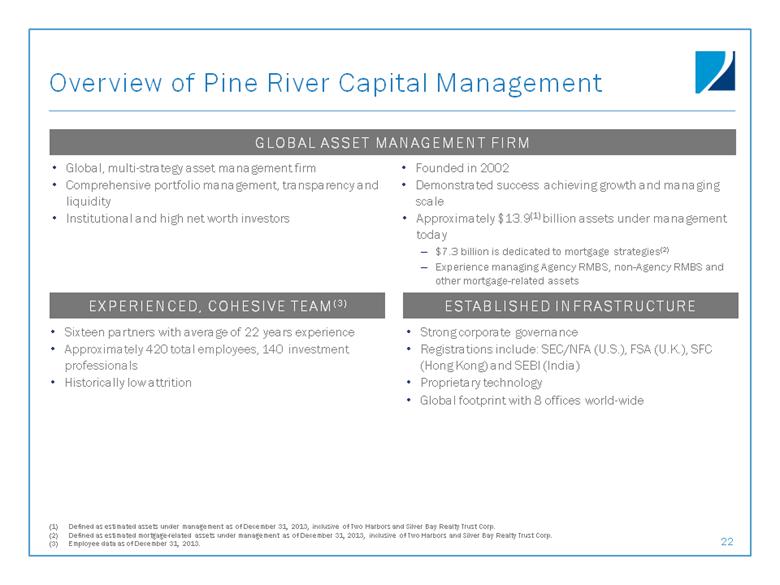
EXPERIENCED, COHESIVE TEAM(3) ESTABLISHED INFRASTRUCTURE GLOBAL ASSET MANAGEMENT FIRM Overview of Pine River Capital Management Sixteen partners with average of 22 years experience Approximately 420 total employees, 140 investment professionals Historically low attrition Strong corporate governance Registrations include: SEC/NFA (U.S.), FSA (U.K.), SFC (Hong Kong) and SEBI (India) Proprietary technology Global footprint with 8 offices world-wide 22 Defined as estimated assets under management as of December 31, 2013, inclusive of Two Harbors and Silver Bay Realty Trust Corp. Defined as estimated mortgage-related assets under management as of December 31, 2013, inclusive of Two Harbors and Silver Bay Realty Trust Corp. Employee data as of December 31, 2013. |
|
|
[LOGO] |