Attached files
| file | filename |
|---|---|
| EX-32.2 - EX-32.2 - Trinseo Materials Operating S.C. A. | d683772dex322.htm |
| EX-31.2 - EX-31.2 - Trinseo Materials Operating S.C. A. | d683772dex312.htm |
| EX-10.35 - EX-10.35 - Trinseo Materials Operating S.C. A. | d683772dex1035.htm |
| EX-12.1 - EX-12.1 - Trinseo Materials Operating S.C. A. | d683772dex121.htm |
| EX-31.1 - EX-31.1 - Trinseo Materials Operating S.C. A. | d683772dex311.htm |
| EX-32.1 - EX-32.1 - Trinseo Materials Operating S.C. A. | d683772dex321.htm |
Table of Contents
UNITED STATES
SECURITIES AND EXCHANGE COMMISSION
Washington, D.C. 20549
FORM 10-K
| x | ANNUAL REPORT PURSUANT TO SECTION 13 OR 15(d) OF THE SECURITIES EXCHANGE ACT OF 1934 |
For the fiscal year ended: December 31, 2013
| ¨ | TRANSITION REPORT PURSUANT TO SECTION 13 OR 15(d) OF THE SECURITIES EXCHANGE ACT OF 1934 |
For the transition period from to
Commission File Number: 333-191460
| Trinseo Materials Operating S.C.A. | Trinseo Materials Finance, Inc. | |
| (Exact name of registrant as specified in its charter) | (Exact name of registrant as specified in its charter) |
| Luxembourg | Delaware | |
| (State or other jurisdiction of incorporation or organization) |
(State or other jurisdiction of incorporation or organization) |
| 98-0663708 | 46-2429861 | |
| (I.R.S. Employer Identification No.) |
(I.R.S. Employer Identification No.) |
1000 Chesterbrook Boulevard, Suite 300
Berwyn, Pennsylvania 19312
(610) 240-3200
Securities registered pursuant to Section 12(b) of the Act:
None
Securities registered pursuant to Section 12(g) of the Act:
None
Indicate by check mark if the registrant is a well-known seasoned issuer, as defined in Rule 405 of the Securities Act. Yes ¨ No x
Indicate by check mark if the registrant is not required to file reports pursuant to Section 13 or Section 15(d) of the Act. Yes ¨ No x
Indicate by check mark whether the registrant (1) has filed all reports required to be filed by Section 13 or 15(d) of the Securities Exchange Act of 1934 during the preceding 12 months (or for such shorter period that the registrant was required to file such reports), and (2) has been subject to such filing requirements for the past 90 days. Yes ¨ No x
Indicate by check mark whether the registrant has submitted electronically and posted on its corporate website, if any, every Interactive Data File required to be submitted and posted pursuant to Rule 405 of Regulation S-T during the preceding 12 months (or for such shorter period that the registrant was required to submit and post such files). Yes x No ¨
Indicate by check mark if disclosure of delinquent filers pursuant to Item 405 of Regulation S-K is not contained herein, and will not be contained, to the best of registrant’s knowledge, in definitive proxy or information statements incorporated by reference in Part III of this Form 10-K or any amendment to this Form 10-K. x
Indicate by check mark whether the Company is a large accelerated filer, an accelerated filer, a non-accelerated filer, or a smaller reporting company. See definitions of “large accelerated filer,” “accelerated filer,” and “smaller reporting company” in Rule 12b-2 of the Exchange Act. (Check one):
| Large accelerated filer | ¨ | Accelerated filer | ¨ | |||||
| Non-accelerated filer | x | (Do not check if a smaller reporting company) | Smaller reporting company | ¨ | ||||
Indicate by check mark whether the Company is a shell company (as defined in Rule 12b-2 of the Exchange Act). Yes ¨ No x
Trinseo Materials Operating S.C.A. is a Luxembourg partnership limited by shares. Its shares are not publicly traded and there is no established public trading market for its shares. Trinseo Materials Operating S.C.A.’s corporate capital was represented by 1,528 management shares (actions de commandite) and 2,370,642,128 ordinary shares (actions de commanditaire), all subscribed and fully paid-up. As of March 14, 2014, its shares were held by (i) Styron Holding S.à r.l., a Luxembourg société à responsabilité limitée (private limited liability company), which holds 1,528 ordinary shares, and (ii) Trinseo Materials S.à r.l. a Luxembourg société à responsabilité limitée (private limited liability company), which holds 2,370,640,600 ordinary shares and 1,528 management shares.
The issued and outstanding common stock of Trinseo Materials Finance, Inc. is not publicly traded and there is no established public trading market for its common stock. All of Trinseo Materials Finance, Inc.’s shares are held by Trinseo Materials Operating S.C.A. As of March 14, 2014, there were 1,000 shares of common stock of Trinseo Materials Finance, Inc. issued and outstanding.
Documents Incorporated by Reference
None.
Table of Contents
i
Table of Contents
CAUTIONARY NOTE REGARDING FORWARD-LOOKING STATEMENTS
This annual report on Form 10-K (“Annual Report”) contains forward-looking statements including, without limitation, statements concerning plans, objectives, goals, projections, strategies, future events or performance, and underlying assumptions and other statements, which are not statements of historical facts. Forward looking statements may be identified by the use of words like “expect,” “anticipate,” “intend,” “forecast,” “outlook,” “will,” “may,” “might,” “potential,” “likely,” “target,” “plan,” “contemplate,” “seek,” “attempt,” “should,” “could,” “would” or expressions of similar meaning. Forward-looking statements reflect management’s evaluation of information currently available and are based on our current expectations and assumptions regarding our business, the economy and other future conditions. Because forward-looking statements relate to the future, they are subject to inherent uncertainties, risks and changes in circumstances that are difficult to predict. Specific factors that may impact performance or other predictions of future actions have, in many but not all cases, been identified in connection with specific forward-looking statements. Our actual results may differ materially from those contemplated by the forward-looking statements. They are neither statements of historical fact nor guarantees or assurances of future performance. We caution you therefore against relying on any of these forward-looking statements.
Important factors that could cause actual results to differ materially from those in the forward-looking statements include economic, business, competitive, market and regulatory conditions and the following:
| • | our continued reliance on our relationship with The Dow Chemical Company; |
| • | our substantial level of indebtedness; |
| • | the stability of our joint ventures; |
| • | lawsuits resulting from products or operations; |
| • | volatility in costs or disruption in the supply of the raw materials utilized for our products; |
| • | hazards associated with chemical manufacturing; |
| • | the competitive nature of our end markets; |
| • | our compliance with environmental, health and safety laws; |
| • | conditions in the global economy and capital markets; |
| • | any disruptions in production at our manufacturing facilities; |
| • | increases in the cost of energy; |
| • | our ability to maintain the necessary licenses and permits we need for our operations; |
| • | failure to maintain an effective system of internal controls; |
| • | current insurance not covering all potential exposures; |
| • | changes in laws and regulations applicable to our business; |
| • | our dependence upon key executive management and any inability to attract and retain other qualified management personnel; |
| • | fluctuations in currency exchange rates; |
| • | strategic acquisitions affecting current operations; |
| • | the loss of customers; |
| • | any inability to continue technological innovation and successful introduction of new products; |
| • | any inability to protect our trademarks, patents or other intellectual property rights; |
| • | data security breaches; |
| • | failure of our assumptions and projections to be accurate; |
| • | local business risks in different countries in which we operate; |
| • | seasonality of our business; and |
| • | other risks described in the “Risk Factors” section of this Annual Report. |
ii
Table of Contents
We derive many of our forward-looking statements from our operating budgets and forecasts, which are based upon many detailed assumptions. While we believe that our assumptions are reasonable, we caution that it is very difficult to predict the impact of known factors, and, it is impossible for us to anticipate all factors that could affect our actual results. Important factors that could cause actual results to differ materially from our expectations, or cautionary statements, are disclosed under the sections entitled “Risk Factors” and “Management’s Discussion and Analysis of Financial Condition and Results of Operations” in this Annual Report. All written and oral forward-looking statements attributable to us, or persons acting on our behalf, are expressly qualified in their entirety by the cautionary statements as well as other cautionary statements that are made from time to time in our other public communications. You should evaluate all forward-looking statements made in this Annual Report in the context of these risks and uncertainties.
We caution you that the important factors referenced above may not contain all of the factors that are important to you. In addition, we cannot assure you that we will realize the results or developments we expect or anticipate or, even if substantially realized, that they will result in the consequences or affect us or our operations in the way we expect. The forward-looking statements included in this Annual Report are made only as of the date hereof. We undertake no obligation to publicly update or revise any forward-looking statement as a result of new information, future events or otherwise, except as otherwise required by law.
iii
Table of Contents
Trinseo Materials Operating S.C.A.
Trinseo Materials Finance, Inc.
Form 10-K Annual Report
For the Fiscal Year Ended December 31, 2013
Unless otherwise indicated or required by context, as used in this Annual Report, the term “Trinseo” refers to Trinseo S.A., a public limited liability company (société anonyme) existing under the laws of Luxembourg, and not its subsidiaries. The terms “Company,” “we,” “us” and “our” refer to Trinseo and its consolidated subsidiaries, taken as a combined entity and as required by context, may also include our business as owned by our predecessor The Dow Chemical Company for any dates prior to June 17, 2010. The terms “Trinseo Materials Operating S.C.A. and Trinseo Materials Finance, Inc.” refer to Trinseo’s indirect subsidiaries, Trinseo Materials Operating S.C.A., a Luxembourg partnership limited by shares incorporated under the laws of Luxembourg, and Trinseo Materials Finance, Inc., a Delaware corporation, and not their subsidiaries. All financial data provided in this Annual Report is the financial data of Trinseo and its consolidated subsidiaries unless otherwise indicated.
Prior to our formation, our business was wholly owned by The Dow Chemical Company. We refer to our predecessor business as “the Styron business.” On June 17, 2010, investment funds advised or managed by affiliates of Bain Capital Partners, LLC acquired the Styron business and Dow Europe Holding B.V., which we refer to as “Dow Europe,” or, together with other affiliates of The Dow Chemical Company, “Dow,” retained an ownership interest in the Styron business through an indirect ownership interest in us. We refer to our acquisition by Bain Capital as the “Acquisition.”
1
Table of Contents
| Item 1. | Business |
We are a leading global materials company engaged in the manufacture and marketing of emulsion polymers and plastics, including various specialty and technologically differentiated products. We have leading market positions in many of the markets in which we compete. We believe we have developed these strong market positions due to our technological differentiation, diverse global manufacturing base, long-standing customer relationships, commitment to sustainable solutions and competitive cost positions. We believe that growth in overall consumer spending and construction activity, increased demand in the automotive industry for higher fuel efficiency and lighter-weight materials, and improving living standards in emerging markets will result in growth in the global markets in which we compete. In addition, we believe our increasing business presence in developing regions such as China, Southeast Asia, Latin America and Eastern Europe further enhances our prospects.
We develop emulsion polymers and plastics products that are incorporated into a wide range of our customers’ products throughout the world, including tires and other products for automotive applications, carpet and artificial turf backing, coated paper and packaging board, food service packaging, appliances, medical devices, consumer electronics and construction applications, among others. We seek to regularly develop new and improved products and processes, supported by our strong patent portfolio, designed to enhance our customers’ product offerings. We have long-standing relationships with a diverse base of global customers, many of whom are leaders in their markets and rely on us for formulation, technological differentiation, and compounding expertise to find sustainable solutions for their businesses. Many of our products represent only a small portion of a finished product’s production costs, but provide critical functionality to the finished product and are often specifically developed to customer specifications. We believe these product traits result in substantial customer loyalty for our products.
We operate our business in four reporting segments: Latex, Synthetic Rubber, Styrenics and Engineered Polymers. Our major products include: styrene-butadiene latex, or SB latex, and styrene-acrylate latex, or SA latex, in our Latex segment; solution styrene butadiene rubber, or SSBR, lithium polybutadiene rubber, or Li-PBR, emulsion styrene butadiene rubber, or ESBR, and nickel polybutadiene rubber, or Ni-PBR, in our Synthetic Rubber segment; polystyrene, acrylonitrile butadiene styrene, or ABS, and styrene acrylonitrile, or SAN, in our Styrenics segment; and polycarbonate, or PC, compounds and blends, and polypropylene compounds in our Engineered Polymers segment.
We have significant manufacturing and production operations around the world, which allows us to serve our global customer base. As of December 31, 2013, our production facilities included 35 manufacturing plants (which included a total of 83 production units) at 27 sites across 14 countries, including joint ventures and contract manufacturers. Our manufacturing locations include sites in high-growth emerging markets such as China, Indonesia and Brazil. Additionally, as of December 31, 2013 we operated 11 research and development (“R&D”) facilities globally, including mini plants, development centers and pilot coaters, which we believe are critical to our global presence and innovation capabilities.
2
Table of Contents
Prior to our formation in Luxembourg in 2010, the Styron business was wholly-owned by Dow. On June 17, 2010, we were acquired by investment funds advised or managed by Bain Capital Partners, LLC, and Dow Europe, which acquired an ownership interest in our parent company and sole shareholder, Bain Capital Everest Manager Holding SCA, which we refer to as our Parent. As of December 31, 2013, Dow Europe held an approximately 6.8% interest in our Parent. We continue to have a significant business relationship with Dow and rely on our agreements with Dow for certain operating and other services, for the supply of raw materials used in the production of our products and for certain intellectual property rights. See “—Our Relationship with Dow.”
The following chart summarizes our corporate ownership structure as of December 31, 2013.
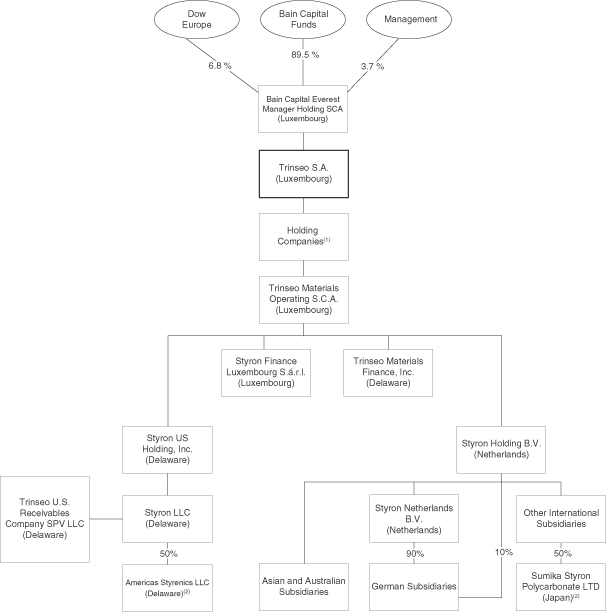
| (1) | These holding companies include the following entities: Styron Luxco S.à.r.l. (Luxembourg), Styron Holding S.à.r.l. (Luxembourg), Trinseo Materials S.à.r.l. (Luxembourg) and Styron Investment Holdings Ireland (Ireland). |
| (2) | Joint venture entity. |
3
Table of Contents
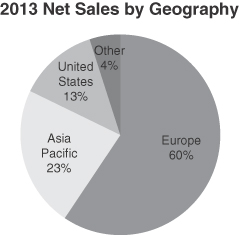
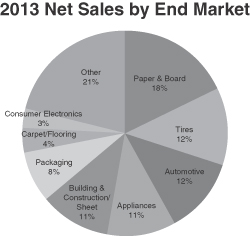
We are a global business with a diverse geographic revenue mix and significant operations around the world.
|
|
In 2013, we generated net sales of $5,307.4 million, adjusted EBITDA of $303.3 million, and a net loss of $22.2 million. Additional information regarding adjusted EBITDA, including a reconciliation of net income (loss) to adjusted EBITDA, is included in Item 7—Management’s Discussion and Analysis of Financial Conditions and Results of Operations.
Our Competitive Strengths
Leading Positions in Consolidating Markets
We have leading positions in several of the markets in which we compete, including the #1 position in SSBR in Europe and the #1 position in SB latex globally, and we are a leading global producer of plastics products, including polystyrene and PC. We attribute our strong market positions to our technologically differentiated products, the scale of our global manufacturing base, our long-standing customer relationships and our competitive cost positions.
The markets in which we compete are also highly consolidated and have continued to experience further consolidation over the last several years through the business combinations of BASF Group and Ciba Specialty Chemicals, Yule Catto & Co. plc and PolymerLatex GmbH (currently known as Synthomer plc), Omnova Solutions Inc. and Eliokem International SAS and the formation of Styrolution Group GmbH. As a result, from 2005 to 2011, over 400 kMT of production capacity was eliminated in the SB latex markets in North America and Europe, which represented approximately a 20% reduction in production capacity since 2005. In 1990, the top three producers, measured by production capacity, in North America and Europe represented 68% and 49% of estimated regional capacity, respectively. As a result of the capacity rationalizations and consolidations, including those described above, the top three producers in each of North America and Europe represented over 80% of estimated regional production capacity in 2013.
Production capacity has also been reduced in several core markets including Styrenics. For example, from 2006 to 2011, the polystyrene industry experienced substantial capacity rationalization with over 1,000 kMT of annual U.S. and Western Europe polystyrene capacity being eliminated during this time period, representing a reduction of approximately 20% of the 2005 total capacity in those regions.
Technological Advantage and Product Innovation
Most of our products are critical inputs that significantly impact the functionality, production costs and quality of our customers’ products. Many of our products are also differentiated by their performance, reliability,
4
Table of Contents
customization and value, which are critical factors in our customers’ selection and retention of materials suppliers. For example, our advanced SSBR technology is designed to reduce a tire’s rolling resistance, resulting in better mileage and fuel efficiency and lower carbon dioxide emissions while at the same time improving the tire’s wet-grip, a measure of braking effectiveness and traction. We believe these are key performance attributes sought by the end user and have become more easily identifiable through the growing adoption of tire labeling requirements by regulatory agencies, including formal adoption by the European Union in late 2012. These attributes also help in meeting European carbon dioxide emissions legislation requirements. Other jurisdictions have adopted or are considering similar legislation, including tire labeling requirements.
Our lightweight plastics materials also allow automotive companies to reduce weight in vehicles by substituting heavier structural parts with our products and thereby improving fuel efficiency for cars. Higher end automotive interior applications have also benefitted from utilizing our technology which has high aesthetic appeal and excellent scratch resistant characteristics. Energy use is also substantially reduced by using our plastic in lighting and other consumer applications.
Through our performance latex portfolio, we offer a variety of products designed to meet the needs of multiple applications, including adhesives, building and construction and composites, road, athletic, and automotive surfaces, technical fabrics and technical papers and boards. Our performance latex products are designed to enhance and improve an application’s mechanical properties, including water, chemical, stain, abrasion or oil resistance, cohesive and adhesive strength, or dimensional stability, flexibility, water impermeability and efflorescence resistance. Using our technological expertise, we typically launch one to two new technologies in our latex segment each year.
The technology supporting our product innovation includes more than 250 patents and 200 pending patent applications that we own world-wide covering processes and technologies such as material formulations, material process technologies and various end-use industrial applications for our materials.
Diverse Global Reach with Strong Presence in Emerging Markets
As of December 31, 2013, our production facilities included 35 manufacturing plants (which included a total of 83 production units) at 27 sites in 14 countries, inclusive of joint ventures and contract manufacturers. We believe our diverse locations provide us with a competitive advantage in meeting and anticipating the needs of our global and local customers in both well-established and growing markets. We have a strong presence in Asia and Latin America, where we supply custom formulated latex products both for established and new paper mills, as well as a variety of engineered polymers, synthetic rubber and other products that are used in a variety of end-markets.
Long-Standing, Collaborative Customer Relationships
We and the Styron business have long-standing relationships with many of our customers, helping them to develop and commercialize multiple generations of their products. We believe we have developed strong relationships through our highly collaborative process, whereby we work with our customers, particularly in high-value segments such as SSBR, specialized plastics and performance latex, to develop products that meet their specific needs. As part of this process, we test our products at customer sites and work with customers to optimize and customize our product offerings. As a result of our close collaboration, we have historically achieved a high success rate of retaining customers. As of December 31, 2013, we served approximately 1,300 customers in over 75 countries with no single customer accounting for more than 7.0% of our net sales in 2013.
5
Table of Contents
Attractive Segments and End-Markets Experiencing Cyclical Recovery
Our strategy is to focus on what we believe are the most attractive segments for our customers’ products, or end-markets, where demand is underpinned by global trends supporting long-term volume growth, improving living standards in emerging markets, fuel efficiency and the increasing use of light-weight materials. We serve customers in a diversified mix of end-markets that we believe generally grow when global gross domestic product, or GDP, increases and we believe that the core end-markets that we serve, including automotive, construction, household and appliance will grow at rates exceeding the rate of global GDP growth. For example, we serve the global automotive market, which is projected to grow by more than 5% per year through 2018. The global household appliances market is also expected to grow by more than 5% per year through 2017 and the global construction market is expected to grow by more than 5% per year through 2018. In addition, certain key regional markets where we have a strong presence, such as China coated paper and board, are expected to outperform global growth rates.
Over half of our net sales in 2013 were to customers serving European end-markets, and we expect the continued cyclical recovery in Europe to result in increased demand for many of our products while also increasing utilization rates at our facilities from the depressed levels that we have experienced over the last few years. For example, we expect our Synthetic Rubber segment to benefit from the anticipated recovery in the European tire market, which in 2013 recorded its lowest level of sales since 2009. We also expect the cyclical recovery in North America and Europe to improve demand prospects for paper and carpet, which are key end-markets for our SB latex products.
We also believe that the relatively modest level of capacity additions that have been announced in the marketplace will contribute to increased demand for our production capacity and products.
Cost Competitive Assets and Raw Material Sourcing
We believe that our asset and raw material utilization provides us with a competitive cost position for our products. Our products are produced on a global scale with well maintained, productive and cost efficient assets, at facilities which are positioned globally near some of our key customers or markets, or near major integrated petrochemical centers or are co-located at large Dow facilities, where we benefit from receiving certain raw materials supplied to our facilities by pipeline. We also benefit from existing long-term supply contracts for raw materials including ethylene, butadiene, and benzene, which are important in securing our supply of raw materials in markets where availability may fluctuate with demand.
The presence of some of our facilities on Dow manufacturing sites allows us to benefit from Dow’s existing manufacturing infrastructure in an efficient manner, without the need for us to construct our own infrastructure or provide our own related site services. Dow pipelines directly supply raw materials to our facilities in Terneuzen, The Netherlands and in Boehlen, Schkopau, and Stade, Germany. We share manufacturing infrastructure with Dow at these locations as well as in Midland, Michigan. At certain of our other facilities, we are able to limit the amount of our outbound freight costs as a result of the proximity of several of our facilities, including Tsing Yi, Hong Kong, Dalton, Georgia and Hamina, Finland, to key local customers.
We also seek to leverage our experience with our key raw materials, styrene monomer, to achieve economies of scale. We purchase styrene pursuant to cost-based contracts. We also produce styrene in Terneuzen, The Netherlands and Boehlen, Germany using assets that have operated in 2013 in the 1st or 2nd quartile for energy and raw material efficiency as compared to other European ethylbenzene styrene monomer producers.
Experienced Management Team
Our executive leadership team averages over 25 years of industry experience, including leadership positions within our business units, and significant public company leadership experience at other chemical companies.
6
Table of Contents
Our Growth Strategy
We believe that there are significant opportunities to grow our business globally and enhance our position as a leading global materials company engaged in the manufacture and marketing of standard, specialty and technologically differentiated emulsion polymers and plastics by executing on the following strategies:
Continue Product Innovation and Technological Differentiation
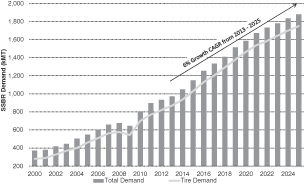
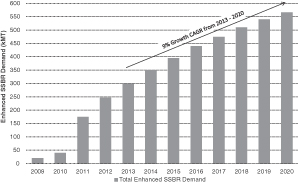
We intend to continue to address our customers’ critical materials needs by utilizing our technological expertise and development capabilities to create specialty grades, new and sustainable products and technologically differentiated formulations. We believe our technological differentiation positions us to participate in attractive, high growth areas of the markets in which we compete. One such area where we believe we have a technological advantage is enhanced SSBR, which is expected to grow at 9% annually through 2020. Enhanced SSBR technology, which includes later generations of SSBR and functionalized SSBR, is used in the latest generation of performance tires. The global market for enhanced SSBR is expected to constitute approximately 40% of the total SSBR market by 2017. We continue to devote significant R&D resources to improving and furthering our SSBR technology and our polybutadiene rubber technologies (such as neodymium butadiene rubber and lithium butadiene rubber) in order to remain a leader in these markets. Our development efforts are currently focused in large part on continuing to improve the fuel efficiency and performance characteristics of automotive tires.
We are also working with our industry partners, particularly in the automotive, medical devices and consumer electronics sectors, to develop new advanced plastics with the goal of gaining market share in higher value-added areas of the markets served by our Engineered Polymers business.
As a global leader in latex, we also continue to evaluate opportunities to expand our performance latex business by targeting particular end-markets and chemistries where we believe we have a competitive advantage, such as SB performance latex and styrene acrylics. We believe that performance latex accounts for a substantial portion of the total synthetic latex market, but only accounted for 10% of our Latex segment’s net sales in 2013, and we believe that we are well positioned to capture a larger share of this performance latex market.
Strategically Invest in Attractive Segments of the Market
We plan to make strategic capital investments to extend our leadership in select market segments and meet expected growing demand for our products. Our new SSBR production line in Schkopau, Germany began production on October 1, 2012, adding 50 kMT of new capacity. In addition, we entered into an agreement in February 2014 to repurchase 25 kMT of SSBR production capacity rights at our Schkopau facility from JSR Corporation Tokyo, Wallisellen Branch, effective April 1, 2014, at a significant discount to the estimated cost to build equivalent new capacity. With these two capacity additions, we have approximately doubled our SSBR production capacity.
Expand and Deepen Our Presence in Emerging Markets
We expect to capitalize on growing demand for our products in emerging markets such as China, Southeast Asia, Latin America and Eastern Europe and increase our local market share by expanding our customer base and local capabilities in these geographies. We believe that improving living standards and growth in GDP across emerging markets are creating increased demand for our products. We are also adding an additional 25 kMT of SB latex capacity at our facility in Zhangjiagang, China, which we expect to become operational in the second quarter of 2015. We expect to leverage our existing technology and platforms to make additional investments in emerging markets to address expected increases in demand for our SSBR, performance latex and plastics products in those geographies. We also expect this growth to occur in the end markets that use our products. For example, light-weight vehicle auto production is expected to grow from 2013 through 2018 at an annual rate of approximately 9% in China, approximately 6% in Asia and approximately 5% in South America. In addition,
7
Table of Contents
output for coated paper and paperboard in China has grown in recent years with related increases in the demand for paper coating chemicals. Consumption of SB latex for paper coatings in China is expected to grow by approximately 7% per year through 2016 and consumption of SB latex in China for use in carpet backing is expected to grow by approximately 6% per year through 2016.
We expect to capitalize on growing demand for our products in emerging markets and increase our local market share by expanding our customer base and local capabilities in these geographies. For example, we recently announced a 25 kMT expansion of our SB latex capacity at our facility in Zhangjiagang, China, which we expect to become operational in the second quarter of 2015 and will represent a 33% increase in our SB latex capacity in China.
We also expect to leverage our existing technology and platforms to make additional investments in emerging markets to address expected increases in demand for our SSBR, performance latex and plastics products in those geographies.
Opportunistically Pursue Strategic Acquisitions to Extend Leadership Positions
We intend to pursue acquisitions and joint ventures that have attractive risk-adjusted returns to extend our leadership positions in what we believe are the more attractive market segments (such as synthetic rubber and performance latex) and geographies for us, including emerging markets. We believe that a long-term trend toward consolidation in our industry will continue, which we expect to create opportunities for us given our scale, broad customer base, and geographic reach.
Continue to Implement Cost Saving Measures and Focus on Cash Flow Generation
We have a proven track record of offsetting fixed cost inflation with cost saving actions, and we continue to seek to identify incremental cost saving opportunities. In recent years, we have launched several company-wide initiatives intended to further reduce our costs and increase our competitiveness. We have reduced our fixed cost base by approximately $70 million since 2011 through a number of cost-saving initiatives such as streamlining production and administrative processes and optimizing logistics. We believe that our current cost structure positions us favorably to compete and grow in the current market environment, and we have ongoing corporate cost saving initiatives intended to realize annual cost savings at or above the rate of fixed cost inflation.
In addition, we continue to focus on cash flow generation through disciplined working capital and capital expenditure management. Following the completion of the SSBR capacity expansion at our Schkopau, Germany facility in 2012, capital expenditures have been reduced from approximately $112 million in 2012 to approximately $55 million in 2013, net of a $6 million and a $19 million government subsidy for SSBR expansion, respectively. We believe that our maintenance capital expenditures on our current fixed asset base will be in the range of $30 million to $40 million per year over the next several years, which represents less than 1% of our net sales.
8
Table of Contents
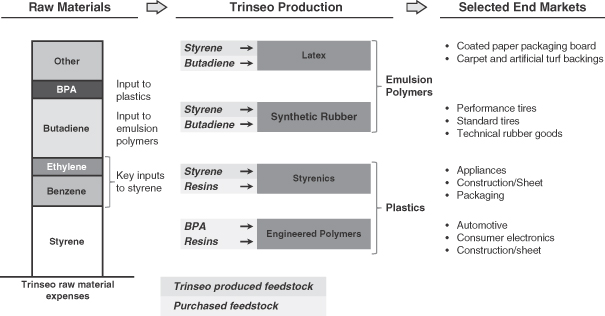
Business Model
The chart below illustrates our primary business operations in each of our business units, from the raw materials used in our products to our end-markets.
9
Table of Contents
Segment Overview
We operate in four reporting segments under two business units. Our Emulsion Polymers business unit includes our Latex reporting segment and our Synthetic Rubber reporting segment. Our Plastics business unit includes our Styrenics reporting segment and our Engineered Polymers reporting segment. The table below includes our net sales, operating income (loss) and adjusted EBITDA in each of our reporting segments for the year ended December 31, 2013, as well as a description of our major products and end-markets by segment.
| Emulsion Polymers | Plastics | |||||||||||||||
| Latex | Synthetic Rubber | Styrenics | Engineered Polymers | |||||||||||||
|
|
Year Ended December 31, 2013 (dollars in millions) |
| ||||||||||||||
| Net sales |
$1,341.4 | $622.1 | $2,305.4 | $1,038.5 | ||||||||||||
| Operating Income (loss) |
67.7 | 84.4 | 135.7 | (16.9) | ||||||||||||
| Adjusted EBITDA1 |
106.2 | 113.5 | 148.0 | 1.9 | ||||||||||||
| Adjusted EBITDA Margin1 |
7.9% | 18.2% | 6.4% | 0.2% | ||||||||||||
| Major Products |
|
• Styrene-butadiene latex (“SB latex”)
• Styrene-acrylate
• Performance |
|
|
• Solution styrene- butadiene rubber (“SSBR”)
• Lithium
• Emulsion styrene-
• Nickel |
|
|
• Polystyrene
• Acrylonitrile-
• Styrene-
• Ignition resistant
|
|
|
• Polycarbonate resins (“PC”)
• Compounds
• Polypropylene |
| ||||
| Major End-Markets |
|
• Coated paper and packaging board
• Carpet and
• Tape saturation
• Cement
• Building products |
|
|
• Performance tires
• Standard tires
• Polymer
• Technical rubber |
|
|
• Appliances
• Building and
• Packaging
• Automotive
• Consumer
• Consumer |
|
|
• Automotive
• Consumer
• Building and
• Others (including |
| ||||
| 1 | Excludes unallocated corporate expenses of $66.3 million. For a reconciliation of net income (loss) to adjusted EBITDA, refer to Item 7—Management’s Discussion and Analysis of Financial Condition and Results of Operations. |
See Note S to our consolidated financial statements included in this Annual Report for detailed financial data by segment and by geography.
Latex Segment
Overview
We are a global leader in SB latex, holding a strong market position across the geographies and applications in which we compete, including the #1 position in SB latex in Europe and the #2 position in North America. We produce SB latex primarily for coated paper used in advertising and magazines, packaging board coatings, carpet and artificial turf backings, as well as a number of performance latex applications. In 2013, approximately half of our Latex segment’s net sales were generated in Europe, approximately 25% were generated in the United States and the remainder was generated in Asia and other geographies.
We believe that our leading scale and differentiated capabilities in this segment are a competitive advantage that allows us to invest in new formulation capabilities and polymer science. Using our two pilot coating
10
Table of Contents
facilities in the United States and Switzerland, we work alongside our customers to develop new products and customer branding. We believe that this capability allows us to capture new business, strengthen our existing customer relationships and broaden our technological expertise.
We believe our development and formulation capabilities contribute to our strong position. Further, we believe our growth prospects in latex are enhanced by our expanding capacity in China. We believe that emerging markets, and in particular China, will contribute a substantial portion of the global growth of the paper and packaging board market segment over the next decade. We believe our growth prospects could also be enhanced if the recent trend of industry capacity reduction and consolidation continues. This consolidation trend includes the business combinations of BASF Group and Ciba Specialty Chemicals, Omnova Solutions Inc. and Eliokem International SAS, and Yule Catto & Co plc and PolymerLatex GmbH (currently known as Synthomer plc). We also believe we are well positioned to capture additional share in the performance latex market, which has accounted for a substantial portion of the total synthetic latex market, but only accounted for 10% of our Latex segment’s net sales in 2013.
Products and End Uses
We are a global leader in the production and marketing of SB latex for coated paper with the #1 position in SB latex in Europe and the #2 position in North America. For coated paper, we primarily manufacture SB latex, a high-volume product that is widely used as a binder for mineral pigments as it allows high coating speeds, improved smoothness, higher gloss level, opacity and water resistance. Typically, SB latex formulations are engineered in close collaboration with customers, and are tailored specifically to optimize finished product properties and production efficiency, and to minimize mill down time. Since SB latex accounts for, on average, approximately 8% of the total production cost for coated paper but is a critical element of the manufacturing process and provides performance characteristics key to the product’s end-use, we believe customers view it as a crucial component of their manufacturing process and typically seek high-quality, reliable producers.
We are also a leading supplier of latex polymers to the carpet and artificial turf industries and offer a diverse range of products for use in residential and commercial broadloom, needlefelt, and woven carpet backings. We produce high solids SB latex, SA latex, vinylidene chloride, and butadiene-methacrylate latex products for the commercial and niche carpet markets. We incorporate vinyl acrylic latex in our formulations for its ignition resistant properties, with the sourcing of vinyl acrylic latex readily available from a number of industry suppliers. SB latex is also used in flooring as an adhesive for carpet and artificial turf fibers.
We also offer a broad range of performance latex products, including SB latex, SA latex, and vinylidene chloride latex primarily for the adhesive, building and construction as well as the technical textile paper market, and have begun to implement the use of starch and associated new chemistries in paper coatings and carpet backing.
Customers
We believe our Latex segment is able to differentiate itself by offering customers value-added formulation and product development expertise. Our R&D team and Technical Services and Development, which we refer to as TS&D, team are able to use our two pilot coating facilities in Switzerland and the United States, four paper fabrication and testing labs in Brazil, China, Switzerland and the United States, three carpet technology centers located near carpet producers in China, the United States and Switzerland, and two product development and process research centers, one each in Germany and the United States, to assist customers in designing new products and enhancing the manufacturing process. Additionally, our global manufacturing capabilities are key in serving customers cost-effectively, as latex is costly to ship over long distances due to its high water content. We believe that our global network of service and manufacturing facilities is highly valued by our customers.
Many of our major customers rely on our dedicated R&D and TS&D teams to complement their limited in-house resources for formulation and reformulation tests and trials. We seek to capture the value of these services
11
Table of Contents
through our pricing strategy. In addition, as paper mills become larger and increasingly sophisticated with higher fixed costs, we believe there is greater demand for custom-formulated latexes. Historically, we have focused on capturing a majority share of new SB latex formulations for startups and major overhauls of existing paper coaters. In carpet applications, our product development expertise also allows us to provide differentiated products to our customers.
Competition
Our principal competitors in our Latex segment include BASF Group, Omnova Solutions Inc., Synthomer plc and Lin Cham Ltd. In our Latex segment, we compete primarily based on our ability to offer differentiated products, the reliability of our products, the quality of our customer service and the length and depth of our relationships.
Industry Outlook
Certain changes in industry structure have had a beneficial effect for latex producers, driven by industry capacity reduction and consolidation. From 2006 to 2011 industry capacity in North America and Europe contracted by approximately 20% due to shut downs and consolidations. Key industry events include the business combinations of BASF Group and Ciba Specialty Chemicals and resulting significant capacity reduction, a capacity rationalization by Dow / Dow Reichhold, Omnova Solutions Inc.’s rationalization at its Mogadore facility, the exit of The Lubrizol Corporation from the latex business, Omnova Solutions Inc.’s acquisition of Eliokem International SAS, and Yule Catto & Co. plc’s acquisition of PolymerLatex GmbH (currently known as Synthomer plc).
We also expect recent declines in the demand for coated paper to slow in the developed markets, particularly in Europe, and such declines to be more than offset by growth in emerging markets such as China as improving living standards generate increased demand for coated paper end products. Chinese consumption of styrene-butadiene latexes is expected to grow over 6% annually through 2016.
In addition, several historical developments that appeared to have an unfavorable impact at first, including the emergence of substitutes for SB latex in carpet backing applications in North America, have had less of an impact than initially anticipated due to superior SB latex performance, as many customers that we believe have switched to substitute products have switched back to SB latex due to its superior quality. This trend has been bolstered by increased butadiene availability and decreased butadiene cost in recent years. We also anticipate the housing recovery in the U.S. market will benefit our SB latex business through increased demand for carpet backing applications. We believe that if the recent trends of industry capacity reduction and consolidation and increasing demand in emerging markets continue, this will lead to a favorable production environment.
Synthetic Rubber Segment
Overview
We are a significant producer of styrene-butadiene and polybutadiene-based rubber products and we have a leading European market position in SSBR. While 100% of our sales were generated in Europe in 2013, approximately 15% of these net sales were exported to Asia, 8% to Latin America and 5% to North America.
We have a broad synthetic rubber technology and product portfolio, focusing on specialty products, such as SSBR and Li-PBR, while also producing core products, such as ESBR and Ni-PBR. Our synthetic rubber products are extensively used in tires, with an estimated 86% of our net sales from this segment in 2013 attributable to the tire market. We estimate that three quarters of these sales relate to replacement tires. We have strong relationships with many of the top global tire manufacturers and believe we have remained a supplier of choice as a result of our broad rubber portfolio and ability to offer technologically differentiated product and product customization capabilities. Other applications for our synthetic rubber products include polymer modification and technical rubber goods.
12
Table of Contents
Our most advanced rubber technology, SSBR, is a critical material for tires with low rolling resistance, which increases fuel efficiency and improves wet-grip and also leads to better traction and safety characteristics. We believe our growth prospects are enhanced by increasing demand for high performance tires, which are now more commonly used by automakers as OEM specified tires in their vehicles as a result of regulatory reforms in the EU, Japan and Korea that are aimed at improving fuel efficiency and reducing carbon dioxide emissions. As a result of these and other factors, demand for SSBR is expected to grow substantially faster than global GDP over the next 5 years.
Products and End Uses
Our Synthetic Rubber segment produces synthetic rubber products used in high-performance tires, impact modifiers and technical rubber products, such as conveyor belts, hoses, seals and gaskets. We participate significantly in the European synthetic rubber industry, where tire producers focus on high-performance and ultra high-performance tires and rely heavily on rubber suppliers to provide their supply of rubber, in contrast to North America where tire manufacturers produce most of their required rubber.
SSBR. We sell SSBR products for high-performance and ultra high-performance tire applications. We produce both clear and oil extended SSBR through batch polymerization in our three SSBR production lines. We believe these processes provide leading and technologically differentiated solutions to tire manufacturers.
We believe we are well-positioned to capture additional market share in high-growth high-performance tire applications and have expanded capacity to meet this anticipated demand. Our new SSBR production line in Schkopau, Germany began production on October 1, 2012, and expanded our SSBR production capacity by 50 kMT. In addition, we entered into an agreement in February 2014 to repurchase 25 kMT of SSBR production capacity rights at our Schkopau facility from JSR Corporation Tokyo, Wallisellen Branch, effective April 1, 2014, at a significant discount to the estimated cost to build equivalent new capacity. With these two capacity additions, we have approximately doubled our SSBR production capacity.
Our synthetic rubber portfolio is anchored by our SSBR technology and further strengthened by our new functionalized SSBR (SSBR engineered to perform specific functions) product offering. Our new product platform is used in the manufacture of high-performance and ultra high-performance tires. We expect demand growth for European performance tires, which are designed to improve passenger safety, tire longevity and vehicle fuel efficiency, to accelerate due to European legislation that became effective late in 2012.
During the last five years, we have been working closely with major tire producers around the world to develop multiple new SSBR grades, addressing key marketplace needs for improved tire fuel economy, grip, and abrasion characteristics, which we believe will lead to significant demand growth for our rubber products in Europe and around the world. We expect our synthetic rubber product mix to shift to new more advanced SSBR grades (from a relatively small portion of total SSBR volume in 2010 to more than 25% in 2015) to meet the expected demand growth.
ESBR. Our ESBR products are used in standard tires, technical goods, and footwear. Our ESBR product portfolio offers tire producers a comprehensive suite of synthetic rubber capabilities. For example, ESBR provides enhanced wet grip to tire treads and strength to the inner liner of tires, allowing the tires to be more easily processed.
Li-PBR. Our Li-PBR is used primarily for our own internal polymer modification applications. Polymer modification is the use of synthetic rubber to improve the impact resistance quality of plastic products. In 2013, approximately 80% of our Li-PBR products were consumed within our Plastics business unit for high impact polystyrene, or HIPS, and ABS production. We make two grades of Li-PBR exclusively for our polymer modification uses. In addition to impact resistance, Li-PBR provides visual surface gloss.
13
Table of Contents
Ni-PBR. We are currently the only European producer of Ni-PBR, with 30 kMT of capacity. We sell Ni-PBR products for use in standard tires, performance tires, technical goods and footwear. We believe Ni-PBR is valued by the tire industry because of its ability to form compounds that are easier to process, its ability to add wear resistance to the wet grip capabilities of SSBR and ESBR and its flexibility in tire sidewalls.
Customers
We maintain deep and long-standing relationships with a large number of multinational customers, including many of the top global tire manufacturers, as well as fast growing Asian tire manufacturers. Our relationships with our top customers, including with our predecessor business operated by Dow prior to the Acquisition, exceed 10 years on average.
Tire producers are the primary customers for our Synthetic Rubber segment. We believe we have remained a supplier of choice given our broad rubber portfolio, including technologically differentiated grades, and our product customization capabilities. The majority of our Synthetic Rubber segment net sales are based on contracts that generally include terms for at least three different rubber product families in addition to raw material pass-through clauses. Our R&D and TS&D teams use our broad rubber portfolio to develop differentiated specialty products for customers. Once implemented with a customer, these newly-developed specialty products cannot be easily replaced with a competitor’s product. As a result, we believe customers are likely to buy from us throughout the life cycle of specific tire models to avoid high switching costs and prevent repetition of the expensive development process.
Competition
Our principal competitors in our Synthetic Rubber segment include Asahi Kasei Corporation, JSR Corporation, Lanxess AG, Zeon Corporation, Versalis S.p.A and Synthos S.A. In our Synthetic Rubber segment, we compete primarily based on our ability to offer differentiated products, the reliability of our products, the quality of our customer service and the length and depth of our relationships.
Industry Outlook
| Total Projected SSBR Demand |
Total Projected Enhanced SSBR Demand | |
|
|
Our Synthetic Rubber segment participates mainly in the European synthetic rubber industry, where tire producers rely on rubber suppliers, in contrast to North America where tire manufacturers produce most of their required rubber. Rubber suppliers typically manufacture more than one grade of rubber as customers typically require different grades of rubber from a single supplier. Performance tires represent an especially attractive market to rubber producers because they provide substantial value to end customers and the market for performance tires is
14
Table of Contents
expected to grow at twice the rate of the rest of the tire market. Tire manufacturers are expected to continually seek improvements in advanced rubber, which optimizes the combination of fuel economy and wet grip in order to meet EU regulations which set minimum requirements and are being phased in through 2020. Other jurisdictions have adopted or are considering similar legislation and are also beginning to adopt the tire labeling requirements that have become mandatory in Europe since late 2012. Enhanced SSBR, which includes later generations of SSBR and functionalized SSBR and is used in the new generation of performance tires, is expected to reach approximately 40% of the total SSBR market by 2017. We believe our leadership in the fast growing SSBR segment will position us to perform well relative to the broader industry and anticipate future strong demand from the broader adoption of legislation similar to the EU legislation and the relative performance advantages of our SSBR products. Combined with relatively modest incremental capacity announcements by our competitors, particularly in enhanced SSBR, we expect industry utilization rates to remain high and increase in the near-term.
Styrenics Segment
Overview
Our Styrenics segment includes polystyrene, ABS and SAN products, as well as our internal production and sourcing of styrene monomer, a raw material common in SB latex, synthetic rubber and styrenics products. We are a leading producer of polystyrene and mass ABS, or mABS, where we focus our efforts on differentiated applications such as the liners and encasements of appliances and consumer electronics including smartphones and tablets. Within these applications, we have worked collaboratively with customers to develop more advanced grades of plastics such as our HIPS and mABS products. For example, we work with appliance manufacturers around the world to develop improved environmental stress crack resistant products and with our construction sheet customers on smooth ABS. These products offer superior properties, such as rigidity, insulation and colorability, and, in some cases, an improved environmental footprint compared to general purpose polystyrene or emulsion ABS. Our Styrenics segment also serves the packaging and construction end-markets, where we have launched a new general purpose polystyrene product for improved performance in foam insulation applications.
We believe our growth prospects in our Styrenics segment are enhanced by periodic trends of industry capacity reduction and consolidation in Europe and North America, such as the completed formation of the Styrolution Group GmbH joint venture combining certain INEOS and BASF Group assets and the prior acquisition of INEOS Nova by INEOS, as well as INEOS’ most recent asset rationalizations in styrene monomer and polystyrene and Styrolution’s recent announcement to close a polystyrene plant in the United States. We also have a 50% interest in Americas Styrenics LLC, our joint venture with Chevron Phillips Chemical Company, which operates in the North American and Latin American markets and has benefitted from recent positive trends in those markets. We expect further consolidation in certain regions of Asia with numerous producers and low asset utilization, which we believe will create opportunities for us, given our scale and geographic reach. We believe our growth prospects are further enhanced by our established manufacturing footprint in the high economic growth regions of Asia and our focus on attractive end-markets where improving living standards drive demand for growing appliances and consumer electronics markets. In 2013, approximately 60% of sales from our Styrene segment were generated in Europe and an additional 33% of sales were generated in Asia.
Products and End Uses
Polystyrene. We are a leading producer of polystyrene and focus on sales to injection molding and thermoforming customers. Our product offerings include a variety of GPPS and HIPS, which is polystyrene that has been modified with polybutadiene rubber to increase its impact resistant properties. These products provide customers with performance and aesthetics at a low cost across applications, including appliances, packaging, including food packaging and food service disposables, consumer electronics and building and construction materials.
We believe our STYRON™ brand is one of the longest established brands in the industry and is widely recognized in the global marketplace. We believe our R&D efforts have resulted in valuable, differentiated
15
Table of Contents
solutions for our customers. For instance, during the early 2000s, we developed an innovative STYRON A-TECH™ family of resins that is an advanced polystyrene product allowing customers to balance key properties such as toughness, gloss, stiffness, flow and cost, and provide combinations of properties that were previously not available with standard HIPS. We believe that over the past decade, this product family has become the industry standard for this application.
Acrylonitrile-Butadiene-Styrene (ABS). We believe we are a leading producer of ABS in Europe and are one of the few producers with a presence in North America. We produce mABS, a variation of ABS that has lower conversion and capital costs compared to the more common emulsion ABS, or eABS, process, marketed under the MAGNUM™ brand. mABS has similar properties to eABS but has greater colorability, thermal stability and lower gloss. mABS products can be manufactured to stricter specifications because it is produced in a continuous process as opposed to the batch process used in eABS. mABS also has environmental benefits such as waste reduction and higher yields. In addition to our own mABS production capacity, we also license our proprietary mABS technology to other producers.
Primary end uses for our ABS products include automotive and construction sheet. In 2013, we maintained a significant share of ABS sales into these markets, which we believe is driven by the differentiating attributes of our mABS products, our reputation as a knowledgeable supplier, our broad product mix and our customer collaboration and design capabilities.
Automotive manufacturers have developed innovative solutions in order to meet increasing fuel standards, such as the lightweighting of vehicles. Consequentially, manufacturers have been replacing heavier materials with durable yet lighter materials, such as mABS and polypropylene compounds. We expect this trend to continue, and we believe that our technological capabilities in our Styrenics segment together with our compounding and blending expertise will help generate future growth opportunities.
Styrene-Acrylonitrile. SAN is composed of styrene and acrylonitrile, which together provide clarity, stiffness, enhanced ability to be processed, mechanical strength, barrier properties, chemical resistance and heat resistance.
SAN is used mainly in appliances, consumer goods and construction sheets, due to its low-cost, clarity and chemical resistance properties. Within our Styrenics segment, we manufacture SAN under the TYRIL™ brand name for use in housewares, appliances, automotive, construction sheets, battery cases and lighting applications. In addition, TYRIL™ is suitable for self-coloring which adds value in many of these uses.
Technology licensing. From time to time, we may seek to opportunistically license our technology to third parties pursuant to licensing arrangements that may be exclusive to a particular geography or product.
Customers
Our customer centric model focuses on understanding customers’ needs and developing tailored solutions that create value for both parties. For durable applications, we focus our TS&D, R&D and marketing teams on product design engineering initiatives for developing and specifying plastics in the next generation of construction applications, appliances, automotive, and consumer electronics. In non-durable applications, we focus on innovative products that provide clear cost advantages to our customers, serving customers with our cost-advantaged technology and operating excellence. We have leveraged industry-leading product development and technology capabilities to develop long-standing customer relationships with many of our customers, including a number who have purchased from us, including our predecessor business operated by Dow prior to the Acquisition, for more than 20 years. We believe that our global presence is an advantage, allowing us to provide customers with consistent product grades and positioning us to strategically serve growth economies.
16
Table of Contents
Competition
Our principal competitors in our Styrenics segment are Styrolution Group GmbH, Versalis S.p.A. and Total S.p.A. In our Styrenics segment, we compete primarily based on our ability to offer differentiated products, the reliability of our products, the quality of our customer service and the length and depth of our relationships.
Industry Outlook
From 2006 to 2011, the polystyrene industry experienced substantial capacity rationalizations by major producers such as BASF Group, INEOS Nova, and others. Over 1,000 kMT of annual U.S. and Western Europe polystyrene capacity were eliminated during this time period, representing a reduction of approximately 20% of the 2005 total capacity in those regions. Consistent with the broader industry, we participated in these rationalizations by electing to shut down some of our less cost effective European assets and concentrating production at our most competitive facilities. This trend has continued since 2011 with the completed formation of the Styrolution joint venture combining certain INEOS and BASF Group assets and the prior acquisition of INEOS Nova by INEOS, as well as INEOS’ most recent asset rationalizations in styrene monomer and polystyrene and Styrolution’s recent announcement to close a polystyrene plant in the United States.
In addition to improving profitability through cost rationalizations, the polystyrene industry has also benefited from a number of consolidating activities. A number of our larger competitors have enhanced their platforms via acquisitions and joint ventures, such as the completed formation of the Styrolution joint venture combining certain INEOS and BASF Group assets and the prior acquisition of INEOS Nova by INEOS. Utilization rates are expected to improve in Europe by 2018 and steadily increase in North America and Asia from 2014 through 2018 as the reduced production capacity serves growing demand in end-markets.
The ABS and styrenics markets have also experienced a number of capacity rationalizations since 2006. These rationalizations, combined with improved end-market demand, have resulted in a substantial improvement in operating rates since the beginning of the global economic downturn. Global styrene utilization rates of approximately 84% in 2013 are expected to increase to 91% by 2018.
Engineered Polymers Segment
Overview
We are a leading producer of engineered polymers. Our products are predominantly used in the automotive, consumer electronics, construction, and medical device markets. We are focused on differentiated products which we produce in our polymer and compounds and blends manufacturing facilities located across Europe, Asia, North America and Latin America. We believe that the strategic locations of these facilities combined with close customer collaboration offers us a strategic advantage in serving our customers. Many of our PC products and more than half of our compounds and blends products are differentiated, based on their physical properties, performance and aesthetic advantages. Our history of innovation has contributed to long-standing relationships with customers who are recognized leaders in their respective end-markets. We have established a strong market presence in the global automotive and electronics sector, targeting both component suppliers and final product manufacturers. Our Engineered Polymers segment also compounds and blends our PC and mABS plastics into differentiated products for customers within these sectors, as well as into compounds of polypropylene. We have also developed compounds containing post-consumer recycle polymers to respond to what we believe is a growing need for some customers to include recycled content in their products. We are currently focused on reducing costs in order to improve our competitiveness in polycarbonate.
We believe growth in this segment is driven by a number of factors, including consumer preference for lighter weight and impact-resistant products and the development of new consumer electronics, increases in LED lighting applications and continuing growth in medical device applications. Additionally, we believe growth is bolstered by sustainability trends, such as the substitution of lighter-weight plastics for metal in automobiles, as well as more energy efficient, glazing solutions.
17
Table of Contents
In 2013, approximately 50% of our Engineered Polymer segment’s net sales were generated in Europe, approximately 20% were generated in the United States and approximately 15% were generated in Asia, with the remainder in other geographic regions, including Latin America and Canada.
Products and End Uses
Our Engineered Polymers segment consists of PC, compounds and blends and some specialized ABS grades. PC has high levels of clarity, impact resistance and temperature resistance. PC can be used in its neat form (prior to any compounding or blending) for markets such as construction sheet, optical media and LED lighting. Additionally, PC can be compounded or blended with other polymers, such as ABS, which imparts specific performance attributes tailored to the product’s end-use. Our compounds and blends business has a significant position in the PC/ABS blends, which combine the heat resistance and impact strength of PC with the easy to process qualities and resilience of ABS. In addition, we produce ignition resistant polystyrene for consumer electronics applications such as flat screen televisions. We believe our ability to offer technologically differentiated products to meet customer needs sets us apart from our competitors, and with our history as a leading innovator in PC and compounds and blends, we have established ourselves as a leading supplier of PC-based products.
Our products for glazing and construction sheets are marketed under the CALIBRE™ brand name and offer customers a combination of clarity, heat resistance and impact performance. Glazing and construction sheet represents our largest PC application, and is a key growth focus for us. Key end-markets include the construction industry, with additional opportunities for growth with compounded products in the medical device space, consumer electronics and other applications such as smart meter casings that require plastics with enhanced weatherability, ignition resistance and impact performance.
For the automotive industry, we manufacture PC blends under the PULSE™ brand, and we innovate collaboratively with our customers to develop performance solutions to meet the industry’s needs, such as removing weight from vehicles. As a result, we are a key supplier of these products to leading automotive companies in North America and Europe, who tend to specify these products on a per car program platform basis, making it difficult to be displaced as a supplier once selected and providing us with relatively stable and predictable cash flows for several years during the production lifecycle. We are also accelerating our development of similar supply capabilities in rapidly-growing areas such as China.
For the consumer electronics, electrical and lighting and medical device industries, we manufacture our products under the EMERGE™ brand, among others, and we believe that we have substantial growth opportunities in tablets, notebooks, smart phones and other handheld devices, as well as flat screen television sets, and electrical and lighting and medical device components. In serving these markets, we leverage our polymer and compound technologies to meet increasingly stringent performance requirements along with the aesthetic and color-matching requirements which are crucial characteristics for the products involved. The result is that we are a leading and long-standing supplier to many well known brands.
Technology licensing. From time to time, we may seek to opportunistically license our technology to third parties pursuant to licensing arrangements that may be exclusive to a particular geography or product.
Customers
We have a history of innovation in PC and compounds and blends in our Engineered Polymers segment, and we believe that our focus on differentiated products enhances our growth prospects in this segment. We develop tailored polymer, compound and process solutions for our customers and for end-markets such as consumer electronics, we believe that our ability to work with our customers to quickly and effectively develop product solutions is a key to our success. Our innovation has contributed to long-standing relationships with customers
18
Table of Contents
who are recognized leaders in their respective end-markets. We also believe our global facilities are a competitive advantage that allows us to provide customers with consistent grades and position us to strategically serve emerging markets.
Competition
Our principal competitors in our Engineered Polymers segment are Bayer MaterialScience AG, LG Chem Ltd., Mitsubishi Chemical Corporation, Saudi Basic Industries Corporation, Teijin Limited, Borealis AG, Celanese Corporation and LyondellBasell Industries. In our Engineered Polymers segment, we compete primarily based on our ability to offer differentiated products, the reliability of our products, the quality of our customer service and the length and depth of our relationships.
Industry Outlook
We believe we are a leading global producer of PC and PC blends. Smaller competitors tend to operate on a regional basis. We have developed a global, multi-tiered marketing approach targeting the tiered suppliers, as well as final product producers, which we believe most effectively addresses our customers’ needs.
We believe our base PC business will benefit from continued growth in demand of approximately 5% per year as well as capacity absorption following the large capacity additions in 2011 and 2012 by SABIC and other producers. In addition, we believe that capacity expansions in China by some of our competitors are being postponed by several years. Furthermore, some Asian producers, such as Teijin, have announced plans to reduce capacity. As a result of this dynamic, global PC utilization rates are expected to increase by approximately 6% over the next five years.
We also believe that automotive manufacturers will continue the practice of lightweighting vehicles in order to meet increasing fuel efficiency standards, which should increase demand for our compounds and blends products. We believe these same trends towards lighter weights and higher performance materials will also impact other key end-markets such as medical devices, lighting and consumer electronics, and will continue to be a source of growth for our differentiated products.
Our Relationship with Dow
In conjunction with the Acquisition, we entered into certain agreements with Dow, including the Second Amended and Restated Master Outsourcing Services Agreement, which was modified on June 1, 2013 (“SAR MOSA”), the Amended and Restated MOD5 Computerized Process Control Software, Licenses and Services Agreement, with Rofan Services, Inc. which was modified June 1, 2013 (“AR MOD5 Agreement”), site and operating services agreements, and supply agreements.
The SAR MOSA provides for ongoing worldwide services from Dow, in areas such as information technology, enterprise resource planning, finance, environmental health and safety, training, customer service, marketing and sales support, supply chain and purchasing. The term of this agreement runs through December 2020, which automatically renews for two year periods unless either party provides six months’ notice of non-renewal to the other party. The services provided pursuant to the SAR MOSA generally are priced per function, and we have the ability to terminate the services or any portion thereof, for convenience any time after June 1, 2015, subject to payment of termination charges. Services which are “highly integrated” follow a different process for evaluation and termination. In addition, either party may terminate for cause, which includes a bankruptcy, liquidation or similar proceeding by the other party, for material breach which is not cured, or by Dow in the event of our failure to pay for the services thereunder. In the event of a change of control as defined in the agreement, Dow has the right to terminate the SAR MOSA.
Under the AR MOD5 Agreement, Dow provides worldwide process control technology, including hardware, software licenses and support services, and related enterprise resource planning services. The AR
19
Table of Contents
MOD5 Agreement, with a term through December 2020, may be terminated by either party for cause, which includes a bankruptcy, liquidation or similar proceeding by the other party, for material breach which is not cured by us if we no longer wishes to receive maintenance and support for any licensed software; or by Dow if we use the licensed software for any purposes other than Company business. Dow may terminate the maintenance and support terms at any time if we fail to make payments when due and the default is not corrected within 30 days from notice, or upon two years written notice us, if Dow has made the decision not to support the software systems, provided that Dow will use commercially reasonable efforts to assist us in locating and transitioning to an alternate service provider.
In addition, we entered into various site services agreements with Dow, which were modified as of June 1, 2013, where at Dow owned sites, Dow provides site services to Company. Conversely, we entered into similar agreements with Dow in June 2010, where at Company owned sites, we provide such services to Dow. These agreements cover general services that are provided at specific facilities co-located with Dow, rather than organization-wide services, and include utilities, site administration, environmental health and safety, site maintenance and supply chain. In certain circumstances, the parties may adjust certain prices and volumes. These agreements generally have 25-year terms from the date of the Acquisition, with options to renew. These agreements may be terminated at any time by agreement of the parties, or, by either party, for cause, including a bankruptcy, liquidation or similar proceeding by the other party, or for a material breach which is not cured. In addition, we may terminate for convenience any services that Dow has agreed to provide to us that are identified in any site services agreement as “terminable” with 12 months prior notice to Dow, dependent upon whether the service is highly integrated into Dow operations. With respect to “nonterminable” services that Dow has agreed to provide to us, such as electricity and steam, we generally cannot terminate such agreements prior to the termination date unless we experience a production unit shut down for which we provide Dow with 15-months prior notice, or upon payment of a shutdown fee. Upon expiration or termination, we would be obligated to pay a monthly fee to Dow, which obligation extends for a period of 45 to 60 months following the termination or expiration of each site services agreement. The agreements under which Dow receives services from us may be terminated under the same circumstances and conditions.
We also have operating services agreements with Dow pursuant to which Dow operates and maintains our latex facility at Rheinmunster, Germany, and employs most of the staff for this facility, and pursuant to which we provide the same services to Dow for their Cumene facility in Terneuzen, Netherlands, in each case for an initial term of up to 25 years from the closing date of the Acquisition, or 2020, and will automatically renew for successive five year periods unless either party provides notice of intent not to renew at least 18 months prior to the expiration of such period. We may terminate any operational service under the Rheinmunster agreement in the event that we experience a production unit shut down, with 15-months prior notice to Dow, and Dow may terminate the supply of operational services to us in the event of Dow’s permanent cessation of the operation, also with 15-months prior notice. Dow and we have parallel rights under the Terneuzen agreement, with notice periods extended to 18 months. In addition, either party may terminate for cause, which includes a bankruptcy, liquidation or similar proceeding by the other party, for material breach which is not cured, or by Dow in the event of our failure to pay for the services thereunder.
For the years ended December 31, 2013 and 2012, we incurred a total of $306.2 million and $320.5 million in expenses under the SAR MOSA, AR MOD5 Agreement, and site services agreements, including $235.1 million and $214.5 million, respectively, for both the variable and fixed cost components of the site service agreements and $71.1 million and $106.0 million, respectively, covering all other agreements.
We have entered into long-term supply agreements whereby Dow supplies ethylene, benzene, butadiene, BPA, and other raw materials amounting to approximately 45% to 50% of our raw materials (based on aggregate purchase price). The ethylene, benzene and butadiene agreements are each for an initial term of up to 10 years from the closing date of the Acquisition. The BPA agreement has an initial term expiring in 2015. These agreements generally do not contain any specific termination provisions and pricing is generally based on standard industry markers with appropriate volume discounts which can be negotiated from time to time.
20
Table of Contents
In addition, we have entered into two contract manufacturing agreements pursuant to which Dow operates and maintains one of its facilities to produce polycarbonate products for us in Freeport, Texas, and we operate and maintain our SAN facility in Midland, Michigan to produce products for Dow, each for an initial term of up to 25 years from the Acquisition date. These agreements generally have 25-year terms, with automatic renewals for five-year terms unless one party gives notice at least 18 months prior to the end of the period. We may terminate any operational service under the agreements in the event that we experience a production unit shut down, with 15-months prior notice to Dow, and Dow may terminate the supply of operational services to us in the event of Dow’s permanent cessation of the operation, also with 15-months prior notice. Furthermore, the agreements may be terminated by mutual agreement between the parties, by either party on notice that the other party fails to cure non-performance or if the other party is in material breach of a material obligation under the agreement within certain parameters, or because of either party’s insolvency.
We have also entered into certain license agreements pursuant to which we have obtained exclusive licenses to use certain of Dow’s intellectual property in connection with the Styron business as it was conducted by Dow and non-exclusive licenses to use certain Dow intellectual property, other than patents, with respect to products outside of the Styron business as it was conducted by Dow prior to the Acquisition, subject to certain limitations. While our license rights are sufficient to allow us to operate our current business, new growth opportunities in latex and, to a lesser extent, plastics involving new products may fall outside of our license rights with Dow. Therefore, our ability to develop new products may be adversely impacted by intellectual property rights that have been retained by Dow.
For the years ended December 31, 2013 and 2012, purchases and other charges from Dow and its affiliated companies (excluding the SAR MOSA, AR MOD5 Agreement, and site services agreements) were approximately $2,030.3 million and $2,334.2 million, respectively. For the years ended December 31, 2013 and 2012, sales to Dow and its affiliated companies were approximately $294.7 million and $311.4 million, respectively.
We continue to leverage Dow’s scale and operational capabilities by procuring certain raw materials, utilities, site services, and back-office business services from Dow. In connection with the Acquisition, we entered into several agreements with Dow relating to the provision of certain products and services and other operational arrangements. Dow provides significant operating and other services, and certain raw materials used in the production of our products, under agreements that are important to our business. The failure of Dow to perform their obligations, or the termination of these agreements, could adversely affect our operations. See Item 1A—Risk Factors.
Joint Venture Option Agreement
In connection with the Acquisition in 2010, certain of our affiliates entered into the Latex JV Option Agreement with Dow, pursuant to which Dow was granted an irrevocable option to purchase 50% of the issued and outstanding interests in a joint venture to be formed by Dow and our affiliates with respect to the SB latex business in Asia, Latin America, the Middle East, Africa, Eastern Europe, Russia and India (the “Emerging Markets SB Latex Business”) at a purchase price equal to the enterprise fair market value attributable to the Emerging Markets SB Latex Business. Dow has exercised its option under the Latex JV Option Agreement and we subsequently entered into an amendment, effective as of August 9, 2011, to suspend the timing of the Latex JV Option to allow for additional business discussions, through the earlier of June 17, 2015 or the completion of an initial public offering. We are currently in a discussion period with Dow concerning the scope and terms of a joint venture for the Emerging Markets SB Latex Business. We have not finalized the terms or scope of any such joint venture and there is no assurance that we will be able to complete the joint venture on the terms contemplated by the Latex JV Option Agreement, as amended, or at all.
21
Table of Contents
Our Joint Ventures
To supplement our business segments, we have entered into two strategic joint ventures in order to gain access to local markets, minimize costs and accelerate growth in areas we believe have significant business potential.
Americas Styrenics
Launched in 2008, Americas Styrenics is a 50% / 50% joint venture between us and Chevron Phillips Chemical Company. Under the terms of the joint venture agreement, Americas Styrenics is the sole entity through which we can produce, market or sell styrene and polystyrene in North America and South America, and produces a range of HIPS and GPPS products. We believe the venture has capitalized on the strong relationships and technology leadership of its parent companies to maintain a strong industry presence and pursue developing opportunities. Americas Styrenics has benefitted from industry consolidation and the cyclical recovery in the North American styrenics market.
Sumika Styron Polycarbonate Limited
Sumika Styron is a 50% / 50% venture with Sumitomo Chemical of Japan. Sumika Styron has exclusive rights in Japan to manufacture and sell a range of our PC products and facilitates our access to the Japanese PC market. Sumika Styron’s facility is located in an integrated and efficient manufacturing site, and uses Dow technology and production processes.
Sources and Availability of Raw Materials
Our raw materials and procurement group is responsible for the ongoing production, sourcing and procurement of raw materials for each of our business segments. The professionals leading this group have extensive experience in the petrochemical industry buying, selling, and swapping commodity raw materials. Our raw materials group seeks to implement the most efficient and reliable raw material strategy for our business segments, including maintaining a balance between contracted and spot purchases as well as internal production of styrene monomer. While Dow provides a significant portion of our raw materials to us pursuant to supply agreements, including ethylene, benzene, butadiene and BPA, we have developed a comprehensive strategy for obtaining additional sources of supply where needed.
Our agreements with Dow range from 1- to 10-year terms with, in some cases, an automatic 2-year renewal. Minimum and maximum monthly contract quantities were established based on historical consumption rates, and our pricing terms are based on commodity indices in the relevant geography. We obtained approximately 45% of our raw materials from Dow in 2013.
The prices of key raw materials that we purchase, including benzene, ethylene, styrene, butadiene and BPA, are volatile and can fluctuate significantly from time to time. The predominant drivers of this volatility are the prices of crude oil and natural gas as well as the impact of market imbalances in supply and demand from time to time. We have supply contracts in place to help maintain our supply of raw materials at competitive market prices.
Styrene
In addition to purchasing styrene through long-term strategic contracts and opportunistic short-term purchases, we produce styrene internally from purchased ethylene and benzene at our own manufacturing sites. With this mix of purchased and produced styrene, we seek to optimize our overall costs of securing styrene through efficient logistics, manufacturing economics and market dynamics.
22
Table of Contents
We believe the low steam-to-oil ratios (“S/O”) of our styrene production plants make them highly energy efficient as compared to other players in our industry. This technology also uses proprietary catalyst technology that supports operation in low S/O conditions and enables long runs between turnarounds. In addition, the styrene production process leverages in-house computational fluid dynamic and reaction models to predict catalyst activity over time, at varying operating conditions, to optimize run rates.
Benzene and Ethylene
Benzene and ethylene are two commodity petrochemicals that represent the majority of the raw materials needed for styrene production. In 2013, Dow supplied us with approximately 95% of our benzene requirements and 100% of our ethylene requirements through 10-year contracts that commenced in 2010, and include automatic 2-year renewal provisions. The volume of benzene that we purchase from Dow may vary quarterly based on our needs at the time. Our operations that use benzene and ethylene are connected to Dow’s cracker operations where these raw materials are produced by a supply pipeline that facilitates the efficient delivery of our raw material requirements. We monitor these materials and how changes in their costs impact the styrene supply chain and its downstream derivatives. Our pricing formulae with Dow are based on well-known indices for the region and generally include large buyer discounts.
Butadiene
Butadiene is an important raw material for the Synthetic Rubber and Latex segments. Dow is our largest supplier for this material in Europe where we purchase directly from Dow’s existing butadiene extraction facilities pursuant to the terms of a 10-year contract that commenced in 2010 and includes an automatic 2-year renewal term. Other supply sources in Europe include major producers with contract terms of up to five years at competitive market prices. Supply to North America and Asia are exclusively from other major third party producers via supply contracts. As a large purchaser of butadiene, we believe we can continue to secure the raw material reliably at competitive prices.
Bisphenol A (BPA)
BPA is the major raw material associated with PC production. This raw material is produced by Dow in Stade, Germany and is supplied via pipeline to us through a supply contract in Europe that has an initial term expiring in the middle of 2015. We source BPA for our North American operations and Asian joint ventures from other market participants.
Manufacturing
As of March 1, 2014, our Latex segment had 12 production sites that are strategically located throughout the world. We believe these facilities have industry leading quality tracking.
We manufacture all synthetic rubber products at one integrated site at Schkopau, Germany. We believe that our synthetic rubber plant compares favorably to average benchmarks across key cost metrics and is one of the more cost-efficient synthetic rubber production sites in Europe.
We operate our Styrenics segment on a global basis, including plants in China and our integrated Schkopau, Germany site in close proximity to faster growing regions. We believe that our polystyrene plants compare favorably to benchmarks across key cost metrics. Additionally, we believe our joint venture with Chevron Phillips Chemical Company LP, Americas Styrenics, is well-positioned to serve North America and emerging opportunities in South America. We manufacture SAN for Dow under an agreement in our Midland, Michigan facility.
23
Table of Contents
Our Engineered Polymers segment operates on a global basis with manufacturing plants in Stade, Germany and compounding operations in Stade, Germany; Terneuzen, The Netherlands; Hsinchu, Taiwan; and Limao, Brazil. Dow also manufactures for us in Freeport, Texas, using Dow facilities, under an agreement with us. We also have strategic compounding agreements in Asia, North America and Europe and a strategic joint venture with Sumitomo Chemical Co. in Japan. We believe this joint venture partner enables us to gain access to an expanded range of geographies and customers.
Technology
Our R&D and TS&D activities across our segments focus on identifying needs in our customers’ end-markets. As part of our customer-centric model, our R&D/TS&D organization interfaces with our sales and marketing teams and directly with customers to determine their product requirements in light of trends in their industries and market segments. This information is used to select R&D/TS&D projects that are value-enhancing for both our customers and us. Our R&D/TS&D activities and capabilities include:
| • | formulation knowledge, which enables accelerated new product development; |
| • | internal capabilities, such as latex pilot coasters and plastics mini plants; |
| • | functionalization technology, which is a key capability in our synthetic rubber products to enable us to continue to develop new grades for tire products; |
| • | compounding expertise, which comprises knowledge of the compounding process coupled with formulation knowledge and facilitates our ability to develop new compounds and blends to meet evolving needs in various businesses; and |
| • | providing a broad product portfolio with innovative solutions to meet customer needs. |
Our R&D facilities support our technological capabilities. In addition to our two SB latex pilot coaters and our product development centers, our Plastics and Emulsion Polymers business units operate “mini plants” in Stade and Schkopau, Germany. These mini plants are used to make samples of experimental products for testing, which we believe is a critical step in our new product development process.
R&D and TS&D costs are included in expenses as incurred. Our R&D and TS&D costs for the year ended December 31, 2013, 2012 and 2011 were $49.7 million, $48.3 million and $58.1 million, respectively.
Sales and Marketing
We have a customer-centric business model that has helped us to develop strong relationships with many customers. Including periods prior to the Acquisition when our predecessor business was operated by Dow, we have an average length of key customer relationships exceeding 20 years. Our application development, R&D, TS&D, marketing and sales functions work together to define the customers’ needs and develop technologically differentiated solutions that create value for both the customer and us and result in greater customer intimacy. This can be seen most clearly in competitive applications such as coated paper and packaging board, automotive, consumer electronics, and glazing and construction sheet.
Our sales and marketing teams play a key role in realizing this strategy around technologically differentiated solutions. Our sales and marketing initiatives include:
| • | Developing a solution-centric approach to sales versus a product-centric approach. Our sales and marketing teams understand the trends in the industries and applications served by us, and this is critical to identifying changing customer requirements and providing differentiated value-added products. |
24
Table of Contents
| • | Coordinating account teams effectively to develop and implement customer solutions. We often include sales-people and TS&D engineers in customer activities. Where appropriate, we involve our engineers to develop new applications and respond to fast moving market trends. |
| • | Understanding the value chain and effectively deploying our resources across this chain. In some of our end-markets, our immediate customers may be distributors or manufacturers, rather than the original equipment manufacturers. In these instances, our sales and marketing teams may employ a multi-channel marketing approach, developing relationships with the key decision makers across the value chain to develop differentiated, value-added products. For example, our automotive business markets its products: (1) through distributors, (2) directly to a broad range of small, medium and large parts suppliers, and (3) directly to the auto manufacturers themselves. |
Our sales and marketing professionals are primarily located at our facilities or at virtual offices within their respective geographies. We have approximately 120 professionals working in sales and marketing around the world, along with approximately 70 customer service professionals and we sell our products to customers in over 75 countries. We primarily market our products through our direct sales force. All of our direct sales are made by our employees in the regions closest to the given customer. Historically, we have focused the majority of our direct sales efforts on large customers and relied on large distributors for sales to smaller accounts. In addition to the key initiatives outlined above, we intend to increase the amount of customers we serve directly.
Information Systems
We use Dow’s Enterprise Resource Planning (“ERP”) software systems to support our operations worldwide. We have the right to use Dow’s ERP software applications and infrastructure under the terms of the SAR MOSA and its related functional statements of work. The SAR MOSA has a current term that expires on December 31, 2020. Under the terms of the SAR MOSA, Dow extends its work processes and the supporting applications and infrastructure for us to use. Under the SAR MOSA, Dow’s work process expertise centers provide the knowledge-base and documentation required for our personnel to follow work process steps and procedures.
We also use Dow’s global data/voice network and server infrastructure for desktop computing, email, file sharing, intranet and internet website access, mainframe and midrange computer access and voice communications. Business software applications are included in the work processes supported under the SAR MOSA. These applications complement a number of our other global ERP applications to provide us with the equivalent of a modern ERP landscape. We use the various ERP applications to manage our day-to-day business processes and relationships with customers and suppliers.
Our manufacturing plants use Dow-developed proprietary process control/process automation technology under the AR MOD5 Agreement. We are licensed to use this technology and receive support and spare parts through the expiration of the current term of the agreement on December 31, 2020. While we are not permitted to use this automation technology for new plants or to substantially expand existing plants, but we can use other technology solutions for those situations. Prior to the expiration of the term of the AR MOD5 Agreement, we expect to migrate our manufacturing plants to a substitute third party process control technology.
Intellectual Property
We evaluate on a case-by-case basis how best to utilize patents, trademarks, copyrights, trade secrets and other intellectual property in order to protect our products and our critical investments in research and development, manufacturing and marketing. We focus on securing and maintaining patents for certain inventions, while maintaining other inventions as trade secrets, derived from our customer-centric business model, in an effort to maximize the value of our product portfolio and manufacturing capabilities. Our policy is to seek appropriate protection for significant product and process developments in the major markets where the
25
Table of Contents
relevant products are manufactured or sold. Patents may cover products, processes, intermediate products and product uses. Patents extend for varying periods in accordance with the date of patent application filing and the legal life of patents in the various countries. The protection afforded, which may also vary from country to country, depends upon the type of subject matter covered by the patent and the scope of the claims of the patent.
In most industrial countries, patent protection may be available for new substances and formulations, as well as for unique applications and production processes. However, given the geographical scope of our business and our continued growth strategy, there are regions of the world in which we do business or may do business in the future where intellectual property protection may be limited and difficult to enforce. We maintain strict information security policies and procedures wherever we do business. Such information security policies and procedures include data encryption, controls over the disclosure and safekeeping of confidential information, as well as employee awareness training. Moreover, we monitor our competitors’ products and, if circumstances were to dictate that we do so, we would vigorously challenge the actions of others that conflict with our patents, trademarks and other intellectual property rights.
We own over 250 patents and have over 200 pending patent applications in various jurisdictions throughout the world covering processes and technology such as material formulations, material process technology and various end-use industrial applications for our materials.
The technologies we utilize in some of our business lines have been in use for many years (e.g., SB latex and ABS) and a number of our patents relating to such technologies have expired or will expire in within the next several years. As patents expire, or are allowed to lapse, the products and processes described and claimed in those patents become generally available for use by the public. We believe that the expiration of any single patent or family of patents that is scheduled to expire in the next 3 years would not materially adversely affect our business or financial results. We believe that our trade secrets relating to manufacturing and other processes used in connection with products to which expiring patents relate will continue to provide us with a competitive advantage after the expiration of these patents.
We use trademarks as a means of differentiating our products. We protect our trademarks against infringement where we deem appropriate.
Dow has either transferred to us or granted perpetual, royalty-free licenses to us to use Dow’s intellectual property that was used by Dow to operate the Styron business prior to the Acquisition. Such intellectual property includes certain processes, compositions and apparatus used in the manufacture of our products. In addition to our license rights to use Dow’s intellectual property related to the Styron business, we have obtained licenses to use Dow’s intellectual property to the extent necessary to perform our obligations under the contracts transferred to us in the Acquisition and to use such intellectual property (other than patents) for products outside of the Styron business as it was conducted by Dow prior to the Acquisition, subject to certain limitations. While we believe our license rights with respect to Dow’s intellectual property are sufficient to allow us to operate our current business, new growth opportunities in latex and, to a lesser extent, plastics involving new products may fall outside of our license rights with Dow. Therefore, our ability to develop new products may be impacted by intellectual property rights that have not been licensed to us by Dow. We have the right, with Dow’s cooperation, to directly enforce the patents that are exclusively licensed to us by Dow where infringement is primarily within the scope of our business but nothing obligates Dow to enforce against third parties the intellectual property rights of Dow that are licensed to us on a non-exclusive basis or where the infringement is primarily outside the scope of our business.
Environmental and Other Regulation
Obtaining, producing and distributing many of our products involve the use, storage, transportation and disposal of toxic and hazardous materials. We are subject to extensive, evolving and increasingly stringent national and local environmental laws and regulations, which address, among other things, the following:
| • | emissions to the air; |
26
Table of Contents
| • | discharges to soils and surface and subsurface waters; |
| • | other releases into the environment; |
| • | prevention, remediation or abatement of releases of hazardous materials into the indoor or outdoor environment; |
| • | generation, handling, storage, transportation, treatment and disposal of waste materials; |
| • | maintenance of safe conditions in the workplace; |
| • | registration and evaluation of chemicals; |
| • | production, handling, labeling or use of chemicals used or produced by us; and |
| • | stewardship of products after manufacture. |
Some of our products are also subject to food contact regulations.
We maintain policies and procedures to monitor and control environmental, health and safety risks, and to monitor compliance with applicable state, national, and international environmental, health and safety requirements. We have a strong environmental, health and safety organization. Our environmental, health and safety compliance and management programs benefit from access to certain of Dow’s programs. We are also committed to the American Chemistry Council Responsible Care® Guiding Principles for our global facilities and received third party certification of our Responsible Care® Management System in 2013. We have a staff of professionals who are responsible for environmental health, safety and product regulatory compliance. Additionally, we have services agreements with Dow to provide environmental, health and safety services for certain of our facilities. We have implemented a corporate audit program for all of our facilities. However, we cannot provide assurance that we will at all times be in full compliance with all applicable environmental laws and regulations. We expect that stringent environmental regulations will continue to be imposed on us and our industry in general.
In 2011, the National Toxicology Program, or NTP, classified styrene as “reasonably anticipated to be a human carcinogen”. However, based on current EU classifications and the current draft risk assessment report, the styrene monomer is considered to have low toxicity and is not classified as a carcinogen or mutagen in the EU Nations. We have not seen a significant shift in customer demand away from styrenics products due to this NTP classification. We believe that there are no simple substitutes for our products that can deliver the same performance, quality, safety and cost effectiveness as the current set of products our customers buy from us.
Additionally, in January 2013, the California Environmental Protection Agency Office of Environmental Health Hazard Assessment provided notice of proposed rulemaking to adopt a Proposition 65 Maximum Allowable Dose Level of 290 micrograms per day for exposures to BPA based upon authoritative bodies listing mechanism “as known to cause reproductive toxicity.” One of our trade associations, the American Chemistry Council, secured a preliminary injunction against this listing. However, even if the listing eventually stands, the levels of BPA in our products are well below this Maximum Allowable Dose Level, and we do not expect this listing will have a material impact on our products or manufacturing operations.
We have actively responded through direct communication to our customers and employees to address perceptions and concerns regarding the safety and environmental impact of our products. Our industry trade associations, the Styrene Information and Research Center and the American Chemistry Council, as well as many of our customers are also active through political advocacy, media relations, legal action, and scientific and regulatory activities.
Similarly, we remain active in our trade associations, which are engaged to respond to potential health concerns involving BPA, Styrene and other chemicals used in our manufacturing processes.
27
Table of Contents
Sustainability and Climate Change
We track our greenhouse gas emissions and recently have completed a project that improved the quality and uniformity of the data we collect so that meaningful emission reduction goals and objectives can be developed and implemented by us. Our July 2013 Sustainability and Corporate Social Responsibility Report provides our most recent sustainability highlights which includes for 2012, a seven percent reduction in greenhouse gas emissions from our operations (scope 1), a four percent reduction in electricity use, a 25 percent reduction in volatile organic compound emissions, and a 34 percent reduction in waste, all as compared to the previous year. The report also profiles how our products help our customers improve their own sustainability in areas such as LED lighting, green tires, building insulation, smart meters, life-saving medical devices, and lighter weight.
Chemical Registration
The goal of the U.S. Toxic Substances Control Act (“TSCA”) is to prevent unreasonable risks of injury to health or the environment associated with the manufacture, processing, distribution in commerce, use, or disposal of chemical substances. Under the TSCA, the Environmental Protection Agency has established reporting, record-keeping, testing and control-related requirements for new and existing chemicals. During the past several years, efforts have been underway to reform the TSCA and various legislative initiatives have been introduced most recently the Safe Chemicals Act of 2013 and the Chemical Safety Improvement Act. We actively monitor the progress of these and other legislative developments.
Registration, Evaluation, and Authorization of Chemicals (“REACH”) is the regulatory system for chemicals management in the EU. It requires EU manufacturers and importers to disclose information on the properties of their substances that meet certain volume or toxicological criteria and register the information in a central database to be maintained by the European Chemicals Agency. We have completed the REACH requirements for registration of high-volume and high- hazard substances that we manufacture in or import into Europe and we are currently on track to complete the remaining implementation requirements by the deadline in 2018. Other jurisdictions have enacted legislation similar to REACH. We do not expect that the costs to comply with REACH and similar requirements will be material to our operations and consolidated financial position. We currently do not expect to need to register additional chemicals under REACH until 2018, at which time we will be required to register our low volume chemicals.
Environmental Proceedings
Prior to our separation from Dow, the EPA conducted a multimedia investigation at Dow’s Midland, Michigan sites, including the ABS site that we now operate. The investigation uncovered a number of alleged violations, including of the Clean Air Act’s leak detection and repair program (“LDAR”). LDAR requires chemical and petroleum companies to control fugitive (i.e., non-point source) emissions of hazardous air pollutants that occur from valves, pumps, flanges, connectors and other piping components. We, Dow and the United States executed a consent decree, which was approved by the District Court in Michigan in 2011. The decree provides that Dow will implement an enhanced LDAR program at our ABS facility over a five year period, which is intended to further reduce fugitive emissions at the ABS facility. We are not a defendant in the action, but under the decree, we or any future owner of the affected equipment will be responsible for performing an enhanced LDAR program at the ABS facility should Dow fail to perform. Dow’s failure to perform would subject it to significant stipulated penalties. An implementation agreement has been negotiated between us and Dow, which provides that Dow will bear the costs of the enhanced LDAR program.
Environmental Remediation
Environmental laws and regulations require mitigation or remediation of the effects of the disposal or release of chemical substances. Under some of these regulations, as the current owner or operator of a property, we could be held liable for the costs of removal or remediation of hazardous substances on or under the property, without regard to whether we knew of or caused the contamination, and regardless of whether the practices that
28
Table of Contents
resulted in the contamination were permitted at the time they occurred. At our Allyn’s Point, Connecticut property we lease a portion of the property to our joint venture, Americas Styrenics, for its operations, which includes a regulated hazardous waste boiler. Potential liabilities resulting from our owner status are addressed through financial assurance mechanisms and other agreements. Many of our production sites have an extended history of industrial use, and it is impossible to predict precisely what effect these laws and regulations will have on us in the future. Soil and groundwater contamination has occurred at some of the sites, and might occur or be discovered at other sites. Subject to certain monetary and temporal limitations, Dow is obligated to indemnify and hold us harmless with respect to releases of hazardous material that existed at our sites prior to our separation from Dow in June 2010. However, we cannot be certain that Dow will fully honor the indemnity or that the indemnity will be sufficient to satisfy all claims that we may incur. In addition, we face the risk that future claims might fall outside of the scope of the indemnity, particularly if we experience a release of hazardous materials that occurs in the future or at any time after our separation from Dow. Except for minor monitoring activities that we are performing in Livorno, Italy pursuant to an agreement with Dow, we do not currently have any material obligations to perform environmental remediation on our properties, and any active remedial projects on our properties are being performed by Dow pursuant to its indemnification obligations or for any Superfund sites.
Environmental Programs
We have comprehensive environmental, health and safety compliance, auditing and management programs in place to assist in our compliance with applicable regulatory requirements and with internal policies and procedures, as appropriate. We use Dow’s environmental health and safety programs, including a management system, as a cornerstone of our programs and have contracts in place with Dow for the use of their environmental, health and safety expertise. Each facility has developed and implemented specific critical occupational health, safety, environmental, security and loss control programs. We participate in the chemical industry’s Responsible Care® initiative and have implemented a number of environmental and quality management systems at our facilities. In addition to Responsible Care® Management System certification, as of March 1, 2014 the majority of our sites have received ISO 14001 environmental management system certifications. Additionally, our German facilities have received ISO 50001 energy management system certifications.
We also have implemented an environmental, health and safety (“EH&S”) organizational structure with executive committee level leadership and dedicated environmental experts. We have an EH&S leader at each of our manufacturing sites who is responsible for environmental, health and safety matters at that site. We also have corporate, regional and facility EH&S leaders, as well as a Product Stewardship Organization that manages day-to-day EH&S issues related to our products and customers. Our Process Safety Organization is dedicated to reducing and eliminating process safety incidents.
Facility Security
We recognize the importance of security and safety to our employees and the community. Physical security measures have been combined with process safety measures (including the use of technology), and emergency response preparedness into an integrated security plan. We have conducted vulnerability assessments at our operating facilities in the U.S. and high priority sites worldwide and identified and implemented appropriate measures to protect these facilities from physical and cyber-attacks.
In June 2008, the U.S. Department of Homeland Security (“DHS”) identified those facilities that were preliminarily determined to be covered by DHS rules regarding risk-based performance standards for the security of U.S. chemical facilities. Our facilities that were preliminarily determined to be covered conducted and submitted security vulnerability assessments to DHS or have otherwise complied with DHS requirements. Effort and resources in assessing security vulnerabilities and taking steps to reinforce security at our chemical manufacturing facilities will continue to be required to comply with DHS requirements.
29
Table of Contents
Employees
As of December 31, 2013, we had 2,123 full-time employees worldwide. Nearly 88% of our personnel are located at the various manufacturing sites, research and development, pilot coating, paper fabrication and testing and technology centers. The remaining employees are located at operating centers, virtual locations or geographically dispersed marketing and sales locations. Our Midland, Michigan site is the only U.S. facility with union representation for its approximately 55 hourly operations personnel. Other locations with union or work council representation include Altona, Australia; Limao, Brazil; Hamina, Finland; Norrkoping, Sweden; Livorno, Italy; and Schkopau, Boehlen, and Stade, Germany for a total of approximately 600 union represented personnel as of December 31, 2013. Approximately 85% of our employees in Asia Pacific and Europe are represented by work councils or other labor organizations. We consider relations with our personnel and the various labor organizations to be good. There have been no labor strikes or work stoppages in these locations in recent history.
The following table provides a breakdown of the number of our employees by job function and geographic area as of December 31, 2013.
| Europe | Latin America |
North America |
Asia Pacific |
Total | ||||||||||||||||
| Manufacturing and Engineering |
952 | 77 | 147 | 178 | 1,354 | |||||||||||||||
| Sales & Marketing |
55 | 8 | 22 | 31 | 116 | |||||||||||||||
| Research and Development |
116 | 8 | 39 | 25 | 188 | |||||||||||||||
| Supply Chain |
68 | 8 | 7 | 33 | 116 | |||||||||||||||
| Customer Service |
38 | 3 | 10 | 16 | 67 | |||||||||||||||
| EH&S |
18 | 0 | 7 | 3 | 28 | |||||||||||||||
| Business Administration-HR-Public Affairs |
57 | 8 | 48 | 33 | 146 | |||||||||||||||
| Finance |
37 | 6 | 38 | 27 | 108 | |||||||||||||||
|
|
|
|
|
|
|
|
|
|
|
|||||||||||
| Total |
1,341 | 118 | 318 | 346 | 2,123 | |||||||||||||||
| Item 1A. | Risk Factors |
Dow provides significant operating and other services, and certain raw materials used in the production of our products, under agreements that are important to our business. The failure of Dow to perform their obligations, or the termination of these agreements, could adversely affect our operations.
Prior to June 17, 2010, we were operated by Dow, which has provided and continues to provide services under certain agreements that are important to our business. For the years ended December 31, 2013 and 2012, purchases from and other charges paid to Dow and its affiliated companies (excluding under the SAR MOSA AR MOD5 Agreement, and site services agreements) were approximately $2,030.3 million and $2,334.2 million, respectively. For the years ended December 31, 2013 and 2012, sales to Dow and its affiliated companies were approximately $294.7 million and $311.4 million, respectively. For the years ended December 31, 2013 and 2012, we incurred expenses totaling $306.2 million and $320.5 million, respectively, under the SAR MOSA, AR MOD5 Agreement, and site services agreements, including $235.1 million and $214.5 million, respectively, for both the variable and fixed cost components of the site service agreements and $71.1 million and $106.0 million, respectively, covering the other two agreements.
We are a party to:
| • | an outsourcing service agreement pursuant to which Dow provides certain administrative and business services to us for our operations; |
| • | supply and sales agreements pursuant to which Dow, among other things, provides us with raw materials, including ethylene, benzene, butadiene and bisphenol A, or BPA; |
| • | a contract manufacturing agreement pursuant to which Dow operates and maintains one of its Freeport, Texas facilities to produce PC products for us; and |
30
Table of Contents
| • | an operating services agreement pursuant to which Dow will operate and maintain certain of our facilities at Rheinmunster, Germany as well as employ and provide almost all of the staff for this facility. |
Under the terms of the above agreements, either party is permitted to terminate the applicable agreement in a variety of situations, including in the event of the other party’s uncured material breach, insolvency, change of control or cessation of operations. Should Dow fail to provide these services or raw materials, or should any of the above agreements be terminated, we would be forced to obtain these services and raw materials from third parties or provide them ourselves. Additionally, if Dow terminates agreements pursuant to which we are obligated to provide certain services, we may lose the fees received by us under these agreements. The failure of Dow to perform its obligations under, or the termination of, any of these contracts could adversely affect our operations and, depending on market conditions at the time of any such termination, we may not be able to enter into substitute arrangements in a timely manner, or on terms as favorable to us.
We are party to certain license agreements with Dow relating to intellectual property that is essential to our business. Because of this relationship, we may have limited ability to expand our use of certain intellectual property beyond the field of the license, or to police infringement that may be harmful to our business.
In connection with the Acquisition, we acquired ownership of, or in some cases, a worldwide right and license to use, certain patents, patent applications and other intellectual property of Dow that were used by Dow to operate our business segments or held by Dow primarily for the benefit of our business segments, prior to the Acquisition. Generally, we acquired ownership of the intellectual property that was primarily used in our business segments and acquired a license to a more limited set of intellectual property that had broader application within Dow beyond our core business segments. Our license from Dow is perpetual, irrevocable, fully paid, and royalty-free. Furthermore, our license from Dow is exclusive within our business segments for certain patents and patent applications that were used by Dow primarily in the Styron business prior to the Acquisition, subject to licenses previously granted by Dow, and to certain retained rights of Dow, including Dow’s retained right to use patents and patent applications outside of our business segments and for internal consumption by Dow. Our license from Dow relates to polymeric compositions, manufacturing processes and end applications for the polymeric compositions; and is limited to use in defined areas corresponding to our current business segments excluding certain products and end-use application technology retained by Dow. Our ability to develop, manufacture or sell products and technology outside of these defined areas may be impeded by the intellectual property rights that have been retained by Dow, which could adversely affect our business, financial condition and results of operations. Additionally, we may not be able to enforce, and Dow may be unwilling to enforce, this intellectual property that has been retained by Dow where infringement could also impact our business and competitive position.
Our substantial level of indebtedness could adversely affect our financial condition.
We have substantial indebtedness, which, as of December 31, 2013, totaled approximately $1,336.4 million, consisting principally of our 8.750% Senior Secured Notes due 2019, which we refer to as our Senior Notes. On June 17, 2010, we entered into a senior secured credit facility, which we refer to as our Senior Secured Credit Facility, and which included a term loan facility and a revolving credit facility, which we refer to as our Revolving Facility. We repaid all outstanding amounts under the term loan facility in connection with the issuance of our Senior Notes. In January 2013, the Company increased its revolving credit facility borrowing capacity from $240 million to $300 million. As of December 31, 2013, we had no borrowings under our Revolving Facility and $7.3 million in undrawn letters of credit. We are also party to an agreement for an accounts receivable securitization facility, for up to a total of $200.0 million in borrowings. As of December 31, 2013, there was approximately $143.8 million of accounts receivable available to support this facility, based on our pool of eligible accounts receivable and there were no outstanding borrowings. We are also party to a short-term revolving credit facility through our subsidiary in China that provides for approximately $15.0 million of uncommitted funds available for borrowings. Outstanding borrowings under this revolving credit facility were $5.1 million as of December 31, 2013. Our high level of indebtedness could have important consequences, including,
31
Table of Contents
| • | impairing our ability to obtain additional financing for working capital, capital expenditures, debt service requirements or other general corporate purposes; |
| • | requiring that a substantial portion of our cash flow be used for debt service payments instead of other purposes, thereby reducing the amount of cash flow available for working capital, capital expenditures, acquisitions and other general corporate purposes; |
| • | increasing our vulnerability to economic downturns and adverse industry conditions; |
| • | compromising our flexibility to capitalize on business opportunities and to react to competitive pressures, as compared to our competitors; |
| • | placing us at a disadvantage compared to other, less leveraged competitors or competitors with comparable debt at more favorable interest rates; and |
| • | increasing our cost of borrowing. |
In addition, a substantial portion of our current indebtedness is secured by substantially all of our assets, which may make it more difficult to secure additional borrowings at reasonable costs. If we default or declare bankruptcy, after these obligations are met, there may not be sufficient funds or assets to satisfy our subordinate interests, including those of our shareholders.
The terms of our indebtedness restrict our current and future operations, particularly our ability to respond to change or to take certain actions.
Our indenture and the agreement governing our Senior Secured Credit Facility contain a number of covenants imposing significant restrictions on our business. These restrictions may affect our ability to operate our business and may limit our ability to take advantage of business opportunities. These agreements restrict, among other things, our ability to:
| • | sell assets; |
| • | incur additional indebtedness or issue certain preferred stock or similar equity interests; |
| • | pay dividends; |
| • | make investments or acquisitions; |
| • | incur liens; |
| • | repurchase or redeem capital stock; |
| • | engage in mergers or consolidations; |
| • | materially alter the business we conduct; |
| • | engage in transactions with affiliates; and |
| • | consolidate, merge or transfer all or substantially all of our assets. |
The ability for us to comply with the covenants and financial ratios and tests contained in our indenture and senior credit agreement, to pay interest on indebtedness, fund working capital, and make anticipated capital expenditures depends on our future performance, which is subject to general economic conditions and other factors, some of which are beyond our control. There can be no assurance that our business will generate sufficient cash flow from operations or that future borrowings will be available under our Senior Secured Credit Facility to fund liquidity needs in an amount sufficient to enable us to service indebtedness. Furthermore, if we need additional capital for general corporate purposes or to execute on an expansion strategy, there can be no assurance that this capital will be available on satisfactory terms or at all.
32
Table of Contents
A failure to repay amounts owed under the Revolving Facility or Senior Notes at maturity would result in a default. In addition, a breach of any of the covenants in the Revolving Facility or the indenture governing our Senior Notes or our inability to comply with the required financial ratios or limits could result in a default. If a default occurs, our lenders could refuse to lend us additional funds and our lenders or noteholders could declare all of our debt and any accrued interest and fees immediately due and payable. A default under one of our debt agreements may trigger a cross-default under our other debt agreements.
To service our indebtedness, we will require a significant amount of cash. If we are unable to execute on our business strategy and generate significant cash flow, we may be unable to service our indebtedness and repay in full the notes at maturity.
To service our indebtedness, we will require a significant amount of cash. Our ability to generate cash flow and service our debt obligations will depend upon, among other things, our future financial condition and operating performance. These factors depend partly on economic, financial, competitive conditions and on certain financial, business, legislative, regulatory and other factors beyond our control. We may not be able to generate sufficient cash from operations to meet our debt service obligations as well as fund necessary capital expenditures.
If our cash flows and capital resources are insufficient to fund our debt service obligations, we could face substantial liquidity problems and could be forced to reduce or delay investments and capital expenditures or to dispose of material assets or operations, seek additional debt or equity capital or restructure or refinance our indebtedness. We may not be able to effect any such alternative measures on commercially reasonable terms or at all, and, even if successful, those alternative actions may not allow us to meet our scheduled debt service obligations. The Senior Secured Credit Facility and the indenture governing our Senior Notes restrict our ability to dispose of assets and the use of proceeds from those dispositions and may also restrict our ability to raise debt or equity capital to be used to repay other indebtedness when it becomes due. We may not be able to consummate those dispositions or to obtain proceeds in an amount sufficient to meet any debt service obligations then due.
As of December 31, 2013, we had cash and cash equivalents of approximately $196.5 million. If we are unable to meet our debt service obligations under the Senior Notes, the holders of the Senior Notes would have the right following a cure period to cause the entire principal amount of the notes to become immediately due and payable.
Despite our current levels of indebtedness, we may incur substantially more debt, which could further exacerbate the risks associated with our substantial indebtedness.
Although the Senior Secured Credit Facility and the indenture governing our Senior Notes contain restrictions on the incurrence of additional indebtedness, these restrictions are subject to a number of qualifications and exceptions and the indebtedness incurred in compliance with these restrictions could be substantial. Also, we are not prevented from incurring obligations that do not constitute “indebtedness” as defined in the Senior Secured Credit Facility or the indenture, such as operating leases and trade payables. If new debt is added to our current debt levels, the risks related to our substantial indebtedness that we now face could intensify.
Our joint ventures may not operate according to their business plans if we or our partners fail to fulfill our or their obligations, or differences in views among our joint venture partners result in delayed decisions, which may adversely affect our results of operations and may force us to dedicate additional resources to these joint ventures.
We currently participate in a number of joint ventures and may enter into additional joint ventures in the future. The nature of a joint venture requires us to share control with unaffiliated third parties. If our joint venture partners do not fulfill their obligations, the affected joint venture may not be able to operate according to its business plan. In that case, our results of operations may be adversely affected and we may be required to increase the level of our commitment to the joint venture.
33
Table of Contents
Differences in views among joint venture participants and our inability to unilaterally implement sales and productions strategies or determine cash distributions from our joint ventures may significantly impact short- term and longer term financial results, financial condition and the value of our ordinary shares.
Regulatory and statutory changes applicable to our raw materials and products and our customers’ products could require material expenditures, changes in our operations and could adversely affect our financial condition and results of operations.
Changes in environmental, health and safety regulations, in jurisdictions where we manufacture and sell our products, could lead to a decrease in demand for our products. In addition to changes in regulations, health and safety concerns could increase the costs incurred by our customers to use our products and otherwise limit the use of these products, which could lead to decreased demand for these products. Such a decrease in demand likely would have an adverse effect on our business and results of operation. Materials such as acrylonitrile, ethylbenzene, styrene, butadiene, BPA and halogenated flame retardant are used in the manufacturing of our products and have come under increased regulatory scrutiny due to potentially significant or perceived health and safety concerns.
The federal Toxic Substances Control Act, or the TSCA, is the primary law in the U.S. governing the manufacture, processing, use and distribution of our chemicals. Among other things, under TSCA, the EPA has the authority to (i) require testing of chemicals that may present an unreasonable risk of injury to health or the environment or are produced in substantial quantities, (ii) undertake pre-market review of, and impose restrictions as appropriate on, new chemicals prior to their commercial production and introduction into the marketplace, (iii) limit or prohibit the manufacture, use, distribution and disposal of existing substances, (iv) impose reporting and record keeping requirements to ensure continued access to new information on chemical substances, and (v) oversee export and import notice requirements. Other chemical control regimes are in effect in the European Union through its REACH and other laws. These regulatory regimes currently require significant compliance expenditures by us, and changes applicable to our raw materials and products or our customers’ products could require significant additional expenditures by us, or changes in our operations.
Our products are also used in a variety of end-uses that have specific regulatory requirements such as those relating to products that have contact with food or medical device end-uses. We and many of the applications for the products in the end markets in which we sell our products are regulated by various national and local rules, laws and regulations, such as the TSCA. Changes in regulations could result in additional compliance costs, seizures, confiscations, recall or monetary fines, any of which could prevent or inhibit the development, distribution and sale of our products. Changes in environmental and safety laws and regulations banning or restricting the use of these residual materials in our products, or our customers’ products, could adversely affect our results of operations and adversely affect our financial condition. Failure to appropriately manage safety, human health, product liability and environmental risks associated with our products, product life cycles and production processes could adversely impact employees, communities, stakeholders, our reputation and the results of our operations.
We may be subject to losses due to liabilities or lawsuits related to contaminated land we own or operate or arising out of environmental damage or personal injuries associated with exposure to chemicals or the release of chemicals.
The Comprehensive Environmental Response, Compensation and Liability Act, or CERCLA, and analogous state and foreign laws are designed to address the problems associated with contaminated land, especially inactive and abandoned hazardous waste sites listed on the “National Priorities List”, or NPL. Under CERCLA and similar statutes, the current or former owner or operator of a property contaminated by hazardous substance releases is subject to strict, unlimited, joint, several and retroactive liability for the investigation and remediation of the property, and also may be liable for natural resource damages associated with the releases. There are several properties which we now own on which Dow has been conducting remediation to address historical contamination. Those properties include Allyn’s Point, Connecticut; Dalton, Georgia; Livorno, Italy; and Guaruja, Brazil. There are
34
Table of Contents
other properties with historical contamination that are owned by Dow that we lease for our operations, including our facility in Midland, Michigan. While we did not assume the liabilities associated with these properties in the U.S., because CERCLA and similar laws can impose liability for contamination on the current owner or operator of a property, even if it did not create the contamination, there is a possibility that a governmental authority or private party could seek to include us in an action or claim for remediation or damages, even though the contamination may have occurred prior to our ownership or occupancy. While Dow has agreed to indemnify us for liability for releases of hazardous materials that occurred prior to our separation from Dow, the indemnity is subject to monetary and temporal limitations, and we cannot be certain that Dow will fully honor the indemnity or that the indemnity will be sufficient to satisfy all claims that we may incur. In addition, we face the risk that future claims might fall partially or fully outside of the scope of the indemnity, particularly if there is a release of hazardous materials that occurs in the future or at any time after the closing of the Acquisition or if the condition requiring remediation is attributable to a combination of events or operations occurring prior to and after the closing of the Acquisition.
The environmental liabilities at a particular site could increase as a result of, among other things, changes in laws and regulations, modifications to the site’s investigation and remediation plans, unanticipated construction problems, identification of additional areas or quantities of contamination, increases in labor, equipment and technology costs, significant changes in the financial condition of Dow or other responsible parties and the outcome of any related legal and administrative proceedings to which we may become a party. Any increase in liability may be outside the scope of the indemnity provided by Dow, resulting in increased costs payable by us. It is not possible for us to reasonably estimate the amount and timing of all future expenditures related to environmental or other contingent matters. Accruals for environmental matters are recorded by us when it is probable that a liability has been incurred and the amount of the liability can be reasonably estimated based on current law and existing technologies.
In addition, we face the risk that individuals could seek damages for personal injury due to exposure to chemicals at our facilities, chemicals that have been released from our facilities, chemicals otherwise owned or controlled by us, or chemicals that allegedly migrated from products containing our materials. Risks are inherent in the chemical business, particularly risks associated with safety, health and the environment. The U.S. Environmental Protection Agency’s (“EPA”) Risk Management Program (“RMP”) requires facilities that produce, handle, process, distribute or store certain highly hazardous chemicals to develop a risk management plan and program in the event of an accidental release of such chemicals. RMP also requires facilities to assess potential impacts to off-site populations in the event of a credible worst-case release and to document the policies, procedures, equipment and work practices in place to mitigate identified risks. Similar risk management requirements are imposed under the Emergency Planning and Community Right-to-Know Act, which contains chemical emergency response planning, accident release and other reporting and notification requirements applicable to our facility. In addition, we are subject to the Occupational Safety and Health Administration Process Safety Management standard, which requires development of a program to manage workplace risks associated with highly hazardous chemicals. Similar laws apply to many of our international facilities. Failure to comply with such laws could subject us to both civil and criminal penalties, which could affect our product sales, reputation and profitability. We may be subject to claims with respect to workplace exposure, workers’ compensation and other health and safety matters.
Volatility in the cost of the raw materials utilized for our products or disruption in the supply of the raw materials may adversely affect our financial condition and results of operations.
Our results of operations can be directly affected positively and negatively by volatility in the cost of our raw materials, which are subject to global supply and demand and other factors beyond our control. Our principal raw materials (benzene, ethylene, butadiene, BPA and styrene) together represent approximately 75% of our total cost of goods sold. Volatility in the cost of these raw materials makes it more challenging to manage pricing and pass the increases on to our customers in a timely manner. We believe that rapid changes in pricing also can affect the volume our customers consume. As a result, our gross profit and margins could be adversely affected.
35
Table of Contents
Styrene, a principal raw material purchased and produced by us, is used in the production of polystyrene, ABS, SAN, SB latex and our rubber products and, like its principal raw materials, ethylene and benzene, is subject to a volatile market. The wider the styrene to benzene and ethylene spread, with styrene more than benzene and ethylene, the more profitable it is to produce styrene. In 2013, the market experienced a favorable benzene over ethylene spread but that condition is subject to fluctuations.
Crude oil prices also impact our raw material costs. Generally, higher crude oil prices lead to higher costs of raw materials, although some raw materials are impacted less than others.
Market volatility also impacts our accounting for our inventories. We use either our cost to us or market price, whichever is lower, with cost being determined on the first-in, first-out (“FIFO”) method. As a result, in periods of rapidly declining cost of inventories, the FIFO impact on our reported earnings may be negative. Similarly, in periods of rapidly increasing cost of inventories, the effects of the FIFO method could skew our results of operations, causing them to appear more positive than the actual results.
If the availability of any of our principal raw materials is limited, we may be unable to produce some of our products in the quantities demanded by our customers, which could have an adverse effect on plant utilization and our sales of products requiring such raw materials.
Butadiene prices have been highly volatile over the past three years. In some cases, market participants have had difficulty securing their supply. While butadiene supply over the past year has not been limited, this trend could reverse with increases in rubber demand.
Suppliers may have temporary limitations preventing them from meeting our butadiene requirements, and we may not be able to obtain substitute supplies of butadiene from alternative suppliers in a timely manner or on favorable terms. The quantity of butadiene available in any one region is dependent on the raw material inputs and operating rates of the ethylene crackers. Raw material inputs to the crackers (either ethane or naphtha) depend on the flexibility of the cracker to use various feeds and the economics of the available raw materials.
In June 2010, we entered into long-term supply agreements (5 to 10 years) with Dow for ethylene, benzene, butadiene, BPA and other raw materials amounting to approximately 45% to 50% of our raw materials (based on aggregate purchase price). The remainder is purchased via other third-party suppliers on a global basis. As our Dow contracts and other third party contracts expire, we may be unable to renew these contracts or obtain new long-term supply agreements on terms comparable or favorable to us, depending on market conditions, which may significantly impact our operations.
In addition, many of our long-term contracts contain provisions that allow our suppliers to limit the amount of raw materials shipped to us below the contracted amount in force majeure circumstances. If we are required to obtain alternate sources for raw materials because Dow or any other supplier is unwilling or unable to perform under raw material supply agreements or if a supplier terminates its agreements with us, we may not be able to obtain these raw materials from alternative suppliers in a timely manner or be able to enter into long-term supply agreements on terms comparable or favorable to us.
Hazards associated with chemical manufacturing could adversely affect our operations.
Due to the nature of our business, we are exposed to the hazards associated with chemical manufacturing and the related storage and transportation of raw materials, products and wastes. These hazards could lead to an interruption or suspension of operations and have an adverse effect on the productivity and profitability of a particular manufacturing facility or on us as a whole. Potential hazards include the following: piping or storage tank leaks and ruptures; mechanical failures; employee exposure to hazardous substances; and chemical spills and other discharges or releases of toxic or hazardous substances or gases. There is also a risk that one or more of our key raw materials or one or more of our products may be found to have currently unrecognized toxicological or health-related impact on the environment or on our customers or employees. Such hazards may cause personal
36
Table of Contents
injury and loss of life, damage to property and contamination of the environment, which could lead to government fines or work stoppage injunctions and lawsuits by injured persons. If such actions are determined to be adverse to us, we may have inadequate insurance to cover such claims, or we may have insufficient cash flow to pay for such claims. Such outcomes could adversely affect our financial condition and results of operations.
Our end markets are highly competitive, and we may lose market share to other producers of styrene-based chemical products or to producers of other products that can be substituted for our products.
Our industry is highly competitive and we face significant competition from large international producers, as well as from smaller regional competitors. Our most significant competitors include BASF Group, Zeon Corporation, LG Chem Ltd, Wacker Chemie AG, Bayer MaterialScience AG, Lanxess AG, Saudi Basic Industries Corporation, Styrolution Group GmbH, Total S.A. and Versalis S.p.A. Competition is based on a number of factors, such as product quality, service and price. Our competitors may improve their competitive position in our core end-use markets by successfully introducing new products, improving their manufacturing processes or expanding their capacity or manufacturing facilities. In addition, while we benefited in 2013 from the general decline of the Butadiene price, the price of Styrene, one of our principal SB latex raw materials, generally rose. This may enable other latex manufacturers who, like us, are offering products made with different chemistries using less expensive raw materials, such as VAM-based latex and natural binders, to improve their positions. The long-term impact of the competition from these products, in particular relative to natural binders, is unclear. Some of our competitors may be able to drive down prices for our products if their costs are lower than our costs. Some of our competitors’ financial, technological and other resources may be greater than our resources and such competitors may be better able to withstand changes in market condition. Our competitors may be able to respond more quickly than we can to new or emerging technologies or changes in customer requirements. If we are unable to keep pace with our competitors’ product and manufacturing process innovations, our financial condition and results of operations could be materially adversely affected.
Competition between styrene-based chemical products and other products within the end markets in which we compete is intense. Increased competition from existing or newly developed products may reduce demand for our products in the future and our customers may decide on alternate sources to meet their requirements.
In addition, consolidation of our competitors or customers may result in reduced demand for our products or make it more difficult for us to compete with our competitors. If we are unable to successfully compete with other producers of styrene-based chemical products or if other products can be successfully substituted for our products, our sales may decline.
Compliance with extensive and evolving environmental, health and safety laws may require substantial expenditures.
We use large quantities of hazardous substances, generate hazardous wastes and emit wastewater and air pollutants in our manufacturing operations. Consequently, our operations are subject to extensive environmental, health and safety laws and regulations at both the national and local level in multiple jurisdictions. Many of these laws and regulations have become more stringent over time and the costs of compliance with these requirements may increase, including costs associated with any capital investments for pollution control facilities. In addition, our production facilities require operating permits that are subject to periodic renewal and, in circumstances of noncompliance, may be subject to revocation. The necessary permits may not be issued or continue in effect, and any issued permits may contain more stringent limitations that restrict our operations or that require further expenditures to meet the permit requirements.
This emerging focus on climate change in the U.S. and European Union could result in new, potentially diverging or inconsistent, environmental regulations that may negatively affect us. Additional future regulation of greenhouse gases in the U.S. could occur pursuant to future international treaty obligations, regulatory changes under the federal Clean Air Act or other existing legislation, federal, state or regional adoption of greenhouse gas regulatory schemes, or any combination of the foregoing or otherwise. This could cause us to incur additional costs in complying with any new regulations, which may adversely impact our operations and financial condition.
37
Table of Contents
For example, in the United States, the U.S. Environmental Protection Agency, or EPA, has moved forward on requirements for new air emission regulations covering greenhouse gas emissions from large sources. European plants that manufacture “organic commodity chemicals” with a capacity of over 100 metric tons per day are required to participate in the European Trading Scheme for Greenhouse gases, and the German greenhouse gas trading program is costly to implement at certain German facilities.
Compliance with more stringent environmental requirements would likely increase our costs of transportation and storage of raw materials and finished products, as well as the costs of storage and disposal of wastes. Additionally, we may incur substantial costs, including penalties, fines, damages, criminal or civil sanctions and remediation costs, or experience interruptions in our operations for failure to comply with these laws or permit requirements.
Conditions in the global economy and capital markets may adversely affect our results of operations, financial condition and cash flows.
Our products are sold in markets that are sensitive to changes in general economic conditions, such as sales of automotive and construction products. Downturns in general economic conditions can cause fluctuations in demand for our products, product prices, volumes and margins. A decline in the demand for our products or a shift to lower-margin products due to deteriorating economic conditions could adversely affect sales of our products and our profitability and could also result in impairments of certain of our assets.
Our business and operating results were severely affected by the global recession beginning in 2008. We continue to be impacted by turbulence in the credit markets, dislocations in the housing and commercial real estate markets, fluctuating commodity prices, volatile exchange rates and other challenges currently affecting the global economy and our customers. Instability in financial and commodity markets throughout the world has caused, among other things, severely diminished liquidity and credit availability, rating downgrades of certain investments and declining valuations and pricing volatility of others, volatile energy and raw materials costs, geopolitical issues and failure and the potential failure of major financial institutions. In addition, the on-going sovereign debt crisis affecting various countries in the European Union is creating further uncertainties in the global credit markets. Deterioration in the financial and credit market heightens the risk of customer bankruptcies and delay in payment. We are unable to predict the duration of the current economic conditions or their effects on financial markets, our business and results of operations. If economic conditions further deteriorate, our results of operations, financial condition and cash flows could be materially adversely affected.
Production at our manufacturing facilities could be disrupted for a variety of reasons. Disruptions could expose us to significant losses or liabilities.
The hazards and risks of disruption associated with chemical manufacturing and the related storage and transportation of raw materials, products and wastes exist in our operations and the operations of other occupants with whom we share manufacturing sites. These potential risks of disruption include, but are not necessarily limited to:
| • | pipeline and storage tank leaks and ruptures; |
| • | explosions and fires; |
| • | inclement weather and natural disasters; |
| • | terrorist attacks; |
| • | failure of mechanical, process safety and pollution control equipment; |
| • | chemical spills and other discharges or releases of toxic or hazardous substances or gases; and |
| • | exposure to toxic chemicals. |
38
Table of Contents
These hazards could expose employees, customers, the community and others to toxic chemicals and other hazards, contaminate the environment, damage property, result in personal injury or death, lead to an interruption or suspension of operations, damage our reputation and adversely affect the productivity and profitability of a particular manufacturing facility or us as a whole, and result in the need for remediation, governmental enforcement, regulatory shutdowns, the imposition of government fines and penalties and claims brought by governmental entities or third parties. Legal claims and regulatory actions could subject us to both civil and criminal penalties, which could affect our product sales, reputation and profitability. We have comprehensive environmental, health and safety compliance and management systems to prevent potential risks and emergency response and crisis management plans in place to mitigate potential risks.
If disruptions occur, alternative facilities with sufficient capacity or capabilities may not be available, may cost substantially more or may take a significant time to start production. Each of these scenarios could negatively affect our business and financial performance. If one of our key manufacturing facilities is unable to produce our products for an extended period of time, our sales may be reduced by the shortfall caused by the disruption and we may not be able to meet our customers’ needs, which could cause them to seek other suppliers. Furthermore, to the extent a production disruption occurs at a manufacturing facility that has been operating at or near full capacity, the resulting shortage of our product could be particularly harmful because production at the manufacturing facility may not be able to reach levels achieved prior to the disruption.
Although we maintain property, business interruption, comprehensive general liability, environmental impairment liability and other insurance of the types and in the amounts that we believe are customary for the industry, we may not be fully insured against all potential causes of disruption due to limitations and exclusions in our policies. While the hazards associated with chemical manufacturing have not resulted in incidents that have significantly disrupted our operations or exposed us to significant losses or liabilities since the Acquisition, there can be no assurances we will not suffer such losses in the future.
Any increase in the cost of natural gas or electricity may adversely affect our results of operations.
We use natural gas and electricity to operate our facilities and generate heat and steam for our various manufacturing processes. Natural gas prices have experienced significant volatility in the past several years. Wide fluctuations in natural gas prices may result from relatively minor changes in supply and demand, market uncertainty, and other factors, both domestic and foreign, that are beyond our control. In addition, natural gas is often a substitute for petroleum-based energy supplies. Future increases in the price of petroleum (resulting from increased demand, political instability or other factors) may result in significant additional increases in the price of natural gas. In addition, electricity prices are generally affected by increases in the price of petroleum. Any increase in the cost of natural gas or electricity could have a material adverse impact on our financial condition and results of operations.
There is no assurance that we will be able to renew all necessary licenses, certificates, approvals and permits for our operations.
Our operation is subject to various licenses, certificates, approvals and permits in different foreign jurisdictions. There is no assurance that we will be able to renew our licenses, certificates, approvals and permits upon their expiration. The eligibility criteria for such license, certificates, approvals and permits may change from time to time and may become more stringent. In addition, new requirements for licenses, certificates, approvals and permits my come into effect in the future. The introduction of any new and/or more stringent laws, regulation, licenses, certificates, approvals and permits requirements relevant to our business operations may significantly escalate our compliance and maintenance costs or may preclude us to continue with our existing operation or may limit or prohibit us from expanding our business. Any such event may have an adverse effect to our business, financial results and future prospects.
39
Table of Contents
Failure to maintain an effective system of internal controls could adversely impact our ability to both timely and accurately report our financial results.
We have established and maintain internal controls necessary to provide reliable financial results and to assist in the effective prevention of fraud. We have experienced material weaknesses in our internal controls in prior years caused by inadequate internal staffing and skills and inadequate controls over our quarter-end closing processes partially related to our transition from Dow. We remediated our prior material weaknesses as of December 31, 2012 and have no newly identified material weaknesses as of December 31, 2013.
We continue to evaluate and enhance our internal controls over financial reporting, including with respect to our separation from Dow. However, we cannot assure you that any measures we have taken to date, or any measures we may take in the future, will be sufficient to avoid potential control deficiencies which could materially adversely affect our ability to comply with applicable financial reporting requirements.
Our business involves risk of exposure to product liability claims.
Even though we are generally a materials supplier rather than a manufacturer of finished goods, the development, manufacture and sales of specialty emulsion polymers and plastics by us involve inherent risks of exposure to product liability claims, product recalls and related adverse publicity. While we attempt to protect ourselves from such claims and exposures in our adherence to standards and specifications and contractual negotiations, there can be no assurance that our efforts in this regard will ultimately protect us from any such claims. For instance, a customer may attempt to seek contribution from us due to a product liability claim brought against them by a consumer, or a consumer may bring a product liability claim directly against us. A product liability claim or judgment against us could result in substantial and unexpected expenditures, affect consumer or customer confidence in our products, and divert management’s attention from other responsibilities. A successful product liability claim or series of claims against us in excess of our insurance coverage payments, for which we are not otherwise indemnified, could have a material adverse effect on our financial condition or results of operations.
The insurance that we maintain may not fully cover all potential exposures.
We maintain insurance typical of similarly situated companies in our industry but such insurance may not cover all risks associated with the operation of our business or our manufacturing process and the related use, storage and transportation of raw materials, products and wastes in or from our manufacturing sites or our distribution centers. While we have purchased what we deem to be adequate limits of coverage and broadly worded policies, our coverage is subject to limitations, including higher self-insured retentions or deductibles and maximum limits and liabilities covered. Notwithstanding diligent efforts to successfully procure specialty coverage for environmental liability and remediation, we may incur losses beyond the limits or outside the terms of coverage of our insurance policies, including liabilities for environmental remediation. In addition, from time to time, various types of insurance for companies in the specialty chemicals industry have not been available on commercially acceptable terms or, in some cases, at all. We are potentially at additional risk if one or more of our insurance carriers fail. Additionally, severe disruptions in the domestic and global financial markets could adversely impact the ratings and survival of some insurers. Future downgrades in the ratings of enough insurers could adversely impact both the availability of appropriate insurance coverage and its cost. In the future, we may not be able to obtain coverage at current levels, if at all, and our premiums may increase significantly on coverage that we maintain.
We are subject to customs, international trade, export control, antitrust, zoning and occupancy and labor and employment laws that could require us to modify our current business practices and incur increased costs.
We are subject to numerous regulations, including customs and international trade laws, export/import control laws, and associated regulations. These laws and regulations limit the countries in which we can do
40
Table of Contents
business; the persons or entities with whom we can do business; the products which we can buy or sell; and the terms under which we can do business, including anti-dumping restrictions. In addition, we are subject to antitrust laws and zoning and occupancy laws that regulate manufacturers generally and/or govern the importation, promotion and sale of our products, the operation of factories and warehouse facilities and our relationship with our customers, suppliers and competitors. If any of these laws or regulations were to change or were violated by our management, employees, suppliers, buying agents or trading companies, the costs of certain goods could increase, or we could experience delays in shipments of our goods, be subject to fines or penalties, or suffer reputational harm, which could reduce demand for our products and hurt our business and negatively impact results of operations. In addition, in some areas we benefit from certain trade protections, including anti-dumping protection and the European Union’s Authorized Economic Operator program, which provides expedited customs treatment for materials crossing national borders. If we were to lose these protections, our results of operations could be adversely affected.
In addition, changes in statutory minimum wage laws and other laws relating to employee benefits could cause us to incur additional wage and benefits costs, which could negatively impact our profitability.
Legal requirements are frequently changed and subject to interpretation, and we are unable to predict the ultimate cost of compliance with these requirements or their effects on our operations. We may be required to make significant expenditures or modify our business practices to comply with existing or future laws and regulations, which may increase our costs and materially limit our ability to operate our business.
We are dependent on the continued service and recruitment of key executives, the loss of any of whom could adversely affect our business.
Our performance is substantially dependent on the performance of our senior management team, including Christopher D. Pappas, our President and Chief Executive Officer and John A. Feenan, our Executive Vice President and Chief Financial Officer. We have entered into agreements with each member of our senior management team that restrict their ability to compete with us should they decide to leave our Company. Even though we have entered into these agreements, we cannot be sure that any member of our senior management team will remain with us, or that they will not seek to compete with us in the future. The loss of members of our senior management team or our inability to hire qualified management personnel in a timely manner could impair our ability to execute our business plan and growth strategy, cause us to lose customers and reduce revenue, or lead to employee morale problems and/or the loss of additional key employees.
Fluctuations in currency exchange rates may significantly impact our results of operations and may significantly affect the comparability of our results between financial periods.
Our operations are conducted by subsidiaries in many countries. The results of the operations and the financial position of these subsidiaries are reported in the relevant foreign currencies and then translated into U.S. dollars at the applicable exchange rates for inclusion in our consolidated financial statements. The main currencies to which we are exposed are the euro, the British pound, Chinese renminbi, Indian rupee, Korean won, Brazilian real and Swedish krona. The exchange rates between these currencies and the U.S. dollar in recent years have fluctuated significantly and may continue to do so in the future. A depreciation of these currencies against the U.S. dollar, in particular the euro, will decrease the U.S. dollar equivalent of the amounts derived from these operations reported in our consolidated financial statements and an appreciation of these currencies will result in a corresponding increase in such amounts. Because some of our raw material costs are procured in U.S. dollars rather than on these currencies, depreciation of these currencies may have an adverse effect on our profit margins or our reported results of operations. Conversely, to the extent that we are required to pay for goods or services in foreign currencies, the appreciation of such currencies against the U.S. dollar will tend to negatively impact our results of operations. In addition, currency fluctuations may affect the comparability of our results of operations between financial periods.
41
Table of Contents
We incur currency transaction risk whenever we enter into either a purchase or sale transaction using a currency other than the local currency of the transacting entity. Given the volatility of exchange rates, there can be no assurance that we will be able to effectively manage our currency transaction risks or that any volatility in currency exchange rates will not have a material adverse effect on our financial condition or results of operations.
We may engage in strategic acquisitions or dispositions of certain assets and/or businesses that could affect our business, results of operations, financial condition and liquidity.
We may selectively pursue complementary acquisitions and joint ventures, each of which inherently involves a number of risks and presents financial, managerial and operational challenges, including:
| • | potential disruption of our ongoing business and distraction of management; |
| • | difficulty with integration of personnel and financial and other systems; |
| • | hiring additional management and other critical personnel; and |
| • | increasing the scope, geographic diversity and complexity of our operations. |
In addition, we may encounter unforeseen obstacles or costs in the integration of acquired businesses. Also, the presence of one or more material liabilities of an acquired company that are unknown to us at the time of acquisition may have a material adverse effect on our business. Our acquisition and joint venture strategy may not be successfully received by customers, and we may not realize any anticipated benefits from acquisitions or joint ventures.
We may also opportunistically pursue dispositions of certain assets and/or businesses, which may involve material amounts of assets or lines of business, and adversely affect our results of operations, financial condition and liquidity. If any such dispositions were to occur, under the terms of the credit agreement governing our Revolving Facility and the indenture governing out Senior Notes, we may be required to apply the proceeds of the sale to repay any borrowings under our Revolving Facility or our Senior Notes.
We generally do not have long-term contracts with our customers, and the loss of customers could adversely affect our sales and profitability.
With some exceptions, our business is based primarily upon individual sales orders with our customers. As such, our customers could cease buying our products from us at any time, for any reason, with little or no recourse. If multiple customers elected not to purchase products from us, our business prospects, financial condition and results of operations could be adversely affected.
We could be subject to damages based on claims brought against us by our customers or lose customers as a result of the failure of our products to meet certain quality specifications.
Our products provide important performance attributes to our customers’ products. If a product fails to perform in a manner consistent with quality specifications, a customer could seek replacement of the product or damages for costs incurred as a result of the product failing to perform as designed and marketed. A successful claim or series of claims against us could cause reputational harm and have a material adverse effect on our financial condition and results of operations and could result in a loss of one or more customers.
If we are not able to continue the technological innovation and successful commercial introduction of new products, our customers may turn to other producers to meet their requirements.
Our industry and the end markets into which we sell our products experience periodic technological changes and ongoing product improvements. Our customers may introduce new generations of their own products or require new technological and increased performance specifications that would require us to develop customized products. Innovation or other changes in our customers’ product performance requirements may also adversely
42
Table of Contents
affect the demand for our products. Our future growth will depend on our ability to gauge the direction of the commercial and technological progress in all key end markets, and upon our ability to successfully develop, manufacture and market products in such changing end markets. We need to continue to identify, develop and market innovative products on a timely basis to replace existing products in order to maintain our profit margins and our competitive position. We may not be successful in developing new products and technology that successfully compete with such materials, and our customers may not accept any of our new products. If we fail to keep pace with evolving technological innovations or fail to modify our products in response to our customers’ needs, then our business, financial condition and results of operations could be adversely affected as a result of reduced sales of our products.
Our business relies on intellectual property and other proprietary information and our failure to adequately protect or effectively enforce our rights could harm our competitive advantages with respect to the manufacturing of some of our products.
Our success depends to a significant degree upon our ability to protect, preserve and enforce our intellectual property and other proprietary information of our business. However, we may be unable to prevent third parties from using our intellectual property and other proprietary information without our authorization or independently developing intellectual property and other proprietary information that is similar to or competes with ours, particularly in those countries where the laws do not protect proprietary rights to the same degree as in the United States. Any inability by us to effectively prevent the unauthorized use of our intellectual property and other proprietary information by others could reduce or eliminate any competitive advantage we have developed, cause us to lose sales or otherwise harm our business. If it becomes necessary for us to initiate litigation to protect our proprietary rights, any proceedings could be burdensome and costly, and we may not prevail.
Any patents we own, or that are exclusively licensed to us, that have been issued or may be issued in the future, may not provide us with any competitive advantage and may be challenged by third parties. Our competitors or others also may seek to oppose or challenge the validity of our pending patent applications or issued patents. Our competitors also may attempt to design around our patents or copy or otherwise obtain and use our intellectual property and other proprietary information. Moreover, our competitors may already hold or have applied for patents in the United States or other countries in which we operate that, if enforced following their issuance, could possibly limit our ability to manufacture or sell one or more of our products in the jurisdictions in which such patents are issued. In general, competitors or other parties may, from time to time, assert issued patents or other intellectual property rights against us. If we are legally determined, at some future date, to infringe or violate the intellectual property rights of another party, we may have to pay damages, stop the infringing use, or attempt to obtain a license of such intellectual property from the owner of such intellectual property. With respect to our pending patent applications, we may not be successful in securing patents for the patent claims we are pursuing. Our failure to secure these patents may limit our ability to protect inventions that these applications were intended to cover. In addition, as our patents expire, or are allowed to lapse, in the coming years, we may face increased competition with consequent erosion of profit margins if we are unable to continue to develop innovations for which we are able to secure new patents or we are unable to effectively protect our know how and innovations as trade secrets.
It is our policy to enter into confidentiality agreements with our employees and third parties to protect our confidential proprietary manufacturing know how, technological innovations, proprietary business information and other trade secrets, but our confidentiality agreements could be breached and may not prevent our manufacturing know how and other trade secrets from being misappropriated by others. Adequate remedies may not be available in the event of an unauthorized use or disclosure of our trade secrets and manufacturing know how. Violations by others of our confidentiality agreements and the loss of employees who have specialized knowledge and expertise could harm our competitive position and cause our sales and operating results to decline as a result of increased competition. In addition, others may obtain knowledge of our trade secrets through independent development or other access by legal means.
43
Table of Contents
We have registered and applied for registration of certain service marks and trademarks, and will continue to evaluate the registration and maintenance of additional service marks and trademarks. We have registered the trademark TRINSEO™ in countries throughout the world and intend to adopt this trademark as a “house” brand for all of our products in the future, however the timing of this rebranding initiative has not yet been determined and we may be required to make marketing and other expenditures in order to complete this rebranding successfully. The applicable governmental authorities may not approve our pending applications. A failure to obtain, or maintain, trademark registrations in the United States and in other countries could limit our ability to protect and enforce our trademarks and impede our marketing efforts in those jurisdictions. Moreover, third parties may seek to oppose our applications or otherwise challenge the resulting registrations. In the event that any of our trademarks are successfully challenged, we could be forced to rebrand our products or lose product differentiations that our use of the trademarks has created in the marketplace, which could result in loss of brand recognition or customer loyalty or goodwill and could require us to devote resources to advertising and marketing new brands and the development of new products.
We may be unable to determine when third parties are using our intellectual property rights without our authorization, particularly our manufacturing processes. In addition, we cannot be certain that any intellectual property rights that we have licensed to third parties are being used only as authorized by the applicable license agreement. The undetected, unremedied, or unauthorized use of our intellectual property rights or the legitimate development or acquisition of intellectual property that is similar to or competes with ours by third parties could reduce or eliminate the competitive advantage we have as a result of our intellectual property, adversely affecting our financial condition and results of operations.
If we fail to adequately protect our intellectual property and other proprietary information, including our processes, apparatuses, technology, trade secrets, trade names and proprietary manufacturing know how, methods and compounds, through obtaining patent protection, securing trademark registrations and securing our trade secrets through the use of confidentiality agreements of appropriate scope and other means, our competitive advantages over other producers could be materially adversely affected. If we determine to take legal action to protect, defend or enforce our intellectual property rights, any suits or proceedings could result in significant costs and diversion of our resources and our management’s attention. We may not prevail in any such suits or proceedings. A failure to protect, defend or enforce our intellectual property rights could have an adverse effect on our financial condition and results of operations.
Our products may infringe the intellectual property rights of others, which may cause us to incur unexpected costs or prevent us from selling our products.
We continually seek to improve our business processes and develop new products and applications. Many of our competitors have a substantial amount of intellectual property that we must continually strive to avoid infringing. Although it is our policy and intention not to infringe valid patents of which we are aware, we cannot provide assurances that our processes and products and other activities do not and will not infringe issued patents (whether present or future) or other intellectual property rights belonging to others, either in the United States or abroad. There nonetheless could be third party patents that cover our products, processes or technologies, and it is possible that we could be liable for infringement of such patents and could be required to take remedial or curative actions to continue our manufacturing and sales activities with respect to one or more products that are found to be infringing. We may also be subject to indemnity claims by our business partners arising out of claims of their alleged infringement of the patents, trademarks and other intellectual property rights of third parties in connection with their use of our products. Intellectual property litigation often is expensive and time-consuming, regardless of the merits of any claim, and our involvement in such litigation could divert our management’s attention from operating our business. If we were to discover that any of our processes, technologies or products infringe the valid intellectual property rights of others, we might determine to obtain licenses from the owners of such rights or to modify our processes or technologies or re-engineer our products in order to avoid infringement. We may not be able to obtain the necessary licenses on acceptable terms, or at all, or be able to modify our processes or technologies or re-engineer our products in a manner that is successful in avoiding infringement.
44
Table of Contents
Moreover, if we are sued for infringement and lose, we could be required to pay substantial damages and/or be enjoined from using or selling the infringing products or technology. Any of the foregoing could cause us to incur significant costs and prevent us from selling our products and could have an adverse effect on our financial condition and results of operations.
Data security breaches could compromise sensitive information related to our business, which could adversely affect our business and our reputation.
Cyber attacks or security breaches could compromise confidential, business critical information or cause a disruption in our operations. We have attractive information assets, including intellectual property, trade secrets and other sensitive, business critical information. We face an ever growing risk of attack from outside our organization (including attack by organized crime, so-called “hacktivists,” and state-sponsored actors) using sophisticated technical and non-technical methodologies (including social engineering and “spear phishing” attacks). We also face risks from internal threats to information security, such as from negligent or dishonest employees or consultants. A successful cyber attack or other breach of security could result in the loss of critical business information and/or could negatively impact operations, which could have a negative impact on our financial results. Furthermore, in addition to using our own systems and infrastructure, we use information systems and infrastructure operated by third party service providers, including Dow. If our third party service providers experience an information security breach, depending on the nature of the breach, it could compromise confidential, business critical information or cause a disruption in our operations.
The labor and employment laws in many jurisdictions in which we operate are more restrictive than in the United States. Additionally, we have unionized employees in the United States who may stage work stoppages. Our relationship with our employees could deteriorate, which could have an adverse effect on our operations.
As a manufacturing company, we rely on our employees and good relations with our employees to produce our products and maintain our production processes and productivity. Approximately 85% of our employees are employed outside of the United States. In certain of those countries, such as the member states of the European Union, labor and employment laws are more restrictive than in the United States. In many jurisdictions, the laws grant significant job protection to employees, which subject us to employment arrangements that are very similar to collective bargaining agreements.
In addition, as of December 31, 2013, approximately 18% of our employees in United States are members of a union and subject to a collective bargaining agreement. We are required to consult with and seek the consent or advice of the unions or works’ councils that represent our employees for certain of our activities. This requirement could have a significant impact on our flexibility in managing costs and responding to market changes. Furthermore, there can be no assurance that we will be able to negotiate labor agreements with our unionized employees in the future on satisfactory terms. If those employees were to engage in a strike, work stoppage or other slowdown, or if any of our other employees were to become unionized, we could experience a significant disruption of our operations or higher ongoing labor costs, which could have a material adverse effect on our financial condition and results of operations.
As a global business, we are exposed to local business risks in different countries, which could have a material adverse effect on our financial condition or results of operations.
We have significant operations in foreign countries, including manufacturing facilities, R&D facilities, sales personnel and customer support operations. Currently, we operate, or others operate on our behalf, 35 manufacturing plants (which include a total of 83 production units) at 27 sites around the world, including in Brazil, Colombia, Germany, the Netherlands, Belgium, Italy, Finland, Sweden, China, South Korea, Indonesia, Japan and Taiwan, in addition to our operations in the United States. Our offshore operations are subject to risks inherent in doing business in foreign countries, including, but not necessarily limited to:
| • | new and different legal and regulatory requirements in local jurisdictions; |
45
Table of Contents
| • | uncertainties regarding interpretation and enforcement of laws and regulations; |
| • | variation in political and economic policy of the local governments and social conditions; |
| • | export duties or import quotas; |
| • | domestic and foreign customs and tariffs or other trade barriers; |
| • | potential staffing difficulties and labor disputes; |
| • | managing and obtaining support and distribution for local operations; |
| • | increased costs of transportation or shipping; |
| • | credit risk and financial conditions of local customers and distributors; |
| • | potential difficulties in protecting intellectual property; |
| • | risk of nationalization of private enterprises by foreign governments; |
| • | potential imposition of restrictions on investments; |
| • | potentially adverse tax consequences, including imposition or increase of withholding and other taxes on remittances and other payments by subsidiaries; |
| • | legal restrictions on doing business in or with certain nations, certain parties and/or certain products; |
| • | foreign currency exchange restrictions and fluctuations; and |
| • | local economic, political and social conditions, including the possibility of hyperinflationary conditions and political instability. |
We may not be successful in developing and implementing policies and strategies to address the foregoing factors in a timely and effective manner at each location where we do business. Consequently, the occurrence of one or more of the foregoing factors could have a material adverse effect on our international operations or upon our financial condition and results of operations.
Our operations in developing markets could expose us to political, economic and regulatory risks that are greater than those we may face in established markets. Further, our international operations require us to comply with a number of United States and international regulations. For example, we must comply with the Foreign Corrupt Practices Act, or FCPA, which prohibits companies or their agents and employees from providing anything of value to a foreign official or agent thereof for the purposes of influencing any act or decision of these individuals in their official capacity to help obtain or retain business, direct business to any person or corporate entity or obtain any unfair advantage. We operate in some nations that have experienced significant levels of governmental corruption. Any failure by us to ensure that our employees and agents comply with the FCPA and applicable laws and regulations in foreign jurisdictions could result in substantial civil and criminal penalties or restrictions on our ability to conduct business in certain foreign jurisdictions or reputational damage, and our results of operations and financial condition could be materially and adversely affected.
Because a significant portion of our operations is conducted through our subsidiaries and joint ventures, we are largely dependent on our receipt of distributions and dividends or other payments from our subsidiaries and joint ventures for cash to fund all of our operations and expenses, including to make future dividend payments, if any.
A significant portion of our operations is conducted through our subsidiaries and joint ventures. As a result, our ability to service our debt or to make future dividend payments, if any, is largely dependent on the earnings of our subsidiaries and joint ventures and the payment of those earnings to us in the form of dividends, loans or advances and through repayment of loans or advances from us. Payments to us by our subsidiaries and joint ventures will be contingent upon our subsidiaries’ or joint ventures’ earnings and other business considerations and may be subject to statutory or contractual restrictions. We do not currently expect to declare or pay dividends
46
Table of Contents
on our ordinary shares for the foreseeable future; however, to the extent that we determine in the future to pay dividends on our ordinary shares, the credit agreement governing our Senior Secured Credit Facility and the indenture governing our Senior Notes significantly restrict the ability of our subsidiaries to pay dividends or otherwise transfer assets to us. In addition, there may be significant tax and other legal restrictions on the ability of foreign subsidiaries or joint ventures to remit money to us.
Our quarterly results of operations are subject to fluctuations due to the seasonality of our business.
Seasonal changes and weather conditions typically affect the construction and building materials end markets. In particular, sales volumes for construction and building materials generally rise in the warmer months and generally decline during the colder months of fall and winter. Abnormally cold or wet seasons may cause reduced purchases from our construction and building materials customers and, therefore, adversely affect our financial results. However, because seasonal weather patterns are difficult to predict, we cannot accurately estimate fluctuations in our quarterly construction and building materials sales in any given year. Because of the seasonality of our business, results for any one quarter are not necessarily indicative of the results that may be achieved for any other quarter or for the full fiscal year.
We have unfunded and underfunded pension plan liabilities. We will require current and future operating cash flow to fund these shortfalls. We have no assurance that we will generate sufficient cash flow to satisfy these obligations.
We maintain defined benefit pension plans covering employees who meet age and service requirements. The majority of these plans are located outside the United States. We have minimum funding requirements for these plans, and may elect to make contributions that do not exceed these minimum requirements. Our net pension liability and cost is materially affected by the discount rate used to measure pension obligations, the longevity and actuarial profile of our workforce, the level of plan assets available to fund those obligations and the actual and expected long-term rate of return on plan assets. Significant changes in investment performance or a change in the portfolio mix of invested assets can result in corresponding increases and decreases in the valuation of plan assets, particularly equity securities, or in a change in the expected rate of return on plan assets and could result in a shortfall. In addition, any changes in the discount rate could result in a significant increase or decrease in the valuation of pension obligations, affecting the reported funded status of our pension plans as well as the net periodic pension cost in the following years. Similarly, changes in the expected return on plan assets can result in significant changes in the net periodic pension cost in the following years.
If our goodwill becomes impaired, we may be required to record a significant charge to earnings.
We are required to test goodwill for impairment at least annually or earlier if events or changes in circumstances indicate the carrying value may not be recoverable. As of December 31, 2013, we had recorded a total of $37.3 million of goodwill. An adverse change in economic or market conditions, changes in technology, changes in competitive conditions and customer preferences, particularly if such changes have the effect of changing one of our critical assumptions or estimates made in connection with the impairment testing of goodwill could result in a change to the estimation of fair value that could result in an impairment charge to our goodwill. Any such material charges may negatively impact our operating results.
Our ability to obtain additional capital on commercially reasonable terms may be limited.
Although we believe our cash and cash equivalents, together with cash we expect to generate from operations and availability under our revolving credit facility, provide adequate resources to fund ongoing operating requirements, we may need to seek additional financing to compete effectively.
If we are unable to obtain capital on commercially reasonable terms, it could:
| • | reduce funds available to us for purposes such as working capital, capital expenditures, R&D, strategic acquisitions and other general corporate purposes; |
47
Table of Contents
| • | restrict our ability to introduce new products or exploit business opportunities; |
| • | increase our vulnerability to economic downturns and competitive pressures in the markets in which we operate; and |
| • | place us at a competitive disadvantage. |
| Item 1B. | Unresolved Staff Comments |
None.
| Item 2. | Properties |
We own and operate 65 production units at 19 sites around the world. In addition, we source products from another 16 production units at 8 joint venture sites and two production units at a Dow site. We also own or lease other properties, including office buildings, warehouses, research and development facilities, testing facilities and sales offices.
48
Table of Contents
The following table sets forth a list of our principal offices, production sites and other facilities as of March 1, 2014.
| Site Name | Location | Leased/owned | Products/Functions | Business Segments | ||||
| Corporate Offices |
||||||||
| Berwyn |
USA (PA) | Leased | Global operating headquarters | |||||
| Hong Kong |
Hong Kong | Leased | Administrative office | |||||
| Horgen |
Switzerland | Leased | Administrative office | |||||
| Midland |
USA (MI) | Leased | Administrative office | |||||
| Sao Paolo |
Brazil | Leased | Administrative office | |||||
| Production Sites |
||||||||
| Allyn’s Point* |
USA (CT) | Owned | Latex | Latex | ||||
| Boehlen** |
Germany | Leased | Styrene monomer | Styrenics | ||||
| Dalton |
Georgia | Owned | Latex | Latex | ||||
| Guaruja** |
Brazil | Leased | Latex | Latex | ||||
| Hamina |
Finland | Owned | Latex | Latex | ||||
| Hsinchu |
Taiwan | Owned | Compounds and blends | Engineered Polymers | ||||
| Limao |
Brazil | Leased | Compounds and blends | Engineered Polymers | ||||
| Livorno |
Italy | Owned | Latex | Latex | ||||
| Merak++ |
Indonesia | Owned | Latex, polystyrene | Latex/Styrenics | ||||
| Midland** |
USA (MI) | Leased | ABS, latex | Latex/Engineered Polymers | ||||
| Norrkoping |
Sweden | Owned | Latex | Latex | ||||
| Rheinmunster** |
Germany | Leased | Latex | Latex | ||||
| Schkopau** |
Germany | Leased | ESBR, SSBR, PBR, polystyrene | Synthetic Rubber/Styrenics | ||||
| Stade** |
Germany | Leased | PC, compounds and blends | |||||
| Terneuzen** |
The Netherlands | Leased | Compounds and blends | Engineered Polymers/Latex/Styrenics | ||||
| Tessenderlo** |
Belgium | Leased | Polystyrene | Styrenics | ||||
| Tsing Yi+ |
Hong Kong | Leased | Polystyrene | Styrenics | ||||
| Ulsan |
Korea | Owned | Latex | Latex | ||||
| Zhangjiagang** |
China | Leased | Latex | Latex | ||||
| R&D Facilities |
||||||||
| Samstagern |
Switzerland | Leased | Latex | Latex | ||||
| Joint Ventures |
||||||||
| Americas Styrenics |
||||||||
| Allyn’s Point |
USA (CT) | Leased | Polystyrene | Styrenics | ||||
| Cartagena |
Colombia | Owned | Polystyrene | Styrenics | ||||
| Hanging Rock |
USA (OH) | Leased | Polystyrene | Styrenics | ||||
| Joliet |
USA (IL) | Owned | Polystyrene | Styrenics | ||||
| Marietta |
USA (OH) | Owned | Polystyrene | Styrenics | ||||
| St. James |
USA (LA) | Owned | Styrene monomer |
Styrenics | ||||
| Torrance |
USA (CA) | Leased | Polystyrene | Styrenics | ||||
| Sumika Styron Polycarbonate Limited |
||||||||
| Nihama |
Japan | Owned | Polycarbonate | Styrenics | ||||
| * | Shared site with Americas Styrenics. |
| ** | Facility co-located with Dow facilities under ground lease agreements. Plant facilities are owned by us. |
| + | Facility located on property owned by the applicable government. |
| ++ | Facility located on property under certification with right to build. |
We believe that our properties and equipment are generally in good operating condition and are adequate for our present needs. Production capacity at our sites can vary depending upon product mix and operating conditions.
Our global production facilities are certified to ISO 9001 standards. Our manufacturing facilities have established reliability and maintenance programs and leverage production between sites to maximize efficiency.
All plants have similar layouts, technology and manufacturing processes, based on the product being manufactured. We believe this global uniformity creates a key competitive advantage for us, and helps lower overall operating costs.
49
Table of Contents
| Item 3. | Legal Proceedings |
From time to time we may be subject to various legal claims and proceedings incidental to the normal conduct of business, relating to such matters as product liability, antitrust, competition, waste disposal practices, release of chemicals into the environment and other matters that may arise in the ordinary course of our business. We currently believe that there is no litigation pending that is likely to have a material adverse effect on our business. Regardless of the outcome, legal proceedings can have an adverse impact on us because of defense and settlement costs, diversion of management resources and other factors.
| Item 4. | Mine Safety Disclosures |
Not applicable.
50
Table of Contents
| Item 5. | Market for Registrant’s Common Equity, Related Stockholder Matters, and Issuer Purchases of Equity Securities |
Market
Neither Trinseo Materials Operating S.C.A or Trinseo Materials Finance, Inc. is publicly traded and there is no established public trading market for their respective equity interests.
Holders
As of March 14, 2014, all of Trinseo Materials Operating S.C.A.’s shares are held by (i) Styron Holding S.à r.l., a Luxembourg société à responsabilité limitée (private limited liability company), which holds 1,528 ordinary shares, and (ii) Trinseo Materials S.à r.l. a Luxembourg société à responsabilité limitée (private limited liability company), which holds the remaining 2,370,640,600 ordinary shares and 1,528 management shares. All of Trinseo Materials Finance, Inc.’s shares are held by Trinseo Materials Operating S.C.A. As of March 14, 2014, there were 1,000 shares of common stock of Trinseo Materials Finance, Inc. issued and outstanding. Trinseo Materials S.à r.l. is wholly owned by Styron Holding S.à r.l., which is wholly owned by Styron Luxco S.à r.l, which is wholly owned by Trinseo. Trinseo is wholly owned by the Parent.
Dividends
In February 2011, the Company paid a distribution of $471.4 million to the shareholders of the Parent, including Bain Capital, Dow and certain executives, through a redemption and cancellation of the class A and class G of the Parent’s shares. The shares redeemed included a portion of the outstanding unvested time-based and performance-based restricted stock awards as well as a portion of the issued and outstanding restricted stock. Further, in December 2011, the Company made additional cash distributions to our shareholder of $50.0 million. Since that time, the Company has not declared or paid any additional dividends or distributions.
We currently intend to retain all available funds and any future earnings to fund the development and growth of our business and to repay indebtedness, and therefore we do not anticipate paying any cash dividends in the foreseeable future. The payment of cash distributions on ordinary shares is restricted under the terms of our Revolving Facility, the indenture governing our Senior Notes and applicable Luxembourg law. Additionally, because we are a holding company, our ability to pay dividends on our ordinary shares is limited by restrictions on the ability of our subsidiaries to pay dividends or make distributions to us, including restrictions under the terms of the agreements governing our indebtedness. Any future determination to pay dividends will be at the discretion of our board of directors, subject to compliance with covenants in current and future agreements governing our indebtedness, and will depend upon our results of operations, financial condition, capital requirements and other factors that our board of directors deems relevant.
| Item 6. | Selected Financial Data |
The following table sets forth our selected historical financial and operating data and other information. The historical results of operations data and cash flow data for the years ended December 31, 2013, 2012 and 2011, and the historical balance sheet data as of December 31, 2013 and 2012 presented below were derived from our audited consolidated financial statements and the related notes thereto included elsewhere within this Annual Report. The historical results of operations data and cash flow data for the period from June 17, 2010 through December 31, 2010 and the historical balance sheet data of December 31, 2011 and 2010 were derived from our successor period audited financial statements and the related notes thereto not included within this Annual Report. The historical results of operations data and cash flow data for the period from January 1, 2010 through June 16, 2010 and for the year ended December 31, 2009, and the historical balance sheet data as of December 31, 2009 have been derived from our predecessor period audited financial statements and the related notes thereto for the Styron business not included within this Annual Report.
51
Table of Contents
Our historical results are not necessarily indicative of the results to be expected for any future periods. Our historical financial data and that of the Styron business during the predecessor periods (see footnote 1 below) are not necessarily indicative of our future performance, nor does such data reflect what our financial position and results of operations would have been had we operated as an independent company during those periods.
52
Table of Contents
You should read the information contained in this table in conjunction with Item 7- Management’s Discussion and Analysis of Financial Condition and Results of Operations and the audited financial statements and the related notes thereto included elsewhere in this Annual Report.
| Successor | Predecessor | |||||||||||||||||||||||
| Year Ended December 31, |
June 17 through December 31, |
January 1 through June 16, |
Year Ended December 31, |
|||||||||||||||||||||
| (in millions) | 2013 | 2012 | 2011 | 2010(1) | 2010 | 2009 | ||||||||||||||||||
| Statement of Operations Data: |
||||||||||||||||||||||||
| Net sales(2) |
$ | 5,307.4 | $ | 5,451.9 | $ | 6,192.9 | $ | 2,876.9 | $ | 2,090.1 | $ | 3,450.1 | ||||||||||||
| Cost of sales(2)(3) |
4,949.4 | 5,115.2 | 5,797.3 | 2,661.7 | 1,895.9 | 3,148.8 | ||||||||||||||||||
|
|
|
|
|
|
|
|
|
|
|
|
|
|||||||||||||
| Gross profit |
358.0 | 336.7 | 395.6 | 215.2 | 194.2 | 301.3 | ||||||||||||||||||
| Selling, general and administrative expenses |
216.9 | 182.0 | 308.6 | 124.6 | 64.6 | 142.5 | ||||||||||||||||||
| Acquisition-related expenses |
— | — | — | 56.5 | — | — | ||||||||||||||||||
| Equity in earnings (losses) of unconsolidated affiliates |
39.1 | 27.1 | 23.9 | 12.6 | 4.5 | (5.6 | ) | |||||||||||||||||
|
|
|
|
|
|
|
|
|
|
|
|
|
|||||||||||||
| Operating income |
180.2 | 181.8 | 110.9 | 46.7 | 134.1 | 153.2 | ||||||||||||||||||
| Interest expense, net(4) |
132.0 | 110.0 | 111.4 | 47.9 | — | — | ||||||||||||||||||
| Loss on extinguishment of long-term debt(5) |
20.7 | — | 55.7 | — | — | — | ||||||||||||||||||
| Other expense (income), net |
27.9 | 24.0 | (20.1 | ) | (2.3 | ) | 7.6 | (0.6 | ) | |||||||||||||||
|
|
|
|
|
|
|
|
|
|
|
|
|
|||||||||||||
| Income (loss) before income taxes |
(0.4 | ) | 47.8 | (36.1 | ) | 1.1 | 126.5 | 153.8 | ||||||||||||||||
| Provision for income taxes |
21.8 | 17.5 | 39.8 | 17.9 | 53.0 | 90.0 | ||||||||||||||||||
|
|
|
|
|
|
|
|
|
|
|
|
|
|||||||||||||
| Net income (loss) |
$ | (22.2 | ) | $ | 30.3 | $ | (75.9 | ) | $ | (16.8 | ) | $ | 73.5 | $ | 63.8 | |||||||||
|
|
|
|
|
|
|
|
|
|
|
|
|
|||||||||||||
| Successor | Predecessor | |||||||||||||||||||||||
| Year Ended December 31, |
June 17 through December 31, |
January 1 through June 16, |
Year Ended December 31, |
|||||||||||||||||||||
| (in millions) | 2013 | 2012 | 2011 | 2010(1) | 2010 | 2009 | ||||||||||||||||||
| Other Financial Data: |
||||||||||||||||||||||||
| Cash flows provided by (used in): |
||||||||||||||||||||||||
| Operating activities |
$ | 211.3 | $ | 186.1 | $ | 151.1 | $ | 2.6 | $ | (352.6 | ) | $ | 157.6 | |||||||||||
| Investing activities |
(33.4 | ) | (117.3 | ) | (99.1 | ) | (1,423.9 | ) | (1.4 | ) | (25.0 | ) | ||||||||||||
| Financing activities |
(220.2 | ) | (77.2 | ) | 44.9 | 1,567.4 | 417.5 | (132.6 | ) | |||||||||||||||
| Depreciation and amortization |
95.2 | 85.6 | 101.6 | 61.1 | 48.4 | 99.1 | ||||||||||||||||||
| Capital expenditures, net of subsidy(6) |
54.8 | 112.4 | 99.8 | 7.8 | 1.4 | 25.0 | ||||||||||||||||||
| EBITDA(7) |
226.8 | 243.4 | 176.9 | 110.1 | 174.9 | 252.9 | ||||||||||||||||||
| Balance Sheet Data: |
||||||||||||||||||||||||
| Cash and cash equivalents |
$ | 196.5 | $ | 236.4 | $ | 245.3 | $ | 148.1 | $ | — | ||||||||||||||
| Working capital(8) |
810.2 | 778.1 | 765.2 | 757.1 | 232.4 | |||||||||||||||||||
| Total assets |
2,574.8 | 2,665.7 | 2,576.6 | 2,676.4 | 1,691.3 | |||||||||||||||||||
| Debt |
1,336.4 | 1,453.6 | 1,651.4 | 1,053.6 | — | |||||||||||||||||||
| Total liabilities |
2,231.6 | 2,374.0 | 2,456.0 | 1,949.9 | 716.5 | |||||||||||||||||||
| Total shareholder’s equity and net parent investment |
343.2 | 291.7 | 120.5 | 726.5 | 974.8 | |||||||||||||||||||
| (1) | On June 17, 2010, we acquired 100% of the Styron business from Dow through Trinseo Materials Operating S.C.A., a wholly owned subsidiary, for approximately $1.5 billion plus transaction expenses (the “Acquisition”). The purchase price paid was allocated to the acquired assets and liabilities at fair value. |
53
Table of Contents
| Prior to June 17, 2010, our business was wholly owned by Dow. All periods prior to the Acquisition may be referred to herein as the “Predecessor periods”, while those after the Acquisition may be referred to as “Successor periods”. |
| (2) | Net sales and cost of sales increase or decrease based on fluctuations in raw material prices. Consistent with industry practice and as permitted under agreements with many of our customers, raw material price changes are generally passed through to customers by means of corresponding price changes. Prior to June 17, 2010, all inventory sales between the Predecessor and Dow business units are recorded at Dow’s internal manufacturing cost. |
| (3) | Included in the Predecessor periods presented are expenses related to planned major maintenance activity or turnaround activities. The Predecessor periods presented represent the financial results of the Styron business prior to the Acquisition and were derived from the consolidated financial statements and accounting records of Dow, which elected the direct expensing method for the treatment of turnaround activities. This included $14.2 million of turnaround activities during the Predecessor period from January 1 through June 16, 2010 and $7.6 million of turnaround activities during the Predecessor period ending December 31, 2009. As disclosed in our significant accounting policies, during all Successor periods presented, we elected to capitalize qualified turnaround activities and amortize those costs over the period to the next scheduled turnaround date, consistent with the deferral method of accounting. We incurred $2.3 million, $5.5 million and $15.3 million in turnaround activities during the years ended December 31, 2013, 2012, and 2011, respectively. No such turnaround activities were directly incurred by us in the Successor period ended December 31, 2010. |
| (4) | In the Predecessor periods, interest expense was not allocated to the Styron business as no debt was allocated. |
| (5) | For the year ended December 31, 2011, the loss on extinguishment of debt related to the February 2, 2011 amendment of our Senior Secured Credit Facility. For the year ended December 31, 2013, the loss on extinguishment of debt related to the January 2013 amendment of our Senior Secured Credit Facility and repayment of $1,239.0 million of outstanding Term Loans. |
| (6) | Represents capital expenditures, net of government subsidies received for SSBR expansion of $18.8 million, $6.1 million, and $0 for the years ended December 31, 2013, 2012, and 2011, respectively. |
| (7) | EBITDA is presented within this Annual Report to provide investors with a supplemental measure of our operating performance. We define EBITDA as net income (loss) before interest, income taxes, depreciation and amortization. EBITDA is a key metric that is used by management to evaluate business performance in comparison to budgets, forecasts, and prior year financial results, providing a measure that management believes reflects our core operating performance. EBITDA is useful for analysis purposes; however, it should not be considered an alternative to the Company’s reported GAAP results, as there are limitations in using such financial measures. Other companies in the industry may define EBITDA differently than us, and as a result, it may be difficult to use EBITDA, or similarly-named financial measures, that other companies may use to compare the performance of those companies to our performance. EBITDA is calculated as follows: |
| Successor | Predecessor | |||||||||||||||||||||||
| Year Ended December 31, |
June 17 through December 31, |
January 1 through June 16, |
Year Ended December 31, |
|||||||||||||||||||||
| (in millions) | 2013 | 2012 | 2011 | 2010(1) | 2010 | 2009 | ||||||||||||||||||
| Net income (loss) |
$ | (22.2 | ) | $ | 30.3 | $ | (75.9 | ) | $ | (16.8 | ) | $ | 73.5 | $ | 63.8 | |||||||||
| Interest expense, net |
132.0 | 110.0 | 111.4 | 47.9 | — | — | ||||||||||||||||||
| Provision for income taxes |
21.8 | 17.5 | 39.8 | 17.9 | 53.0 | 90.0 | ||||||||||||||||||
| Depreciation and amortization |
95.2 | 85.6 | 101.6 | 61.1 | 48.4 | 99.1 | ||||||||||||||||||
|
|
|
|
|
|
|
|
|
|
|
|
|
|||||||||||||
| EBITDA |
$ | 226.8 | $ | 243.4 | $ | 176.9 | $ | 110.1 | $ | 174.9 | $ | 252.9 | ||||||||||||
|
|
|
|
|
|
|
|
|
|
|
|
|
|||||||||||||
| (8) | Working capital is defined as current assets minus current liabilities. |
54
Table of Contents
| Item 7. | Management’s Discussion and Analysis of Financial Condition and Results of Operations |
The following discussion summarizes the significant factors affecting the operating results, financial condition, liquidity and cash flows of our Company as of and for the periods presented below. The following discussion and analysis should be read in conjunction with Item 6 – “Selected Financial Data” and the audited consolidated financial statements and the accompanying notes thereto, included elsewhere within this Annual Report. The statements in this discussion regarding industry outlook, our expectations regarding our future performance, liquidity and capital resources and all other non-historical statements in this discussion are forward-looking statements and are based on the beliefs of our management, as well as assumptions made by, and information currently available to, our management. Actual results could differ materially from those discussed in or implied by forward-looking statements as a result of various factors, including those discussed below and elsewhere within this Annual Report, particularly in Item 1A—“Risk Factors.”
Overview
We are a leading global materials company engaged in the manufacture and marketing of emulsion polymers and plastics, including various specialty and technologically differentiated products. We have leading market positions in many of the markets in which we compete. We believe we have developed these strong market positions due to our technological differentiation, diverse global manufacturing base, long-standing customer relationships, commitment to sustainable solutions and competitive cost positions. We believe that growth in overall consumer spending and construction activity, increased demand in the automotive industry for higher fuel efficiency and lighter-weight materials, and improving living standards in emerging markets will result in growth in the global markets in which we compete. In addition, we believe our increasing business presence in developing regions such as China, Southeast Asia, Latin America and Eastern Europe further enhances our prospects.
We develop emulsion polymers and plastics products that are incorporated into a wide range of our customers’ products throughout the world, including tires and other products for automotive applications, carpet and artificial turf backing, coated paper and packaging board, food service packaging, appliances, medical devices, consumer electronics and construction applications, among others. We seek to regularly develop new and improved products and processes, supported by our strong patent portfolio, designed to enhance our customers’ product offerings. We have long-standing relationships with a diverse base of global customers, many of whom are leaders in their markets and rely on us for formulation, technological differentiation, and compounding expertise to find sustainable solutions for their businesses. Many of our products represent only a small portion of a finished product’s production costs, but provide critical functionality to the finished product and are often specifically developed to customer specifications. We believe these product traits result in substantial customer loyalty for our products.
We operate in four reporting segments under two business units. Our Emulsion Polymers business unit includes our Latex reporting segment and our Synthetic Rubber reporting segment. Our Plastics business unit includes our Styrenics reporting segment and our Engineered Polymers reporting segment.
We have significant manufacturing and production operations around the world, which allow us to serve our global customer base. As of December 31, 2013, our production facilities included 35 manufacturing plants (which included a total of 83 production units) at 27 sites across 14 countries, including joint ventures and contract manufacturers. Our manufacturing locations include sites in high-growth emerging markets such as China, Indonesia and Brazil. Additionally, as of December 31, 2013 we operated 11 research and development (“R&D”) facilities globally, including mini plants, development centers and pilot coaters, which we believe are critical to our global presence and innovation capabilities.
For the years ended December 31, 2013, 2012, and 2011, we generated approximately $5.3 billion in net sales and $22.2 million in net losses, $5.5 billion in net sales and $30.3 million in net income, and $6.2 billion in net sales and $75.9 million in net losses, respectively.
55
Table of Contents
Industry Trends
We believe demand for our products is strongly correlated to growth in our customers’ end markets, which are expected to grow along with anticipated rising gross domestic product and industrial production. We believe growth in our markets is supported by improving living standards in emerging markets, the globalization of automotive platforms, improving fuel efficiency and the increasing demand for light-weight materials and upgraded automotive interior materials as well as wide-spread growth in the need for high performance lightweight materials for the electronics industry. We believe we are well-positioned to take advantage of these trends. For example, improving living standards are driving demand for coated paper in emerging markets, particularly in China. We have a leading SB latex position in China. As another example, we are following our current automotive customers to emerging markets with plans to supply them locally as part of their strategy to globalize automotive car platforms. In addition, in synthetic rubber, increasing fuel efficiency regulation is driving demand for SSBR, a key material for high-performance tires. We have a leading European market position in advanced SSBR, and have completed a recent capacity expansion at our Schkopau, Germany facility.
We believe our business will continue to benefit from improving market dynamics in our industry. Over the last few years, companies have rationalized higher-cost capacity in many of our key product lines and there have been a number of consolidation activities, both in emulsion polymers and in plastics. We believe that our markets will continue to experience a long-term trend towards consolidation which will create opportunities for our business given our scale and geographic reach. Developments in the market for certain of our raw materials have a substantial impact on our business.
Factors Affecting Our Operating Results
The following discussion sets forth certain components of our statements of operations as well as factors that impact those items.
Net Sales
We generate revenue from the sale of our products across all major geographic areas. Our net sales include total sales less estimates for returns and price allowances. Price allowances include discounts for prompt payment as well as volume-based incentives.
Our overall net sales are generally impacted by the following factors:
| • | fluctuations in overall economic activity within the geographic markets in which we operate; |
| • | fluctuations in raw material input costs and our ability to pass those on to customers, including the effects of a generally 30 to 60-day delay (or greater) in changes to our product prices in our Latex segment, Synthetic Rubber segment, and parts of our Plastics division following changes to the relevant raw material prices affect our sales margins; |
| • | underlying growth in one or more of our core end markets, either worldwide or in particular geographies in which we operate; |
| • | changes in the level of competition faced by our products, including the substitution by customers of alternative products to ours and the launch of new products by competitors; |
| • | the type of products used within existing customer applications, or the development of new applications requiring products similar to ours; |
| • | the “mix” of products sold, including the proportion of new or improved products and their pricing relative to existing products; |
| • | changes in product sales prices (including volume discounts and cash discounts for prompt payment); |
56
Table of Contents
| • | our ability to successfully develop and launch new products and applications; and |
| • | fluctuations in foreign exchange rates. |
While the factors described above impact net sales in each of our segments, the impact of these factors can differ for each segment, as described below. For more information about risks relating to our business refer to Item 1A- Risk Factors.
Cost of Sales
Our cost of sales consists principally of the following:
| • | Production Materials Costs. The costs of the materials we use in production are the largest element of our overall cost of sales. We seek to use our substantial volumes and global geographic scope to obtain the most favorable terms we can, but our production material costs are affected by global and local market conditions. |
| • | Employee Costs. These employee costs include the salary costs and benefit charges for employees involved in our manufacturing operations. These costs generally increase on an aggregate basis as production volumes increase, but may decline as a percent of net sales as a result of economies of scale associated with higher production volumes. |
| • | Sustaining Engineering Activity Costs. These costs relate to modifications of existing products for use by new customers in familiar applications. |
| • | Depreciation and Amortization Expense. Property, plant, equipment and definite-lived intangible assets are stated at cost and depreciated on a straight-line basis over their estimated useful lives. Property, plant and equipment, including leasehold interests, and intangible assets acquired through the Acquisition were recorded at fair value on the acquisition date, resulting in a new cost basis for accounting purposes. |
| • | Other. Our remaining cost of sales consists of: |
| • | customer-related development costs; |
| • | freight costs; |
| • | warehousing expenses; |
| • | purchasing costs; and |
| • | other general manufacturing expenses, such as expenses for utilities and energy consumption. |
The main factors that influence our cost of sales as a percent of net sales include:
| • | changes in the price of raw materials, and timing of corresponding price changes to our customers, which impact our sales margins; |
| • | production volumes; |
| • | the implementation of cost control measures aimed at improving productivity, reductions of fixed production costs, refinements in inventory management and purchasing cost of raw materials; and |
| • | the impact of FIFO method inventory treatment. |
57
Table of Contents
Selling, General and Administrative Expenses
Our selling, general and administrative, or SG&A, expense consists of all expenditures incurred in connection with the sale and marketing of our products, as well as administrative overhead costs, including:
| • | salary and benefit costs for sales personnel and administrative staff, including stock-based compensation expense. Expenses relating to our sales personnel generally increase or decrease principally with changes in sales volume due to the need to increase or decrease sales personnel to meet changes in demand. Expenses relating to administrative personnel generally do not increase or decrease directly with changes in sales volume; |
| • | other administrative expenses, including expenses related to logistics, information systems and legal and accounting services; |
| • | general advertising expenses; |
| • | research and development expenses; and |
| • | other selling expenses, such as expenses incurred in connection with travel and communications. |
Changes in SG&A expense as a percent of net sales have historically been impacted by a number of factors, including:
| • | changes in sales volume, as higher volumes enable us to spread the fixed portion of our administrative expense over higher sales; |
| • | changes in the mix of products we sell, as some products may require more customer support and sales effort than others; |
| • | changes in our customer base, as new customers may require different levels of sales and marketing attention; |
| • | new product launches in existing and new markets, as these launches typically involve more intense sales activity before they are integrated into customer applications; |
| • | customer credit issues requiring increases to the allowance for doubtful accounts; and |
| • | the implementation of cost control measures aimed at improving productivity. |
Interest Expense, Net
Interest expense, net consists primarily of interest expense on institutional borrowings and other financing obligations and changes in fair value of interest rate derivative instruments, when outstanding. Interest expense, net also includes the amortization of deferred financing fees and debt discount associated with our Senior Secured Credit Facility and our Senior Notes offset by interest income primarily associated with cash-on-hand. Factors affecting interest expense include fluctuations in the market interest rate, our borrowing activities and our outstanding debt balances.
Provision for Income Taxes
We and our subsidiaries are subject to income tax in the various jurisdictions in which we operate. While the extent of our future tax liability is uncertain, the impact of acquisition accounting, changes to the debt and equity capitalization of our subsidiaries, and the realignment of the functions performed and risks assumed by the various subsidiaries are among the factors that will determine the future book and taxable income of the respective subsidiary and the Company as a whole.
58
Table of Contents
Results of Operations
Results of Operations for the Years Ended December 31, 2013, 2012 and 2011
The tables below set forth our historical results of operations, and these results as a percentage of net sales for the periods indicated (in millions):
| Year Ended December 31, |
||||||||||||
| (in millions) | 2013 | 2012 | 2011 | |||||||||
| Net sales |
$ | 5,307.4 | $ | 5,451.9 | $ | 6,192.9 | ||||||
| Cost of sales |
4,949.4 | 5,115.2 | 5,797.3 | |||||||||
|
|
|
|
|
|
|
|||||||
| Gross profit |
358.0 | 336.7 | 395.6 | |||||||||
| Selling, general and administrative expenses |
216.9 | 182.0 | 308.6 | |||||||||
| Equity in earnings of unconsolidated affiliates |
39.1 | 27.1 | 23.9 | |||||||||
|
|
|
|
|
|
|
|||||||
| Operating income |
180.2 | 181.8 | 110.9 | |||||||||
| Interest expense, net |
132.0 | 110.0 | 111.4 | |||||||||
| Loss on extinguishment of long-term debt |
20.7 | — | 55.7 | |||||||||
| Other expense (income), net |
27.9 | 24.0 | (20.1 | ) | ||||||||
|
|
|
|
|
|
|
|||||||
| Income (loss) before income taxes |
(0.4 | ) | 47.8 | (36.1 | ) | |||||||
| Provision for income taxes |
21.8 | 17.5 | 39.8 | |||||||||
|
|
|
|
|
|
|
|||||||
| Net income (loss) |
$ | (22.2 | ) | $ | 30.3 | $ | (75.9 | ) | ||||
|
|
|
|
|
|
|
|||||||
| Year Ended December 31, |
||||||||||||
| 2013 | 2012 | 2011 | ||||||||||
| Net sales |
100.0 | % | 100.0 | % | 100.0 | % | ||||||
| Cost of sales |
93.3 | % | 93.8 | % | 93.6 | % | ||||||
|
|
|
|
|
|
|
|||||||
| Gross profit |
6.7 | % | 6.2 | % | 6.4 | % | ||||||
| Selling, general and administrative expenses |
4.1 | % | 3.3 | % | 5.0 | % | ||||||
| Equity in earnings of unconsolidated affiliates |
0.7 | % | 0.5 | % | 0.4 | % | ||||||
|
|
|
|
|
|
|
|||||||
| Operating income |
3.3 | % | 3.4 | % | 1.8 | % | ||||||
| Interest expense, net |
2.5 | % | 2.0 | % | 1.8 | % | ||||||
| Loss on extinguishment of long-term debt |
0.4 | % | 0.0 | % | 0.9 | % | ||||||
| Other expense (income), net |
0.5 | % | 0.4 | % | (0.3 | )% | ||||||
|
|
|
|
|
|
|
|||||||
| Income (loss) before income taxes |
(0.1 | )% | 1.0 | % | (0.6 | )% | ||||||
| Provision for income taxes |
0.4 | % | 0.3 | % | 0.6 | % | ||||||
|
|
|
|
|
|
|
|||||||
| Net income (loss) |
(0.5 | )% | 0.7 | % | (1.2 | )% | ||||||
|
|
|
|
|
|
|
|||||||
Year Ended December 31, 2013 Compared to the Year Ended December 31, 2012
Net Sales
Net sales for 2013 decreased by $144.5 million, or 2.7%, to $5,307.4 million from $5,451.9 million in 2012. Of the 2.7% decrease in net sales, 1.5% was due to lower sales volume and 2.8% was due to lower selling prices, which were offset by a 1.6% increase in sales due to favorable currency impact as the U.S. dollar weakened compared to the euro. The overall decrease in sales volume was primarily due to lower volumes in the Styrenics and Latex segments. The lower demand in Styrenics was largely driven by increases in the selling price of our polystyrene products due to the pass through of price increases of our key raw material (styrene monomer) while Latex was driven by lower demand in the Europe and Asia paper markets. These were partially offset by higher
59
Table of Contents
sales volume in the Synthetic Rubber segment due to the SSBR capacity expansion. The overall decrease in selling price was due to the contractual pass through of lower butadiene cost in the Latex and Synthetic Rubber segments.
Cost of Sales
Cost of sales for 2013 decreased by $165.8 million, or 3.2%, to $4,949.4 million from $5,115.2 million in 2012. Of the 3.2% decrease, 1.9% was primarily attributable to lower sales volume and 3.2% was due to lower raw materials costs, primarily butadiene with some offset from higher styrene related costs. These decreases were partially offset by an unfavorable currency impact of approximately 1.6% and the remaining variance was due to increases in other manufacturing costs. The unfavorable currency impact was due to the U.S. dollar weakening as compared to the euro.
Gross Profit
Gross profit for 2013 increased by $21.3 million, or 6.3%, to $358.0 million from $336.7 million in 2012. The increase was primarily attributable to higher margin in the Styrenics segment, with lower raw material cost, margin improvement initiatives, and improved market dynamics, as well as new business from the SSBR expansion.
Selling, General and Administrative Expenses
SG&A expenses for 2013 increased by $34.9 million, or 19.2%, to $216.9 million from $182.0 million in 2012. The increase in SG&A expenses were primarily due to: i) $10.8 million restructuring expenses incurred during 2013 in connection with the closure of our latex manufacturing facility in Altona, Australia, which includes impairment of property, plant and equipment, termination benefits and contract termination costs; ii) a one-time charge of $9.2 million representing impairment of fixed assets at our polycarbonate manufacturing plant in Stade, Germany; and iii) $9.3 million of pension costs including a $2.1 million curtailment charge. These charges are discussed in further detail in our notes to the consolidated financial statements.
The remaining increases in our SG&A expenses were due to higher performance incentive compensation costs, general severance, and the impact of annual salary increases totaling $12.0 million, plus an unfavorable currency impact of approximately $2.6 million as the U.S. dollar weakened compared to the euro. Also, during 2012, we recorded an adjustment to reduce stock-based compensation expense by approximately $2.5 million relating to the correction of prior period grant date fair values of time-based and performance-based restricted stock awards. No similar adjustments occurred in 2013.
These increases were offset by approximately $7.5 million of special termination benefit charges incurred in 2012 and a $3.0 million benefit from a change in the estimate for our allowance for doubtful accounts in 2013.
Equity in Earnings of Unconsolidated Affiliates
Equity in earnings of unconsolidated affiliates for 2013 was $39.1 million compared to equity in earnings of $27.1 million for 2012. Americas Styrenics LLC (“AmSty”) equity earnings increased to $39.4 million in 2013 from $27.0 million in 2012, due to stronger operating performance driven by improved market conditions. Sumika Styron Polycarbonate Limited (“Sumika Styron”) equity earnings decreased to equity in net losses of $0.3 million in 2013 from equity earnings of $0.1 million in 2012.
Interest Expense, Net
Interest expense, net for the year ended December 31, 2013 was $132.0 million compared to $110.0 million for the year ended December 31, 2012. The increase of $22.0 million was attributable to the higher outstanding principal and interest rate on the Senior Notes which bear an interest rate of 8.75% compared to 6.0% interest
60
Table of Contents
rate on the Term Loans for the comparative period in 2012. The Term Loans were repaid in January 2013 with the issuance of the Senior Notes. This increase was slightly offset by a decrease in interest expense from our Revolving Facility due to lower borrowings in 2013 compared to prior year.
Loss on Extinguishment of Long-Term Debt
Loss on extinguishment of debt was $20.7 million for the year ended December 31, 2013 related to the extinguishment of our $1,239.0 million Term Loans under our Senior Secured Credit Facility, which was comprised of the write-off of existing unamortized deferred financing fees and original issue discount attributable to the Term Loans totaling $14.4 million and $6.3 million, respectively. There was no loss on extinguishment of debt recognized during the year ended December 31, 2012.
Other Expense (Income), net
Other expense, net for the year ended December 31, 2013 was $27.9 million, which consisted primarily of a $4.2 million loss on the sale of our Styrenics expandable polystyrene (“EPS”) business and $18.9 million foreign exchange transaction losses primarily driven by the remeasurement of our euro payables to the U.S. dollar. The remaining other expenses, net include value-added taxes of approximately $2.5 million and other expense.
Other expense, net for the year ended December 31, 2012 was $24.0 million and included foreign exchange transaction losses of $22.8 million, which were primarily driven by the remeasurement of our euro payables to the U.S. dollar as well as unrealized losses on our foreign exchange forward contracts of approximately $3.8 million. In addition, we incurred approximately $2.3 million of third-party fees associated with the 2012 Amendment of our Senior Secured Credit Facility.
Provision for Income Taxes
Provision for income taxes for 2013 totaled $21.8 million resulting in a negative effective tax rate of 5,921.0%. Provision for income taxes for 2012 totaled $17.5 million resulting in an effective tax rate of 36.6%.
The 2013 effective tax rate was unfavorably impacted by non-deductible interest and stock-based compensation expenses, resulting in an unfavorable difference of $8.4 million from the U.S. statutory rate. Our effective tax rate was further impacted by the tax effect of losses of $16.4 million incurred in jurisdictions such as Australia, Brazil, and Luxembourg which did not provide a tax benefit to us due to valuation allowances.
Offsetting these unfavorable impacts were lower tax expenses of $17.3 million from Switzerland and Hong Kong, where the statutory income tax rate is lower than the U.S. statutory rate. In addition, in 2013, we received a non-taxable government subsidy of $12.2 million related to our capital expansion project at our rubber facility in Schkopau, Germany, which provided a favorable difference of $4.2 million from the U.S. statutory rate.
The increase from 2012 in provision for income taxes was primarily due to net loss before income tax in jurisdictions outside the United States of $25.6 million. Of this loss, $65.0 million was generated from our subsidiaries in Australia and Luxembourg where we either do not receive a benefit from certain shareholder expenses or we have valuation allowances. In 2012, losses from these jurisdictions were $24.8 million. The increased losses from Australia and Luxembourg are primarily due to restructuring charges incurred in connection with the shutdown of our latex manufacturing plant in Altona, Australia and a portion of increased interest expense from the issuance of our Senior Notes in January 2013. We also have an additional valuation allowance of $3.1 million recorded in Singapore and Brazil which were previously not provided for, noting that in 2012 we were favorably impacted by a release of valuation allowances of $14.4 million in Hong Kong and China.
61
Table of Contents
Year Ended December 31, 2012 Compared to the Year Ended December 31, 2011
Net Sales
Net sales for 2012 decreased by $741.0 million, or 12.0%, to $5,451.9 million from $6,192.9 million in 2011. Of the 12.0% decrease in net sales, 6.2% was due to lower sales volume and 1.1% was due to lower selling prices. Additionally, net sales decreased by 4.7% from the prior year due to unfavorable currency impact as the U.S. dollar strengthened compared to the euro. The decrease in volume and selling prices was primarily due to the weakened economic environment, particularly in Europe, and increasing competition.
Cost of Sales
Cost of sales for 2012 decreased by $682.1 million, or 11.8%, to $5,115.2 million from $5,797.3 million in 2011. Of the 11.8% decrease in cost of sales, 6.3% was attributable to lower sales volume and approximately 4.1% was due to a net favorable currency impact driven by the strengthening of the U.S. dollar as compared to the euro in 2012. In addition, 1.2% of the decrease was due to lower depreciation and other manufacturing cost reductions.
Gross Profit
Gross profit for 2012 decreased by $58.9 million, or 14.9%, to $336.7 million from $395.6 million in 2011. Of the 14.9% decrease, 19.6% was primarily attributable to an overall decrease in sales volume and prices driven by increasing competition and a weakened economic environment, particularly in Europe, plus net unfavorable currency impact of approximately 13.4%. These decreases were offset by lower manufacturing cost and depreciation that contributed approximately 18.1% of increase in our gross profit.
Selling, General and Administrative Expenses
SG&A expense for 2012 decreased by $126.6 million, or 41.0%, to $182.0 million from $308.6 million in 2011. The decrease was primarily the result of higher consulting, accounting, and legal fees associated with our separation from Dow and transition of our initial financial close process as a stand-alone entity in 2011, which together contributed approximately $94.2 million of the decrease. We also incurred an additional $11.1 million related to special stock-based compensation expense in 2011 resulting from the shareholder distribution and share redemption in February 2011, which is further discussed in Note Q to the consolidated financial statements. SG&A further decreased in 2012 due to reductions in employee-related expenses as a result of restructuring programs implemented in the third quarter of 2011 and first quarter of 2012, and a stock-based compensation adjustment related to the correction of prior period grant date fair values of time-based and performance-based restricted stock awards that reduced the recorded expense in the first quarter of 2012 by approximately $2.5 million. The expenses recorded related to the restructuring programs for the year ended December 31, 2012 and 2011 were approximately $7.5 million and $9.2 million, respectively. Other decreases were due to an approximately $7.6 million favorable currency impact driven by the strengthening of the U.S. dollar as compared to the euro in 2012 and other cost reduction efforts.
Equity in Earnings of Unconsolidated Affiliates
Equity in earnings of unconsolidated affiliates for 2012 was $27.1 million compared to equity in earnings of $23.9 million for 2011. AmSty equity earnings increased to $27.0 million from $24.1 million in 2011. Sumika Styron equity earnings increased to $0.1 million from a loss of $0.2 million in 2011.
Interest Expense, Net
Net interest expense for the year ended December 31, 2012 was $110.0 million compared to $111.4 million for the year ended December 31, 2011. The decrease in interest expense was the result of lower interest incurred on our Revolving Facility and our Accounts Receivable Securitization Facility of approximately $3.3 million due
62
Table of Contents
to lower average borrowings in 2012 compared to 2011 and an increase in capitalized interest by $4.4 million due to an increase in capital projects. These decreases were offset by an increase of $8.6 million interest expense on our Senior Secured Credit Facility as a result of the amendment completed in August 2012, wherein our borrowing rate increased by 2.0%.
Loss on Extinguishment of Long-Term Debt
Loss on extinguishment of debt was $55.7 million for the year ended December 31, 2011 related to the February 2, 2011 amendment of our Senior Secured Credit Facility and the related extinguishment of $749.0 million of our then outstanding Term Loans. The loss on extinguishment of debt was comprised of $7.5 million in fees paid to the lenders, $0.2 million in third-party fees associated with modifying the Term Loans, with the remainder attributable to the write-off of existing unamortized deferred financing fees and original issue discount attributed to the Term Loans totaling $34.0 million and $14.0 million, respectively. There was no loss on extinguishment of debt recognized in the year ended December 31, 2012.
Other Expense (Income), net
Other expense for the year ended December 31, 2012 was $24.0 million compared to other income of $20.1 million for the year ended December 31, 2011.
Other expense for the year ended December 31, 2012 includes foreign exchange transaction losses of $22.8 million, which were primarily driven by the remeasurement of our euro payables to the U.S. dollar as well as unrealized losses on our foreign exchange forward contracts of approximately $3.8 million. In addition, we incurred approximately $2.3 million of third-party fees associated with the 2012 Amendment of our Senior Secured Credit Facility.
Other income for the year ended December 31, 2011 was primarily related to foreign exchange transaction gains of $17.2 million and indemnification matters from Dow which were recorded as other income. The foreign exchange transaction gains in 2011 were primarily driven by the remeasurement of our euro payables to the U.S. dollar.
Provision for Income Taxes
Provision for income taxes for 2012 totaled $17.5 million resulting in an effective tax rate of 36.6%. Provision for income taxes for 2011 totaled $39.8 million resulting in a negative effective tax rate of 109.8%.
The 2012 effective tax rate was unfavorably impacted by non-deductible expenses resulting in an $8.9 million difference from the U.S. statutory rate, of which $5.2 million related to non-deductible interest expense and $2.5 million related to non-deductible stock-based compensation. In 2011, these non-deductible expenses were $9.0 million. Further, provision for income taxes included $7.1 million of tax expense related to withholding taxes as compared to $8.6 million in 2011.
Offsetting these negative impacts was approximately $3.6 million of favorable impact of jurisdictions where the statutory income tax rate is lower than the United States statutory rate compared to $1.2 million in 2011. Further, favorable impacts for 2012 are from tax credits of $2.9 million and a release of a valuation allowance in the fourth quarter of 2012 of $14.4 million, primarily as a result of improvements in actual business operations and projected future results of our subsidiaries in China and Hong Kong.
In 2012, although we had a net loss before income tax in jurisdictions outside the United States of $1.4 million, certain jurisdictions with statutory rates lower than the United States statutory rate generated income before taxes of $33.8 million and related income tax expense of approximately $5.8 million. These jurisdictions included the Netherlands, Indonesia and China. The losses we generated from jurisdictions outside
63
Table of Contents
of the United States were approximately $35.2 million with a related income tax benefit of $3.0 million. Those jurisdictions primarily included Luxembourg which did not provide a tax benefit to us due to recurring losses.
Selected Segment Information
The following tables present net sales and EBITDA by segment and as a percentage of total net sales and net sales by segment, respectively, for the following periods:
| (in millions) | Year Ended December 31, |
|||||||||||
| 2013 | 2012 | 2011 | ||||||||||
| Net sales(1) |
||||||||||||
| Latex segment |
$ | 1,341.4 | $ | 1,545.1 | $ | 1,843.5 | ||||||
| Synthetic Rubber segment |
622.1 | 701.9 | 849.5 | |||||||||
| Styrenics segment |
2,305.4 | 2,149.2 | 2,307.0 | |||||||||
| Engineered Polymers segment |
1,038.5 | 1,055.7 | 1,192.9 | |||||||||
| Corporate unallocated(2) |
— | — | — | |||||||||
|
|
|
|
|
|
|
|||||||
| Total |
$ | 5,307.4 | $ | 5,451.9 | $ | 6,192.9 | ||||||
|
|
|
|
|
|
|
|||||||
| EBITDA(3) |
||||||||||||
| Latex segment |
$ | 95.4 | $ | 125.5 | $ | 121.5 | ||||||
| Synthetic Rubber segment |
113.5 | 111.1 | 174.6 | |||||||||
| Styrenics segment |
160.7 | 82.9 | 72.2 | |||||||||
| Engineered Polymers segment |
(9.1 | ) | 31.5 | 26.3 | ||||||||
| Corporate unallocated(2) |
(133.7 | ) | (107.6 | ) | (217.7 | ) | ||||||
|
|
|
|
|
|
|
|||||||
| Total |
$ | 226.8 | $ | 243.4 | $ | 176.9 | ||||||
|
|
|
|
|
|
|
|||||||
| Year Ended December 31, |
||||||||||||
| 2013 | 2012 | 2011 | ||||||||||
| Net sales(1) |
||||||||||||
| Latex segment |
25.3 | % | 28.3 | % | 29.8 | % | ||||||
| Synthetic Rubber segment |
11.7 | % | 12.9 | % | 13.7 | % | ||||||
| Styrenics segment |
43.4 | % | 39.4 | % | 37.3 | % | ||||||
| Engineered Polymers segment |
19.6 | % | 19.4 | % | 19.2 | % | ||||||
| Corporate unallocated(2) |
0.0 | % | 0.0 | % | 0.0 | % | ||||||
|
|
|
|
|
|
|
|||||||
| Total |
100.0 | % | 100.0 | % | 100.0 | % | ||||||
|
|
|
|
|
|
|
|||||||
| EBITDA(3) |
||||||||||||
| Latex segment |
7.1 | % | 8.1 | % | 6.6 | % | ||||||
| Synthetic Rubber segment |
18.2 | % | 15.8 | % | 20.6 | % | ||||||
| Styrenics segment |
7.0 | % | 3.9 | % | 3.1 | % | ||||||
| Engineered Polymers segment |
(0.9 | )% | 3.0 | % | 2.2 | % | ||||||
| Corporate unallocated(2) |
(2.5 | )% | (2.0 | )% | (3.5 | )% | ||||||
|
|
|
|
|
|
|
|||||||
| Total |
4.3 | % | 4.5 | % | 2.9 | % | ||||||
|
|
|
|
|
|
|
|||||||
| (1) | Inter-segment sales have been eliminated. |
| (2) | Corporate unallocated includes corporate overhead costs, loss on extinguishment of long term debt, and certain other income and expenses. Percentages for Corporate unallocated are based on total sales. |
64
Table of Contents
| (3) | EBITDA is a non-GAAP financial measure that we refer to in making operating decisions because we believe it provides meaningful supplemental information regarding our operational performance. We present EBITDA because we believe that it is useful for investors to analyze disclosures of our operating results on the same basis as that used by our management. We believe the use of EBITDA as a metric assists our board of directors, management and investors in comparing our operating performance on a consistent basis because it removes the impact of our capital structure (such as interest expense), asset base (such as depreciation and amortization) and tax structure. See a reconciliation of net income (loss) to EBITDA below: |
| (in millions) | Year Ended December 31, |
|||||||||||
| 2013 | 2012 | 2011 | ||||||||||
| Net income (loss) |
$ | (22.2 | ) | $ | 30.3 | $ | (75.9 | ) | ||||
| Interest expense, net |
132.0 | 110.0 | 111.4 | |||||||||
| Provision for income taxes |
21.8 | 17.5 | 39.8 | |||||||||
| Depreciation and amortization |
95.2 | 85.6 | 101.6 | |||||||||
|
|
|
|
|
|
|
|||||||
| EBITDA |
$ | 226.8 | $ | 243.4 | $ | 176.9 | ||||||
|
|
|
|
|
|
|
|||||||
There are limitations to using financial measures such as EBITDA. Other companies in our industry may define EBITDA differently than we do. As a result, it may be difficult to use EBITDA, or similarly-named financial measures that other companies may use, to compare the performance of those companies to our performance. We compensate for these limitations by providing reconciliations of our EBITDA results to our net income (loss), which is determined in accordance with U.S. GAAP.
Latex Segment
We are a global leader in SB latex, holding a strong market position across the geographies and applications in which we compete, including the #1 position in SB latex in Europe and the #2 position in North America. We produce SB latex primarily for coated paper used in advertising and magazines, packaging board coatings, carpet and artificial turf backings, as well as a number of performance latex applications. In 2013, approximately half of our Latex segment’s net sales were generated in Europe, approximately 25% were generated in the United States and the remainder was generated in Asia and other geographies.
Year Ended December 31, 2013 Compared to the Year Ended December 31, 2012
Net sales for 2013 decreased by $203.7 million, or 13.2%, to $1,341.4 million from $1,545.1 million for 2012. Of the 13.2% decrease in net sales, approximately 9.6% was due to lower selling prices primarily from the pass through of lower butadiene cost as well as increased competition in the Europe and Asia paper markets. Lower sales volume, approximately 4.7% of the total impact, was primarily driven by lower demand and increasing competition in the Europe and Asia paper markets. These decreases were partially offset by a 1.1% favorable currency impact as the U.S. dollar weakened compared to the euro.
EBITDA for 2013 decreased by $30.1 million, or 24.0%, to $95.4 million from $125.5 million in 2012. Of this decrease, 16.5% was driven by lower sales volume and margins due to lower demand and continued increases in competition in the Europe and Asia paper markets. An additional 8.6% of the decrease relates to restructuring charges of $10.8 million recorded in 2013 in connection with the closure of the latex plant in Australia.
Year Ended December 31, 2012 Compared to the Year Ended December 31, 2011
Net sales for 2012 decreased by $298.4 million, or 16.2%, to $1,545.1 million from $1,843.5 million for 2011. Of the 16.2% decrease in net sales, 9.9% was driven by a decline in sales volume primarily due to lower demand in European and North American paper markets and 6.3% was due to lower selling prices, which includes a 3.7% unfavorable currency impact due to the strengthening of the U.S. dollar as compared to the euro.
65
Table of Contents
EBITDA for 2012 increased by $4.0 million, or 3.3%, to $125.5 million from $121.5 million in 2011. This increase was primarily driven by our fixed cost improvements from prior year due to the cost reduction efforts implemented during 2011 and 2012 as well as improvement on margin due to favorable timing of contractual pass through of lower raw materials prices. These items resulted in a 31.9% increase in EBITDA, which were partially offset by a decline in sales volumes of 27.8% and a 2.8% net unfavorable currency impact due to the strengthening of the U.S. dollar as compared to the euro.
Synthetic Rubber Segment
We are a significant producer of styrene-butadiene and polybutadiene-based rubber products and we have a leading European market position in SSBR. While 100% of our sales were generated in Europe in 2013, approximately 15% of these net sales were exported to Asia, 8% to Latin America and 5% to North America.
We have a broad synthetic rubber technology and product portfolio, focusing on specialty products, such as SSBR and Li-PBR, while also producing core products, such as ESBR and Ni-PBR. Our synthetic rubber products are extensively used in tires, with an estimated 86% of our net sales from this segment in 2013 attributable to the tire market. We estimate that three quarters of these sales relate to replacement tires. We have strong relationships with many of the top global tire manufacturers and believe we have remained a supplier of choice as a result of our broad rubber portfolio and ability to offer technologically differentiated product and product customization capabilities. Other applications for our synthetic rubber products include polymer modification and technical rubber goods.
Year Ended December 31, 2013 Compared to Year Ended December 31, 2012
Net sales for 2013 decreased by $79.8 million, or 11.4%, to $622.1 million from $701.9 million in 2012. Of the 11.4% decrease in net sales, 18.2%, net of an approximately 1.8% favorable currency impact as the U.S. dollar weakened compared to the euro, was due to lower selling prices mostly from lower butadiene costs passed through to customers and some reduction in selling prices due to weakened economic conditions in the tire market. The decrease was partially offset by an increase in sales volume of approximately 6.8% due to the SSBR capacity expansion completed in the fourth quarter of 2012 and lower sales in the second quarter of 2012 due to the scheduled plant turnaround.
EBITDA for 2013 increased by $2.4 million, or 2.2%, to $113.5 million from $111.1 million for 2012. Higher volume, from the SSBR expansion with some offset from a weaker tire market, contributed a 29.0% increase in EBITDA and a slightly favorable currency impact, as the U.S. dollar weakened compared to the euro, contributed 2.1%. These increases were offset by lower margins, driven by weaker tire market conditions and less favorable timing of contractual pass through of raw material prices, and higher fixed costs, due to SSBR capacity expansions, which contributed to a 28.9% decrease in EBITDA from 2012.
Year Ended December 31, 2012 Compared to the Year Ended December 31, 2011
Net sales for 2012 decreased by $147.6 million, or 17.4%, to $701.9 million from $849.5 million in 2011. Of the 17.4% decrease in net sales, 7.1% was driven by lower sales volume mainly due to lost production from a six-week long major maintenance turnaround during the second quarter of 2012. The decrease was also due to lower selling prices from lower raw materials cost pass-throughs to customers resulting in an unfavorable impact on net sales of 10.3%, which includes unfavorable currency impact of approximately 5.8% due primarily to the strengthening of the U.S. dollar as compared to the euro.
EBITDA for 2012 decreased by $63.5 million, or 36.4%, to $111.1 million from $174.6 million for 2011. Of this decrease, 11.3% was primarily driven by lower margins, as we had higher margin on non-contractual sales in the prior year due to raw material market dynamics, and 16.8% was driven by lower sales volume mainly due to lost production from a major maintenance turnaround and lower demand during the second quarter. We
66
Table of Contents
estimate that the impact of this turnaround was the loss of approximately $10.0 million in EBITDA from lost volumes and production, as well as costs associated with the turnaround process. In addition, we had approximately 4.0% net unfavorable currency impact due to the strengthening of the U.S. dollar as compared to the euro.
Styrenics Segment
Our Styrenics segment includes polystyrene, ABS and SAN products, as well as our internal production and sourcing of styrene monomer, a raw material common in SB latex, synthetic rubber and styrenics products. We are a leading producer of polystyrene and mass ABS, or mABS, where we focus our efforts on differentiated applications such as the liners and encasements of appliances and consumer electronics including smartphones and tablets. Within these applications, we have worked collaboratively with customers to develop more advanced grades of plastics such as our HIPS and mABS products. For example, we work with appliance manufacturers around the world to develop improved environmental stress crack resistant products and with our construction sheet customers on smooth ABS. These products offer superior properties, such as rigidity, insulation and colorability, and, in some cases, an improved environmental footprint compared to general purpose polystyrene or emulsion ABS. Our Styrenics segment also serves the packaging and construction end-markets, where we have launched a new general purpose polystyrene product for improved performance in foam insulation applications.
Year Ended December 31, 2013 Compared to Year Ended December 31, 2012
Net sales for 2013 increased by $156.2 million, or 7.3%, to $2,305.4 million from $2,149.2 million in 2012. Of the 7.3% increase in net sales, 7.4% was driven by increases in selling prices due to higher styrene monomer prices, as well as actions to increase selling prices to improve margins. Also, the weakening of the U.S. dollar compared to the euro had a favorable impact to our net sales of approximately 1.9%. These increases were partially offset by a 2.0% decrease in sales volume with half of that net impact attributable to the divestiture of our EPS business to Ravago and the remainder driven by customers’ inventory optimization efforts, as a result of price increases in styrene monomer.
EBITDA for 2013 increased by $77.8 million, or 93.8%, to $160.7 million from $82.9 million in 2012. This increase is attributable mainly to higher margins in styrene monomer production, margin improvement initiatives, and more favorable industry dynamics with lower supply in Europe which contributed to a combined 92.9% increase in EBITDA from 2012. Also, the weakening of the U.S. dollar compared to the euro had a net favorable currency impact of approximately 3.7%. These increases were slightly offset by decreases of approximately 7.3% due to lower volume and 5.1% due to the $4.2 million loss on sale of the EPS business completed in September 2013.
Year Ended December 31, 2012 Compared to the Year Ended December 31, 2011
Net sales for 2012 decreased by $157.8 million, or 6.8%, to $2,149.2 million from $2,307.0 million in 2011. Of the 6.8% decrease in net sales, 4.1% was driven by a decline in sales volume due to a weaker market and 5.3% was driven by the negative currency impact of the strengthening of the U.S. dollar as compared to the euro. These decreases were offset by a 2.6% increase in selling prices during the year primarily due to higher costs of raw materials that were able to be passed onto customers.
EBITDA for 2012 increased by $10.7 million, or 14.8%, to $82.9 million from $72.2 million in 2011. This increase was primarily driven by fixed cost improvements from prior year due to the cost reduction efforts implemented during 2011 and 2012 along with improvement in margins. These factors resulted in an approximate 30.3% increase in EBITDA, which was partially offset by a 9.7% decrease in sales volume and an 8.2% unfavorable currency impact from the strengthening of the U.S. dollar compared to the euro.
67
Table of Contents
Engineered Polymers Segment
We are a leading producer of engineered polymers. Our products are predominantly used in the automotive, consumer electronics, construction, and medical device markets. We are focused on differentiated products which we produce in our polymer and compounds and blends manufacturing facilities located across Europe, Asia, North America and Latin America. We believe that the strategic locations of these facilities combined with close customer collaboration offers us a strategic advantage in serving our customers. Many of our PC products and more than half of our compounds and blends products are differentiated, based on their physical properties, performance and aesthetic advantages. Our history of innovation has contributed to long-standing relationships with customers who are recognized leaders in their respective end-markets. We have established a strong market presence in the global automotive and electronics sector, targeting both component suppliers and final product manufacturers. Our Engineered Polymers segment also compounds and blends our PC and mABS plastics into differentiated products for customers within these sectors, as well as into compounds of polypropylene. We have also developed compounds containing post-consumer recycle polymers to respond to what we believe is a growing need for some customers to include recycled content in their products. We are currently focused on reducing costs in order to improve our competitiveness in polycarbonate.
Year Ended December 31, 2013 Compared to Year Ended December 31, 2012
Net sales for 2013 decreased by $17.2 million, or 1.6%, to $1,038.5 million from $1,055.7 million in 2012. Of the 1.6% decrease in net sales, 0.8% was driven by lower sales volume and 2.2% was driven by lower selling prices primarily due to continued competitive challenges in polycarbonate markets. These decreases were partially offset by a 1.3% favorable currency impact as the U.S. dollar weakened compared to the euro.
EBITDA for 2013 decreased by $40.6 million, or 128.9%, to negative $9.1 million from positive $31.5 million in 2012. This decrease was primarily due to continued losses in the polycarbonate business as the market remains extremely competitive, especially given current unfavorable supply and demand dynamics. In addition, the automotive market in Europe has weakened compared to 2012 and margin in our automotive products in Latin America was unfavorably impacted by the strengthening of the U.S. dollar compared to the Brazilian real resulting in an approximate 13.9% negative impact to our EBITDA. Further, the weakening of the U.S. dollar compared to the euro resulted in an unfavorable currency impact of approximately 4.2%. This decrease in EBITDA also includes a loss of approximately $9.2 million related to the impairment of fixed assets at our polycarbonate manufacturing facility in Stade, Germany.
Year Ended December 31, 2012 Compared to the Year Ended December 31, 2011
Net sales for 2012 decreased by $137.2 million, or 11.5%, to $1,055.7 million from $1,192.9 million in 2011. Of the 11.5% decrease in net sales, approximately 3.8% was driven by lower sales volume due to strong competitive pressures specifically within the polycarbonate markets and 7.7% was due to lower selling prices, which includes an unfavorable currency impact of approximately 4.2% due to the strengthening of the U.S. dollar as compared to the euro.
EBITDA for 2012 increased by $5.2 million, or 19.8%, to $31.5 million from $26.3 million in 2011. The increase was due to the cost reduction efforts implemented during 2011 and 2012 and higher margins on our automotive products, as well as a 7.5% favorable currency impact as the U.S. dollar strengthened compared to the euro. These increases were offset by decreases due to lower margins on our polycarbonate products, driven mostly by competitive pressures, particularly in Europe.
Other Important Performance Measures
We believe that the presentation of Adjusted EBITDA provides investors with a useful analytical indicator of our performance and of our ability to service our indebtedness.
68
Table of Contents
We define Adjusted EBITDA, substantially in accordance with its definition from our Indenture and Senior Secured Credit Facility, as income (loss) from continuing operations before interest expense, net; income tax provision; depreciation and amortization expense; asset impairment charges; advisory fees paid to affiliates of Bain Capital; other non-cash charges and certain other charges that management does not believe are reflective of our core operating performance. Many of these adjustments to net income (loss) relate to strategic initiatives, including, among other items, divestitures, restructurings of certain operations and various financing transactions. We describe these other costs in more detail below.
There are limitations to using financial measures such as Adjusted EBITDA. Adjusted EBITDA is not intended to represent cash flow from operations as defined by GAAP and should not be used as an alternative to net income as an indicator of operating performance or to cash flow as a measure of liquidity. Other companies in our industry may define Adjusted EBITDA differently than we do. As a result, it may be difficult to use Adjusted EBITDA, or similarly-named financial measures that other companies may use, to compare the performance of those companies to our performance. We compensate for these limitations by providing reconciliations of our Adjusted EBITDA results to our net income (loss), which is determined in accordance with U.S. GAAP.
Adjusted EBITDA is calculated as follows for the years ended December 31, 2013, 2012, and 2011, respectively:
| Year Ended December 31, |
||||||||||||
| (in millions) | 2013 | 2012 | 2011 | |||||||||
| Net income (loss) |
$ | (22.2 | ) | $ | 30.3 | $ | (75.9 | ) | ||||
| Interest expense, net |
132.0 | 110.0 | 111.4 | |||||||||
| Provision for income taxes |
21.8 | 17.5 | 39.8 | |||||||||
| Depreciation and amortization |
95.2 | 85.6 | 101.6 | |||||||||
|
|
|
|
|
|
|
|||||||
| EBITDA(a) |
$ | 226.8 | $ | 243.4 | $ | 176.9 | ||||||
| Loss on extinguishment of long-term debt |
20.7 | — | 55.7 | |||||||||
| Transition, strategic, and other items(b) |
35.8 | 22.0 | 94.2 | |||||||||
| Fees paid pursuant to Advisory Agreement(c) |
4.7 | 4.6 | 5.2 | |||||||||
| Equity in earnings of unconsolidated affiliates, net(d) |
(15.6 | ) | (6.2 | ) | (6.7 | ) | ||||||
| Stock-based compensation and other employee costs(e) |
16.4 | 5.1 | 32.4 | |||||||||
| Foreign currency losses (gains)(f) |
14.5 | 21.8 | (17.4 | ) | ||||||||
|
|
|
|
|
|
|
|||||||
| Adjusted EBITDA |
$ | 303.3 | $ | 290.7 | $ | 340.3 | ||||||
|
|
|
|
|
|
|
|||||||
| (a) | We refer to EBITDA in making operating decisions because we believe it provides meaningful supplemental information regarding our operational performance. Other companies in our industry may define EBITDA differently than we do. As a result, it may be difficult to use EBITDA, or similarly-named financial measures that other companies may use, to compare the performance of those companies to our performance. We compensate for these limitations by providing reconciliations of our EBITDA results to our net income (loss), which is determined in accordance with U.S. GAAP. See the “Selected Segment Information” for further detail. |
| (b) | These adjustments represent external advisory costs related to the evaluation of strategic initiatives, our initial assembly of a finance, treasury and human resources team, implementation of financial controls as a stand-alone entity and supplemental external consulting resources relating to implementing our financial closing procedures following separation from Dow. These initiatives and associated costs were incurred by the Company as a result of our separation from Dow or other strategic initiatives primarily intended to establish and define the Company’s ongoing cost and operational structure. For the year ended December 31, 2011, this included $51.3 million of finance related costs, $17.9 million of strategic initiative evaluation costs, $6.6 million of treasury and human resource related costs, and $18.4 million of legal and |
69
Table of Contents
| other duplicative, transitional and one-time related costs. For the year ended December 31, 2012, this included $3.0 million of finance related costs, $14.0 million of strategic initiative evaluation costs, and $5.0 million of legal and other duplicative, transitional and one-time related costs. For the year ended December 31, 2013, this included $0.7 million of finance related costs, $14.3 million of strategic initiative evaluation costs, and $20.8 million of legal and other duplicative, transitional and one-time related costs. The above amounts for 2013 included a $9.2 million impairment charge for fixed assets at our polycarbonate manufacturing plant in Stade, Germany, a $4.2 million loss on the sale of our EPS business, and $10.8 million of restructuring charges incurred in connection with the shutdown of our latex manufacturing plant in Altona, Australia. |
| (c) | Represents fees paid under the terms of our advisory agreement with Bain Capital Partners, LLC and Portfolio Company Advisors Limited (together, the “Advisors”) (the “Advisory Agreement”). See section “Advisory Agreement and Transaction Services Agreement” in Item 13- Certain Relationships and Related Transactions, and Director Independence of this Annual Report for further details. |
| (d) | Represents removal of equity in earnings of unconsolidated affiliates and inclusion of cash dividends received during the historical period. Cash dividends received were $23.6 million, $21.0 million, and $17.2 million for the years ended December 31, 2013, 2012, and 2011, respectively. |
| (e) | For the years ended December 31, 2013, 2012, and 2011, represents stock-based compensation expense of $10.0 million, $7.3 million, and $22.3 million, respectively, and pension and post-retirement costs in excess of cash contributions during the period of $6.4 million, $(2.2) million, and $10.1 million, respectively. |
| (f) | Represents gains or losses on the remeasurement and settlement of foreign currency transactions and unrealized gains or losses on currency derivatives entered into for the express purpose of reducing non-U.S. dollar currency exposure. |
Liquidity and Capital Resources
Cash Flows
The table below summarizes our primary sources and uses of cash for the years ended December 31, 2013, 2012, and 2011. We have derived the summarized cash flow information from our audited financial statements.
| Year Ended December 31, |
||||||||||||
| (in millions) | 2013 | 2012 | 2011 | |||||||||
| Net cash provided by (used in): |
||||||||||||
| Operating activities |
$ | 211.3 | $ | 186.1 | $ | 151.1 | ||||||
| Investing activities |
(33.4 | ) | (117.3 | ) | (99.1 | ) | ||||||
| Financing activities |
(220.2 | ) | (77.2 | ) | 44.9 | |||||||
| Effect of exchange rates on cash |
2.4 | (0.6 | ) | 0.3 | ||||||||
|
|
|
|
|
|
|
|||||||
| Net change in cash and cash equivalents |
$ | (39.9 | ) | $ | (9.0 | ) | $ | 97.2 | ||||
|
|
|
|
|
|
|
|||||||
Operating Activities
Net cash provided by operating activities during the year ended December 31, 2013 totaled $211.3 million, with net cash provided by operating assets and liabilities totaling $92.5 million. The most significant components of the changes in operating assets and liabilities for the year ended December 31, 2013 of $92.5 million were increases in accounts payable and other current liabilities of $15.0 million, and a decrease in inventory of $55.4 million. Increase in accounts payable and other current liabilities was mainly due to timing of payments in the normal course of business plus lesser interest payments in 2013 on the Senior Notes as interest payments are due semi-annually in August and February each year compared to interest on the Term Loans which were paid quarterly in the prior year. Decrease in inventory was due to lower raw materials prices during 2013, as well as a decrease in volumes compared to the fourth quarter of 2012, due to higher inventory volumes on hand at the end of 2012 resulting from our rubber capacity expansion project placed in operation in the fourth quarter of 2012.
70
Table of Contents
Additionally, in 2013 we received $22.5 million from our unconsolidated affiliate, AmSty, as a return on our investment. Overall, cash flow from operating activities was primarily driven by improvement in cash collection during the year and lesser cash outflow on purchases due to inventory build in 2012 and lower raw materials prices in 2013.
Net cash provided by operating activities during the year ended December 31, 2012 totaled $186.1 million, with net cash provided by operating assets and liabilities totaling $55.3 million. The most significant components of the changes in operating assets and liabilities for the year ended December 31, 2012 of $55.3 million were decreases in accounts receivable and income taxes payable of $84.7 million and $5.1 million, respectively, and increases in inventory and accounts payable and other current liabilities of $87.2 million and $67.9 million, respectively. Increases in inventory and accounts payable and other current liabilities are primarily due to increases in inventory during the fourth quarter of 2012 for our new rubber capacity expansion project placed in operation in October 2012. The decrease in accounts receivable reflects both a decrease in sales during the fourth quarter of 2012 driven by the decrease in sales volume as well as continued improvements in receivable collection efforts. In addition, despite the decreases in sales, we conserved the use of cash in our operations due to various cost savings initiatives implemented during the year. Net cash paid for income taxes during the year was approximately $20.4 million. Additionally, in 2012 we received $20.0 million in dividends from our unconsolidated affiliate, AmSty, as a return on our investment.
Net cash provided by operating activities during the year ended December 31, 2011 totaled $151.1 million, with net cash provided by operating assets and liabilities totaling $54.4 million. The most significant components of the change for the year ended December 31, 2011 of $54.4 million were a decrease in inventory of $53.9 million, a decrease in accounts receivable of $67.0 million, a decrease of $37.7 million in accounts payable and other current liabilities, a $27.6 million decrease in income taxes payable and a prepayment penalty of $7.7 million related to our extinguishment of long-term debt. Decreases in inventory and accounts payable and other current liabilities reflect our effort to reduce working capital and lower production volume during the fourth quarter of 2011. The decrease in accounts receivable reflects both a decrease in sales driven by volume declines during the fourth quarter of 2011 as well as improvements in receivable collection efforts. Additionally, in 2011 we received $10.0 million in dividends from our unconsolidated affiliate, AmSty, as a return on our investment.
Investing Activities
Net cash used in investing activities for the year ended December 31, 2013 totaled $33.4 million, consisting primarily of capital expenditures of $54.8 million during the period, net of proceeds received from a government subsidy of $18.8 million related to our capital expansion project at our rubber facility in Schkopau, Germany. Also offsetting these capital expenditures were cash proceeds of $15.2 million received from the sale of our EPS business during the year as well as cash proceeds of $7.9 million released from restrictions related to our accounts receivable securitization facility. Refer to Note C of the consolidated financial statements for details on the EPS business divestiture.
Net cash used in investing activities for the year ended December 31, 2012 totaled $117.3 million, consisting primarily of capital expenditures of $112.4 million, net of proceeds from a government subsidy of $6.1 million; $69.2 million of capital expenditures, net of subsidy, was related to our capital expansion project at our rubber facility in Schkopau, Germany.
Net cash used in investing activities for the year ended December 31, 2011 totaled $99.1 million consisting primarily of capital expenditures of $99.8 million of which $54.8 million was related to our capital project implemented at our rubber facility in Schkopau, Germany. Investing activities also included payment of $6.3 million to our Brazilian partner representing its 50% share of the proceeds from the sale of our assets in Styrenics Brazilian operations, partially offset by distributions from our unconsolidated affiliate, Sumika Styron, of $7.2 million representing a return of our investment.
71
Table of Contents
Financing Activities
Net cash used in financing activities during the year ended December 31, 2013 totaled $220.2 million. During the period, we repaid our outstanding Term Loans of $1,239.0 million using the proceeds from the issuance of $1,325.0 million in Senior Notes issued in January 2013. In connection with the issuance of the Senior Notes and the amendments to our Senior Secured Credit Facility and our Accounts Receivable Securitization Facility, we paid approximately $48.3 million of refinancing fees. In addition, during the period, we continued to utilize our Revolving Facility and our Accounts Receivable Securitization Facility to fund our working capital requirements. During the year ended December 31, 2013, our borrowings and repayments to our Revolving Facility were $405.0 million and $525.0 million, respectively, and we had net repayments to our Accounts Receivable Securitization Facility of $95.1 million.
Net cash used in financing activities during the year ended December 31, 2012 totaled $77.2 million. We had borrowings from our Revolving Facility and our Accounts Receivable Securitization Facility throughout the year to fund our working capital requirements, and repaid those borrowings from funds generated from operating activities. During the year ended December 31, 2012, our borrowings and repayments to our Revolving Facility were $1,105.0 million and $1,135.0 million, respectively, and our net repayments to our Accounts Receivable Securitization Facility were $16.4 million. Also, during the year ended December 31, 2012, we paid $147.0 million of the then outstanding Term Loans, of which $140.0 million was the required payment for the effectiveness of the fourth amendment to the Senior Secured Credit Facility. Further, in May 2012, we received an approximate $22.2 million equity contribution from our Parent in order to cure an event of default that occurred for the period ended March 31, 2012. In August 2012, we received a $140.0 million cash contribution from our Parent and used the proceeds to repay a portion of our then outstanding Term Loans (as mentioned above).
Net cash provided by financing activities during the year ended December 31, 2011 totaled $44.9 million. In February 2011, we received $1,379.4 million of additional proceeds from the Term Loans under our Senior Secured Credit Facility, net of deferred financing fees of $20.3 million. Such proceeds from the Term Loans borrowed in 2011 were used to repay $75.0 million of our Seller Note with Dow and the related interest and $780.0 million that was previously outstanding under the Term Loans and related interest. Additionally, we made a $521.5 million distribution to our shareholder. We also had borrowings from our Revolving Facility and our Accounts Receivable Securitization Facility throughout the year to fund our working capital requirements, and repaid those borrowings from funds generated from operating activities. Our net borrowings from these facilities in 2011 were $20.0 million and $35.2 million, respectively.
Indebtedness and Liquidity
The following table outlines our outstanding indebtedness as of December 31, 2013 and December 31, 2012 and the associated interest expense, including amortization of deferred financing fees and debt discounts, and effective interest rates for such borrowings at December 31, 2013 and December 31, 2012. Note that the effective interest rates below exclude the impact of deferred financing fees.
| As of December 31, 2013 | As of December 31, 2012 | |||||||||||||||||||||||
| (dollars in millions) | Balance | Effective Interest Rate |
Interest Expense |
Balance | Effective Interest Rate |
Interest Expense |
||||||||||||||||||
| Senior Secured Credit Facility |
||||||||||||||||||||||||
| Term Loans |
$ | — | n/a | $ | 8.0 | $ | 1,232.6 | 6.9 | % | $ | 94.6 | |||||||||||||
| Revolving Facility |
— | 6.6 | % | 5.7 | 120.0 | 7.7 | % | 9.5 | ||||||||||||||||
| Senior Notes |
1,325.0 | 8.8 | % | 111.9 | — | n/a | — | |||||||||||||||||
| Accounts Receivable Securitization Facility |
— | 3.1 | % | 5.6 | 93.5 | 3.5 | % | 6.1 | ||||||||||||||||
| Other Indebtedness |
11.4 | 1.6 | % | 0.1 | 7.5 | 2.0 | % | 0.2 | ||||||||||||||||
|
|
|
|
|
|
|
|
|
|||||||||||||||||
| Total |
$ | 1,336.4 | $ | 131.3 | $ | 1,453.6 | $ | 110.4 | ||||||||||||||||
|
|
|
|
|
|
|
|
|
|||||||||||||||||
72
Table of Contents
Senior Secured Credit Facility
In January 2013, we amended our Senior Secured Credit Facility (the “2013 Amendment”). As part of the 2013 Amendment, we increased our Revolving Facility capacity from $240.0 million to $300.0 million, decreased the borrowing rate of the revolving facility through a decrease in the applicable margin rate from 4.75% to 3.00% as applied to base rate loans (which shall bear interest at a rate per annum equal to the base rate plus the applicable margin (as defined therein)), or 5.75% to 4.00% as applied to LIBO rate loans (which shall bear interest at a rate per annum equal to the LIBO rate plus the applicable margin plus the mandatory cost (as defined therein), if applicable), extended the maturity date to January 2018 and concurrently repaid our then outstanding Term Loans of $1,239.0 million using the proceeds from our sale of $1,325 million aggregate principal amount of the Senior Notes issued in January 2013. The 2013 Amendment replaced our total leverage ratio requirement with a springing first lien net leverage ratio (as defined under the 2013 Amendment) and removed the interest coverage ratio requirement. If the outstanding balance under the Revolving Facility exceeds 25% of the $300.0 million borrowing capacity (excluding undrawn letters of credit up to $10.0 million) at a quarter end, then our first lien net leverage ratio may not exceed 5.25 to 1.00 for the quarter ending March 31, 2013, 5.00 to 1.00 for the subsequent quarters through December 31, 2013, 4.50 to 1.00 for each of the quarters ending in 2014 and 4.25 to 1.00 for each of the quarters ending in 2015 and thereafter.
As a result of the 2013 Amendment and repayment of the then outstanding amount under the Term Loans in January 2013, we recognized $20.7 million of a loss on extinguishment of debt during 2013, which consisted of the write-off of existing unamortized deferred financing fees and debt discount attributable to the Term Loans. Fees and expenses incurred in connection with the 2013 Amendment were $5.5 million, which were capitalized within “Deferred charges and other assets” in the December 31, 2013 consolidated balance sheet and amortized into interest expense over the remaining term of the Revolving Facility using the straight-line method.
There are no amounts outstanding under the Revolving Facility as of December 31, 2013. Available borrowings under the Revolving Facility totaled $292.7 million (net of $7.3 million of outstanding letters of credit) as of December 31, 2013.
Senior Notes
In January 2013, we issued $1,325.0 million aggregate principal of our 8.750% Senior Notes due 2019 (the “Senior Notes”). The Senior Notes were issued by Trinseo Materials Operating S.C.A. and Trinseo Materials Finance, Inc. (together, the “Issuers”) pursuant to an Indenture, dated as of January 29, 2013, by and among the Issuers, the Guarantors named therein and Wilmington Trust, National Association, as trustee and collateral agent, as supplemented and amended from time to time (the “Indenture”). Interest on the notes is payable semi-annually on February 1st and August 1st of each year, commencing on August 1, 2013. The Senior Notes will mature and be due in full on February 1, 2019. The proceeds from the issuance of the Senior Notes were used to repay all of our then outstanding Term Loans under the Senior Secured Credit Facility and related refinancing fees and expenses.
We may redeem all or part of the Senior Notes at any time prior to August 1, 2015 by paying a make-whole premium, plus accrued and unpaid interest to the redemption date. We may redeem all or part of the Senior Notes at any time after August 1, 2015 at a redemption price equal to the percentage of principal amount set forth below plus accrued and unpaid interest, if any, on the notes redeemed, to the applicable date of redemption, if redeemed during the twelve-month period beginning on of the year indicated below:
| 12-month period commencing August 1 in Year |
Percentage | |||
| 2015 |
104.375 | % | ||
| 2016 |
102.188 | % | ||
| 2017 and thereafter |
100.000 | % | ||
73
Table of Contents
In addition, at any time prior to August 1, 2015, we may redeem up to 35% of the aggregate principal amount of the notes at a redemption price equal to 108.750% of the face amount thereof plus accrued and unpaid interest, if any, to the redemption date, with the net cash proceeds that we raise in certain equity offerings. We may also redeem, during any 12-month period commencing from the issue date until August 1, 2015, up to 10% of the original principal amount of the notes at a redemption price equal to 103% of the principal amount thereof, plus accrued and unpaid interest, if any, to, but not including, the date of redemption.
In connection with the issuance of Senior Notes, we also entered into a Registration Rights Agreement, pursuant to which we are required to prepare and file with the SEC a registration statement covering an offer to the holders of the Senior Notes to exchange all of their notes for notes that are registered under the Securities Act of 1933, as amended. We filed the Registration Statement with the SEC on September 30, 2013, which was subsequently amended and supplemented (the “Registration Statement”). Such Registration Statement was declared effective by the SEC on January 29, 2014, and the exchange offer closed on March 4, 2014.
The Senior Notes are unconditionally guaranteed on a senior secured basis by Trinseo S.A., Styron Luxco S.à r.l, Styron Holding, S.à r.l, Trinseo Materials S.à r.l, Styron Investment Holdings Ireland and each of Trinseo Materials Operating S.C.A.’s existing and future wholly-owned subsidiaries that guarantee our Senior Secured Credit Facility, other than our subsidiaries, Styron France S.A.S. and Styron Spain S.L. The notes and the guarantees are collateralized by a security interest in substantially all of the assets of the issuers and the guarantors thereunder. The notes and guarantees rank equally in right of payment with all of our existing and future senior secured debt and, subject to the immediately succeeding sentence, are effectively pari passu with our indebtedness that is secured by first-priority liens, including the Senior Secured Credit Facility, to the extent of the value of the collateral securing such indebtedness and ranking senior in right of payment to all of our existing and future subordinated debt. However, claims under the Senior Notes will effectively rank behind the claims of holders of debt, including interest, under our Senior Secured Credit Facility in respect of proceeds from any enforcement action with respect to the collateral or in any bankruptcy, insolvency or liquidation proceeding. The guarantees will be structurally subordinated to all of the liabilities of each of our subsidiaries that do not guarantee the notes.
The Indenture contains covenants that, among other things, limit our ability and the ability of our restricted subsidiaries to incur additional indebtedness, pay dividends or make other distributions, subject to certain exceptions. If the notes are assigned an investment grade by the rating agencies and no default has occurred or is continuing, certain covenants will be suspended. If the ratings on the notes decline to below investment grade, the suspended covenants will be reinstated.
Fees and expenses incurred in connection with the issuance of the Senior Notes were approximately $42.0 million, which were capitalized and included within “Deferred charges and other assets” in our consolidated balance sheet. These deferred charges are being amortized using the effective interest rate method and reflected in “Interest expense, net” in the consolidated statement of operations.
Accounts Receivable Securitization Facility
In August 2010, Styron Receivables Funding Ltd., which we refer to as Styron Funding, a variable interest entity in which we are the primary beneficiary, entered into an accounts receivable securitization facility with HSBC Bank Plc. The initial facility permitted borrowings by our Swiss subsidiary guarantor, Styron Europe GmbH, which we refer to as Styron Europe, of up to a total of $160.0 million. Under the facility, Styron Europe will sell its accounts receivable from time to time to Styron Funding. In turn, Styron Funding may sell undivided ownership interests in such receivables to commercial paper conduits in exchange for cash. We have agreed to continue servicing the receivables for Styron Funding. Upon the sale of the interests in the accounts receivable by Styron Funding, the conduits have a first priority perfected security interest in such receivables and, as a result, the receivables will not be available to our creditors or those of our subsidiaries.
74
Table of Contents
In May 2011, the accounts receivable securitization facility was amended to allow for the expansion of the pool of eligible accounts receivable to include a previously excluded German subsidiary. In May 2013, we further amended the accounts receivable securitization facility, which increased our borrowing capacity from $160.0 million to $200.0 million, extended the maturity date to May 2016, lowered our borrowing cost, and allows for the expansion of the pool of eligible accounts receivable to include our previously not included U.S. and Netherlands subsidiaries. As a result of the amendment, we incurred $0.7 million in fees, which were capitalized within “Deferred charges and other assets” in the consolidated balance sheet and amortized into interest expense using the straight-line method over the remaining term.
The accounts receivable securitization facility is subject to interest charges against both the amount of outstanding borrowings as well as the amount of available, but undrawn borrowings. As a result of the amendment to our accounts receivable securitization facility in May 2013 noted above, we lowered our borrowing costs. In regards to the outstanding borrowings, fixed interest charges were decreased from 3.25% plus variable commercial paper rates to 2.6% plus variable commercial paper rates. In regards to available, but undrawn borrowings, fixed interest charges were decreased from 1.50% to 1.40%.
As of December 31, 2013, there was approximately $143.8 million of accounts receivable available to support this facility, based on our pool of eligible accounts receivable. As of December 31, 2013, there were no outstanding borrowings under this facility.
Other Indebtedness
As of December 31, 2013, we had $5.1 million of outstanding borrowings under our short-term revolving credit facility through our subsidiary in China that provides for up to $15.0 million of uncommitted funds available for borrowings, subject to the availability of collateral. The facility is subject to annual renewal.
Our Senior Secured Credit Facility limits our foreign working capital facilities to an aggregate principal amount of $75.0 million and further limits our foreign working capital facilities in certain jurisdictions in Asia, including China, to an aggregate principal amount of $25.0 million, except as otherwise permitted by the Senior Secured Credit Facility.
Derivative Instruments
Foreign Exchange Forward Contracts
We manage our exposure to changes in foreign currency exchange rates where possible by paying expenses in the same currency in which we generate sales in a particular country as well as using derivative contracts which are not designated for hedge accounting treatment. During 2012, we entered into foreign exchange forward contracts that were not designated as hedging instruments to manage volatility in foreign currency exposures. As of December 31, 2012, we had open foreign exchange forward contracts with various expiration dates to buy euro currency with a notional U.S. dollar equivalent of $82.0 million. The fair value of the foreign exchange forward contracts amounted to $3.8 million as of December 31, 2012 recorded in “Accounts payable” in the consolidated balance sheet. As these foreign exchange forward contracts were not designated for hedge accounting treatment, changes in the fair value of underlying instruments are recognized in “Other expense (income)” in the consolidated statement of operations.
These contracts were settled in February and May 2013 and no contracts were outstanding as of December 31, 2013. We recognized a loss of $0.6 million and a loss of $4.8 million during the years ended December 31, 2013 and 2012, respectively.
75
Table of Contents
Capital Resources and Liquidity
Our sources of liquidity include cash on hand, cash flow from operations and amounts available under the Senior Secured Credit Facility and the Accounts Receivable Securitization Facility. We believe, based on our current level of operations, that these sources of liquidity will be sufficient to fund our operations, capital expenditures and debt service for at least the next twelve months.
Our liquidity requirements are significant due to our highly leveraged nature, as well as our working capital requirements. As of December 31, 2013, we had $1,336.4 million in outstanding indebtedness and $810.2 million in working capital. As of December 31, 2012, we had $1,453.6 million in outstanding indebtedness and $778.1 million in working capital. As of December 31, 2013 and December 31, 2012, we had $74.0 million and $39.9 million of foreign cash and cash equivalents on our balance sheet, respectively, all of which is readily convertible into other foreign currencies, including the U.S. dollar. Our intention is not to permanently reinvest our foreign cash and cash equivalents. Accordingly, we record deferred income tax liabilities related to the unremitted earnings of our subsidiaries.
As discussed above, in January 2013, we repaid our outstanding Term Loans of $1,239.0 million through issuance of $1,325.0 million in Senior Notes. Concurrently, with this repayment, we amended our Senior Secured Credit Facility to increase our Revolving Facility borrowing capacity from $240.0 million to $300.0 million. Also, in May 2013, we amended our Accounts Receivable Securitization Facility to increase our borrowing capacity from $160.0 million to $200.0 million, extended the maturity date to May 2016, and expanded the pool of eligible accounts receivable to include previously excluded U.S. and Netherlands subsidiaries. These amendments to our facilities provide for additional liquidity resources for us.
Our ability to raise additional financing and our borrowing costs may be impacted by short and long-term debt ratings assigned by independent rating agencies, which are based, in significant part, on our performance as measured by certain credit metrics such as interest coverage and leverage ratios.
We cannot make assurances that our business will generate sufficient cash flow from operations or that future borrowings will be available to us under the Senior Secured Credit Facility in an amount sufficient to enable us to pay our indebtedness, or to fund our other liquidity needs. Further, our highly leveraged nature may limit our ability to procure additional financing in the future. As of December 31, 2013 and December 31, 2012, we were in compliance with all the covenants and default provisions under our credit arrangements.
We believe that funds provided by operations, our existing cash and cash equivalent balances, borrowings available under our Revolving Facility and borrowings available under our accounts receivable facility will be adequate to meet planned operating and capital expenditures for at least the next 12 months under current operating conditions. However, if we were to undertake any significant acquisitions or investments, it may be necessary for us to obtain additional debt or equity financings. We may not be able to obtain such financing on reasonable terms, or at all.
76
Table of Contents
Contractual Obligations and Commercial Commitments
The following table reflects our contractual obligations as of December 31, 2013. Amounts we pay in future periods may vary from those reflected in the table (in millions):
| Payments due by year | ||||||||||||||||||||||||||||
| Contractual Obligations at December 31, 2013 |
2014 | 2015 | 2016 | 2017 | 2018 | Thereafter | Total | |||||||||||||||||||||
| Purchase commitments(1) |
$ | 2,253.1 | $ | 1,914.0 | $ | 1,844.3 | $ | 1,805.7 | $ | 1,416.9 | $ | 2,618.1 | $ | 11,852.1 | ||||||||||||||
| Long-term Indebtedness(2) |
— | — | — | — | — | 1,325.0 | 1,325.0 | |||||||||||||||||||||
| Interest payments on long-term debt(3) |
115.9 | 115.9 | 115.9 | 115.9 | 115.9 | 58.0 | 637.5 | |||||||||||||||||||||
| Pension and other postretirement benefits(4) |
16.0 | 0.6 | 0.8 | 1.2 | 1.2 | 9.7 | 29.5 | |||||||||||||||||||||
| Minimum operating lease commitments and other obligations(5) |
9.0 | 7.6 | 6.3 | 4.4 | 4.1 | 16.9 | 48.3 | |||||||||||||||||||||
| Fees related to Advisory Agreement(6) |
4.0 | 4.0 | 4.0 | 4.0 | 4.0 | 6.0 | 26.0 | |||||||||||||||||||||
| Uncertain tax positions, including interest and penalties(7) |
— | — | — | — | — | 18.0 | 18.0 | |||||||||||||||||||||
|
|
|
|
|
|
|
|
|
|
|
|
|
|
|
|||||||||||||||
| Total |
$ | 2,398.0 | $ | 2,042.1 | $ | 1,971.3 | $ | 1,931.2 | $ | 1,542.1 | $ | 4,051.7 | $ | 13,936.4 | ||||||||||||||
|
|
|
|
|
|
|
|
|
|
|
|
|
|
|
|||||||||||||||
| (1) | We have certain raw material purchase contracts where we are required to purchase certain minimum volumes at the then prevailing market prices. These commitments range from 1 to 7 years. In certain raw material purchase contracts, we have the right to purchase less than required minimums and pay a liquidated damages fee, or, in case of a permanent plant shutdown, to terminate the contracts. In such cases these obligations would be less than the obligations shown in the table above. |
| (2) | In January 2013, we issued $1,325.0 million aggregate principal of our 8.750% Senior Notes due 2019. The Senior Notes will mature and be due in full on February 1, 2019. The above excludes other debt outstanding as of December 31, 2013 totaling $11.4 million, which was primarily short-term in nature. |
| (3) | Includes estimated interest on the 8.750% Senior Notes due 2019, which is payable semi-annually on February 1st and August 1st of each year, which commenced on August 1, 2013. Estimated annual payments on the Senior Notes are approximately $115.9 million. Estimated interest payments do not include the Revolving Facility or Accounts Receivable Securitization Facility as amounts outstanding under these facilities vary due to periodic borrowings and repayments. There are no amounts outstanding under either facility as of December 31, 2013. |
| (4) | Includes minimum contributions required to be made to the funded pension plans and expected benefit payments to the employees for unfunded pension plans. With respect to our minimum funding requirements under our pension obligations, we may elect to make contributions in excess of the minimum funding requirements in response to investment performance or changes in interest rates or when we believe that it is financially advantageous to do so and based on our other cash requirements. Our minimum funding requirements after 2013 will depend on several factors, including investment performance and interest rates. Our minimum funding requirements may also be affected by changes in applicable legal requirements. We also have payments due with respect to our postretirement benefit obligation. We do not fund our postretirement benefit obligation. Rather, payments are made as costs are incurred by covered retirees. We expect benefit payments related to our postretirement benefit obligation to be $2.0 million through 2023. |
| (5) | Excludes certain estimated future commitments under agreements with Dow, including a Second Amended and Restated Master Outsourcing Services Agreement (“SAR MOSA”) under which Dow provides administrative and operational services to us and 25-year site services agreements, as amended (“SSAs”) under which Dow provides utilities and site services to certain of our facilities co-located with Dow. |
We have the right to terminate the SAR MOSA after June 1, 2015, subject to certain termination penalties, upon the appropriate notice of termination. As of December 31, 2013, we estimate our minimum obligation under the SAR MOSA, excluding the impacts of inflation, to be approximately $47.0 million in 2014, $20.0 million through June 1, 2015 and $32.0 million thereafter. However, should we continue with this
77
Table of Contents
agreement after that date, we estimate our minimum cumulative obligation as of December 31, 2013 through the completion of the contract, excluding the impacts of inflation, would be approximately $328.9 million through December 31, 2020.
We may terminate a site service or services under any SSAs in the event of a closure of a consumption unit (production site or production unit). If a site service is terminated in the event of the closure of a consumption unit, we will pay certain capital charges for 60 months following the termination of such site service. Either party may terminate an SSA at any time (i) by agreement of the parties; (ii) for failure of a party to pay under the agreement; (iii) for a material breach which is not cured or (iv) in the event of insolvency. If an SSA expires or is terminated (other than for permanent cessation of operations) we must pay certain capital charges for 45 months following termination or expiration of the agreement. Utilizing current year known costs and assuming that we continue with these agreements, we estimate our contractual obligations for the SSAs to be approximately $259.5 million annually for 2014 through 2018. Should we choose to continue these agreements, we estimate our minimum cumulative obligation would be approximately $6,352.1 million through June 2038.
See Note R to the consolidated financial statements, included elsewhere within this Annual Report, for further details.
| (6) | Includes estimated future commitments under the Advisory Agreement with Bain Capital Partners, LLC and Portfolio Company Advisors Limited, or the Advisors, under which the Advisors provide us with management and consulting services and financial and other advisory services. The Advisory Agreement has an initial 10-year initial term and thereafter is subject to automatic one-year extensions, unless the Advisors provide written notice of termination. In addition, the Advisory Agreement will terminate automatically upon an initial public offering or a change of control. See Note R to the consolidated financial statements, included elsewhere within this Annual Report, for further details. |
| (7) | Due to uncertainties in the timing of the effective settlement of tax positions with the respective taxing authorities, we are unable to determine the timing of payments related to its uncertain tax positions, including interest and penalties. Amounts are therefore reflected in “Thereafter”. |
Critical Accounting Policies and Estimates
Our discussion and analysis of results of operations and financial condition are based upon our financial statements. These financial statements have been prepared in accordance with GAAP. The preparation of these financial statements requires us to make estimates and judgments that affect the amounts reported in the financial statements. We base our estimates and judgments on historical experiences and assumptions believed to be reasonable under the circumstances and re-evaluate them on an ongoing basis. Actual results could differ from our estimates under different assumptions or conditions. Our significant accounting policies, which may be affected by our estimates and assumptions, are more fully described in Note B to our consolidated financial statements in this Annual Report. An accounting policy is deemed to be critical if it requires an accounting estimate to be made based on assumptions about matters that are highly uncertain at the time the estimate is made, and if different estimates that reasonably could have been used, or changes in the accounting estimates that are reasonably likely to occur periodically, could materially impact the financial statements. Management believes the following critical accounting policies reflect its most significant estimates and assumptions used in the preparation of the financial statements.
Pension Plans and Postretirement Benefits
We have various company-sponsored retirement plans covering substantially all employees. We also provide certain health care and life insurance benefits mainly to certain retirees in the United States. The plans provide health care benefits, including hospital, physicians’ services, drug and major medical expense coverage, and life insurance benefits. We recognize the underfunded or overfunded status of a defined benefit pension or postretirement plan as an asset or liability in our balance sheet and recognize changes in the funded status in the year in which the changes occur through accumulated other comprehensive income, which is a component of shareholder’s equity.
78
Table of Contents
Pension benefits associated with these plans are generally based on each participant’s years of service, compensation, and age at retirement or termination. The discount rate is an important element of expense and liability measurement. We evaluate our assumptions at least once each year, or as facts and circumstances dictate, and make changes as conditions warrant.
We determine the discount rate used to measure plan liabilities as of the December 31 measurement date for the pension and postretirement benefit plans. The discount rate reflects the current rate at which the associated liabilities could be effectively settled at the end of the year. We set our rate to reflect the yield of a portfolio of high quality, fixed-income debt instruments that would produce cash flows sufficient in timing and amount to settle projected future benefits. Using this methodology, we determined a discount rate of 3.30% for pension and 4.72% for postretirement benefits to be appropriate as of December 31, 2013.
We determine the expected long-term rate of return on assets by performing a detailed analysis of historical and expected returns based on the underlying assets, which generally are insurance contracts. We also consider our historical experience with the pension fund asset performance. The expected return of each asset class is derived from a forecasted future return confirmed by current and historical experience. The weighted-average long-term rate of return assumption used for determining net periodic pension expense for 2013 was 2.44%, while the weighted-average long-term rate of return assumption used for determining net periodic pension expense for 2012 was 4.09%. The decrease was primarily due to certain assets moving to financial instruments with guaranteed returns. Future actual pension expense will depend on the performance of the underlying assets and changes in future discount rates, among other factors.
Holding all other factors constant, a 0.25 percentage point increase (decrease) in the discount rate used to determine net periodic cost would decrease (increase) 2013 pension expense by approximately $1.4 million and $(1.7) million, respectively. Holding all other factors constant, a 0.25 percentage point increase (decrease) in the long-term rate of return on assets used to determine net periodic cost would decrease (increase) 2013 pension expense by approximately $0.2 million and $(0.2) million, respectively.
Stock-Based Compensation
Since June 17, 2010, our Parent granted various time-based and performance-based restricted stock awards (“Incentive Shares”) to certain officers and key members of management. Compensation expense related to time-based restricted stock awards is equivalent to the grant-date fair value of our Parent’s ordinary shares adjusted for the return of co-investment share and other equity investment amounts, as discussed below, and is being recognized as compensation expense over the service period utilizing graded vesting. At the grant date, we estimated a forfeiture rate of zero based on the limited number of officers and management receiving grants. During the years ended December 31, 2013 and 2012, respectively, 5,996 and 6,778 shares of time-based restricted stock awards were forfeited due to termination of certain employees. As a result, we recorded reductions of $0.8 million and $1.0 million to compensation expense for the years ended December 31, 2013 and 2012, respectively. At this time, we do not expect any significant forfeitures in the foreseeable future or the remaining service period of the related grants.
In addition, our Parent has a call right that gives it the option, but not the obligation, to repurchase vested stock at the then current fair value upon an employee’s termination, or at cost in certain circumstances. In 2013, as the result of certain employee terminations, the Parent repurchased a total of 3,372 previously vested time-based restricted stock awards at cost, resulting in a $0.9 million favorable adjustment to stock-based compensation expense.
The fair values of performance-based restricted stock awards were determined using a combination of a call option and digital option model that incorporated the fair value of our Parent’s ordinary shares, the return on investment targets that must be met, and assumptions about volatility, time until a performance condition will be met, risk-free interest rates and dividend yield. At this time, we do not consider the likelihood of meeting the
79
Table of Contents
performance obligations probable and have, therefore, recorded no compensation cost related to these awards. During the years ended December 31, 2013 and 2012, respectively, 9,368 and 10,651 shares of performance-based restricted stock awards were forfeited due to termination of certain employees.
During the year ended December 31, 2011, certain co-investment shares were issued for a subscription price of $397.2 per share, while during the year ended December 31, 2012, there were no co-investment shares issued. During the year ended December 31, 2013, a total of 779 co-investment shares were issued for a subscription price of $0.01 per share. All of such shares are referred to herein as the “Co-Invest Shares”. Our Incentive Shares are issued for a subscription price of $0.01 per share.
Our Parent is a private company with no active public market for its ordinary shares. For grants made on June 17, 2010 and through the third quarter of 2010, the awards were valued using a share price derived from the purchase price of the acquired assets and liabilities on that date. For grants awarded in the fourth quarter of 2010 and through 2013, our Parent determined the estimated per share fair value of its ordinary shares using a contemporaneous valuation consistent with the American Institute of Certified Public Accountants 2013 Guide, “Valuation of Privately-Held Company Equity Securities Issued as Compensation” (the “Guide”). In conducting this valuation, our Parent considered all objective and subjective factors that it believed to be relevant, including its best estimate of its business condition, prospects, and operating performance. Within this contemporaneous valuation, a range of factors, assumptions, and methodologies were used. The significant factors included:
| • | the fact that we and our Parent were private companies with illiquid securities; |
| • | our historical operating results; |
| • | our discounted future cash flows, based on our projected operating results; |
| • | valuations of comparable public companies; and |
| • | the risk involved in the investment, as related to earnings stability, capital structure, competition and market potential. |
For the contemporaneous valuation of our Parent’s ordinary shares, management estimated, as of the grant date, our enterprise value on a continuing operations basis, using the income and market approaches, as described in the Guide. The income approach utilized the discounted cash flow (“DCF”) methodology based on our financial forecasts and projections, as detailed below. The market approach utilized the Guideline Public Company and Guideline Transactions methods, as detailed below.
For the DCF methodology, we prepared annual projections of future cash flows through 2018. Beyond 2018, projected cash flows through the terminal year were projected at long-term sustainable growth rates consistent with long-term inflationary and industry expectations. Our projections of future cash flows were based on our estimated net debt-free cash flows and were discounted to the valuation date using a weighted-average cost of capital estimated using market participant assumptions.
For the Guideline Public Company and Guideline Transactions methods, we identified a group of comparable public companies and recent transactions within the chemicals industry. For the comparable companies, we estimated market multiples based on trading prices and trailing 12 months EBITDA and projected future EBITDA. We then calculated a rolling two year average of these multiples, which were applied to our trailing 12 months and projected EBITDA. When selecting comparable companies, consideration was given to industry similarity, their specific products offered, financial data availability and capital structure.
For the comparable transactions, we estimated market multiples based on prices paid for the related transactions and trailing 12 months EBITDA. These multiples were then applied to our trailing 12 months EBITDA. The results of the market approaches corroborated the fair value determined using the income approach.
80
Table of Contents
Asset Impairments
As of December 31, 2013, net property, plant and equipment totaled $606.4 million, net identifiable finite-lived intangible assets totaled $171.5 million and goodwill totaled $37.3 million. Management makes estimates and assumptions in preparing the financial statements for which actual results will emerge over long periods of time. This includes the recoverability of long-lived assets employed in the business. These estimates and assumptions are closely monitored by management and periodically adjusted as circumstances warrant. For instance, expected asset lives may be shortened or impairment recorded based on a change in the expected use of the asset or performance of the related asset group.
We evaluate long-lived assets and finite-lived identifiable intangible assets for impairment whenever events or changes in circumstances indicate that the carrying amount of an asset or asset groupings may not be recoverable. When undiscounted future cash flows are not expected to be sufficient to recover an asset’s carrying amount, the asset is written down to its fair value based on a discounted cash flow analysis utilizing market participant assumptions.
During the three months ended December 31, 2013, we determined that the long-lived assets at our polycarbonate manufacturing facility in Stade, Germany should be assessed for impairment driven primarily by continued losses experienced in our polycarbonate business. This assessment indicated that the carrying amount of the long-lived assets at this facility were not recoverable when compared to the expected undiscounted cash flows of our polycarbonate business. Based upon our assessment of fair value of this asset group, we concluded these assets were fully impaired as of December 31, 2013. The fair value of the asset group was determined under the income approach utilizing a discounted cash flow (“DCF”) model. The key assumptions used in the DCF model included growth rates and cash flow projections, discount rate, tax rate and an estimated terminal value.
As a result, in the year ended December 31, 2013, we recorded an impairment loss of approximately $9.2 million. The amount was recorded within “Selling, general and administrative expenses” in the consolidated statement of operations and allocated entirely to the Engineered Polymers segment.
Aside from the discussion above, we have continued to assess the recoverability of certain of our assets, and concluded there are no events or circumstances identified by management that would indicate these assets are not recoverable. However, the current environment is subject to changing market conditions and requires significant management judgment to identify the potential impact to our assessment. If we are not able to achieve certain actions or our future operating results do not meet our expectations, it is possible that impairment charges may need to be recorded on one or more of our operating facilities.
Long-lived assets to be disposed of by sale are classified as held for sale and are reported at the lower of carrying amount or fair value less cost to sell, and depreciation is ceased. Long-lived assets to be disposed of other than by sale are classified as held and used until they are disposed.
Our goodwill impairment testing is performed annually as of October 1st. We will perform more frequent impairment tests should events or changes in circumstances indicate that the fair value of a reporting unit has more likely than not declined below its carrying value. Impairment testing for goodwill is done at a reporting unit level.
We determined that as of our annual assessment date of October 1, 2013, each of our reporting units had fair values that substantially exceeded the carrying values indicating that none of our goodwill is impaired.
An impairment loss generally would be recognized when the carrying amount of the reporting unit’s net assets exceeds the estimated fair value of the reporting unit. The estimated fair value of a reporting unit is determined using a discounted cash flow analysis. At December 31, 2013, our $37.3 million in total goodwill is allocated as follows to our reportable segments: $14.9 million to Latex, $10.2 million to Synthetic Rubber, $8.7 million to Styrenics and $3.5 million to Engineered Polymers.
81
Table of Contents
Factors which could result in future impairment charges, among others, include changes in worldwide economic conditions, changes in technology, changes in competitive conditions and customer preferences, and fluctuations in foreign currency exchange rates. These risk factors are discussed in Item 7A- Quantitative and Qualitative Disclosures about Market Risk and Item 1A- Risk Factors included in this Annual Report.
Income Taxes
We account for income taxes using the asset and liability method. Under this method, deferred tax assets and liabilities are recognized for the future tax consequences of temporary differences between the carrying amounts and tax bases of assets and liabilities using enacted rates. The effect of a change in tax rates on deferred taxes is recognized in income in the period that includes the enactment date. Deferred taxes are provided on the outside basis differences and unremitted earnings of subsidiaries outside of Luxembourg. All undistributed earnings of foreign subsidiaries and affiliates are expected to be repatriated at December 31, 2013. Based on the evaluation of available evidence, both positive and negative, we recognize future tax benefits, such as net operating loss carryforwards and tax credit carryforwards, to the extent that realizing these benefits is considered to be more likely than not.
At December 31, 2013, we had a net deferred tax asset balance of $77.7 million, after valuation allowances of $50.4 million. In evaluating the ability to realize the deferred tax assets, we rely on, in order of increasing subjectivity, taxable income in prior carryback years, the future reversals of existing taxable temporary differences, tax planning strategies and forecasted taxable income using historical and projected future operating results. At December 31, 2013, we had deferred tax assets for tax loss carryforward of approximately $39.3 million, $0.9 million of which is subject to expiration in the years between 2014 and 2018. We continue to evaluate our historical and projected operating results for several legal entities for which we maintain valuation allowances on net deferred tax assets.
We are subject to income taxes in Luxembourg, the United States and numerous foreign jurisdictions, and are subject to audit within these jurisdictions. Therefore, in the ordinary course of business there is inherent uncertainty in quantifying our income tax positions. The tax provision includes amounts considered sufficient to pay assessments that may result from examinations of prior year tax returns; however, the amount ultimately paid upon resolution of issues raised may differ from the amounts accrued. Since significant judgment is required to assess the future tax consequences of events that have been recognized in our financial statements or tax returns, the ultimate resolution of these events could result in adjustments to our financial statements and such adjustments could be material. Therefore, we consider such estimates to be critical in preparation of our financial statements.
The financial statement effect of an uncertain income tax position is recognized when it is more likely than not, based on the technical merits, that the position will be sustained upon examination. Accruals are recorded for other tax contingencies when it is probable that a liability to a taxing authority has been incurred and the amount of the contingency can be reasonably estimated. Uncertain income tax positions have been recorded in “Other noncurrent obligations” in the consolidated balance sheets for the periods presented.
Management judgment is required in determining our provision for income taxes, our deferred tax assets and liabilities, and any valuation allowance recorded against our deferred tax assets. The valuation allowance is based on our estimates of future taxable income and the period over which we expect the deferred tax assets to be recovered. Our assessment of future taxable income is based on historical experience and current and anticipated market and economic conditions and trends. In the event that actual results differ from these estimates or we adjust our estimates in the future, we may need to adjust our valuation allowance, which could materially impact our financial position and results of operations.
82
Table of Contents
Off-balance Sheet Arrangements
We do not have any off-balance sheet arrangements.
Recent Accounting Pronouncements
We describe the impact of recent accounting pronouncements in Note B to the consolidated financial statements, included elsewhere within this Annual Report.
| Item 7A. | Quantitative and Qualitative Disclosures About Market Risk |
We are exposed to changes in interest rates and foreign currency exchange rates because we finance certain operations through fixed and variable rate debt instruments and denominate our transactions in a variety of foreign currencies. We are also exposed to changes in the prices of certain commodities that we use in production. Changes in these rates and commodity prices may have an impact on future cash flow and earnings. We manage these risks through normal operating and financing activities and, when deemed appropriate, through the use of derivative financial instruments. We do not enter into financial instruments for trading or speculative purposes.
By using derivative instruments, we are subject to credit and market risk. The fair market value of the derivative instruments is determined by using valuation models whose inputs are derived using market observable inputs, including interest rate yield curves, as well as foreign exchange and commodity spot and forward rates, and reflects the asset or liability position as of the end of each reporting period. When the fair value of a derivative contract is positive, the counterparty owes us, thus creating a receivable risk for us. We are exposed to counterparty credit risk in the event of non-performance by counterparties to our derivative agreements. We minimize counterparty credit (or repayment) risk by entering into transactions with major financial institutions of investment grade credit rating.
Our exposure to market risk is not hedged in a manner that completely eliminates the effects of changing market conditions on earnings or cash flow.
Interest Rate Risk
Given the leveraged nature of our Company, we have exposure to changes in interest rates. From time to time, we may execute a variety of interest rate derivative instruments to manage interest rate risk.
We use interest rate cap agreements to protect cash flows from fluctuations caused by volatility in interest rates. At December 31, 2012, we had three outstanding interest rate caps with an aggregate notional amount of $490.0 million, representing 39.5% of the $1,239.0 million of the then outstanding Term Loans under the Senior Secured Credit Facility. These agreements all were settled in January 2013, and no interest rate caps were outstanding as of December 31, 2013.
Our interest rate risk management strategy is to use derivative instruments to minimize significant unanticipated earnings fluctuations that may arise from volatility in interest rates of our borrowings and to manage the interest rate sensitivity of our debt. At December 31, 2012, the non-current asset associated with interest rate agreements was recorded on the balance sheet in deferred charges and other assets at fair value. We do not account for the interest rate cap agreements as hedges. As such, changes in the fair value of derivative instruments are recognized in interest expense, net. At December 31, 2012, the interest rate caps had a fair value of approximately less than $0.1 million.
83
Table of Contents
In January 2013, we amended our Senior Secured Credit Facility, wherein we decreased the borrowing rate of the Revolving Facility through a decrease in the applicable margin rate from 4.75% to 3.00% as applied to base rate loans (which shall bear interest at a rate per annum equal to the base rate plus the applicable margin (as defined therein)), or 5.75% to 4.00% as applied to LIBO rate loans (which shall bear interest at a rate per annum equal to the LIBO rate plus the applicable margin plus the mandatory cost (as defined therein), if applicable). The Senior Notes that we issued in January 2013 carry a fixed interest rate of 8.75%.
During 2013, we had borrowings under the Revolving Facility, on which we incurred interest charges subject to the rates discussed above. Based on the weighted-average outstanding borrowings under the Revolving Facility throughout the year ended December 31, 2013, an increase of 100 basis points in the LIBO rate would have resulted in approximately $0.2 million of additional interest expense for the period. As of December 31, 2013, we had no variable rate debt issued under our Senior Secured Credit Facility, including no amounts outstanding under the Revolving Facility.
Our Accounts Receivable Securitization Facility is subject to interest charges against both the amount of outstanding borrowings as well as the amount of available, but undrawn commitments under the Accounts Receivable Securitization Facility. In regards to outstanding borrowings on the Accounts Receivable Securitization Facility, fixed interest charges are 2.6% plus variable commercial paper rates which vary by month and by currency as outstanding Account Receivable Securitization Facility balances can be denominated in euro and U.S. dollar. In regards to available, but undrawn commitments under the Accounts Receivable Securitization Facility, fixed interest charges are 1.4%. Based on the weighted-average outstanding borrowings under the Accounts Receivable Securitization Facility throughout the year ended December 31, 2013, an increase of 100 basis points in variable commercial paper rates would have resulted in approximately $0.9 million of additional interest expense for the period. As of December 31, 2013, there were no outstanding borrowings and there was $143.8 million of availability under the Accounts Receivable Securitization Facility.
Foreign Currency Risks
We are also exposed to market risk from changes in foreign currency exchange rates which could affect operating results as well as our financial position and cash flows. We manage our transaction risk where possible by paying expenses in the same currency in which we generate sales in a particular country. We may employ derivative contracts in the future which are not designated for hedge accounting treatment which may result in volatility to earnings depending upon fluctuations in the underlying markets. As of December 31, 2012, we had three open foreign exchange forward contracts to buy and sell euro currency with an aggregate net notional U.S. dollar equivalent of $82.0 million. These contracts were settled in February and May 2013. As of December 31, 2013, we had no open foreign exchange forward contracts.
Our foreign currency exposures include the euro, British pound, Chinese renminbi, Indian rupee, Korean won, Japanese yen, Brazilian real and Swedish krona. The primary foreign currency exposure relates to the U.S. dollar to euro exchange rate.
We have legal entities consolidated in our financial statements that have functional currencies other than U.S. dollar, our reporting currency. As a result of currencies fluctuating against the U.S. dollar, currency translation gains and losses are recorded in other comprehensive income primarily as a result of the remeasurement of our euro functional legal entities as of December 31, 2013 and December 31, 2012.
Commodity Price Risk
We purchase certain raw materials such as benzene, ethylene, butadiene, BPA and styrene under short- and long-term supply contracts. The purchase prices are generally determined based on prevailing market conditions. Changing raw material and energy prices have had material impacts on our earnings and cash flows in the past and will likely continue to have significant impacts on our earnings and cash flows in future periods.
84
Table of Contents
We do not currently enter into derivative financial instruments for trading or speculative purposes to manage our commodity price risk relating to our raw material contracts. In the future, it is possible we will enter into derivative financial instruments to manage our commodity risk relating to our raw material contracts.
| Item 8. | Financial Statements and Supplementary Data |
The financial statements and supplementary data required by Regulation S-X are included in Item 15- Exhibits, Financial Statements Schedules contained in Part IV of this Annual Report.
| Item 9. | Changes in and Disagreements with Accountants on Accounting and Financial Disclosure |
None.
| Item 9A. | Controls and Procedures |
Evaluation of Disclosure Controls and Procedures
Our management is responsible for establishing and maintaining internal controls designed to provide reasonable assurance that information required to be disclosed by us in our reports that we file or submit under the Exchange Act (as defined in Rules 13a-15(e) and 15d-15(e) of the Securities Exchange Act of 1934, as amended) is recorded, processed, summarized and reported within the time periods specified in the SEC’s rules and forms, and that such information is accumulated and communicated to our management, with the participation of our Chief Executive Officer and Chief Financial Officer, as appropriate, to allow timely decisions regarding required disclosures. Based on that evaluation, the Chief Executive Officer and Chief Financial Officer concluded that our disclosure controls and procedures as of the end of the period covered by this Annual Report were effective.
Management’s Annual Report on Internal Control over Financial Reporting
This Annual Report does not include a report of management’s assessment regarding internal control over financial reporting due to a transition period established by rules of the Securities and Exchange Commission for newly public companies.
Changes in Internal Control over Financial Reporting
There was no change in our internal control over financial reporting (as defined in Rules 13a-15(f) and 15d-15(f) of the Exchange Act) that occurred during the year ended December 31, 2013 that has materially affected, or is reasonably likely to materially affect, our internal control over financial reporting.
| Item 9B. | Other Information |
None.
85
Table of Contents
| Item 10. | Directors, Executive Officers and Corporate Governance |
Below is a list of the names and ages of the directors and executive officers of Trinseo and a brief account of the business experience of each of them. The business address of most of Trinseo’s executives is 1000 Chesterbrook Boulevard, Suite 300, Berwyn, Pennsylvania 19312.
| Name |
Age | Position | ||||
| Christopher D. Pappas |
58 | Director, President & Chief Executive Officer | ||||
| John A. Feenan |
53 | Executive Vice President and Chief Financial Officer | ||||
| Curtis S. Shaw |
65 | Executive Vice President, General Counsel and Corporate Secretary | ||||
| Marilyn N. Horner |
56 | Senior Vice President—Human Resources | ||||
| Marco Levi |
54 | Senior Vice President—Business President, Emulsion Polymers | ||||
| Martin Pugh |
61 | Senior Vice President—Business President, Plastics | ||||
| E. Jeffery Denton |
48 | Vice President—Shared Services and Feedstocks | ||||
| Catherine C. Maxey |
47 | Vice President—Public Affairs, Sustainability and Environment, Health and Safety | ||||
| David Stasse |
43 | Vice President—Treasurer | ||||
| Brian W. Chu |
43 | Director | ||||
| Ailbhe M. Jennings |
50 | Director | ||||
| Seth A. Meisel |
41 | Director | ||||
| Michel G. Plantevin |
57 | Director | ||||
| Stephen M. Zide |
53 | Director | ||||
Our Directors
We believe that our board of directors is, and we intend that it continue to be, composed of individuals with sophistication and experience in many substantive areas that impact our business. We believe that all of our current board members possess the professional and personal qualifications necessary for board service, and have highlighted the specific experience, qualifications, attributes, and skills that led to the conclusion that each board member should serve as a director in the individual biographies below.
Christopher D. Pappas, Director, President & Chief Executive Officer. Mr. Pappas, 58, joined the Company as President & Chief Executive Officer in June 2010. Prior to joining the Company, Mr. Pappas held a number of executive positions at NOVA Chemicals of increasing responsibility from July 2000 to November 2009, most recently as President and Chief Executive Officer of NOVA Chemicals from May 2009 to November 2009, President & Chief Operation Officer from October 2006 to April 2009 and Vice President and President of Styrenics from July 2000 to September 2006. Before joining NOVA Chemicals, Mr. Pappas was Commercial Vice President of DuPont Dow Elastomers where he joined as Vice President of ethylene elastomers in 1995. Mr. Pappas began his chemicals career in 1978 with Dow where he held various sales and managerial positions until 1995. Mr. Pappas is currently a member of the Board of Directors of FirstEnergy Corp., and he is a former member of the Board of Directors of Allegheny Energy, NOVA Chemicals, and Methanex Corp. Mr. Pappas holds a Bachelor of Science degree in Civil Engineering from the Georgia Institute of Technology and an MBA from the Wharton School of Business at The University of Pennsylvania. Mr. Pappas is highly qualified to serve on the board by his more than 30 years of management experience with major companies in the chemical industry, by his previous service as a director of the corporations noted above, and by his leadership of the Company since its formation. In these roles he has also acquired and demonstrated substantial financial expertise which is valuable to the Company’s board.
Brian W. Chu, Director. Mr. Chu, 43, became a director of our Company in 2013. Mr. Chu is currently an Operating Partner in the Portfolio Group of Bain Capital Partners, LLC, having joined the firm in 2007. Prior to joining Bain Capital, he was a Vice President and General Manager at The Boston Beer Company. Previously, he
86
Table of Contents
was a Manager at Bain & Company, where he worked in a variety of industries including consumer products, industrial manufacturing, technology and health care. Prior to Bain & Company, Mr. Chu held several financial and IT positions in the health care industry. Mr. Chu received an MBA from the Sloan School of Management at Massachusetts Institute of Technology and a B.S. in Mechanical Engineering from Worcester Polytechnic Institute. Mr. Chu brings to the board extensive knowledge and expertise in strategy, operations, and finance gained from his experience as a strategy consultant at Bain & Company, his positions at Boston Beer Company, and his position in the Portfolio Group of Bain Capital Partners, LLC. Mr. Chu has been highly involved with our Company since the Acquisition.
Ailbhe M. Jennings, Director. Ms. Jennings, 50, has served as a member of our board of directors since the Acquisition. She has also served, on a part time basis, as Corporate Manager at Bombardier since 2002 and BMO Nesbitt Burns Trading Corp SA from 2002 to 2012. Since 2004, Ms. Jennings has served as a non-executive director on the board of Element Six S.A. Ms. Jennings has been employed by Bain Capital Luxembourg since 2002 and is on the boards of all of Bain Capital’s Luxembourg companies. Prior to joining Bain Capital in 2002, Ms. Jennings was a deputy managing director and finance director at Banque Pictet, Luxembourg. Prior to this she was a senior audit manager and a Luxembourg Réviseur d’Entreprises with KPMG Luxembourg. Ms. Jennings has 27 years professional experience in the Luxembourg financial services sector. She is a Fellow of the Institute of Chartered Accountants in Ireland and holds an MBA from The Open University (UK). Ms. Jennings brings to the board significant audit experience and broad knowledge of accounting.
Seth A. Meisel, Director. Mr. Meisel, 41, became a director of our Company in January 2011. Mr. Meisel is a Managing Director at Bain Capital Partners, LLC, where he has been employed since 1999. Prior to joining Bain Capital, Mr. Meisel worked as a consultant and manager at Mercer Management Consulting in the industrial, financial services and retail industries. Mr. Meisel also serves on the Board of Directors of Unisource Worldwide, Inc. Apex Tool Group, and Consolidated Container Company. Mr. Meisel formerly served on the board of Sensata Technologies. Mr. Meisel received an MBA from Harvard Business School where he was a Baker Scholar and an undergraduate degree from Princeton University. Mr. Meisel brings to the board broad knowledge of, and expertise in, mergers, acquisitions and financing. In addition, Mr. Meisel has had significant involvement with the Company since the Acquisition, and has served as a director of numerous public and private companies during his career in private equity and consulting.
Michel G. Plantevin, Director. Mr. Plantevin, 57, has served as a member of our board of directors since the Acquisition in 2010. Mr. Plantevin is a Managing Director of Bain Capital Europe, LLP. Prior to joining Bain Capital in 2003, Mr. Plantevin was a Managing Director of Goldman Sachs International in London, initially in the Investment Banking division, then in the Merchant Banking division (PIA). Prior to Goldman Sachs International, he was a consultant with Bain & Company in London and later headed the Bain & Company Paris Office as a Managing Director. He also serves as a director of Bravida AB, NXP Semiconductors N.V. Maisons du Monde and IMCD. Mr. Plantevin received an MBA from Harvard Business School and an undergraduate and Master’s degree in Engineering from the Ecole Supérieure d’ Electricité (Supélec) in France. Mr. Plantevin brings to the board an expertise in business strategy and operational improvement gained from his extensive experience as a strategy consultant in the Paris and London offices of Bain & Company and then as a private equity professional. Mr. Plantevin has also had significant involvement with our Company since the Acquisition, and has served as a director of numerous public and private companies during his career in private equity, investment banking and consulting.
Stephen M. Zide, Director. Mr. Zide, 53, became a director of our Company in 2010 upon consummation of the Acquisition. Mr. Zide is a Managing Director of Bain Capital Partners, LLC in the private equity business, having joined the firm in 1997. He currently heads the firm’s New York office and leads its North American Industrial Sector. Prior to joining Bain Capital, Mr. Zide was a partner of the law firm of Kirkland & Ellis LLP. He currently serves as a director of Sensata Technologies B.V., HD Supply, Consolidated Container Corporation, and Apex Tool Group. Mr. Zide formerly served on the board of Innophos Holdings, Inc. Mr. Zide received an MBA from Harvard Business School, a J.D. from Boston University School of Law and a B.A. from the University of Rochester. Mr. Zide brings to the board extensive knowledge and expertise in strategy, mergers,
87
Table of Contents
and acquisitions gained from his training and experience as a legal advisor and then as a private equity professional. In addition, Mr. Zide has had significant involvement with the Company since the Acquisition, and has served as a director of numerous public and private companies during his career in private equity and law.
Our Executive Officers
Biographical information concerning our President and Chief Executive Officer, who also serves as a member of our board of directors, is set forth above under “—Our Directors.”
John A. Feenan, Executive Vice President and Chief Financial Officer. Mr. Feenan, 53, joined the Company in January 2012 as Executive Vice President and Chief Financial Officer. He is responsible for corporate financial reporting, audit, treasury, tax and internal controls. Previously, Mr. Feenan served as Senior Vice President and Chief Financial Officer of the JMC Steel Group, from February 2007 until January 2012, where he also served as a member of the disclosure, compliance, pension and ethics committees and an active participant in the Board and audit committees. Prior to that, Mr. Feenan served as Senior Vice President and Chief Financial Officer at HB Fuller, a global specialty chemical firm, from March 2003 until January 2007. Prior to HB Fuller, Mr. Feenan held Chief Financial Officer positions with several industrial manufacturing firms. He started his career at the IBM Corporation in New York. Mr. Feenan earned his bachelor’s degree in business and economics from St. Anselm College and his master’s in business administration from the University of North Carolina, Chapel Hill. He is a Certified Management Accountant (CMA) and a Certified Green Belt, Lean Six Sigma.
Curtis S. Shaw, Executive Vice President, General Counsel and Corporate Secretary. Mr. Shaw, 65, joined the Company as Executive Vice President and General Counsel in July 2010 and was given the added responsibility of Corporate Secretary in May 2012. He is responsible for all legal affairs for Trinseo as well as corporate development and mergers and acquisitions, and is a member of the Trinseo Executive Leadership Team. Previously he served as Executive Vice President, General Counsel and Corporate Secretary of Celanese Corporation from April 2005 to March 2009. Prior to that, Mr. Shaw served as Executive Vice President, General Counsel and Secretary of Charter Communications from 2003 to April 2005, and, prior thereto, as its Senior Vice President, General Counsel and Secretary from 1997 to 2003. He served as Corporate Counsel at NYNEX Corporation from 1988 to 1996. Mr. Shaw joined Occidental Chemical Corporation in 1983, where he served in positions of increasing responsibility until 1987, culminating with the position of Vice President and General Counsel of the Electrochemicals, Detergents & Specialty Chemicals Division. Prior thereto, he served in various legal roles at Olin Corporation. He began his career in private practice at Mudge Rose Guthrie & Alexander and at Shearman & Sterling from 1973 to 1980. Mr. Shaw received a J.D. degree from Columbia University School of Law in 1973, and B.A. degree with honors in Economics from Trinity College in 1970.
Marilyn N. Horner, Senior Vice President—Human Resources. Ms. Horner, 56, joined the Company as Senior Vice President of Human Resources in January 2011. Prior to joining the Company Ms. Horner held a number of executive positions at NOVA Chemicals where she started her career in 1988. Most recently she served as the Senior Vice President and Chief Human Resources Officer for NOVA Chemicals from 2008 to December 2010. Ms. Horner also held the positions of Vice President Finance and Controller, Olefins / Polyolefins Division; Vice President Human Resources and Organizational Effectiveness; and Vice President to the Chief Executive Officer. Ms. Horner served on the board of trustees for Point Park University and the University of Alberta. Ms. Horner holds a Bachelor of Commerce degree and an MBA from the University of Windsor, Ontario, Canada.
Marco Levi, Senior Vice President—Business President, Emulsion Polymers. Mr. Levi, 54, joined the Company as Vice President—General Manager in June 2010 and is responsible for the global leadership of the Company’s Emulsion Polymers business. Previously, Mr. Levi was General Manager, Emulsion Polymers of Styron (when it was a Dow division) from July 2009 until June 2010. Prior to that, Mr. Levi was global business unit director for Dow Elastomers and Specialty Plastics from February 2008 until July 2009, (and Plastic
88
Table of Contents
Additives commencing in April 2009). Mr. Levi previously served as global business director for Elastomers at Dow from November 2006 until February 2008. In these roles, he was responsible for the Elastomers, Plastic Additives, Specialty Packaging and Films and Synthetic Rubber businesses. Prior to that, he was sales director for Thermoset from March 2004 until November 2006. Mr. Levi received a bachelor’s degree in industrial chemistry from the Università degli Studi in Milan, Italy, in 1984.
Martin Pugh—Senior Vice President and Business President, Plastics. Mr. Pugh, 61, joined Styron on March 1, 2013 as Senior Vice President and Business President, Plastics, located in Horgen, Switzerland. Mr. Pugh is responsible for the global leadership of the Company’s Plastics business with overall accountability for Styrenic Polymers, Automotive and Polycarbonate Compounds and Blends (PCC&B). Prior to joining Styron, Mr. Pugh held the position of President for Europe Middle East Africa (EMEA) and board member for Styrolution Group Gmbh, the global styrenics joint venture between BASF and INEOS from October 2011 until February 2013. Mr. Pugh began his career in 1975 with Mobil Oil Company as a technical representative. He joined The Dow Chemical Company in 1978 and served in a variety of sales and marketing roles from 1978 until 1998, working in the UK, Dubai, Sweden and Switzerland. His final role at Dow was global business director for Specialty Polyethylenes. In 1998, Pugh joined Elementis plc as Managing Director for the specialty rubber division called Linatex. In 2002, he returned to Switzerland and joined Nova Chemicals as Managing Director for Europe. Following the formation of Nova Innovene in 2005, he was appointed Managing Director of the company and continued in the role of Managing Director—Europe as the company was broadened to include the Americas region and renamed INEOS Nova. He remained in this position within INEOS Nova and INEOS Styrenics until the formation of Styrolution Group GmbH in October 2011. Mr. Pugh has a Bachelor of Science degree in Industrial Chemistry and Management Studies from Loughborough University in the United Kingdom.
E. Jeffery Denton, Vice President—Shared Services and Feedstocks. Mr. Denton, 48, joined the Company as Vice President—Shared Services and Feedstocks in June 2010 and is responsible for the Company’s feedstocks, purchasing and shared service operations. He previously served in a similar role at Styron (when it was a division of Dow) from September 2009 until June 2010 and as the Director of Joint Venture Implementation at Dow, implementing Americas Styrenics & K-Dow from February 2006 until September 2009. Prior to that, he served as Product Director of Dow Polystyrene and Commercial Manager of Dow Polystyrene and Engineering Plastics from 1998 to January 2007. Mr. Denton received a bachelor’s degree in business administration from Alma College.
Catherine C. Maxey, Vice President—Public Affairs, Sustainability and Environment, Health and Safety. Ms. Maxey, 47, joined the Company as Vice President—Public Affairs and Business Intelligence in June 2010. Previously she held positions of increasing responsibility at The Dow Chemical Company, which she joined in 1988, most recently as Public Affairs director for Mergers & Acquisitions, Joint Ventures, Dow Portfolio Optimization/Divestitures and Manufacturing and Engineering from March 2009 until June 2010. Prior to that, she served as vice president of Public Affairs and Communications for K-Dow Petrochemicals, a planned JV that was later cancelled from June 2008 until March 2009 and Business Public Affairs Director for Performance Chemicals from 2003 to June 2008. She formerly served on the board of the Literacy Council of Midland County. Ms. Maxey received a bachelor’s degree in journalism/science writing from Lehigh University.
David Stasse, Vice President—Treasurer. Mr. Stasse, 43, joined the Company as Vice President and Treasurer in July 2013 with responsibility for all treasury matters, including cash management, risk management, relationships with rating agencies and commercial banks, and financing matters. Mr. Stasse joins the Company from Freescale Semiconductor, Inc., a global semiconductor manufacturer that serves the automotive, networking, consumer and industrial markets, where he served as Vice President and Treasurer since July 2008, and Assistant Treasurer from August 2006 to July 2008. Prior to that, Mr. Stasse served as First Vice President, Debt Capital Markets of MBNA Corporation and as Treasury Manager of SPX Corporation. Mr. Stasse also held numerous financial positions from 1998 to 2004 at Honeywell International, last serving as Director, Corporate Finance. Mr. Stasse holds a MBA in Finance from the University of Maryland and a Bachelor of Science degree in Business Logistics from Penn State University.
89
Table of Contents
Board Composition and Election of Directors
Our board of directors consists of six directors, with each director having been appointed to six year terms. Each director is re-eligible to serve and may be removed at any time, with or without cause, by a resolution of our shareholder at a general meeting. All appointments to the board of directors will be decided by the shareholder at a general meeting. If the office of a director becomes vacant, the other directors, acting by a simple majority, may fill the vacancy on a provisional basis until a new director is appointed by the shareholder at the next general meeting.
Family Relationships
There are no family relationships between any of our executive officers or directors.
Director Independence
We are privately owned. As a result, we are not required to, and do not, have any independent directors.
Board Structure
Our governance structure combines the roles of President and Chief Executive Officer. The board of directors continues to believe there are important advantages to Mr. Pappas serving in both roles at this time. Mr. Pappas is the director most familiar with our business and industry and is best situated to propose the board of directors’ agendas and lead board discussions on important matters. Mr. Pappas provides a strong link between management and the board of directors, which promotes clear communication and enhances strategic planning and implementation of corporate strategies.
Our board of directors monitors our exposure to a variety of risks through our audit committee. Our audit committee charter gives the audit committee responsibilities and duties that include discussing with management, the internal audit department and the independent auditors our major financial risk exposures and the steps management has taken to monitor and control such exposures, including our risk assessment and risk management policies.
Audit Committee
The audit committee is responsible for overseeing: (i) our accounting and reporting practices and compliance with legal and regulatory requirements regarding such accounting and reporting practices; (ii) the quality and integrity of our financial statements; (iii) our internal control and compliance programs; (iv) our independent auditors’ qualifications and independence and (v) the performance of our independent auditors and our internal audit function. In so doing, the audit committee maintains free and open means of communication between our directors, internal auditors and management.
Our audit committee consists of Brian Chu, Seth Meisel and Michel Plantevin, Chairman.
As we do not have publicly traded equity outstanding, we are not required to have and we do not have an “audit committee financial expert” within the meaning of Item 407(d)(5) of Regulation S-K.
Compensation Committee
The compensation committee is responsible for reviewing and approving the compensation of our executive officers and directors and our performance plans and other compensation plans. The compensation committee makes recommendations to our board of directors in connection with such compensation and performance plans.
Our compensation committee consists of Michel Plantevin and Stephen Zide.
90
Table of Contents
Compensation Committee Interlocks and Insider Participation
The members of the Compensation Committee who served during 2013 are Mr. Zide and Mr. Plantevin. There were no interlocks or insider participation between any member of our board of directors or compensation committee and any member of the board of directors or compensation committee of any other company, nor has any interlocking relationship existed in the past.
Nominating and Corporate Governance Committee
The nominating and corporate governance committee is responsible for (i) identifying, screening and reviewing individuals qualified to serve as directors (consistent with criteria approved by our board of directors) and recommending to our board candidates for nomination for election at the annual meeting of shareholders or to fill board vacancies or newly created directorships; (ii) developing and recommending to our board of directors and overseeing the implementation of our corporate governance guidelines (if any); (iii) overseeing evaluations of our board of directors and (iv) recommending to our board of directors candidates for appointment to board committees.
Our nominating and corporate governance committee consists of Christopher Pappas and Stephen M. Zide.
Operating Committee
Our operating committee is responsible for developing our overall business plan and defining and implementing our business strategy. The committee makes recommendations to our board of directors in connection with our operational business matters.
Our operating committee consists of Brian Chu, Seth Meisel, Christopher Pappas, Michel Plantevin, and Stephen Zide.
Code of Business Conduct
We have adopted a Code of Business Conduct applicable to all of our directors, officers and employees, and a Code of Financial Ethics applicable to our principal executive, financial and accounting officers, and all persons performing similar functions. A copy of each of those Codes is now and will continue to be available on our corporate website at www.styron.com under Investor Relations—Corporate Governance. If we make any substantive amendments to these Codes, or grant any waivers, including any implicit waivers from the provisions of these Codes, we will make a disclosure on our website or in a report on Form 8-K. Our Code of Business of Conduct is supported by a number of subsidiary policies which are specifically referenced in the Code, and several of which are also available on our corporate website. Our website and the information contained on that site, or accessible through that site, are not incorporated into and are not a part of this Annual Report.
We maintain an ethics and compliance committee, which is responsible for assisting our audit committee and Chief Compliance Officer in developing, implementing, supervising and maintaining our Code of Business Conduct and related corporate policies.
The ethics and compliance committee consists of eight members of our management and is chaired by Suzanne Kersten, our Chief Compliance Officer.
91
Table of Contents
| Item 11. | Executive Compensation |
Compensation Discussion and Analysis
This compensation discussion and analysis section is intended to provide information about our 2013 compensation objectives and programs for our named executive officers. For 2013, our named executive officers, or NEOs, were Christopher D. Pappas, President and Chief Executive Officer; John A. Feenan, Executive Vice President and Chief Financial Officer; Curtis S. Shaw, Executive Vice President, General Counsel and Corporate Secretary; Marco Levi, Senior Vice President and Business President of Emulsion Polymers; and Martin Pugh, Senior Vice President and Business President of Plastics.
Compensation Philosophy and Implementation
Our executive compensation policies and programs are designed to attract, retain and motivate key executives through competitive and cost effective programs that reinforce executive accountability and reward the achievement of business and individual results. Executive compensation consists of four main elements: (a) base salary, (b) annual performance awards, (c) long-term incentive compensation, and (d) retirement savings and benefit programs. The relative weighting of each element is aligned with our philosophy of linking pay to performance. A substantial percentage of executives’ compensation is provided in the form of performance-based variable compensation with a greater emphasis on variable components for the our senior executives. Annual incentive compensation awards are directly linked to corporate and business unit results, and the performance measures are aligned with shareholder and other key stakeholders’ interests, including financial and non-financial goals. Executive retirement and benefits programs are generally consistent with broader employee programs offered in the country where an executive primarily provides services to the Company. We provide limited perquisites to our executives and senior management, and such perquisites are only provided to the extent that they reflect particular business needs and objectives.
Our compensation committee was formed in October 2010. Prior to October 2010, compensation determinations were made primarily by our Chief Executive Officer and/or our Board. Many of the compensation policies and programs for our NEOs that are described below were the product of negotiations between the NEOs and our Chief Executive Officer and/or our Board. The compensation committee is responsible for, among other matters: (1) reviewing key executive compensation goals, policies, plans and programs; (2) reviewing and approving the compensation of our executive officers; (3) reviewing and approving employment agreements and other similar arrangements between the Company and our executive officers; and (4) administering equity based plans and other incentive compensation plans.
Our Chief Executive Officer reviews annually with the compensation committee each NEO’s performance (other than his own) and recommends to the compensation committee appropriate base salary, cash performance awards and long-term equity incentive awards for these NEOs. Based upon the recommendations of our Chief Executive Officer and in consideration of certain objectives and philosophies described above, the compensation committee makes the final recommendation to the Board for annual compensation packages of our executive officers other than our Chief Executive Officer. The compensation committee and/or the Board reviews annually our Chief Executive Officer’s performance and the compensation committee recommends to the Board his base salary, cash performance awards and grants of long-term equity incentive awards based on its assessment of his performance.
The compensation committee has the authority to retain outside independent executive compensation consultants to assist in the evaluation of executive officer compensation. The compensation committee also has the sole authority to retain, at the Company’s expense, and terminate any such consultant, including the sole authority to approve such consultant’s fees and other retention terms. However, all decisions regarding
92
Table of Contents
compensation of executive officers are made by the Board, upon the recommendation of the compensation committee. At this time, no compensation consultant has been retained by the compensation committee, however the compensation committee may consider retaining a compensation consultant as we transition to becoming a public company.
Our Board has adopted a written charter for the compensation committee, which is available on our corporate website at www.trinseo.com. Our website and the information contained on that site or accessible through that site, are not incorporated into and are not a part of this Annual Report.
Management Transition
In March 2013, Martin Pugh was named Senior Vice President and Business President of Plastics located in Horgen, Switzerland. Prior to joining Trinseo, Mr. Pugh was the President for Europe Middle East Africa and board member for Styrolution Group Gmbh, the global styrenics joint venture between BASF Group and Ineos.
Components of Compensation
The principal components of our NEO and other executive compensation include both short-term and long-term compensation. Short-term compensation consists of an executive’s annual base salary and annual cash performance award. Long-term compensation may include grants of share-based incentives as well as cash retention awards, as determined by the Board and the compensation committee. Certain elements of compensation of our NEOs were determined through direct negotiation with the executives at the time of their hiring.
In making decisions with respect to any element of an NEO’s compensation, the compensation committee considered the total compensation that may be awarded to the officer, including salary, annual bonus and long-term incentive compensation. In addition, in reviewing and approving employment agreements for our NEOs, the compensation committee considered the other benefits to which the officer is entitled by the agreement, including compensation payable upon termination of the executive’s employment under a variety of circumstances. Our goal is to award compensation that is competitive to attract and retain highly qualified leaders and motivate high business performance. We believe that our compensation programs align executive and shareholder interests as well as vary compensation based on each executive’s individual contributions to the Company and the Company’s performance.
Base Salary
Setting appropriate levels of base pay ensures that we can attract and retain an executive leadership team that will continue to meet our commitments to customers and sustain profitable growth for our shareholders. The base salaries for our NEOs were determined based on the scope of their responsibilities, taking into consideration our compensation committee members’ collective knowledge of competitive compensation. Base salaries are reviewed annually by the compensation committee and adjusted from time to time to reflect individual responsibilities, performance and experience, as well as market compensation levels. Mr. Pugh was hired in 2013, and his base salary was set by the compensation committee at a level determined to be appropriate given his experience and the base salaries of the other members of our executive team at his level. In 2013, the NEOs, other than Mr. Pugh, received base salary increases. Messrs. Feenan and Shaw received increases consistent with the increases received by other employees in the U.S. and Mr. Levi received an increase in recognition of his overall industry experience and performance, with the amount of such increase determined after taking into account the base salaries of other executive officers. Mr. Pappas received an increase in his base salary as a result of arms-length negotiations in connection with his renegotiated employment agreement. Mr. Pugh’s annual base salary for 2013 was prorated to reflect the period of time he actually worked for Trinseo.
Annual Performance-Based Cash Incentive Plan
We have an annual performance-based cash incentive plan that is designed to serve as an incentive to drive annual financial and non-financial performance. During 2013, the target annual performance bonus under this annual plan for each NEO was based on a percentage of base salary ranging from 150%, in the case of
93
Table of Contents
Mr. Pappas, to 75%, in the case of Mr. Feenan and Mr. Shaw, to 55%, in the case of Mr. Levi and Mr. Pugh. Cash awards are based on a combination of the achievement of Company performance goals as well as individual performance. The performance goals and metrics are recommended by the compensation committee to the Board at the beginning of the year. At the end of the year, the amount paid to each NEO is based on the achievement of the Company performance goals and an assessment of the executive’s overall performance.
For 2013, the annual performance award plan was designed to align our executives’ compensation with the organization’s focus and priorities for the year, and reward performance based on four key metrics:
| • | Responsible Care®: Injuries, Spills and Process Safety Incidents (PSIs), |
| • | EBITDA: excluding joint venture companies’ dividends and reflecting current cost of raw materials, |
| • | Fixed Costs: including selling, administrative, R&D, supply chain, manufacturing, and maintenance expenses, and |
| • | Individual Goals: Performance against preset team/individual goals. |
| Metrics | ||||||||||||||||
| Weight | Not Met | Target | Exceeds | |||||||||||||
| Performance Goal |
||||||||||||||||
| 1. Responsible Care ® |
||||||||||||||||
| Recordable Injuries * |
5 | % | 7 | 5 | 3 | |||||||||||
| Loss of Primary Containment * |
5 | % | 14 | 9 | 4 | |||||||||||
| Process Safety Incidents * |
5 | % | 2 | 1 | 0 | |||||||||||
|
|
|
|
|
|
|
|
|
|||||||||
| Sub-total |
15 | % | 0 | % | 100 | % | 200 | % | ||||||||
|
|
|
|
|
|
|
|
|
|||||||||
| 2. Financial Performance |
||||||||||||||||
| 2013 EBITDA Target (Per 2013 Business Plan) |
50 | % | 0 | % | 125 | % | 230 | % | ||||||||
| 2013 Fixed Costs Target (Per 2013 Business Plan) |
15 | % | 0 | % | 100 | % | N/A | |||||||||
| 3. Individual Goals ** |
20 | % | 0 | % | 100 | % | 200 | % | ||||||||
|
|
|
|
|
|
|
|
|
|||||||||
| Total Opportunity at Target |
100 | % | ||||||||||||||
| Maximum Opportunity |
200 | % | ||||||||||||||
| * | Metrics represent incident count. |
| ** | In 2013, all Individual Goals have an EBITDA component tied to either corporate or business EBITDA; goal carries a weight of up to 40%. (For example, if individual EBITDA goal is weighted at 40%, the goal carries a weight of 8% of the total goals weight (40% of 20%)). |
In 2013, Company performance metrics were based on an adjusted EBITDA target of $356.0 million (excluding dividends from joint venture companies of $23.6 million and $4.4 million in realized losses from foreign exchange forward contracts; and including an adjustment of $40.4 million to reflect current cost of raw materials), Responsible Care® (environmental, health and safety metrics), and a controlled overhead/fixed costs target of $624.0 million. As a company with a substantial amount of indebtedness and volatile raw materials prices, we believe that adjusted EBITDA and controlled overhead/fixed costs are important measures of our financial performance and ability to service our indebtedness and we use them as the target metrics for our annual cash incentive plan. adjusted EBITDA is a non-GAAP measure used internally and is measured by taking net income (loss) and adding back interest charges, income taxes, depreciation and amortization and other adjustments which eliminate the impact of certain items that we do not consider indicative of our ongoing operating performance. Our adjusted EBITDA and controlled overhead/fixed costs financial performance target metrics for the 2013 annual performance awards are set consistent to our 2013 business plan that has been approved by the Board but adjusted to exclude dividends from joint venture companies and reflecting current cost of raw materials. For a discussion of adjusted EBITDA see Item 7—Management’s Discussion and Analysis of Financial Condition and Results of Operations included elsewhere in this Annual Report. In addition to adjusted EBITDA and controlled overhead/fixed costs, we also believe best-in-class environmental, health and safety metrics, as well as individual performance, are important measures for establishing performance objectives and measuring the performance of our NEOs.
94
Table of Contents
We are a Responsible Care® company and our EH&S policy states that protecting people and the environment is part of everything we do and every decision we make. Each employee has a responsibility to ensure that our products and operations meet applicable government or company standards. The 2013 performance award bonus plan includes three (3) key metrics that we track for our company—Recordable Injuries as defined by OSHA, Process Safety Incidents as defined by the American Chemistry Council and Loss of Primary Containment defined as any physical device used to contain a chemical or plastic resin as part of our manufacturing processes. Incentive payouts with respect to these metrics are determined based on our achievement rating for Responsible Care® performance and in accordance with the threshold and target levels set forth in the preceding table.
In 2013, the individual annual objectives established for our NEOs varied depending on the primary areas of responsibility of each NEO as well as common areas of emphasis, which include customer growth and strategy, financial goals including revenue generation, cost control, margin improvement and cash management, and non-financial goals including people leadership, performance management and compliance. We set the NEOs’ individual objectives at a level that is intended to be achievable, but challenging. The individual objectives for our NEOs in 2013 focused on the following areas, combining both objective and subjective performance goals: corporate or business EBITDA; asset, product optimization and customer profitability; organizational effectiveness; and cost management.
Based on our achievement rating for Responsible Care® performance, our financial results for 2013 with respect to adjusted EBITDA and controlled overhead/fixed costs, and the compensation committee’s determination of their achievement level with respect to their individual performance goals, each as described below, Messrs. Pappas, Feenan, Shaw, Levi and Pugh were awarded 107%, 103%, 99%, 94% and 104% of the target annual bonus, respectively. The table below shows the 2013 target annual bonus for each NEO and the actual bonus payable, based on our performance.
| Name | Target Percentage | Target Amount | Actual Amount | |||||||||
| Christopher D. Pappas |
150 | % | $ | 1,500,000 | $ | 1,600,000 | ||||||
| John A. Feenan |
75 | % | $ | 450,000 | $ | 465,000 | ||||||
| Curtis S. Shaw |
75 | % | $ | 393,750 | $ | 390,000 | ||||||
| Marco Levi(2) |
55 | % | $ | 311,862 | $ | 291,611 | ||||||
| Martin Pugh(1)(2) |
55 | % | $ | 326,712 | $ | 283,510 | ||||||
| (1) | The actual amount received by Mr. Pugh was pro-rated for the period between March 1 and December 31, 2013. |
| (2) | Mr. Levi’s and Mr. Pugh’s compensation is payable in Swiss Francs (or CHF) and was converted using the foreign exchange rate of US$1.08 to CHF1.00 and US$1.07 to CHF1.00, respectively. These rates have been determined by averaging the exchange rates in effect during 2013. |
In 2013, our achievement rating for Responsible Care® performance qualified each NEO for a 19% cash incentive payout based on the actual results below:
| Metrics | ||||||||||||||||||||
| Actual Payout | Actual | Not Met | Target | Exceeds | ||||||||||||||||
| Responsible Care ® |
||||||||||||||||||||
| Recordable Injuries * |
0 | % | 9 | 7 | 5 | 3 | ||||||||||||||
| Loss of Primary Containment * |
9 | % | 5 | 14 | 9 | 4 | ||||||||||||||
| Process Safety Incidents * |
10 | % | 0 | 2 | 1 | 0 | ||||||||||||||
|
|
|
|
|
|
|
|
|
|
|
|||||||||||
| Total |
19 | % | ||||||||||||||||||
| * | Metrics represent incident count. |
In addition, based on our assessment of our financial performance for 2013, we determined that our financial performance thresholds (i.e., adjusted EBITDA and fixed costs) were met for 2013. Based on the
95
Table of Contents
preliminary financial results, adjusted EBITDA for 2013 was $330 million, resulting in 44% of the adjusted EBITDA portion of the bonus becoming payable, and the fixed cost target was met, resulting in 15% of the fixed cost portion being payable. Annual bonuses for our NEOs were determined and approved based on these preliminary results. After annual bonuses for our NEOs were approved, EBITDA was determined to be $325 million based on audited financial results.
In addition, each NEO had personal performance goals that may have included: corporate or business EBITDA; asset, product optimization and customer profitability; organizational effectiveness; and cost management. The results achieved against each of these goals were assessed by the compensation committee and ratings assigned. Based on its assessment of subjective individual performance criteria and our assessment of corporate and business adjusted EBITDA for 2013, the Board determined that Messrs. Pappas, Feenan, Shaw, Levi and Pugh qualified for a 29%, 25%, 21%, 16% and 26% cash incentive payout, respectively, against their personal performance goals.
The following table shows the contribution of each performance metric under our incentive plan to the actual bonus award earned by our NEOs.
| Weighted Contribution Toward Cash Incentive Payout | ||||||||||||||||||||
| Financial Performance | ||||||||||||||||||||
| Responsible Care (15% of target opportunity) |
EBITDA Target (50% of target opportunity) |
Fixed Cost Target (15% of target opportunity) |
Individual Goals (20% of target opportunity) |
Actual award % (% of target award) |
||||||||||||||||
| Christopher D. Pappas |
19 | % | 44 | % | 15 | % | 29 | % | 107 | % | ||||||||||
| John A. Feenan |
19 | % | 44 | % | 15 | % | 25 | % | 103 | % | ||||||||||
| Curtis S. Shaw |
19 | % | 44 | % | 15 | % | 21 | % | 99 | % | ||||||||||
| Marco Levi |
19 | % | 44 | % | 15 | % | 16 | % | 94 | % | ||||||||||
| Martin Pugh |
19 | % | 44 | % | 15 | % | 26 | % | 104 | % | ||||||||||
Special Cash Retention Award Opportunity
On March 26, 2013, the board of directors approved a special cash retention award for certain key employees. The purpose of the award is to maintain stability of Trinseo’s executives by providing an incentive for these individuals to remain with Trinseo during the approximately 18-month period over which the award vests. The board of directors believes that the award is an important component of its compensation package to attempt to enable business strategy execution.
The terms of each cash retention award are set forth in an award agreement between the Company and the employee. The total cash amount of the special retention award is equal to 50% of the employee’s base salary as of the date of grant. The right to receive any amount is contingent on continuous full-time employment with the Company through July 1, 2014. Any unvested amounts will be forfeited upon termination of full-time employment. The cash retention awards will be paid out in July 2014, subject to the vesting condition described above.
The total amounts of the special retention award, subject to the vesting requirements set forth above, for the named executive officers are:
| Named Executive Officer |
$ Amount | |||
| Christopher D. Pappas |
$ | 500,000 | ||
| Curt Shaw |
$ | 262,500 | ||
| Marco Levi(1) |
$ | 283,508 | ||
| John Feenan(2) |
$ | — | ||
| Martin Pugh(2) |
$ | — | ||
| (1) | Mr. Levi’s cash retention award will be paid in Swiss Franc in the amount of CHF 262,503, converted to US$, for disclosure purposes, using an average foreign exchange rate of US$1.08 to CHF1.00 in 2013. |
| (2) | Messrs. Feenan and Pugh are not eligible to receive this special cash retention award given their employment date. |
96
Table of Contents
Executive Subscription and Securityholder’s Agreements
In connection with the Acquisition and the subsequent recruitment of our executive team, our Parent, and certain investment funds advised or managed by Bain Capital Partners, LLC entered into certain Executive Subscription and Securityholder’s Agreements (as amended and restated, the “Executive Subscription Agreements”) with certain members of our management team, including our NEOs. Mr. Feenan, who was hired in 2012 and Mr. Pugh who was hired in 2013, entered into separate Executive Subscription Agreements in accordance with the terms of their employment agreements. The Executive Subscription Agreements provide for sales of Classes A through F of the ordinary shares of our Parent (the “Co-Invest Shares”) and Classes G through L of ordinary shares of our Parent (the “Incentive Shares”), subject to certain conditions. Our NEOs (other than Mr. Feenan and Mr. Pugh) invested a total of $1,775,010 for the Co-Invest Shares issued under the Executive Subscription Agreements. We believe that by providing our senior management with a meaningful equity stake in us, we are better able to align the interests of our named executive officers with those of our shareholders and create value for our shareholders.
Under the Executive Subscription Agreements, in the case of our NEOs other than Mr. Pappas, 50% of Incentive Shares issued are subject to time vesting over five years with 40% of these vesting on the second anniversary of the date of grant and the remaining portion vesting ratably on an annual basis over the subsequent three years (in the case of Mr. Feenan and Mr. Pugh, 20% vesting on the first anniversary of the date of grant and the remaining portion vesting ratably on an annual basis over the following four years). For Mr. Pappas, 75% of Incentive Shares issued are subject to time vesting with 25% vesting on the first anniversary of the Acquisition and the balance vesting ratably on a quarterly basis over the following three years. The remaining 50% of the Incentive Shares (25% for Mr. Pappas) are subject to both time vesting, in the same manner as previously described, as well as performance vesting subject to achieving certain targets based on various returns realized by our shareholders upon a change in control or the completion of an initial public offering.
In 2013, Mr. Pappas entered into an amended and restated Executive Subscription Agreement in accordance with the terms of his amended Employment Agreement. Under the agreement Mr. Pappas was awarded additional Classes H though L of ordinary shares of our Parent (“New Securities”), subject to certain conditions. 100% of the New Securities are subject to a time-based vesting condition with 40% vesting on June 30, 2014 and the remaining portion vesting on an annual basis over the subsequent three years. In determining the size of the New Securities awarded to Mr. Pappas, our Board took into account a number of factors including the size of the initial grant of incentive securities previously awarded to Mr. Pappas and the alignment of his compensation with the long-term interests of our shareholders.
100% of the Incentive Shares are subject to the applicable executives remaining employed by us between the date of the applicable Executive Subscription Agreement and the applicable vesting date; provided that, if any of our NEOs (other than Mr. Pappas) dies, is terminated without cause or due to his disability, or resigns for good reason after the second anniversary of the date of grant, the portion of the Incentive Shares that are subject to time vesting that would have vested on the next regular vesting date will accelerate and vest on a pro rata basis based on the number of full months between the last regular vesting date and the termination date. If Mr. Pappas dies, is terminated without cause or due to his disability, or resigns for good reason, the portion of the Incentive Shares that are subject to time vesting that would have vested during the 12 months following the termination date will accelerate and vest.
Pursuant to the Executive Subscription Agreements, if our Parent makes distributions with respect to any Co-Invest Shares or Incentive Shares prior to an executive’s securities becoming time vested or performance vested, our Parent will pay the executive, once such Incentive Shares become vested, a catch-up amount equal to an amount that the executive would have been entitled to receive in respect of any distribution by our Parent in connection with his or her Incentive Shares which are not vested had such Incentive Shares been vested on the date of such distribution, plus interest. For additional description of the Executive Subscription Agreements, see Item 13—Certain Relationships and Related Transactions, and Director Independence.
97
Table of Contents
We use both time-based awards and performance-based awards to provide what we believe are appropriate incentives. Time-based awards help to retain executives, who must be employed by the Company at the time the award vests. Performance-based awards encourage our NEOs and other senior executives to maximize value creation for our shareholders.
In February 2011, in connection with the refinancing of our previous $800 million term loan under the Senior Secured Credit Facility, the Board declared a one-time cash distribution. The distribution was made by way of redemption and cancellation of the class A and class G shares. The NEOs, to the extent they held Co-Invest Shares and Incentive Shares, received an equivalent payment in 2011. For those hired after June 17, 2010, a portion of the distribution attributable to unvested time-based Incentive Shares was withheld and put in escrow, to be paid out in connection with the anniversary of their date of hire, subject to the NEO’s continued employment with the Company. For those hired after June 17, 2010 but during 2010, 50% of the time-based Incentive Share distribution was paid in February 2011 and 50% was paid on their next anniversary date in 2012. For executives hired in 2011, 100% of the distribution was payable on their second anniversary date. For all holders of performance-based Incentive Shares redeemed and cancelled, a portion of the distribution was withheld and put in escrow, to be paid out at the time all performance-based conditions are met. There were no distributions for the year ended December 31, 2013.
Our Board and compensation committee believe that this treatment of holders of Co-Invest and Incentive Shares is fair and consistent with their status as equity participants in our Parent.
Retirement Benefits
Our Qualified U.S. Savings Plan (a “401(k) plan”) provides for (1) annual discretionary Company contributions and (2) employer matching contributions to be credited to participants’ accounts. The U.S. based NEOs participate in this plan on the same basis as our other employees. We also maintain a non-qualified savings and deferral plan in which each of our NEOs (other than Mr. Levi and Mr. Pugh) participates. This plan allows participants to defer a portion of their compensation on a pre-tax basis, with matching contributions from the Company that are payable at a future date based on the terms of the plan. Additionally, the plan provides for discretionary Company contributions in connection with earnings that are in excess of limitations set forth in the Qualified U.S. Savings Plan.
Our NEOs do not participate in nor have account balances in qualified or nonqualified defined benefit pension plans sponsored by the Company, with the exception of Mr. Levi and Mr. Pugh, who participate in our Switzerland based retirement plan. Mr. Pugh is also entitled to a retirement benefit payable at age 65 in the amount of CHF 250,000 (Swiss Francs), which will be prorated if retirement occurs prior to age 65.
Pursuant to the terms of Mr. Pappas’s employment agreement, he is entitled to a retirement benefit payable in the form of a cash lump sum upon retirement/termination of employment in an amount determined in accordance with a formula contained in his employment agreement as described in more detail under “Pension and Other Postretirement Benefits—Supplemental Employee Retirement Benefit” below.
Severance Benefits
Our NEOs are eligible for severance benefits under their employment contracts upon certain terminations of employment. The agreements provide the NEOs, except Mr. Pappas and Mr. Pugh, with severance benefits in an amount equal to one and one-half times (1.5x) the sum of the executive’s annual base salary and target bonus. Mr. Pappas is eligible for severance benefits in an amount equal to two times (2.0x) the sum of his annual base salary and target bonus. Mr. Pugh is eligible for severance benefits in an amount equal to two and one-half times (2.5x) the sum of his annual base salary and target bonus if termination (other than for cause) occurs prior to March 1, 2014, two times (2.0x) the sum of his annual base salary and target bonus if termination occurs on or following March 1, 2014 but prior to March 1, 2015, and one and one-half times (1.5x) the sum of his annual base salary and target bonus if termination occurs on or following March 1, 2015. Each of our NEOs must sign a general release in order to receive these severance benefits.
98
Table of Contents
Change-in-Control Severance Benefits
We provide change-in-control severance benefits to certain executives, including Messrs. Pappas, Feenan, Shaw, and Pugh. These change-in-control severance benefits are intended to minimize the distraction and uncertainty that could affect key management in the event we become involved in a transaction that could result in a change in control of Trinseo and to enable the executives to impartially evaluate such a transaction. Under the terms of these agreements, each NEO is entitled to a lump sum payment equal to the severance benefits set forth above (rather than payment of severance benefits in installments) if the NEO experiences a termination of employment other than for cause or in the event the NEO resigns for good reason, as defined in the agreements, within two years following a change-in-control of the Company. Mr. Pappas is also entitled to a so-called 280G gross-up in connection with certain payments to him in connection with a change in control that was negotiated at the time Mr. Pappas was hired by us.
Other Compensation
Each NEO is eligible to participate in our generally-applicable benefit plans, such as savings, medical, dental, group life, disability and accidental death and dismemberment insurance, in accordance with country practices.
In connection with his hiring, Mr. Feenan was granted a cash retention award of $5 million, to be paid in four annual installments, with $1 million payable on each of the first and second anniversaries of the commencement of his employment and $1.5 million payable on each of the third and fourth anniversaries of the commencement of his employment, subject to his continued employment on such date. If Mr. Feenan is terminated without Cause or resigns for Good Reason (as defined in his employment agreement), the next scheduled installment of the retention award will be paid to him. If there is a Change in Control (as defined in his employment agreement) or he dies, all of the remaining installments will be paid to him.
Mr. Pugh was granted a sign-on bonus in connection with his hiring to make him whole for his forfeiture of certain incentive compensation amounts granted by his former employer. The sign-on bonus is equal to CHF 600,000 and is payable at the time that he purchases a residence in Zurich, Switzerland, provided he remains employed at such time. In the event Mr. Pugh is terminated for Cause or resigns without Good Reason (as defined in his employment agreement), he will be required to repay the sign-on bonus to the Company. In addition, the sign-on bonus will be reduced (and he will be required to repay such sign-on bonus) to the extent that he receives any portion of the incentive compensation from his former employer that was contemplated to be forfeited.
Under his employment agreement, Mr. Pugh is entitled to receive a retention bonus of CHF 250,000 if he remains employed on September 1, 2013, which was paid in September 2013, and a retention bonus of CHF 500,000 if he remains employed on September 1, 2014. If his employment is terminated for any reason prior to the vesting date, he will not be eligible to receive the retention bonus.
Certain employees, including NEOs, received relocation packages in connection with their employment. In 2013, Mr. Feenan received an additional $116,416 of relocation benefits in connection with his employment in 2012 and Mr. Pugh received $2,378 in relocation benefits in connection with his employment.
Compensation Risk Management
While our compensation committee is in the process of reviewing the risks that arise from our compensation policies and practices, we do not believe that our compensation policies and practices create risks that are reasonably likely to have a material adverse effect on our business and operations.
99
Table of Contents
Tax Treatment
Because our ordinary shares are not currently publicly traded, executive compensation has not been subject to the provisions of Section 162(m) of the Internal Revenue Code of 1986, as amended (the “Code”), which limit the deductibility of compensation paid to certain individuals to $1 million, excluding qualifying performance based compensation and certain other compensation.
Compensation Committee Report
The compensation committee has reviewed and discussed the Compensation Discussion and Analysis section (the “CD&A”) required by Item 402(b) of Regulation S-K with management. Based on such review and discussions, the compensation committee recommended to the board of directors that the CD&A be included in this Annual Report.
Compensation Committee Members
Michel Plantevin
Stephen Zide
100
Table of Contents
Summary Compensation Table
The following table sets forth information regarding the compensation paid to or earned by our NEOs for the year ended December 31, 2013 and 2012. For a complete understanding of the table, please read the footnotes and narrative disclosures that follow the table.
| Name and Principal |
Year | Salary ($) | Bonus ($) (1)(2)(3) |
Share Awards ($) (4) |
Non-Equity Incentive Plan Compensation ($)(5) |
Changes in Pension and Other Postretirement Benefits Value and Non- qualified Deferred Compensation Earnings ($)(6)(7) |
All Other Compensation ($)(8) |
Total ($) | ||||||||||||||||||||||||
| Christopher D. Pappas |
2013 | $ | 1,000,000 | $ | — | $ | 11,284,837 | $ | 1,600,000 | $ | 2,007,918 | $ | 165,302 | $ | 16,058,057 | |||||||||||||||||
| President and Chief Executive Officer |
2012 | $ | 800,000 | $ | 160,000 | $ | — | $ | 80,000 | $ | 1,476,354 | $ | 113,022 | $ | 2,629,376 | |||||||||||||||||
| John A. Feenan |
2013 | $ | 600,000 | $ | — | $ | — | $ | 465,000 | $ | — | $ | 176,493 | $ | 1,241,493 | |||||||||||||||||
| Executive Vice President and Chief Financial Officer |
2012 | $ | 551,250 | $ | 1,084,144 | $ | 8,767,429 | $ | 42,072 | $ | — | $ | 870,287 | $ | 11,315,182 | |||||||||||||||||
| Curtis S. Shaw |
2013 | $ | 525,000 | $ | — | $ | — | $ | 390,000 | $ | — | $ | 59,796 | $ | 974,796 | |||||||||||||||||
| Executive Vice President, General Counsel and Corporate Secretary |
2012 | $ | 510,000 | $ | 76,500 | $ | — | $ | 38,250 | $ | — | $ | 816,752 | $ | 1,441,502 | |||||||||||||||||
| Marco Levi(9) |
2013 | $ | 567,021 | $ | — | $ | — | $ | 291,611 | $ | 313,209 | $ | 632 | $ | 1,172,473 | |||||||||||||||||
| Senior Vice President and Business President Emulsion Polymers |
2012 | $ | 513,648 | $ | 56,501 | $ | — | $ | 28,251 | $ | 841,100 | $ | 16,561 | $ | 1,456,061 | |||||||||||||||||
| Martin Pugh(9)(10) |
2013 | $ | 495,017 | $ | 918,026 | $ | 2,090,261 | $ | 283,510 | $ | 1,311,635 | $ | 2,569 | $ | 5,101,018 | |||||||||||||||||
| Senior Vice President Business President, Plastics |
||||||||||||||||||||||||||||||||
| (1) | The amount in the “Bonus” column for each individual in 2012 includes the portion of the annual incentive payment awarded by the compensation committee that was in excess of the amount payable pursuant to the actual performance results under the annual performance-based cash incentive plan. |
| (2) | Mr. Feenan was entitled to a $5.0 million retention award as part of his employment agreement dated December 22, 2011. These amounts will vest and be paid over a 4 year period. Mr. Feenan received $1.0 million in 2012, which is included in the “Bonus” column. No payments were made in 2013. |
| (3) | Mr. Pugh is entitled to a retention bonus of CHF 750,000 as part of his employment agreement. The amount will vest and be paid out over an 18 month period. Mr. Pugh received CHF 250,000 in 2013, which is included in the “Bonus” column. In addition, Mr. Pugh received a sign on bonus of CHF 600,000 in connection with his employment in March 2013, which is also included in the “Bonus” column. |
| (4) | The amount in this column reflects the fair value of restricted share awards granted in 2013 and 2012, calculated in accordance with ASC 718, excluding the effects of estimated forfeitures. The assumptions used for determining fair value are described in Item 7—Management’s Discussion and Analysis of Financial Condition and Results of Operations—Critical Accounting Policies and Estimates. Amounts in the column include the grant date fair value of both time-based and performance-based awards. The amount attributable to the performance-based portion of the awards assumes that all performance-based vesting criteria are satisfied in full. |
101
Table of Contents
| (5) | This represents the NEOs earned cash incentive payout as discussed in “Annual Performance-Based Cash Incentive Compensation” above. |
| (6) | Changes in Pension and Other Postretirement Benefits for Mr. Pappas, Mr. Levi and Mr. Pugh for the year ended December 31, 2013 amounted to $2,007,918, $313,209 and $1,311,635, respectively. Changes in Pension and Other Postretirement Benefits for Mr. Pappas and Mr. Levi for the year December 31, 2012 amounted to $1,476,354 and $841,000, respectively. Messrs. Feenan and Shaw do not participate in pension and other postretirement benefit arrangements. Please see “—Pension and Other Postretirement Benefits” for a description of these arrangements. |
| (7) | No amount is reported with respect to earnings on non-qualified deferred compensation plans because above market rates are not provided under such plans. See “—U.S. Non-Qualified Deferred Compensation Table” below for the NEOs deferred compensation. |
| (8) | Included in “All Other Compensation” for fiscal year 2013 were the following items: |
| 401(k) plan(i) | Non-qualified deferred compensation plan(ii) |
Relocation(iii) | Other(iv) | Total | ||||||||||||||||
| Name | ||||||||||||||||||||
| Christopher D. Pappas |
$ | 21,019 | $ | 142,050 | $ | — | $ | 2,233 | $ | 165,302 | ||||||||||
| John A. Feenan |
$ | 19,132 | $ | 39,750 | $ | 116,416 | $ | 1,194 | $ | 176,493 | ||||||||||
| Curtis S. Shaw |
$ | 19,750 | $ | 33,188 | $ | — | $ | 6,858 | $ | 59,796 | ||||||||||
| Marco Levi |
$ | — | $ | — | $ | — | $ | 632 | $ | 632 | ||||||||||
| Martin Pugh |
$ | — | $ | — | $ | 2,569 | $ | — | $ | 2,569 | ||||||||||
| (i) | Represents Company matching and discretionary contributions to the U.S. 401(k) plan for all NEOs except Mr. Levi and Mr. Pugh. |
| (ii) | Represents Company contributions to our non-qualified deferred compensation plan (such amounts are also included in the “U.S. Non-Qualified Deferred Compensation Table” below) for all NEOs except Mr. Levi and Mr. Pugh. |
| (iii) | Represents relocation benefits received by Messrs. Feenan and Pugh in connection with their employment. |
| (iv) | Includes the taxable value of group term life insurance and service awards. |
| (9) | Mr. Levi and Mr. Pugh’s compensation was paid or payable in Swiss Francs (or CHF). The amount of compensation earned or received during 2013 and 2012 was converted using the foreign exchange rate of US$1.08 to CHF1.00 and US$1.07 to CHF1.00, respectively. These rates have been determined by averaging the exchange rates in effect during 2013 and 2012, respectively. |
| (10) | For Mr. Pugh, the amounts included in the “Salary” and “Non-Equity Incentive Plan” columns represent amounts received for the period between March 1 and December 31, 2013. |
Grant of Equity Plan and Non-Equity Plan Based Awards Table
During fiscal year 2013, we granted share-based compensation awards to certain of our NEOs pursuant to the Executive Subscription and Security Holder’s Agreements and employment agreements. Information with respect to each of these awards on a grant by grant basis is set forth in the table below. During fiscal year 2013, we did not grant awards to the NEOs under a non-equity incentive plan, with the exception of our annual performance-based cash incentive plan.
| Grant Date | Non-Equity Incentive Plan Awards(1) | Restricted Stock Awards | ||||||||||||||||||||
| Threshold | Target | Maximum | Number of Shares of Stock (#)(2) |
Grant Date Fair Value of Stock Awards ($/Share)(3) |
||||||||||||||||||
| Christopher D. Pappas(4) |
April 18, 2013 | — | — | — | 72,618 | $ | 11,284,837 | |||||||||||||||
| N/A | $ | — | $ | 1,500,000 | $ | 3,000,000 | — | $ | — | |||||||||||||
| John A. Feenan |
NA | $ | — | $ | 450,000 | $ | 900,000 | — | $ | — | ||||||||||||
| Curtis S. Shaw |
NA | $ | — | $ | 393,750 | $ | 787,500 | — | $ | — | ||||||||||||
| Marco Levi |
NA | $ | — | $ | 311,862 | $ | 623,724 | — | $ | — | ||||||||||||
| Martin Pugh(4) |
March 1, 2013 | — | — | — | 15,489 | $ | 2,090,261 | |||||||||||||||
| N/A | $ | 326,712 | $ | 653,424 | — | $ | — | |||||||||||||||
| (1) | Represents awards provided under our annual performance-based cash incentive plan discussed above under “Annual Performance-Based Cash Incentive Compensation”. Maximum amount represents two times the target |
102
Table of Contents
| amount. Mr. Pugh’s actual cash incentive for 2013 was prorated from March 1, 2013, the date he commenced employment with us. The actual amounts earned by the NEOs with respect to 2013 are included in the “Non-Equity Incentive Plan Compensation” column of the Summary Compensation Table above. |
| (2) | Represents stock-based compensation awards to the NEOs pursuant to the Executive Subscription Agreements and employment agreements. The stock awards granted during fiscal year 2013 include both time-based and performance-based restricted stock awards and are made with respect to Parent stock. |
| (3) | Represents the grant-date fair value calculated in accordance with ASC 718, using the assumptions described in Item 7—Management’s Discussion and Analysis of Financial Condition and Results of Operations—Critical Accounting Policies and Estimates included elsewhere in this Annual Report. |
| (4) | Mr. Pappas and Mr. Pugh were granted stock awards during 2013. The stock awards granted to Mr. Pappas in 2013 are only subject to a time-based vesting condition, with 40% vesting on June 30, 2014 and the remaining portion vesting on an annual basis over the subsequent three years. If Mr. Pappas dies, is terminated without cause or due to his disability, or resigns for good reason, the awards that would have vested during the 12 months following his termination date will accelerate and vest. All of his time-based awards will accelerate upon a change in control that is not an initial public offering. With respect to Mr. Pugh, fifty percent of his stock awards are only subject to time vesting, with 20% vesting on March 1, 2014 and the remaining portion vesting ratably on an annual basis over the following four years, provided that if Mr. Pugh is terminated without cause or due to his disability, or resigns for good reason after March 1, 2015, the portion of the award that would have vested on the next regular vesting date will accelerate and vest on a pro rata basis based on the number of full months between the last regular vesting date and the termination date. All of his time-based awards will accelerate upon a change in control that is not an initial public offering. The remaining 50% of Mr. Pugh’s stock awards are subject to both time vesting, in the same manner as previously described (but without pro-rated vesting upon any termination of employment), as well as performance vesting subject to the achievement of certain targets based on various returns realized by our shareholders upon a change in control or the completion of an initial offering. |
Narrative Disclosure to Summary Compensation Table and Grants of Plan-Based Awards Table
Executive Employment Agreements with Messrs. Pappas, Feenan and Shaw
We have entered into executive employment agreements with each of Messrs. Pappas, Feenan and Shaw, with employment dates commencing on June 17, 2010, January 16, 2012 and July 1, 2010, respectively. The agreements provide for an initial term of three years and are subject to automatic one-year extensions beginning on the expiration of the initial term. The automatic extension of the agreements may be terminated with at least 90 days’ prior written notice from the executive or the Company stating the intent not to extend the employment term. On April 11, 2013, the agreement with Mr. Pappas was amended and restated with retroactive effect as of January 2, 2013, and was extended until June 30, 2017.
Under the agreements, Messrs. Pappas, Feenan and Shaw are entitled to receive annual base salaries of $1,000,000, $585,000 and $510,000, respectively, subject to annual review and increase by the compensation committee and/or Board in its sole discretion, and have target bonus opportunities under our annual performance-based cash incentive plan equal to 150%, 75% and 75%, respectively, of their base salaries. In 2013, Mr. Feenan’s and Mr. Shaw’s base salaries were increased to $600,000 and $525,000, respectively. In addition, Messrs. Pappas, Feenan and Shaw have been granted Incentive Shares generally representing the right to participate in 4.5%, 0.9% and 0.9%, respectively, of our equity capital appreciation (as described above in “Executive Subscription and Securityholder’s Agreements”). Each executive is entitled to participate in our employee and fringe benefit plans as may be in effect from time to time on the same general basis as our other employees.
In addition to the foregoing, Mr. Pappas is entitled to a retirement benefit payable in the form of a cash lump sum upon termination of employment in an amount determined in accordance with a formula contained in his employment agreement and as described in more detail under “Pension and Other Postretirement Benefits—Supplemental Employee Retirement Benefit” below.
103
Table of Contents
Offer Letter Agreement with Mr. Levi
We entered into an offer letter agreement with Mr. Levi on September 22, 2010. The letter agreement provides for at-will employment with no fixed term of employment. Under the letter agreement, Mr. Levi is entitled to receive an annual base salary of CHF 480,000, subject to annual review and increase by the Company’s compensation committee and/or Board in its sole discretion, and has the opportunity to earn an annual target performance award equal to 55% of his base salary. In 2013, Mr. Levi’s base salary was increased to CHF 525,000. In addition, Mr. Levi has been granted Incentive Shares generally representing the right to participate in 0.4% of our equity capital appreciation (as described above in “Executive Subscription and Securityholder’s Agreements”). Mr. Levi is entitled to participate in our employee and fringe benefit plans as may be in effect from time to time on the same general basis as our other employees.
Executive Employment Agreement with Mr. Pugh
We have entered into an executive employment agreement with Mr. Pugh with an employment date which commenced on March 1, 2013. The agreement provides for an initial term of three years and is subject to automatic one-year extensions beginning on the expiration of the initial term. The automatic extension of the agreement may be terminated with at least 90 days’ prior written notice from the executive or the Company stating the intent not to extend the employment term. Under the agreement, Mr. Pugh is entitled to receive an annual base salary of CHF 550,000, subject to annual review by the Board (or a committee thereof) during the first ninety (90) days of each calendar year, and the base salary in respect of such calendar year may be increased above, but not decreased below, its level for the preceding calendar year. Mr. Pugh has the opportunity to earn annual target performance awards equal to 55% of his base salary. In addition, Mr. Pugh has been granted Incentive Shares generally representing the right to participate in 0.4% of our equity capital appreciation (as described above in “Executive Subscription and Securityholder’s Agreements”). Mr. Pugh is entitled to participate in our employee and fringe benefit plans as may be in effect from time to time on the same general basis as our other employees.
Under his agreement, Mr. Pugh is eligible to receive cash retention payments equal to (i) CHF 250,000, which vested and was paid in September 2013, and (ii) CHF 500,000, which becomes vested on the eighteen (18)-month anniversary of the effective date of his employment agreement, subject to his continued employment with the Company or one or more of its subsidiaries through such date, and payable within thirty (30) days following such vesting date.
Mr. Pugh is also entitled to a one-time lump sum signing bonus cash payment in the amount of CHF 600,000 payable coincident with a purchase of a residence in the Zurich, Switzerland metropolitan area, subject to Mr. Pugh’s continued employment with the Company at the time of payment. In the event that Mr. Pugh’s employment with the Company terminates as a result of a termination by the Company for cause or by the executive without good reason (each as defined in the agreement) at any time within a period of one (1) year following the effective date of this employment agreement, Mr. Pugh is required to repay the signing bonus to the Company. Such amount shall be repaid to the Company no later than thirty (30) days following such termination date and, at the Company’s election, the Company may offset such amount against any amount owed by the Company to the executive.
Pursuant to an amendment to Mr. Pugh’s employment agreement, which was approved by the compensation committee in 2013, and approved and executed by the Board January 2014, Mr. Pugh is entitled to receive a retirement benefit in an amount up to CHF 250,000 payable at age 65 or prorated if he retires before reaching age 65.
For a description of the payments and benefits our named executive officers may be entitled to receive in connection with a termination of employment, see “—Potential payments upon termination or change in control.”
104
Table of Contents
Outstanding Equity Awards at Fiscal Year-End Table
The table below sets forth certain information regarding outstanding and unvested restricted share awards held by the NEOs as of December 31, 2013. All awards are with respect to shares of our Parent.
| Stock Awards | ||||||||||||||||
| Number of Shares of Stock That Have Not Vested (#)(1) |
Market Value of Shares of Stock That have Not Vested ($)(3) |
Number of Unearned Shares That Have Not Vested (#)(2) |
Market Value of Unearned Shares That have Not Vested ($)(3) |
|||||||||||||
| Christopher D. Pappas |
81,683 | $ | 20,477,928 | 24,207 | $ | 4,190,232 | ||||||||||
| John A. Feenan |
10,457 | $ | 2,621,570 | 17,429 | $ | 3,016,960 | ||||||||||
| Curtis S. Shaw |
4,648 | $ | 1,165,254 | 15,492 | $ | 2,681,665 | ||||||||||
| Marco Levi |
2,325 | $ | 582,752 | 7,746 | $ | 1,340,833 | ||||||||||
| Martin Pugh |
7,745 | $ | 1,941,672 | 7,744 | $ | 1,340,486 | ||||||||||
| (1) | Represents time-based restricted stock awards with respect to Parent stock granted to the NEOs pursuant to the Executive Subscription Agreements and employment agreements. Restricted stock awards include both time-based and performance based restricted stock awards. Time-based restricted stock awards generally vest over four to five years with a portion (25% or 40%) cliff vesting after one or two years (except for time-based awards held by Mr. Feenan and Mr. Pugh which vest 20% on January 1, 2013 and March 1, 2014, respectively, with the remaining portion vesting over the following four years). The remaining portion of the awards vest ratably over the subsequent time period, subject to the participant’s continued employment with the Company, and vest automatically upon a change of control of the Company excluding a change in control related to an initial public offering, or an IPO. Should a participant’s termination occur within defined time frames due to death or permanent disability, a termination of the participant by the Company or one of its subsidiaries without cause, or the participant’s voluntary resignation for good reason, a portion of the unvested restricted stock awards will either vest on the termination date or be repurchased. The outstanding time-based restricted stock will vest as set forth below: |
| Number of Shares | Vesting Date | |||||||
| Christopher D. Pappas |
4,540 | 3/17/14 | ||||||
| 4,525 | 6/17/14 | |||||||
| 29,047 | 6/30/14 | |||||||
| 14,524 | 6/30/15 | |||||||
| 14,524 | 6/30/16 | |||||||
| 14,524 | 6/30/17 | |||||||
| John A. Feenan |
3,486 | 1/1/15 | ||||||
| 3,486 | 1/1/16 | |||||||
| 3,485 | 1/1/17 | |||||||
| Curtis S. Shaw |
1,549 | 7/1/14 | ||||||
| 3,099 | 7/1/15 | |||||||
| Marco Levi |
775 | 6/17/14 | ||||||
| 1,550 | 6/17/15 | |||||||
| Martin Pugh |
1,549 | 3/1/14 | ||||||
| 1,549 | 3/1/15 | |||||||
| 1,549 | 3/1/16 | |||||||
| 1,549 | 3/1/17 | |||||||
| 1,549 | 3/1/18 | |||||||
| (2) | The performance-based restricted stock awards contain a time-based component, and vest in the same manner as all other time-based awards, but only if certain targets are achieved based on various returns realized by our shareholders on a change in control or an IPO. Generally, performance-based restricted stock will not vest until |
105
Table of Contents
| a change in control or an IPO. Holders of vested performance-based stock are entitled to distributions from the Parent only after investors in the Parent have received distributions equal to their original investment. As of December 31, 2013, Mr. Pappas held 24,207 shares of performance-based restricted stock, Mr. Feenan held 17,429 shares, Mr. Shaw held 15,492 shares, Mr. Levi held 7,746 shares, and Mr. Pugh held 7,744 shares. |
| (3) | Amounts were determined based on the fair value per share of our Parent shares as of December 31, 2013 ($250 per share for a time-based restricted share and $173.10 per share for a performance-based restricted share), as calculated by an independent valuation expert and approved by our audit committee. |
Shares Vested Table
The following table shows the number of ordinary shares acquired by the NEOs upon the vesting of restricted shares of our Parent shares during fiscal year 2013:
| Share Awards | ||||||||
| Name |
Number of Shares Acquired on Vesting (#)(1) |
Value Realized on Vesting ($)(2) |
||||||
| Christopher D. Pappas |
18,160 | $ | 2,815,315 | |||||
| John A. Feenan |
6,972 | $ | 937,277 | |||||
| Curtis S. Shaw |
3,098 | $ | 480,278 | |||||
| Marco Levi |
1,549 | $ | 240,139 | |||||
| Martin Pugh |
— | $ | — | |||||
| (1) | Represents restricted share awards to the NEOs pursuant to the Executive Subscription and Security Holder’s Agreements. Restricted share awards include both time-based and performance-based restricted share awards. All shares acquired on vesting during fiscal year 2013 were time-based restricted share awards. |
| (2) | The value realized on vesting is based on the fair value per share of our Parent shares on the date of vesting. |
U.S. Non-Qualified Deferred Compensation Table
The following table summarizes the activity during 2013 and year-end account balances in our non-qualified savings and deferred compensation plan for our NEOs. The plan allows eligible employees, including the NEOs, to defer a portion of their compensation (up to 75% of base salary and up to 100% of actual performance cash incentive awards) on a pre-tax basis with a matching contribution from the Company, payable at a future date based on specific plan parameters. Additionally, the plan provides for discretionary company contributions in connection with earnings in excess of the limits under the Company’s tax-qualified savings plan. While the plan is unfunded, amounts deferred under the plan are credited with earnings based on the performance of selected investment vehicles that are available in the open market. The plan is available to all U.S. employees who satisfy certain eligibility requirements, including the NEOs. An eligible participant can elect to receive a distribution under the plan in the form of a lump sum payment upon separation of service from the Company. Additionally, a participant may elect to receive a distribution at a specified future date in either a single lump sum or a series of annual installments over a period of 5 to 10 years. However, this latter distribution option is only available for the elective deferral of a participant’s base salary and performance award. Company matching and discretionary contributions must be paid as a lump sum at separation from employment.
| Name |
Executive Contributions in 2013 ($)(1) |
Company Contributions in 2013 ($)(2) |
Aggregate Earnings in 2013 ($)(3) |
Aggregate Withdrawals/ Distributions in 2013 ($) |
Aggregate Balance as of December 31, 2013 ($)(4) |
|||||||||||||||
| Christopher D. Pappas |
$ | 138,216 | $ | 142,050 | $ | 51,503 | $ | — | $ | 579,516 | ||||||||||
| John A. Feenan |
$ | — | $ | 39,750 | $ | — | $ | — | $ | 72,093 | ||||||||||
| Curtis S. Shaw |
$ | — | $ | 33,188 | $ | 14,242 | $ | — | $ | 123,588 | ||||||||||
| Marco Levi(5) |
$ | — | $ | — | $ | — | $ | — | $ | — | ||||||||||
| Martin Pugh(5) |
$ | — | $ | — | $ | — | $ | — | $ | — | ||||||||||
106
Table of Contents
| (1) | Represents amounts contributed by the NEOs under the non-qualified savings and deferred compensation plan. These amounts are included in the Summary Compensation Table as part of “Salary”. |
| (2) | Includes amounts that were contributed by the Company under the non-qualified savings and deferred compensation plan. These amounts are also included in the Summary Compensation Table in the “All Other Compensation” column. |
| (3) | Represents earnings on the Company’s non-qualified savings and deferred compensation plan. Amounts are not reported as compensation in the Summary Compensation Table. |
| (4) | Includes amounts that were reported as compensation in the Summary Compensation Table in 2012 and prior years to the extent such amounts were contributed by the executive and the Company, but not to the extent that such amounts represent earnings. |
| (5) | Mr. Levi and Mr. Pugh are based in Switzerland and do not participate in this plan. |
Pension and Other Postretirement Benefits
Switzerland Retirement Plans
The Switzerland retirement plans are fully insured pension plans. Future retirement benefits are calculated based on accumulated savings at retirement, which consists of savings contributions made by the employee and the Company, and an annually credited interest rate that is contingent upon investment results. Actual retirement benefits will be dependent on investment results, actual rate of interest applied on the savings capital, potential future changes in plan regulation and/or legal changes and future salary changes. The amount of pensionable salary is calculated using base pay plus the annual target bonus amount minus a coordination amount that reflects the maximum social security pension in place at the time, and is subject to a statutory maximum. Employee and Company contributions are based on the employee’s age and determined in accordance with the percentage of pensionable salary as follows:
| Name |
Employee saving contributions in % of pensionable salary |
Employer saving contributions in % of pensionable salary |
||||||
| Marco Levi |
8.00 | % | 12.00 | % | ||||
| Martin Pugh |
10.00 | % | 10.00 | % | ||||
In addition, the employer pays the total premiums for risk benefits and other costs. It is assumed that these additional contributions equal 4.0% of insured salary.
Benefits are paid as a monthly annuity, lump sum or a combination of the two payment forms.
Supplemental Employee Retirement Benefit
In 2010, we entered into an employment contract with Mr. Pappas which included a provision for non-qualified supplemental employee retirement benefits. Mr. Pappas would have forfeited all benefits if he had left the Company prior to June 17, 2013. The accrued benefits will be paid to Mr. Pappas in a lump sum within 30 days after his termination of employment. The amount payable to Mr. Pappas with respect to his supplemental employee retirement benefits is determined based on his years of Service Credit and his average base salary and target bonus for the three full calendar years prior to his termination.
107
Table of Contents
The accrued benefits are equal to the Basic Percentage times the average of his base salary plus target bonus for the three full calendar years prior to his termination (the “Final Average Pay”) plus the Supplemental Percentage times the Final Average Pay reduced by the 36-month rolling average Social Security Taxable Wage Base as of the date of termination. The Basic Percentage and Supplemental Percentage are determined based on Mr. Pappas’ years of Service Credit, as set forth below.
| Aggregate Years of |
Basic Percentage | Supplemental Percentage | ||
| 6 |
138% | 24% | ||
| 12 |
276% | 48% | ||
| 18 |
414% | 72% | ||
| 24 |
425% | 96% | ||
| 30 |
425% | 120% |
For purposes of determining Mr. Pappas’ retirement benefit, he was granted six (6) years of Service Credit with the Company at the start of his employment and on each anniversary date Mr. Pappas will be granted an additional six (6) years of Service Credit, up to a maximum of 30 years of Service Credit. As of December 31, 2013, Mr. Pappas had twenty four (24) years of Service Credit with the Company.
The following table shows the actuarial present value of accumulated pension and other post-retirement benefits as of December 31, 2013:
| Name |
Plan Name |
Number of Years of Credited Service (#)(1) |
Present Value of Accumulated Benefit ($)(2) |
Payments During 2013 ($) |
||||||||||
| Christopher D. Pappas |
Supplemental Employee Retirement Plan | 24.0 | $ | 8,554,867 | $ | — | ||||||||
| John A. Feenan |
N/A | — | $ | — | $ | — | ||||||||
| Curtis S. Shaw |
N/A | — | $ | — | $ | — | ||||||||
| Marco Levi |
Switzerland Retirement Plan | 28.5 | $ | 4,223,470 | $ | — | ||||||||
| Martin Pugh |
Switzerland Retirement Plan | 6.5 | $ | 1,329,590 | $ | — | ||||||||
| (1) | The years of credited service for Mr. Pappas are determined pursuant to his employment agreement, as described above. Mr. Levi and Mr. Pugh’s years of credited service include years they were employed by a prior company, as required by law. |
| (2) | The assumptions used to determine the present value of accumulated benefits are provided below: |
| Discount rate | Salary increase | |||||||
| Supplemental Employee Retirement Plan |
4.00 | % | 4.00 | % | ||||
| Switzerland Retirement Plan |
2.40 | % | 2.50 | % | ||||
These assumptions are consistent with the assumptions used in the consolidated financial statements included in this Annual Report.
Potential Payments upon Termination or Change in Control
The following table shows the potential payments upon termination or upon a termination following a change in control to the NEOs, as if such event(s) took place on December 31, 2013 (the last business day of our most recent fiscal year). The amounts reflected in this table were determined in accordance with each NEO’s then existing employment agreement. Amounts shown do not include (i) accrued but unpaid salary and vested benefits, including pension (as described above) and (ii) other benefits earned or accrued by the named executive officer during his employment that are available to all salaried employees and that do not discriminate in scope, terms or operations in favor of executive officers. With respect to any termination of employment, each named executive officer is entitled to receive accrued but unpaid base salary through the date of termination of employment, accrued but unpaid vacation and pension benefits (as described above) through such date and continued coverage under our health and welfare benefit plans through the end of the month in which such
108
Table of Contents
termination occurs. For a discussion of the other payments and benefits our NEOs are entitled to receive under their employment contracts following a termination of employment, including upon a change in control, please see “Employment Arrangements” below.
| Name |
Termination Trigger | Cash Separation Payment ($)(1) |
Health and Welfare and Life Insurance Benefits ($)(2)(3) |
Fair Value of Previously Unvested Restricted Shares(4) |
Value of Term Life Insurance ($)(5) |
|||||||||||
| Christopher D. Pappas |
Termination for Cause | $ | — | through the end of the month of termination |
$ | — | $ | — | ||||||||
| Termination Without Cause | $ | 5,000,000 | $1,080 | $ | 11,375,262 | $ | — | |||||||||
| Death | $ | — | through the end of the month of termination |
$ | 11,375,262 | $ | 250,000 | |||||||||
| Disability (3) | $ | — | $405 | $ | 11,375,262 | $ | — | |||||||||
| Change in Control | $ | 5,190,953 | (6) | $1,080 | $ | 24,668,160 | $ | — | ||||||||
| John A. Feenan |
Termination for Cause | $ | — | through the end of the month of termination |
$ | — | $ | — | ||||||||
| Termination Without Cause | $ | 2,575,000 | (7) | $24,656 | $ | — | $ | — | ||||||||
| Death | $ | 4,000,000 | (7) | through the end of the month of termination |
$ | — | $ | 250,000 | ||||||||
| Disability(3) | $ | — | $405 | $ | — | $ | — | |||||||||
| Change in Control | $ | 5,575,000 | (7) | $24,656 | $ | 5,638,530 | $ | — | ||||||||
| Curtis S. Shaw |
Termination for Cause | $ | — | through the end of the month of termination |
$ | — | $ | — | ||||||||
| Termination Without Cause | $ | 1,378,125 | $24,656 | $ | — | $ | — | |||||||||
| Death | $ | — | through the end of the month of termination |
$ | — | $ | 250,000 | |||||||||
| Disability(3) | $ | — | $405 | $ | — | $ | — | |||||||||
| Change in Control | $ | 1,378,125 | $24,656 | $ | 3,846,919 | $ | — | |||||||||
| Marco Levi |
Termination Without Cause | $ | 1,318,324 | $— | $ | — | $ | — | ||||||||
| Death | $ | — | $— | $ | — | $ | — | |||||||||
| Disability | |
salary up to 24 months as required by applicable law |
|
$ — | $ | — | $ | — | ||||||||
| Change in Control | $ | 1,318,324 | $ — | $ | 1,923,585 | $ | — | |||||||||
| Martin Pugh |
Termination for Cause | $ | — | through the end of the month of termination |
$ | — | $ | — | ||||||||
| Termination Without Cause | $ | 2,301,831 | through the end of the month of termination |
$ | — | $ | — | |||||||||
| Death | $ | — | through the end of the month of termination |
$ | — | $ | — | |||||||||
| Disability | |
Salary up to 12 months as required by applicable law |
|
through the end of the month of termination |
$ | — | $ | — | ||||||||
| Change in Control | $ | 2,301,831 | through the end of the month of termination |
$ | 3,282,158 | $ | — | |||||||||
| (1) | Cash separation payments are generally payable in installments except for payments upon a change in control, which are generally payable in a lump sum. |
109
Table of Contents
| (2) | Upon a termination of employment, the named executive officer is entitled to continue to receive coverage under our health and welfare benefit plans through the end of the month in which the executive terminates employment. |
| (3) | Messrs. Pappas, Feenan and Shaw are eligible to receive continued payment by the Company of term life insurance for the nine (9) month period from disability date and continued coverage under our health and welfare benefit plans as described in “Employment Arrangements” below. |
| (4) | Represents the current estimated fair value per share of our Parent shares as of December 31, 2013 for each of the time-based restricted shares that will vest in full or in part on certain specified terminations of employment, including on a change in control (other than a change in control resulting from an initial public offering). Change in control compensation amounts also include the value of performance-based restricted shares at the current estimated fair value per share of our Parent shares as of December 31, 2013 because we have assumed that the performance conditions applicable to such shares would have been satisfied had a change in control occurred on December 31, 2013. The actual treatment of performance-based restricted shares in connection with a change in control transaction may be different. |
| (5) | Represents the value of term life insurance payable on death. |
| (6) | Represents the value of cash severance ($5,000,000) plus the estimated value of creditable service remaining under the Supplemental Employee Retirement Plan ($190,953), which will be earned upon a change in control. |
| (7) | Represents (i) upon a termination of Mr. Feenan’s employment without cause, the value of cash severance ($1,575,000) plus the value of the next scheduled installment payment under his retention award ($1,000,000), (ii) upon death, the value of all remaining installment payments under Mr. Feenan’s retention award ($4,000,000), and (iii) upon a change in control, the value of cash severance ($1,575,000) plus the value of all remaining installment payments under Mr. Feenan’s retention award ($4,000,000). |
Employment Arrangements
Messrs. Pappas, Feenan and Shaw
In the event of an executive’s termination of employment for any reason, Messrs. Pappas, Feenan and Shaw will each be entitled to receive any unpaid base salary through the date of termination and all accrued and vested benefits under our vacation and other benefit plans and, except in the case of a termination by us for “cause” or by the executive without “good reason” (each, as defined in the executive’s employment agreement), (i) any annual bonus earned but unpaid with respect to the calendar year ending on or preceding the date of termination and (ii) a pro rata target bonus for the calendar year of termination. In the case of Mr. Pappas, in addition to the foregoing, he will be entitled to his retirement benefit as described above in “Pension and Other Postretirement Benefits—Supplemental Employee Retirement Benefit”.
Under Mr. Pappas’ agreement, in the event of his voluntary termination of employment without “good reason”, he shall provide the Company with one year’s written notice. In the event his termination date is less than one year following his written notice of termination, Mr. Pappas would not receive the pro rata target bonus for the calendar year of termination. In addition, the Company may purchase all or a portion of the New Securities at the lower of their fair market value or the original cost.
In addition to the severance benefits described above, upon termination of an executive by us without “cause” or by the executive for “good reason,” the executive will be entitled to receive the following severance benefits, subject to the executive’s timely execution of a general release of claims:
In the case of Mr. Pappas, he will be entitled to receive two times the sum of his annual base salary and target bonus, payable in equal monthly installments over the 24 month period following such termination, and continued health benefits for a period of 24 months following such termination, provided, however, that if he obtains other employment that offers group health benefits, such continued insurance coverage will terminate.
In the case of Messrs. Feenan and Shaw, they will be entitled to receive (i) an amount equal to one and one-half times the sum of their respective base salaries and target bonuses, payable in equal monthly installments over the eighteen month period following such termination, and (ii) continued health benefits until age 65 for each of Mr. Shaw and his spouse, and 18 months continuation for Mr. Feenan, provided, however, that if either executive obtains other employment that offers group health benefits, such continued insurance coverage will terminate with respect to such executive.
110
Table of Contents
To the extent that any executive experiences a termination of employment by us without “cause” or by the executive for “good reason” within two years following a “change in control” (as defined in the agreements), the cash severance benefits described above will be paid to such executive in a cash lump sum as opposed to in installments. In addition, in the case of Mr. Pappas, to the extent that the severance payments and benefits payable under his agreement would cause him to be liable for excise taxes by reason of the application of Sections 280G and 4999 of the Internal Revenue Code, and the Company’s equity securities are publicly traded on an established securities market in accordance with Section 280G, Mr. Pappas will be entitled to an additional “gross up” payment to indemnify him for the effect of the excise taxes.
For Messrs. Feenan and Shaw, to the extent that any payments that are considered to be contingent on a change in control would be subject to Sections 280G and 4999 of the Code, such payments will be limited to the threshold amount under Section 280G of the Code unless such payments are approved by at least 75% of our shareholders (other than Messrs. Feenan and Shaw). In the event that our stock becomes tradable on an established securities market, a shareholder vote will not be held and, instead, such payments will be limited if the net benefit to Messrs. Feenan and Shaw on an after-tax basis would be greater than receiving the full value of all payments and paying the excise tax.
The agreements contain a non-competition covenant that prohibits the executive from competing against us for a period of one year (or two years, in the case of Mr. Pappas) following termination of employment. The agreements also contain non-solicitation provisions that prohibit the executive from actively soliciting our employees, customers or suppliers during the period of employment and for a period of one year (or two years, in the case of Mr. Pappas) following termination of employment. The executives are also subject to perpetual confidentiality restrictions that protect our proprietary information, developments and other intellectual property.
Mr. Levi
In the event of his termination of employment for any reason, Mr. Levi will be entitled to receive any unpaid base salary through the date of termination and all accrued and vested benefits under our vacation and other benefit plans and, except in the case of a termination by us for “cause” (as defined in his employment letter agreement), any annual bonus earned but unpaid with respect to the calendar year ending on or preceding the date of termination. In addition, in the event of a termination of employment by reason of death or disability, Mr. Levi will be entitled to receive a pro rata annual bonus based on actual results for the year of termination. Mr. Levi will also receive payments required by applicable law upon a termination by reason of disability, as described in the preceding table.
In addition to the severance benefits described above, upon Mr. Levi’s termination by us without “cause” or his resignation for “good reason” (each, as defined in his letter agreement), subject to his timely execution of a general release of claims, Mr. Levi will be entitled to receive severance benefits in accordance with our general severance practices, but in no event will such severance benefits be less than the sum of (i) an amount equal to one times the sum of his base salary plus his target bonus at the time of termination, and (ii) a pro rata annual bonus based on actual results for the year of termination. Under our severance practices, Mr. Levi would have been entitled to one and one-half times his base salary and target bonus if he had terminated on December 31, 2013. Pursuant to an amendment to Mr. Levi’s letter agreement, which was approved by the compensation committee in 2013 and approved and executed by the Board in January 2014, Mr. Levi is entitled to receive, upon a termination by us without “cause” or his resignation for “good reason,” an amount equal to one and one-half times the sum of his base salary plus his target bonus, payable in equal monthly installments over the eighteen month period following such termination.
The letter agreement contains a non-competition covenant that prohibits Mr. Levi from competing against us for a period of one year following termination of employment. The letter agreement also contains nonsolicitation provisions that prohibit him from actively soliciting our employees, customers or suppliers during
111
Table of Contents
the period of employment and for a period of one year following termination of employment. Mr. Levi is also subject to perpetual confidentiality restrictions that protect our proprietary information, developments and other intellectual property.
Mr. Pugh
In the event of termination of his employment for any reason, Mr. Pugh will be entitled to receive any unpaid base salary through the date of termination and all accrued and vested benefits under our vacation and other benefit plans and, except in the case of a termination by us for “cause” or by the executive without “good reason” (each, as defined in his employment agreement) (i) any annual bonus earned but unpaid with respect to the calendar year ending on or preceding the date of termination; and (ii) an amount equal to the pro-rata portion of the executive’s target bonus for the calendar year of termination (determined by multiplying the target bonus for the year of termination by a fraction, the numerator of which is the number of days during the calendar year of termination that the Executive is employed by the Company and the denominator of which is 365). Mr. Pugh will also receive payments required by applicable law upon a termination by reason of disability, as described in the preceding table.
In addition to the severance benefits described above, upon termination of the executive by us without “cause” or by the executive for “good reason,” Mr. Pugh will be entitled to receive the following severance benefits, subject to his timely execution of a general release of claims: (i) an amount equal to two and one-half times the sum of his annual base salary and target bonus if the qualifying termination occurs prior to March 1, 2014, (ii) an amount equal to two times the sum of his annual base salary and target bonus if the qualifying termination occurs on or following March 1, 2014 but prior to March 1, 2015, or (iii) an amount equal to one and one-half times the sum of his annual base salary and target bonus if the qualifying termination occurs on or following March 1, 2015.
To the extent that Mr. Pugh experiences a termination of employment by us without “cause” or by him for “good reason” within two years following a “change in control” (as defined in his agreement), the cash severance benefits described above will be paid to such executive in a cash lump sum as opposed to in installments.
The agreement contains a non-competition covenant that prohibits Mr. Pugh from competing against us for a period of: (i) 30 months following termination of employment if termination occurs prior to March 1, 2014, (ii) 24 months following termination of employment if termination occurs on or following March 1, 2014 but prior to March 1, 2015, and (iii) 18 months following termination of employment if termination occurs on or following March 1, 2015. The agreement also contains non-solicitation provisions that prohibit the executive from actively soliciting our employees, customers or suppliers during the period of employment and for a period of six months following termination of employment. Mr. Pugh is also subject to perpetual confidentiality restrictions that protect our proprietary information, developments and other intellectual property.
Director Compensation
Annual Compensation
To date, we have not provided cash compensation to directors for their services as directors or members of committees of our Board. We have reimbursed and will continue to reimburse our non-employee directors for their reasonable expenses incurred in attending meetings of our Board and committees of the Board. The compensation received by Mr. Pappas as an employee during our 2013 fiscal year is included in the Summary Compensation Table above and he did not receive any additional compensation for his service on our board of directors.
112
Table of Contents
| Item 12. | Security Ownership of Certain Beneficial Owners and Management and Related Stockholder Matters |
As of the date of this filing, we were wholly owned by Bain Capital Everest Manager Holding SCA, which we refer to in this Annual Report as our Parent. The following table sets forth information as of January 30, 2014 regarding the beneficial ownership of our shares owned by each person or group who is known by us to beneficially own more than 5% of our outstanding ordinary shares, and the beneficial ownership of shares of our Parent by each of our named executive officers, our directors and all of our executive officers and directors as a group.
As of December 31, 2013, we had 16,275,328,617 ordinary shares outstanding. All of our outstanding ordinary shares were held by Parent, as reflected in the following table.
Unless otherwise indicated in the table or footnotes below, the address for each beneficial owner is c/o Trinseo S.A., 1000 Chesterbrook Boulevard, Suite 300, Berwyn, Pennsylvania 19312. Beneficial ownership has been determined in accordance with the applicable rules and regulations promulgated under the Exchange Act. The information is not necessarily indicative of beneficial ownership for any other purpose. Under these rules, beneficial ownership includes any shares as to which the individual or entity has sole or shared voting or investment power and any shares as to which the individual or entity has the right to acquire beneficial ownership within 60 days after January 30, 2014 through the exercise of any option, warrant or other right. For purposes of calculating each person’s or group’s percentage ownership, ordinary shares issuable pursuant to options exercisable within 60 days after January 30, 2014 are included as outstanding and beneficially owned for that person or group but are not treated as outstanding for the purpose of computing the percentage ownership of any other person or group. The inclusion in the following table of those shares, however, does not constitute an admission that the named shareholder is a direct or indirect beneficial owner. To our knowledge, except under applicable community property laws or as otherwise indicated, the persons named in the table have sole voting and sole investment control with respect to all shares shown as beneficially owned.
| Shares beneficially owned | ||||||||
| Name |
Number of shares |
Percentage of class |
||||||
| Bain Capital Everest Manager Holding SCA(1) |
16,275,328,617 | 100 | % | |||||
| Christopher D. Pappas(2) |
73,095 | * | ||||||
| John Feenan(3) |
7,844 | * | ||||||
| Curtis S. Shaw(4) |
14,119 | * | ||||||
| Marco Levi(5) |
6,809 | * | ||||||
| Martin Pugh(6) |
— | — | ||||||
| Ailbhe M. Jennings |
— | — | ||||||
| Seth A. Meisel(7) |
— | — | ||||||
| Michel G. Plantevin |
— | — | ||||||
| Brian W. Chu(7) |
— | — | ||||||
| Stephen M. Zide(7) |
— | — | ||||||
| All executive officers and directors as a group (16 persons) |
112,358 | 2.8 | % | |||||
| * | Indicates less than one percent. |
| (1) | The general partner of Parent is Bain Capital Everest Manager S.à.r.l. (“BCEM”). By virtue of the relationships described in this footnote, BCEM may be deemed to exercise voting and dispositive power with respect to the shares held by Parent. Ailbhe Jennings and Michel Plantevin are each managers of BCEM. Each of the managers of BCEM disclaims beneficial ownership of such shares to the extent attributed to such member solely by virtue of serving as a manager of BCEM. BCEM’s address is:4, rue Lou Hemmer, L-1748 Luxembourg, Grand Duchy of Luxembourg. |
113
Table of Contents
| (2) | Represents ordinary shares of Parent and does not include (i) a restricted share award of 24,206 shares subject to performance based vesting conditions or (ii) 20,000,000 preferred equity certificates of Parent, or PECs, held by Mr. Pappas, which are not convertible into ordinary shares of Parent. |
| (3) | Represents ordinary shares of Parent and does not include (i) a restricted share award of 17,429 shares subject to performance based vesting conditions or (ii) 50,000,000 PECs held by Mr. Feenan. |
| (4) | Represents ordinary shares of Parent and does not include a restricted share award of 15,492 shares subject to performance based vesting conditions held by Mr. Shaw. |
| (5) | Represents ordinary shares of Parent and does not include (i) a restricted share award of 7,745 shares subject to performance based vesting conditions or (ii) 15,000,000 PECs held by Mr. Levi. |
| (6) | Does not include a Parent restricted share award of 7,745 shares subject to performance based vesting conditions. |
| (7) | Does not include shares of Parent held by certain investment funds managed or advised by Bain Capital Partners, LLC whose ultimate general partner is Bain Capital Investors, LLC (“BCI”). Each of Messrs. Meisel and Zide is a Managing Director of BCI and Mr. Chu is an operating partner of BCI. The address for Messrs. Meisel, Zide and Chu is c/o Bain Capital Partners, LLC, John Hancock Tower, 200 Clarendon Street, Boston, Massachusetts 02116. |
| Item 13. | Certain Relationships and Related Transactions, and Director Independence |
Set forth below are certain transactions and relationships between us or our Parent and our directors, executive officers and equity holders that have occurred during the last three years.
Advisory Agreement and Transaction Services Agreement
Prior to our formation, our business was wholly owned by Dow. On June 17, 2010, we were acquired from Dow by investment funds advised or managed by affiliates of Bain Capital Partners, LLC (the “Acquisition”), with Dow purchasing an approximately 7.5% interest in our parent company. Dow’s ownership is now approximately 6.8%.
In connection with the Acquisition, two of our indirect subsidiaries entered into the Advisory Agreement with Bain Capital Partners, LLC and Portfolio Company Advisors Limited, or the Advisors, pursuant to which the Advisors provide us with management and consulting services and financial and other advisory services. Pursuant to the Advisory Agreement, we pay the Advisors an advisory fee of $1.0 million per fiscal quarter plus reimbursement for reasonable out-of-pocket fees.
In connection with the Acquisition, one of our indirect subsidiaries entered into a transaction services agreement (the “Transaction Services Agreement”) with Bain Capital Partners, LLC pursuant to which Bain Capital Partners, LLC provides us with certain advice and services related to transaction-specific functions. Pursuant to the Transaction Services Agreement, we will pay Bain Capital Partners, LLC a fee equal to 1% of the transaction value of each financing, acquisition, disposition or change of control or similar transaction by or involving us, plus reimbursement for reasonable out-of-pocket fees. Bain Capital Partners, LLC received fees of approximately $13.9 million related to the issuance of the Senior Notes and the amendment to our Senior Secured Credit Facility in January 2013 and approximately $6.2 million related to other refinancing transactions. Fees incurred for these management and advisory services, including fees related to the Acquisition and our financing arrangements, were $18.6 million, $4.6 million and 11.4 million, respectively for the years ended December 31, 2013, 2012 and 2011.
The Advisory Agreement and Transaction Services Agreement each have a 10-year initial term and thereafter are subject to automatic one-year extensions unless a party thereto provides written notice of termination. In addition, during the initial term, Bain Capital Partners, LLC and, with respect to the Advisory Agreement, Portfolio Company Advisors Limited, may terminate the Advisory Agreement or Transaction Services Agreement upon written notice to the Company and each agreement will automatically terminate upon
114
Table of Contents
an initial public offering or a change of control. If the Advisory Agreement is terminated early, then the Advisors will be entitled to receive all unpaid fees and unreimbursed out-of-pocket fees and expenses to the date of termination, as well as, in certain circumstances, the present value of the advisory fee that would otherwise have been payable through the end of the term. The Advisory Agreement and Transaction Services Agreement include customary exculpation indemnities in favor of Bain Capital Partners, LLC and, in the case of the Advisory Agreement, Portfolio Company Advisors Limited which survive termination of the agreements.
Executive Subscription and Securityholder’s Agreements
In connection with the Acquisition and the subsequent recruitment of our management team, our Parent entered into the Executive Subscription Agreements with certain members of our management team (the “Executives”). The Executive Subscription Agreements provide, among other things, for sales of the Co-Invest Shares and the Incentive Shares to the Executives, subject to vesting over periods of up to five years and, as to a partner of such Incentive Shares, subject to performance vesting. We and investment funds advised or managed by Bain Capital Partners LLC have a call option to purchase any ordinary shares received by the Executive in the event the Executive ceases to be employed by us as follows (subject to certain exceptions): (i) subject to (iii) below relating to restrictive covenant breaches, all of the Co-Invest Shares, at Fair Market Value within the six-month period following the Executive’s termination; (ii) if the Executive is terminated (A) without Cause (as defined in the applicable Executive Subscription Agreement), (B) by reason of death or Disability (as defined in the applicable Executive Subscription Agreement), (C) for Good Reason (as defined in the applicable Executive Subscription Agreement) or (D) without Good Reason after the third anniversary of the commencement of the Executive’s employment term, all of the Incentive Shares which vested, at Fair Market Value, and the portion of the Incentive Shares which are unvested securities, at the lower of their Fair Market Value and the original subscription price; and (iii) (A) if the Executive is terminated for Cause, or without Good Reason on or prior to the third anniversary of the commencement of the Executive’s employment term or (B) if the Executive materially breaches any restrictive covenant set forth in the applicable Executive Subscription Agreement without timely curing such breach or the Executive willfully breaches such restrictive covenants, all of the Incentive Shares, whether vested or unvested, at the lower of Fair Market Value and the original subscription price. In addition, under the Executive Subscription Agreements, the Executives must make customary representations and warranties to us and the investment funds advised or managed by Bain Capital Partners, LLC. Subject to certain exceptions and limitations, each Executive under his or her respective Executive Subscription Agreement is also subject to customary restrictive covenants including, among others, (i) non-disclosure of confidential information, (ii) a non-compete for a period ending one year after his or her termination date and (iii) non-solicitation of customers and employees for a period ending one year after his or her termination date.
Shareholder Agreement
In connection with the Acquisition, our Parent entered into the Investor Subscription and Shareholder Agreement (the “Shareholder Agreement”) with Dow and investment funds advised or managed by Bain Capital Partners, LLC. The Shareholder Agreement provides, among other things, for the subscription of the Co-Invest Shares and the Incentive Shares by investment funds advised or managed by Bain Capital Partners, LLC, and Dow and for the composition of our board of directors, including the appointment of up to three directors by the investment funds advised or managed by Bain Capital Partners, LLC. Under the Shareholder Agreement, if the investment funds advised or managed by Bain Capital Partners, LLC, sell more than 50% of their ordinary shares or effect a sale of the company (as defined in the Shareholder Agreement) (a “Required Sale”), any holders of ordinary shares other than investment funds advised or managed by Bain Capital Partners, LLC, including the Executives, must transfer their ordinary shares in the Required Sale, and shall receive in exchange for their ordinary shares, the same price per share that the investment funds advised or managed by Bain Capital Partners, LLC, received in the Required Sale. In certain limited cases described in the Shareholder Agreement if Dow or the executives transfer their ordinary shares, we have the right of first offer of such ordinary shares. The investment funds advised or managed by Bain Capital Partners, LLC, also have a limited right of first offer in the event that Dow or the
115
Table of Contents
executives wish to sell their ordinary shares. The Shareholder Agreement also grants pre-emptive rights to the investment funds advised or managed by Bain Capital Partners, LLC, Dow and the executives under certain limited circumstances described in the Shareholder Agreement. The Shareholder Agreement also provides certain restrictions on the sale of Co-Invest and other Investor Shares without our prior written consent, subject to certain exceptions, including but not limited to transfers to permitted transferees and transfers pursuant to rights under the Registration Rights Agreement, tag along rights, a Required Sale, rights of first offer and a Public Sale (as defined in the Shareholder Agreement) of our ordinary shares. These restrictions are in effect with respect to each ordinary share covered by the Shareholder Agreement until such ordinary shares have been transferred in a Public Sale or Sale of the Company.
Registration Rights Agreement
In connection with the Acquisition, Parent entered into a Registration Rights Agreement (the “Registration Rights Agreement”) with Dow, Mr. Pappas and investment funds advised or managed by Bain Capital Partners, LLC. The Registration Rights Agreement, provided that funds associated with Bain Capital may request the registration of their Registrable Securities, and the investment funds advised or managed by Bain Capital Partners, LLC, Dow and, subject to certain limitations, Mr. Pappas, are entitled to participate on a pro rata basis in such registration. The investment funds advised or managed by Bain Capital Partners, LLC, Dow and Mr. Pappas are also entitled to participate on a pro rata basis in any registration of Ordinary Shares (as defined in the Registration Rights Agreement) under the Securities Act, whether or not caused by the investment funds advised or managed by Bain Capital Partners, LLC, subject to certain limitations and exceptions. The parties to the Registration Rights Agreement are also prohibited from transferring their shares under certain conditions, including but not limited to the period beginning on the date the Parent delivers notice that it is undertaking an offering and through the date that is 180 days after the effective date of an initial public offering, except as part of such initial public offering. Pursuant to the Registration Rights Agreement, the Parent has agreed to indemnify parties thereto from certain liabilities incurred in connection with material misstatements or omissions included in any registration statements filed in accordance with the Registration Rights Agreement. The Parent is responsible for paying expenses of such holders of the Parent’s ordinary shares in connection with any such registration.
Review, Approval or Ratification of Transactions with Related Parties
We have not implemented formal policies and procedures for the review, approval or ratification of related-party transactions that may be required to be reported under the SEC’s disclosure rules. Currently, such transactions, if and when they are proposed or have occurred, are reviewed by one or more of the Board, the operating committee, audit committee or the compensation committee (other than the directors or committee members involved, if any) on a case-by-case basis, depending on whether the nature of the transaction would otherwise be under the purview of the audit committee, operating committee or the compensation committee or the Board.
| Item 14. | Accounting Fees and Services |
Auditors’ Fees
The following table shows the fees for professional audit services rendered by PricewaterhouseCoopers LLP for the audit of our annual financial statements and review of our interim financial statements for 2013 and 2012, and fees for other services rendered by PricewaterhouseCoopers LLP for 2013 and 2012.
| Fees |
2013 | 2012 | ||||||
| Audit fees(1) |
$ | 4,680,658 | $ | 3,724,785 | ||||
| Audit-related fees(2) |
60,000 | 60,000 | ||||||
| Tax fees(3) |
4,056,096 | 5,909,489 | ||||||
| All other fees(4) |
59,800 | 63,600 | ||||||
|
|
|
|
|
|||||
| Total Fees |
$ | 8,856,554 | $ | 9,757,874 | ||||
|
|
|
|
|
|||||
116
Table of Contents
| (1) | Consists of the annual financial statement audit and quarterly reviews, as well as services performed in conjunction with other SEC, regulatory, and statutory filings. |
| (2) | Consists of services related to the audit of our Company savings plan |
| (3) | Consists of worldwide tax services primarily related to income tax return preparation and certain tax advisory services. |
| (4) | Consists of other services, including certain attestation services and statutory accounting advice. |
All of the above auditor’s fees were pre-approved by the audit committee.
Audit Committee Pre-Approval of Audit and Permissible Non-Audit Services of Independent Registered Public Accounting Firm
The audit committee pre-approves all audit and permissible non-audit services provided by our independent registered public accounting firm. These services may include audit services, audit-related services, tax services and other services. The audit committee has adopted policies and procedures for the pre-approval of services provided by our independent registered public accounting firm. The policies and procedures provide that management and our independent registered public accounting firm jointly submit to the audit committee a schedule of audit and non-audit services for approval as part of the annual plan for each year. In addition, the policies and procedures provide that the audit committee may also pre-approve particular services not in the annual plan on a case-by-case basis. For each proposed service, management must provide a detailed description of the service and the projected fees and costs (or a range of such fees and costs) for the service. The policies and procedures require management and our independent registered public accounting firm to provide quarterly updates to the audit committee regarding services rendered to date and services yet to be performed.
117
Table of Contents
| Item 15. | Exhibits, Financial Statement Schedules |
(a) Exhibits
See Exhibit Index.
(b) Financial Statements:
The financial statements required to be included in this Annual Report are included at pages F-1 to F-65.
118
Table of Contents
Pursuant to the requirements of Section 13 or 15(d) of the Securities Act of 1934, the registrant has duly caused this report to be signed on its behalf by the undersigned, thereunto duly authorized, in the City of Luxembourg, the Grand Duchy of Luxembourg, on March 14, 2014.
| TRINSEO MATERIALS OPERATING S.C.A. | ||
| By: | /S/ AILBHE JENNINGS | |
| Name: | Ailbhe Jennings | |
| Title: | Manager of Trinseo Materials S.à r.l., its general partner | |
KNOW ALL PERSONS BY THESE PRESENTS, that each person whose signature appears below constitutes and appoints David Stasse and John A. Feenan, and each of them, as his true and lawful attorneys-in-fact and agents, with full power of substitution and resubstitution, for him and in his name, place, and stead, in any and all capacities, to sign any and all amendments to this Annual Report on Form 10-K and to file the same, with all exhibits thereto and other documents in connection therewith, with the Securities and Exchange Commission, granting unto said attorneys-in-fact and agents and each of them, full power and authority to do and perform each and every act and thing requisite and necessary to be done in connection therewith as fully to all intents and purposes as he might or could do in person, hereby ratifying and confirming all that said attorneys-in-fact and agents, or any of them, or their or his substitute or substitutes, may lawfully do or cause to be done by virtue hereof.
Pursuant to the requirements of the Securities Act of 1934, this report has been signed by the following persons in the capacities and on the dates indicated.
| Signature | Title | Date | ||
| /S/ CHRISTOPHER D. PAPPAS Christopher D. Pappas |
President and Chief Executive Officer (Principal Executive Officer) |
March 14, 2014 | ||
| /S/ JOHN A. FEENAN John A. Feenan |
Executive Vice President and Chief Financial Officer (Principal Financial and Accounting Officer) |
March 14, 2014 | ||
| /S/ AILBHE JENNINGS Ailbhe Jennings |
Manager of Trinseo Materials S.à r.l., general partner of Trinseo Materials Operating S.C.A. |
March 14, 2014 | ||
119
Table of Contents
SIGNATURES
Pursuant to the requirements of Section 13 or 15(d) of the Securities Act of 1934, the registrant has duly caused this report to be signed on its behalf by the undersigned, thereunto duly authorized, in the City of Berwyn, State of Pennsylvania, on March 14, 2014.
| TRINSEO MATERIALS FINANCE, INC. | ||
| By: | /S/ CHRISTOPHER D. PAPPAS | |
| Name: | Christopher D. Pappas | |
| Title: | President and Chief Executive Officer | |
POWER OF ATTORNEY
KNOW ALL PERSONS BY THESE PRESENTS, that each person whose signature appears below constitutes and appoints David Stasse and John A. Feenan, and each of them, as his true and lawful attorneys-in-fact and agents, with full power of substitution and resubstitution, for him and in his name, place, and stead, in any and all capacities, to sign any and all amendments to this Annual Report on Form 10-K and to file the same, with all exhibits thereto and other documents in connection therewith, with the Securities and Exchange Commission, granting unto said attorneys-in-fact and agents and each of them, full power and authority to do and perform each and every act and thing requisite and necessary to be done in connection therewith as fully to all intents and purposes as he might or could do in person, hereby ratifying and confirming all that said attorneys-in-fact and agents, or any of them, or their or his substitute or substitutes, may lawfully do or cause to be done by virtue hereof.
Pursuant to the requirements of the Securities Act of 1934, this report has been signed by the following persons in the capacities and on the dates indicated.
| Signature | Title | Date | ||
| /S/ CHRISTOPHER D. PAPPAS Christopher D. Pappas |
Director, President and Chief Executive Officer (Principal Executive Officer) |
March 14, 2014 | ||
| /S/ JOHN A. FEENAN John A. Feenan |
Executive Vice President, Chief Financial Officer and Interim Principal Accounting Officer (Principal Financial and Accounting Officer) |
March 14, 2014 | ||
120
Table of Contents
Supplemental Information to be Furnished With Reports Filed
Pursuant to Section 15(d) of the Act by Registrants Which Have Not
Registered Securities Pursuant to Section 12 of the Act
As of the date of filing of this report, no annual report or proxy material has been sent to security holders.
121
Table of Contents
INDEX TO CONSOLIDATED FINANCIAL STATEMENTS
| * | The audited financial statements of Americas Styrenics LLC as of December 31, 2013 and 2012 and for the years ended December 31, 2013, 2012 and 2011 have been included in this Annual Report in accordance with the requirements of Rule 3-09 of Regulation S-X. |
F-1
Table of Contents
Report of Independent Registered Public Accounting Firm
To the Board of Directors and Shareholder of Trinseo S.A.
In our opinion, the accompanying consolidated balance sheets and related consolidated statements of operations, of comprehensive income (loss), of shareholder’s equity and of cash flows present fairly, in all material respects, the financial position of Trinseo S.A. and its subsidiaries at December 31, 2013 and December 31, 2012, and the results of its operations and its cash flows for each of the three years ended December 31, 2013, in conformity with accounting principles generally accepted in the United States of America. In addition, in our opinion, the financial statement schedule listed in the accompanying index presents fairly, in all material respects, the information set forth therein when read in conjunction with the related consolidated financial statements. These financial statements and financial statement schedule are the responsibility of the Company’s management. Our responsibility is to express an opinion on these financial statements and financial statement schedule based on our audits. We conducted our audits in accordance with the standards of the Public Company Accounting Oversight Board (United States). Those standards require that we plan and perform the audit to obtain reasonable assurance about whether the financial statements are free of material misstatement. An audit includes examining, on a test basis, evidence supporting the amounts and disclosures in the financial statements. An audit also includes assessing the accounting principles used and significant estimates made by management, as well as evaluating the overall financial statement presentation. We believe that our audits provide a reasonable basis for our opinion.
/s/ PricewaterhouseCoopers LLP
Philadelphia, Pennsylvania
March 14, 2014
F-2
Table of Contents
Consolidated Balance Sheets
(In thousands, except per share data)
| December 31, | ||||||||
| 2013 | 2012 | |||||||
| Assets |
||||||||
| Current assets |
||||||||
| Cash and cash equivalents |
$ | 196,503 | $ | 236,357 | ||||
| Restricted cash |
— | 7,852 | ||||||
| Accounts receivable, net of allowance |
717,482 | 695,364 | ||||||
| Inventories |
530,191 | 582,740 | ||||||
| Deferred income tax assets |
9,820 | 4,353 | ||||||
| Other current assets |
22,750 | 21,011 | ||||||
|
|
|
|
|
|||||
| Total current assets |
1,476,746 | 1,547,677 | ||||||
|
|
|
|
|
|||||
| Investments in unconsolidated affiliates |
155,887 | 140,304 | ||||||
| Property, plant and equipment, net |
606,427 | 633,272 | ||||||
| Other assets |
||||||||
| Goodwill |
37,273 | 36,103 | ||||||
| Other intangible assets, net |
171,514 | 179,642 | ||||||
| Deferred income tax assets—noncurrent |
42,938 | 67,204 | ||||||
| Deferred charges and other assets |
83,996 | 61,494 | ||||||
|
|
|
|
|
|||||
| Total other assets |
335,721 | 344,443 | ||||||
|
|
|
|
|
|||||
| Total assets |
$ | 2,574,781 | $ | 2,665,696 | ||||
|
|
|
|
|
|||||
| Liabilities and shareholder’s equity |
||||||||
| Current liabilities |
||||||||
| Short-term borrowings and current portion of long-term debt |
$ | 8,754 | $ | 98,133 | ||||
| Accounts payable |
509,093 | 572,182 | ||||||
| Income taxes payable |
9,683 | 11,084 | ||||||
| Deferred income tax liabilities |
2,903 | 2,628 | ||||||
| Accrued expenses and other current liabilities |
136,129 | 85,575 | ||||||
|
|
|
|
|
|||||
| Total current liabilities |
666,562 | 769,602 | ||||||
|
|
|
|
|
|||||
| Noncurrent liabilities |
||||||||
| Long-term debt |
1,327,667 | 1,355,451 | ||||||
| Deferred income tax liabilities—noncurrent |
26,932 | 40,367 | ||||||
| Other noncurrent obligations |
210,418 | 208,611 | ||||||
|
|
|
|
|
|||||
| Total noncurrent liabilities |
1,565,017 | 1,604,429 | ||||||
|
|
|
|
|
|||||
| Commitments and contingencies (Note O) |
||||||||
| Shareholder’s equity |
||||||||
| Common stock, $0.01 nominal value, 16,275,329 shares authorized, issued and outstanding at December 31, 2013 and 2012 |
162,753 | 162,753 | ||||||
| Additional paid-in-capital |
176,675 | 166,725 | ||||||
| Accumulated deficit |
(84,604 | ) | (62,386 | ) | ||||
| Accumulated other comprehensive income |
88,378 | 24,573 | ||||||
|
|
|
|
|
|||||
| Total shareholder’s equity |
343,202 | 291,665 | ||||||
|
|
|
|
|
|||||
| Total liabilities and shareholder’s equity |
$ | 2,574,781 | $ | 2,665,696 | ||||
|
|
|
|
|
|||||
The accompanying notes are an integral part of these consolidated financial statements.
F-3
Table of Contents
Consolidated Statements of Operations
(In thousands)
| Year Ended December 31, |
||||||||||||
| 2013 | 2012 | 2011 | ||||||||||
| Net sales |
$ | 5,307,414 | $ | 5,451,909 | $ | 6,192,858 | ||||||
| Cost of sales |
4,949,404 | 5,115,188 | 5,797,277 | |||||||||
|
|
|
|
|
|
|
|||||||
| Gross profit |
358,010 | 336,721 | 395,581 | |||||||||
| Selling, general and administrative expenses |
216,858 | 182,069 | 308,644 | |||||||||
| Equity in earnings of unconsolidated affiliates |
39,138 | 27,140 | 23,874 | |||||||||
|
|
|
|
|
|
|
|||||||
| Operating income |
180,290 | 181,792 | 110,811 | |||||||||
| Interest expense, net |
132,038 | 109,971 | 111,416 | |||||||||
| Loss on extinguishment of long-term debt |
20,744 | — | 55,666 | |||||||||
| Other expense (income), net |
27,877 | 23,979 | (20,094 | ) | ||||||||
|
|
|
|
|
|
|
|||||||
| Income (loss) before income taxes |
(369 | ) | 47,842 | (36,177 | ) | |||||||
| Provision for income taxes |
21,849 | 17,560 | 39,728 | |||||||||
|
|
|
|
|
|
|
|||||||
| Net income (loss) |
$ | (22,218 | ) | $ | 30,282 | $ | (75,905 | ) | ||||
|
|
|
|
|
|
|
|||||||
The accompanying notes are an integral part of these consolidated financial statements.
F-4
Table of Contents
Consolidated Statements of Comprehensive Income (Loss)
(In thousands, unless otherwise stated)
| Year Ended December 31, |
||||||||||||
| 2013 | 2012 | 2011 | ||||||||||
| Net income (loss) |
$ | (22,218 | ) | $ | 30,282 | $ | (75,905 | ) | ||||
| Other comprehensive income (loss), net of tax (tax amounts shown in millions below for 2013, 2012, and 2011, respectively): |
||||||||||||
| Cumulative translation adjustments (net of tax of $0, $0.1, and $0.1) |
53,339 | 23,872 | (39,360 | ) | ||||||||
| Pension and other postretirement benefit plans: |
||||||||||||
| Prior service credit (cost) arising during period (net of tax of $1.7, $0, and $0.8) |
10,548 | — | (1,626 | ) | ||||||||
| Net gain (loss) arising during period (net of tax of $(1.3), $17.7, and $4.3) |
(3,545 | ) | (51,880 | ) | 9,882 | |||||||
| Amounts reclassified from accumulated other comprehensive income (loss)(1) : |
||||||||||||
| Curtailment and settlement loss (gain) (net of tax of $0.6, $0, and $0) |
1,502 | (247 | ) | (164 | ) | |||||||
| Amortization of prior service cost (credit) included in net periodic pension costs (net of tax of $(0.1), $0.1, and $0) |
(890 | ) | 94 | — | ||||||||
| Amortization of net loss(gain) included in net periodic pension costs (net of tax of $1.0, $0.2, and $0.1) |
2,851 | (454 | ) | 367 | ||||||||
|
|
|
|
|
|
|
|||||||
| Total other comprehensive income (loss) |
63,805 | (28,615 | ) | (30,901 | ) | |||||||
|
|
|
|
|
|
|
|||||||
| Comprehensive income (loss) |
$ | 41,587 | $ | 1,667 | $ | (106,806 | ) | |||||
|
|
|
|
|
|
|
|||||||
| (1) | These other comprehensive income (loss) components are included in the computation of net periodic benefit costs (see Note P) |
The accompanying notes are an integral part of these consolidated financial statements.
F-5
Table of Contents
Consolidated Statements of Shareholder’s Equity
(In thousands, except share data)
| Common stock | Additional Paid-In Capital |
Accumulated Other Comprehensive Income (Loss) |
Accumulated Deficit |
Total | ||||||||||||||||||||
| Shares | Amount | |||||||||||||||||||||||
| Balance at December 31, 2010 |
71,736,950 | $ | 717 | $ | 658,450 | $ | 84,089 | $ | (16,763 | ) | $ | 726,493 | ||||||||||||
| Distribution to shareholder |
(11,908,333 | ) | (119 | ) | (521,347 | ) | — | — | (521,466 | ) | ||||||||||||||
| Net loss |
— | — | — | — | (75,905 | ) | (75,905 | ) | ||||||||||||||||
| Other comprehensive loss |
— | — | — | (30,901 | ) | — | (30,901 | ) | ||||||||||||||||
| Stock-based compensation |
— | — | 22,294 | — | — | 22,294 | ||||||||||||||||||
|
|
|
|
|
|
|
|
|
|
|
|
|
|||||||||||||
| Balance at December 31, 2011 |
59,828,617 | $ | 598 | $ | 159,397 | $ | 53,188 | $ | (92,668 | ) | $ | 120,515 | ||||||||||||
| Contributions from shareholder |
16,215,500,000 | 162,155 | — | — | — | 162,155 | ||||||||||||||||||
| Net income |
— | — | — | — | 30,282 | 30,282 | ||||||||||||||||||
| Other comprehensive loss |
— | — | — | (28,615 | ) | — | (28,615 | ) | ||||||||||||||||
| Stock-based compensation |
— | — | 7,328 | — | — | 7,328 | ||||||||||||||||||
|
|
|
|
|
|
|
|
|
|
|
|
|
|||||||||||||
| Balance at December 31, 2012 |
16,275,328,617 | $ | 162,753 | $ | 166,725 | $ | 24,573 | $ | (62,386 | ) | $ | 291,665 | ||||||||||||
| Net loss |
— | — | — | — | (22,218 | ) | (22,218 | ) | ||||||||||||||||
| Other comprehensive income |
— | — | — | 63,805 | — | 63,805 | ||||||||||||||||||
| Stock-based compensation |
— | — | 9,950 | — | — | 9,950 | ||||||||||||||||||
|
|
|
|
|
|
|
|
|
|
|
|
|
|||||||||||||
| Balance at December 31, 2013 |
16,275,328,617 | $ | 162,753 | $ | 176,675 | $ | 88,378 | $ | (84,604 | ) | $ | 343,202 | ||||||||||||
|
|
|
|
|
|
|
|
|
|
|
|
|
|||||||||||||
The accompanying notes are an integral part of these consolidated financial statements.
F-6
Table of Contents
Consolidated Statements of Cash Flows
(In thousands)
| Year Ended December 31, |
||||||||||||
| 2013 | 2012 | 2011 | ||||||||||
| Cash flows from operating activities | ||||||||||||
| Net income (loss) |
$ | (22,218 | ) | $ | 30,282 | $ | (75,905 | ) | ||||
| Adjustments to reconcile net income (loss) to net cash provided by operating activities |
||||||||||||
| Depreciation and amortization |
95,196 | 85,604 | 101,611 | |||||||||
| Amortization of deferred financing costs and issuance discount |
9,547 | 8,537 | 8,070 | |||||||||
| Deferred income tax |
4,215 | 4,734 | 7,042 | |||||||||
| Stock-based compensation |
9,950 | 7,328 | 22,294 | |||||||||
| Earnings of unconsolidated affiliates, net of dividends |
(16,638 | ) | (6,169 | ) | (13,874 | ) | ||||||
| Loss on extinguishment of debt |
20,744 | — | 55,666 | |||||||||
| Prepayment penalty on long-term debt |
— | — | (7,679 | ) | ||||||||
| Loss (gain) on sale of businesses and other assets |
4,186 | 263 | (478 | ) | ||||||||
| Impairment charges |
13,851 | 245 | — | |||||||||
| Changes in assets and liabilities |
||||||||||||
| Accounts receivable |
(5,643 | ) | 84,678 | 66,970 | ||||||||
| Inventories |
55,369 | (87,241 | ) | 53,934 | ||||||||
| Accounts payable and other current liabilities |
15,001 | 67,887 | (37,680 | ) | ||||||||
| Income taxes payable |
(1,241 | ) | (5,142 | ) | (27,621 | ) | ||||||
| Other assets, net |
2,384 | (12,672 | ) | (18,130 | ) | |||||||
| Other liabilities, net |
26,632 | 7,781 | 16,866 | |||||||||
|
|
|
|
|
|
|
|||||||
| Cash provided by operating activities |
211,335 | 186,115 | 151,086 | |||||||||
|
|
|
|
|
|
|
|||||||
| Cash flows from investing activities |
||||||||||||
| Capital expenditures |
(73,544 | ) | (118,504 | ) | (99,811 | ) | ||||||
| Proceeds from capital expenditures subsidy |
18,769 | 6,079 | — | |||||||||
| Proceeds from the sale of businesses and assets |
15,221 | 253 | — | |||||||||
| Advance payment received (refunded) |
(2,711 | ) | 2,602 | — | ||||||||
| Distributions from unconsolidated affiliates |
1,055 | — | 7,196 | |||||||||
| Interest rate caps |
— | — | (262 | ) | ||||||||
| (Increase) / decrease in restricted cash |
7,852 | (7,725 | ) | (6,250 | ) | |||||||
|
|
|
|
|
|
|
|||||||
| Cash used in investing activities |
(33,358 | ) | (117,295 | ) | (99,127 | ) | ||||||
|
|
|
|
|
|
|
|||||||
| Cash flows from financing activities |
||||||||||||
| Deferred financing fees |
(48,255 | ) | (8,080 | ) | (20,304 | ) | ||||||
| Short term borrowings, net |
(42,877 | ) | (37,887 | ) | 737 | |||||||
| Distribution to shareholder |
— | — | (521,467 | ) | ||||||||
| Capital contribution |
— | 162,155 | — | |||||||||
| Net proceeds from issuance of Term Loans |
— | — | 1,399,690 | |||||||||
| Repayments of Term Loans |
(1,239,000 | ) | (147,000 | ) | (794,000 | ) | ||||||
| Principal payments on Seller Note |
— | — | (75,000 | ) | ||||||||
| Proceeds from issuance of Senior Notes |
1,325,000 | — | — | |||||||||
| Proceeds from issuance of Accounts Receivable Securitization Facility |
376,630 | 113,828 | 66,784 | |||||||||
| Repayments of Accounts Receivable Securitization Facility |
(471,696 | ) | (130,233 | ) | (31,574 | ) | ||||||
| Proceeds from the draw of revolving debt |
405,000 | 1,105,000 | 1,125,000 | |||||||||
| Repayments on the revolving debt |
(525,000 | ) | (1,135,000 | ) | (1,105,000 | ) | ||||||
|
|
|
|
|
|
|
|||||||
| Cash provided by (used in) financing activities |
(220,198 | ) | (77,217 | ) | 44,866 | |||||||
| Effect of exchange rates on cash |
2,367 | (559 | ) | 350 | ||||||||
|
|
|
|
|
|
|
|||||||
| Net change in cash and cash equivalents |
(39,854 | ) | (8,956 | ) | 97,175 | |||||||
| Cash and cash equivalents—beginning of period |
236,357 | 245,313 | 148,138 | |||||||||
|
|
|
|
|
|
|
|||||||
| Cash and cash equivalents—end of period |
$ | 196,503 | $ | 236,357 | $ | 245,313 | ||||||
|
|
|
|
|
|
|
|||||||
| Supplemental disclosure of cash flow information |
||||||||||||
| Cash paid for income taxes, net of refunds |
$ | 24,779 | $ | 20,444 | $ | 41,472 | ||||||
| Cash paid for interest, net of amounts capitalized |
$ | 83,509 | $ | 98,046 | $ | 107,309 | ||||||
| Accrual for property, plant and equipment |
$ | 11,156 | $ | 13,155 | $ | 13,722 | ||||||
The accompanying notes are an integral part of these consolidated financial statements.
F-7
Table of Contents
TRINSEO S.A.
Notes to Consolidated Financial Statements
(Dollars in thousands, unless otherwise stated)
NOTE A—ORGANIZATION AND BUSINESS ACTIVITIES
On June 3, 2010, Bain Capital Everest Manager Holding SCA (the “Parent”), an affiliate of Bain Capital Partners, LLC (“Bain Capital”), was formed through investment funds of Bain Capital with The Dow Chemical Company (“Dow”) investing $48.8 million for a 7.5% interest in the Parent. Trinseo S.A. (“Trinseo” or the “Company”) was formed on June 3, 2010 and is incorporated under the existing laws of the Grand Duchy of Luxembourg. All common shares of Trinseo are owned by the Parent.
On June 17, 2010, Trinseo acquired 100% of the former Styron business from Dow through Styron S.à.r.l., a wholly owned subsidiary of Trinseo. Prior to June 17, 2010, Styron business was a wholly owned business of Dow. Refer to Note C for additional description of the Styron business acquisition. The Company commenced operations immediately upon the acquisition of the former Styron business from Dow.
Trinseo is a leading global materials company dedicated to the innovation and delivery of specialty and customized emulsion polymers and plastics. Trinseo’s unique product portfolio brings together plastics, rubber and latex businesses that share feedstocks, operations, customers and end users.
Trinseo’s operations are located in North America, Europe and the Middle East, Latin America (including Mexico), and Asia Pacific (which includes Asia as well as Australia and New Zealand), supplemented by two strategic joint ventures, Sumika Styron Polycarbonate Limited (“Sumika Styron”) and Americas Styrenics LLC (“AmSty” a polystyrene joint venture with Chevron Phillips Chemical Company LP). Refer to Note D for further information regarding our investments in these unconsolidated affiliates. The Company’s large and diverse global customer base consists principally of major industrial companies. Trinseo focuses on developing tailored product solutions for its customers, who it serves locally, with 35 manufacturing plants at 27 sites (which include a total of 83 production units) in 14 countries, inclusive of joint ventures and contract manufacturers.
NOTE B—BASIS OF PRESENTATION AND SUMMARY OF SIGNIFICANT ACCOUNTING POLICIES
Basis of Presentation and Principles of Consolidation
On June 17, 2010, the Company acquired 100% of the interests in the Styron business from Dow (the “Acquisition”). As a result of the Acquisition, the Company applied purchase accounting and began a new basis of accounting. Refer to Note C for further discussion. All periods prior to the Acquisition may be referred to herein as the “predecessor periods”, while those after the Acquisition may be referred to as “successor periods”.
The accompanying consolidated financial statements of the Company as of December 31, 2013 and 2012 and for each of the three years ended 2013 were prepared in accordance with accounting principles generally accepted in the United States of America (“GAAP”). The consolidated financial statements of the Company contain the accounts of all entities that are controlled and variable interest entities (“VIEs”) for which the Company is the primary beneficiary. All intercompany balances and transactions have been eliminated. Corporate joint ventures over which the Company has the ability to exercise significant influence that are not consolidated are accounted for by the equity method.
A VIE is defined as a legal entity that has equity investors that do not have sufficient equity at risk for the entity to support its activities without additional subordinated financial support or, as a group, the holders of the equity at risk lack (i) the power to direct the entity’s activities or (ii) the obligation to absorb the expected losses or the right to receive the expected residual returns of the entity. A VIE is required to be consolidated by a company if that company is the primary beneficiary. Refer to Note J for further discussion of the Company’s accounts receivable securitization facility.
F-8
Table of Contents
Certain prior year amounts have been reclassified to conform to the current year presentation. These reclassifications did not have a material impact on the Company’s financial position.
Use of Estimates in Financial Statement Preparation
The preparation of financial statements in conformity with GAAP requires management to make estimates and assumptions that affect the amounts reported in the consolidated financial statements and accompanying notes. Actual amounts could differ from these estimates.
Concentration of Credit Risk
Financial instruments that potentially subject the Company to concentrations of credit risk consist principally of cash equivalents and accounts receivables. The Company uses major financial institutions with high credit ratings to engage in transactions involving cash equivalents. The Company minimizes credit risk in its receivables from customers through its sale of products to a wide variety of customers and markets in locations throughout the world.
The Company performs ongoing credit evaluations of its customers and generally does not require collateral. The Company maintains an allowance for doubtful accounts for losses resulting from the inability of specific customers to meet their financial obligations to the Company. A specific reserve for doubtful receivables is recorded against the amount due from these customers. For all other customers, the Company recognizes reserves for doubtful receivables based on historical experience. The allowance for doubtful accounts is the Company’s best estimate of probable credit losses in existing trade accounts receivable.
Financial Instruments
The carrying amounts of the Company’s financial instruments, including cash and cash equivalents, accounts receivable, accounts payable and accrued and other current liabilities, approximate fair value because of their generally short maturities.
The estimated fair value of the Senior Notes issued by the Company in January 2013 is determined using level 2 inputs within the fair value hierarchy. As of December 31, 2013, the Senior Notes had a fair value of approximately $1,366.4 million.
In prior years, the estimated fair value of the Term Loans, which were fully repaid by the Company in January 2013, was determined using level 1 inputs within the fair value hierarchy. As of December 31, 2012, the Term Loans’ carrying amount of $1,239.0 million was determined to approximate fair value as the Term Loans were redeemed at par in January 2013.
When outstanding, the estimated fair values of borrowings under the Company’s Revolving Facility and Accounts Receivable Securitization Facility are determined using level 2 inputs within the fair value hierarchy. The carrying amounts of borrowings under the Revolving Facility and Accounts Receivable Securitization Facility approximate fair value as these borrowings bear interest based on prevailing variable market rates.
At times, the Company manages its exposure to changes in foreign currency exchange rates and fluctuations in interest rates, where possible, by entering into foreign exchange forward contracts and interest rate cap agreements, respectively. When outstanding, all derivatives, whether designated in hedging relationships or not, are required to be recorded on the balance sheet at fair value. The fair value of the derivatives is determined from sources independent of the Company, including the financial institutions which are party to the derivative instruments. The fair value of derivatives also considers the credit default risk of the paying party. If the derivative is designated as a fair value hedge, the changes in the fair value of the derivative and the hedged item will be recognized in earnings. If the derivative is designated as a cash flow hedge, the effective portion of the
F-9
Table of Contents
change in the fair value of the derivative will be recorded in other comprehensive income and will be recognized in the consolidated statements of operations when the hedged item affects earnings. As of December 31, 2013, the Company has no foreign exchange forward contracts or interest rate cap agreements outstanding. In 2012, however, the Company had interest rate cap agreements and foreign exchange forward contracts, which were not accounted or designated for hedge accounting treatment. As such, changes in the fair value of these agreements were recognized in the consolidated statements of operations. The loss on fair value of these agreements was recorded in interest expense while the gain or loss on fair value of our foreign exchange forward contracts was recorded in other expense (income) in the consolidated statements of operations. Cash flows from derivatives not designated for hedge accounting treatment were classified in the operating activities of the statements of cash flows.
Foreign Currency Translation
For the majority of the operations, the local currency has been determined to be the functional currency. In the remainder of territories, the U.S. dollar has been determined to be the functional currency due to the significant influence of the U.S. dollar on operations. Gains and losses resulting from the translation of the functional currency into U.S. dollars for financial statement presentation are not included in determining net income (loss), but are accumulated in the cumulative translation adjustment account as a separate component of shareholder’s equity (accumulated other comprehensive income). The Company translates asset and liability balances at exchange rates in effect at the end of the period and income and expense transactions at the average exchange rates in effect during the period. Gains and losses resulting from foreign currency transactions are included in the determination of net income (loss).
For the years ended December 31, 2013 and 2012, net foreign exchange transaction losses of $18.3 million and $18.0 million, respectively, were recognized, while for the year ended December 31, 2011, a net foreign exchange transaction gain of $17.2 million was recognized. Gains and losses on net foreign exchange transactions are recorded within “Other expense (income)” in the consolidated statement of operations.
Environmental Matters
Accruals for environmental matters are recorded when it is probable that a liability has been incurred and the amount of the liability can be reasonably estimated based on current law and existing technologies. These accruals are adjusted periodically as assessment and remediation efforts progress, or as additional technical or legal information become available. Accruals for environmental liabilities are included in “Other noncurrent obligations” in the consolidated balance sheets at undiscounted amounts. As of December 31, 2013 and 2012, no accruals for environmental liabilities were recorded.
Environmental costs are capitalized if the costs extend the life of the property, increase its capacity, or mitigate or prevent contamination from future operations. Environmental costs are also capitalized in recognition of legal asset retirement obligations resulting from the acquisition, construction or normal operation of a long-lived asset. Any costs related to environmental contamination treatment and cleanups are charged to expense. Estimated future incremental operations, maintenance and management costs directly related to remediation are accrued when such costs are probable and reasonably estimable.
Cash and Cash Equivalents
Cash and cash equivalents generally include time deposits or highly liquid investments with original maturities of three months or less.
Inventories
Inventories are stated at the lower of cost or market, with cost being determined on the first-in, first-out (“FIFO”) method. The Company periodically reviews its inventory for excess or obsolete inventory, and will write-down the excess or obsolete inventory value to its net realizable value, if applicable.
F-10
Table of Contents
Property, Plant and Equipment
Property, plant and equipment are carried at cost less any impairment and are depreciated over estimated useful lives using the straight-line method. Capitalized costs associated with computer software for internal use are amortized on a straight-line basis over 5 years.
Expenditures for maintenance and repairs are charged against income as incurred. Expenditures that significantly increase asset value, extend useful asset lives or adapt property to a new or different use are capitalized. These expenditures include planned major maintenance activity or turnaround activities which increase our manufacturing plants’ output and improve production efficiency as compared to pre-turnaround operations. As of December 31, 2013 and 2012, $13.1 million and $13.8 million, respectively, of the Company’s net costs related to turnaround activities are capitalized to deferred charges within “Deferred charges and other assets” in the consolidated balance sheet, and are amortized over a period until the next scheduled turnaround.
The Company periodically monitors actual experience to determine whether events and circumstances have occurred that may warrant revision of the estimated useful lives of property, plant and equipment. Engineering and other costs directly related to the construction of property, plant and equipment are capitalized as construction in progress until construction is complete and such property, plant and equipment is ready and available to perform its specifically assigned function. Upon retirement or other disposal, the asset cost and related accumulated depreciation are removed from the accounts and the net amount, less any proceeds, is charged or credited to income. The Company also capitalizes interest as a component of the cost of capital assets constructed for its own use.
Impairment and Disposal of Long-Lived Assets
The Company evaluates long-lived assets and certain identifiable intangible assets for impairment whenever events or changes in circumstances indicate that the carrying amount of an asset or asset grouping may not be recoverable. When undiscounted future cash flows are not expected to be sufficient to recover an asset’s carrying amount, the asset is written down to its fair value based on a discounted cash flow analysis utilizing market participant assumptions.
Long-lived assets to be disposed of by sale are classified as held for sale and are reported at the lower of carrying amount or fair value less cost to sell, and depreciation is ceased. Long-lived assets to be disposed of other than by sale are classified as held and used until they are disposed.
Goodwill and Other Intangible Assets
The Company records goodwill when the purchase price of a business acquisition exceeds the estimated fair value of net identified tangible and intangible assets acquired. Goodwill is tested for impairment at the reporting unit level annually, or more frequently when events or changes in circumstances indicate that the fair value of a reporting unit has more likely than not declined below its carrying value. The Company utilizes a market approach and/or a discounted cash flow methodology to calculate the fair value of its reporting units. The annual impairment assessment is completed using a measurement date of October 1st. No impairment loss was recorded in 2013, 2012 and 2011.
Finite-lived intangible assets, such as our intellectual property, are amortized on a straight-line basis. Finite-lived intangible assets are reviewed for impairment or obsolescence if events or changes in circumstances indicate that the carrying amount of an intangible asset may not be recoverable. If impaired, intangible assets are written down to fair value based on discounted cash flows.
Deferred Financing Fees
Capitalized fees and costs incurred in connection with the Company’s financing arrangements are included in “Deferred charges and other assets” in the consolidated balance sheets. For the Senior Notes (and the Term
F-11
Table of Contents
Loans prior to their repayment in January 2013), deferred financing fees are amortized over the term of the agreement using the effective interest method, while for the Revolving Facility and the Accounts Receivable Securitization Facility, deferred financing fees are amortized using the straight-line method over the term of the respective facility. Amortization of deferred financing fees is reflected in “Interest expense, net” in the consolidated statement of operations.
Investments in Unconsolidated Affiliates
Investments in unconsolidated affiliates where the Company has the ability to exercise significant influence (generally, 20% to 50% owned companies) are accounted for using the equity method. Investments are evaluated for impairment whenever events or changes in circumstances indicate that the carrying amount of the investment may not be recoverable. An impairment loss is recorded whenever a decline in fair value of an investment in an unconsolidated affiliate below its carrying amount is determined to be other than temporary.
Sales
Sales are recognized when the revenue is realized or realizable, and the earnings process is complete which occurs when risk and title to the product transfers to the customer, which usually occurs at the time shipment is made. As such, title to the product usually passes when the product is delivered to the freight carrier. Standard terms of delivery are included in contracts of sale, order confirmation documents and invoices. Freight costs and any directly related costs of transporting finished product to customers are recorded as “Cost of sales” in the consolidated statements of operations. Taxes on sales are excluded from net sales.
Sales are recorded net of estimates for returns and price allowances, including discounts for prompt payment and volume-based incentives.
Cost of Sales
The Company classifies the costs of manufacturing and distributing its products as cost of sales. Manufacturing costs include raw materials, utilities, packaging and fixed manufacturing costs associated with production. Fixed manufacturing costs include such items as plant site operating costs and overhead, production planning, depreciation and amortization, repairs and maintenance, environmental, and engineering costs. Distribution costs include shipping and handling costs.
Selling, General and Administrative Expenses
Selling, general and administrative (“SG&A”) expenses are charged to expense as incurred. SG&A expenses are the cost of services performed by the marketing and sales functions (including sales managers, field sellers, marketing research, marketing communications and promotion and advertising materials) and by administrative functions (including product management, research and development (“R&D”) business management, customer invoicing, and human resources). R&D expenses include the cost of services performed by the R&D function, including technical service and development, process research including pilot plant operations, and product development.
Total R&D costs included in SG&A expenses were approximately $49.7 million, $48.3 million and $58.1 million for the years ended December 31, 2013, 2012 and 2011, respectively.
The Company expenses promotional and advertising costs as incurred to SG&A expenses. Total promotional and advertising expense was approximately $3.0 million, $3.2 million and $6.6 million for the years ended December 31, 2013, 2012 and 2011, respectively.
F-12
Table of Contents
Pension and Postretirement Benefits Plans
The Company has several defined benefit plans, under which participants earn a retirement benefit based upon a formula set forth in the plan. Accounting for defined benefit pension plans, and any curtailments thereof, requires various assumptions, including, but not limited to, discount rates, expected rates of return on plan assets and future compensation growth rates. The Company evaluates these assumptions at least once each year, or as facts and circumstances dictate, and makes changes as conditions warrant. The Company also provides certain health care and life insurance benefits to retired employees mainly to certain retirees in the United States. The plans provide health care benefits, including hospital, physicians’ services, drug and major medical expense coverage, and life insurance benefits.
Income Taxes
The provision for income taxes is determined using the asset and liability approach of accounting for income taxes. Under this approach, deferred taxes represent the future tax consequences expected to occur when the reported amounts of assets and liabilities are recovered or paid. The provision for income taxes represents income taxes paid or payable for the current year plus the change in deferred taxes during the year. Deferred taxes result from differences between the financial and tax basis of the Company’s assets and liabilities and are adjusted for changes in tax rates and tax laws when changes are enacted. Valuation allowances are recorded to reduce deferred tax assets when it is more likely than not that a tax benefit will not be realized. Provision has been made for income taxes on unremitted earnings of subsidiaries and affiliates, except for subsidiaries in which earnings are deemed to be indefinitely invested.
The Company recognizes the financial statement effects of uncertain income tax positions when it is more likely than not, based on the technical merits, that the position will be sustained upon examination. The Company accrues for other tax contingencies when it is probable that a liability to a taxing authority has been incurred and the amount of the contingency can be reasonably estimated. Interest accrued related to unrecognized tax and income tax related penalties are included in the provision for income taxes. The current portion of uncertain income taxes positions is included in “Income taxes payable” and the long-term portion is included in “Other noncurrent obligations” in the consolidated balance sheets.
Income tax expense recognized for the year ended December 31, 2012 includes cumulative adjustments of $4.1 million and $2.0 million from 2010 and 2011, respectively, which resulted in a reduction of income tax expense, net, of approximately $6.1 million. These adjustments relate to the correction of prior period errors, which resulted from the reconciliation of income tax provision to tax return positions completed during 2012. The Company believes this is not material to the Company’s results of operations for the years ended December 31, 2012 and 2011.
Stock-based Compensation
Stock-based compensation expense is measured at the grant date, based on the fair value of the award. Time-based restricted stock awards are generally recognized as expense on a graded vesting basis over the service period. For performance-based restricted stock awards, the Company recognizes compensation cost if and when it concludes that it is probable that the performance condition will be achieved. The Company calculates the fair value of its performance-based restricted stock awards using a combination of a call option and digital option model.
Periodically, the Parent may sell non-transferable restricted stock to certain officers and key members of management of the Company. Stock-based compensation expense on this non-transferable restricted stock is recognized if the non-transferable restricted stock is purchased at a price which is less than the fair value of the Parent’s common stock.
F-13
Table of Contents
Recent Accounting Guidance
In February 2013, the FASB issued an amendment to the disclosure requirements for presentation of comprehensive income, which requires presentation (either in a single note or parenthetically on the face of the financial statements) of the effect of significant amounts reclassified from each component of accumulated other comprehensive income based on its source and the income statement line items affected by the reclassification. If a component is not required to be reclassified to net income in its entirety, a cross reference to the related footnote for additional information will be required. The amendment was effective and adopted by the Company as of January 1, 2013. The implementation of the amended accounting guidance did not have a material impact on the Company’s consolidated financial position or results of operations.
In December 2011, the FASB issued guidance for Balance Sheet: Disclosures about Offsetting Assets and Liabilities, which requires entities to disclose both gross and net information about both instruments and transactions eligible for offset in the statement of financial position and instruments and transactions subject to an agreement similar to a master netting agreement to facilitate users of the financial statements understand the effect of those arrangements on the Company’s financial position. In January 2013, the FASB issued further guidance that clarifies the scope of the offsetting disclosures. The guidance is effective for fiscal years, and interim periods within those years, beginning on or after January 1, 2013. Retrospective presentation for all comparative periods presented is required. The Company adopted the guidance effective as of January 1, 2013 and the adoption did not have a material impact on the Company’s financial position and results of operations.
In February 2013, the FASB issued amendments for the recognition, measurement, and disclosure of obligations resulting from joint and several liability arrangements for which the total amount of the obligation is fixed at the reporting date, except for obligations addressed within existing guidance. This guidance requires an entity to measure those obligations as the sum of the amount the reporting entity agreed to pay on the basis of its arrangement among its co-obligors and any additional amount the reporting entity expects to pay on behalf of its co-obligors. This guidance also requires an entity to disclose the nature and amount of the obligation as well as other information about those obligations. This amendment is effective on a retrospective basis for fiscal years and interim periods within those fiscal years beginning after December 15, 2013 and early adoption is permitted. The Company is currently evaluating this amendment but the Company does not expect the impact of adoption to be material.
In March 2013, the FASB issued amendments to address the accounting for the cumulative translation adjustment when a parent either sells a part or all of its investment in a foreign entity or no longer holds a controlling financial interest in a subsidiary or group of assets that is a nonprofit activity or a business within a foreign entity. The amendments are effective prospectively for fiscal years (and interim reporting periods within those years) beginning after December 15, 2013 (early adoption is permitted). The initial adoption has no impact on the Company’s financial position and results of operations. The Company will apply the guidance prospectively to derecognition events occurring after the effective date.
In July 2013, the FASB issued guidance which permits an entity to designate the Fed Funds Effective Swap Rate, also referred to as the overnight index swap rate, as a benchmark interest rate in a hedge accounting relationship. In addition, the guidance removes the restriction on using different benchmark interest rates for similar hedges. The guidance was effective in July 2013. This guidance has no impact on the Company’s financial position and results of operations.
In July 2013, the FASB issued guidance to clarify the presentation of an unrecognized tax benefit when a net operating loss carryforward, a similar tax loss, or a tax credit carryforward exists. The new guidance requires that unrecognized tax benefits be netted against all available same-jurisdiction losses or other tax carryforwards that would be utilized, rather than only against carryforwards that are created by the unrecognized tax benefits. The guidance is effective for fiscal years, and interim periods within those years, beginning after December 15, 2013, and should be applied prospectively to all unrecognized tax benefits that exist at the effective date.
F-14
Table of Contents
Retrospective application is permitted. The Company believes the adoption will not have a significant impact to the current presentation.
NOTE C—ACQUISITIONS AND DIVESTITURES
Styron Acquisition
On March 2, 2010, STY Acquisition Corp. (“STY Acquisition”), an affiliate of Bain Capital, entered into a sale and purchase agreement (the “Purchase Agreement”) with Dow, Styron LLC and Styron Holding B.V. (together with Styron LLC, the “Styron Holdcos”) pursuant to which STY Acquisition agreed to acquire 100% of the outstanding equity interests of the Styron Holdcos. STY Acquisition, subsequently (but prior to the close of the transaction) assigned its rights and obligations under the Purchase Agreement to Styron S.à r.l., the Company’s indirect wholly owned subsidiary. The consideration for the purchase of Styron Holdcos was approximately $1,509.4 million, subject to customary adjustments for working capital, employee liabilities and certain other amounts. These amounts included a $75.0 million of notes payable to Dow (the “Seller Note”), which was subsequently repaid to Dow in 2011, and which is discussed further in Note J. Subsequent to the closing of the Acquisition, the Company paid $55.8 million in closing date working capital adjustments.
The Company accounted for the Acquisition under the purchase method of accounting in accordance with the applicable authoritative guidance for Business Combinations, whereby the purchase price paid was allocated to the acquired assets and liabilities at fair value. As of June 17, 2011, the one-year measurement period surrounding the Acquisition ended. During 2012, certain adjustments were identified related to the Acquisition accounting. As such, the Company recorded $8.7 million to goodwill to correct our final purchase price allocation with the offsets recorded primarily to deferred income taxes and pension liabilities. The Company does not believe this is material to any of the prior year consolidated financial statements. Accordingly, the purchase price allocation for the acquisition was considered complete in 2012. As part of the Acquisition, the Company has been indemnified for various tax matters, including income tax and value add taxes, as well as legal liabilities which have been incurred prior to the Acquisition. Conversely, certain tax matters which the Company has benefitted from are subject to reimbursement by Trinseo to Dow. These amounts have been estimated and provisional amounts have been recorded based on the information known during the measurement period; however, these amounts remain subject to change based on the completion of our annual statutory filings, tax authority review as well as a final resolution with Dow on amounts due to and due from the Company. Management believes the Company’s estimates and assumptions are reasonable under the circumstances, however, settlement negotiations or changes in estimates around pre-acquisition indemnifications could result in a material impact on the consolidated financial statements.
During 2013, the Company received $6.7 million, net of tax indemnity from Dow for income taxes paid to the taxing authorities relating to the period prior to the Acquisition, which was previously recorded within “Accounts receivable, net of allowance” in the consolidated balance sheet. There were no other indemnity payments received from Dow or indemnity payments to Dow during the years ended December 31, 2013, 2012, and 2011, respectively.
Divestiture of Expandable Polystyrene Business
In June 2013, the Company’s board of directors approved the sale of its EPS business within the Company’s Styrenics segment, under a sale and purchase agreement which was signed in July 2013. The sale closed on September 30, 2013 and the Company received $15.2 million of sales proceeds during the third quarter, subject to a $0.7 million working capital adjustment due to be paid by the Company during the first quarter of 2014. The
F-15
Table of Contents
Company recognized a loss from the sale of $4.2 million recorded in “Other expense (income), net” in the consolidated statement of operations for the year ended December 31, 2013. The loss calculation is as follows:
| Assets |
||||
| Inventories |
$ | 8,135 | ||
| Property, plant and equipment, net |
9,401 | |||
| Other intangibles assets, net |
1,624 | |||
| Goodwill |
383 | |||
|
|
|
|||
| Total assets sold |
$ | 19,543 | ||
|
|
|
|||
| Liabilities |
||||
| Pension and other benefits |
$ | 791 | ||
|
|
|
|||
| Total liabilities sold |
$ | 791 | ||
|
|
|
|||
| Net assets sold |
$ | 18,752 | ||
| Sales proceeds, net of amount payable to buyer of $0.7 million |
14,566 | |||
|
|
|
|||
| Loss on sale |
$ | 4,186 | ||
|
|
|
EPS business results of operations were not classified as discontinued operations as the Company will have significant continuing cash flows as a result of a long-term supply agreement of styrene monomer to the EPS business, which was entered into contemporaneously with the sale and purchase agreement. The supply agreement will have an initial term of approximately 10 years from the closing date of the sale and will continue year-to-year thereafter. Under the supply agreement, we will supply a minimum of approximately 77 million pounds and maximum of approximately 132 million pounds of styrene monomer annually or equivalent to 70% to 100% of the EPS business’s historical production consumption.
NOTE D—INVESTMENTS IN UNCONSOLIDATED AFFILIATES
As noted within Note A, Trinseo is supplemented by two strategic joint ventures: AmSty (a polystyrene joint venture with Chevron Phillips Chemical Company LP) and Sumika Styron (a polycarbonate joint venture with Sumitomo Chemical Company Limited).
At December 31, 2013 and 2012, respectively, Trinseo’s investment in AmSty was $118.3 million and $101.3 million. At December 31, 2013 and 2012, respectively, Trinseo’s investment in AmSty was $130.8 million and $150.7 million less than Trinseo’s 50% share of AmSty’s underlying net assets. This amount represents the difference between the book value of assets contributed to the joint venture at the time of formation (May 1, 2008) and Trinseo’s 50% share of the total recorded value of the joint venture’s assets and certain adjustments to conform with the Company’s accounting policies. This difference is being amortized over a weighted average remaining useful life of the contributed assets of approximately 7.0 years as of December 31, 2013. The Company received dividends from AmSty of $22.5 million, $20.0 million, and $10.0 million for the years ended December 31, 2013, 2012, and 2011, respectively.
At December 31, 2013 and 2012, respectively, Trinseo’s investment in Sumika Styron was $37.6 million and $39.0 million. At December 31, 2013 and 2012, respectively, Trinseo’s investment in Sumika Styron was $20.8 million and $18.6 million greater than Trinseo’s 50% share of Sumika Styron’s underlying net assets. This amount represents the fair value of certain identifiable assets which have not been recorded on the historical financial statements of Sumika Styron. This difference is being amortized over the remaining useful life of the contributed assets of 11.75 years as of December 31, 2013. The Company received dividends from Sumika Styron of $1.1 million, $1.0 million, and $7.2 million (net of withholding taxes) for the years ended December 31, 2013, 2012, and 2011, respectively.
F-16
Table of Contents
Equity in earnings from unconsolidated affiliates was $39.1 million, $27.1 million and $23.9 million for the years ended December 31, 2013, 2012, and 2011, respectively.
Both of the unconsolidated affiliates are privately held companies; therefore, quoted market prices for their stock are not available.
The summarized financial information of the Company’s unconsolidated affiliates is shown below:
| December 31, | ||||||||
| 2013 | 2012 | |||||||
| Current assets |
$ | 528,223 | $ | 519,462 | ||||
| Noncurrent assets |
333,894 | 365,245 | ||||||
|
|
|
|
|
|||||
| Total assets |
$ | 862,117 | $ | 884,707 | ||||
|
|
|
|
|
|||||
| Current liabilities |
$ | 281,823 | $ | 278,180 | ||||
| Noncurrent liabilities |
48,415 | 60,110 | ||||||
|
|
|
|
|
|||||
| Total liabilities |
$ | 330,238 | $ | 338,290 | ||||
|
|
|
|
|
|||||
| Year Ended December 31, |
||||||||||||
| 2013 | 2012 | 2011 | ||||||||||
| Sales |
$ | 2,281,045 | $ | 2,058,060 | $ | 1,999,493 | ||||||
| Gross profit |
$ | 94,148 | $ | 82,511 | $ | 63,125 | ||||||
| Net income (loss) |
$ | 38,504 | $ | 21,408 | $ | (5,294 | ) | |||||
Sales to unconsolidated affiliates for the years ended December 31, 2013, 2012, and 2011 were $8.2 million, $9.5 million and $13.7 million, respectively. Purchases from unconsolidated affiliates were $274.4 million, $269.1 million and $286.1 million for the years ended December 31, 2013, 2012 and 2011, respectively.
At December 31, 2013 and 2012, respectively, $3.3 million and $2.3 million due from unconsolidated affiliates was included in Accounts receivable and $29.9 million and $26.6 million due to unconsolidated affiliates was included in Accounts payable.
NOTE E—ACCOUNTS RECEIVABLE
Accounts receivable consisted of the following:
| December 31, | ||||||||
| 2013 | 2012 | |||||||
| Trade receivables |
$ | 584,160 | $ | 566,309 | ||||
| Non-income tax receivables |
94,069 | 91,390 | ||||||
| Other receivables |
45,119 | 46,035 | ||||||
| Less: allowance for doubtful accounts |
(5,866 | ) | (8,370 | ) | ||||
|
|
|
|
|
|||||
| Total |
$ | 717,482 | $ | 695,364 | ||||
|
|
|
|
|
|||||
The allowance for doubtful accounts was approximately $5.9 million and $8.4 million at December 31, 2013 and 2012, respectively. As a result of changes in the estimate of allowance for doubtful accounts, for the year ended
F-17
Table of Contents
December 31, 2013, the Company recognized a benefit of $3.0 million, while for the years ended December 31, 2012 and 2011, the Company recognized bad debt expense of $0.3 million and $4.6 million, respectively.
NOTE F—INVENTORIES
Inventories consisted of the following:
| December 31, | ||||||||
| 2013 | 2012 | |||||||
| Finished goods |
$ | 302,379 | $ | 334,986 | ||||
| Raw materials and semi-finished goods |
191,081 | 213,409 | ||||||
| Supplies |
36,731 | 34,345 | ||||||
|
|
|
|
|
|||||
| Total |
$ | 530,191 | $ | 582,740 | ||||
|
|
|
|
|
|||||
NOTE G—PROPERTY, PLANT AND EQUIPMENT
Property, plant and equipment consisted of the following:
| Estimated Useful Lives (Years) |
December 31, | |||||||||
| 2013 | 2012 | |||||||||
| Land |
Not applicable | $ | 50,982 | $ | 48,576 | |||||
| Land and waterway improvements |
1-20 | 13,603 | 12,901 | |||||||
| Buildings |
2-40 | 58,447 | 54,582 | |||||||
| Machinery and equipment(1) |
1-20 | 627,068 | 600,455 | |||||||
| Utility and supply lines |
1-10 | 7,100 | 5,251 | |||||||
| Leasehold interests |
1-45 | 50,009 | 49,677 | |||||||
| Other property |
1-8 | 27,260 | 13,898 | |||||||
| Construction in process |
Not applicable | 55,753 | 39,679 | |||||||
|
|
|
|
|
|||||||
| Property, plant and equipment |
890,222 | 825,019 | ||||||||
| Less: accumulated depreciation |
(283,795 | ) | (191,747 | ) | ||||||
|
|
|
|
|
|||||||
| Property, plant and equipment, net |
$ | 606,427 | $ | 633,272 | ||||||
|
|
|
|
|
|||||||
| (1) | Approximately 94% of our machinery and equipment had a useful life of three to ten years as of December 31, 2013 and 2012. |
| Year Ended December 31, |
||||||||||||
| 2013 | 2012 | 2011 | ||||||||||
| Depreciation expense |
$ | 75,401 | $ | 68,312 | $ | 86,542 | ||||||
| Capitalized interest |
$ | 3,142 | $ | 6,178 | $ | 1,737 | ||||||
During the three months ended December 31, 2013, the Company determined that the long-lived assets at our polycarbonate manufacturing facility in Stade, Germany should be assessed for impairment driven primarily by continued losses experienced in our polycarbonate business. This assessment indicated that the carrying amount of the long-lived assets at this facility were not recoverable when compared to the expected undiscounted cash flows of our polycarbonate business. Based upon our assessment of fair value of this asset group, the Company concluded these assets were fully impaired as of December 31, 2013. The fair value of the asset group was determined under the income approach utilizing a discounted cash flow (“DCF”) model. The key assumptions used in the DCF model included growth rates and cash flow projections, discount rate, tax rate and an estimated terminal value.
F-18
Table of Contents
As a result, in the year ended December 31, 2013, we recorded an impairment loss of approximately $9.2 million. The amount was recorded within “Selling, general and administrative expenses” in the consolidated statement of operations and allocated entirely to the Engineered Polymers segment.
NOTE H—GOODWILL AND INTANGIBLE ASSETS
Goodwill
The following table shows changes in the carrying amount of goodwill, by segment, from December 31, 2011 to December 31, 2012 and December 31, 2012 to December 31, 2013, respectively:
| Emulsion Polymers | Plastics | Total | ||||||||||||||||||
| Latex | Synthetic Rubber |
Styrenics | Engineered Polymers |
|||||||||||||||||
| Balance at December 31, 2011 |
$ | 10,387 | $ | 7,114 | $ | 6,322 | $ | 2,438 | $ | 26,261 | ||||||||||
| Purchase accounting adjustments (Note C) |
3,435 | 2,352 | 2,091 | 806 | 8,684 | |||||||||||||||
| Foreign currency impact |
458 | 314 | 278 | 108 | 1,158 | |||||||||||||||
|
|
|
|
|
|
|
|
|
|
|
|||||||||||
| Balance at December 31, 2012 |
$ | 14,280 | $ | 9,780 | $ | 8,691 | $ | 3,352 | $ | 36,103 | ||||||||||
| Divestiture (Note C) |
— | — | (383 | ) | — | (383 | ) | |||||||||||||
| Foreign currency impact |
621 | 425 | 361 | 146 | 1,553 | |||||||||||||||
|
|
|
|
|
|
|
|
|
|
|
|||||||||||
| Balance at December 31, 2013 |
$ | 14,901 | $ | 10,205 | $ | 8,669 | $ | 3,498 | $ | 37,273 | ||||||||||
|
|
|
|
|
|
|
|
|
|
|
|||||||||||
Goodwill impairment testing is performed annually as of October 1st. In 2013, the Company performed its annual impairment test for goodwill and determined that the estimated fair value of each reporting unit was substantially in excess of the carrying value indicating that none of the Company’s goodwill was impaired. The Company concluded there were no impairments or triggering events for the years ended December 31, 2013, 2012, and 2011.
Other Intangible Assets
The following table provides information regarding the Company’s other intangible assets as of December 31, 2013 and 2012, respectively:
| December 31, 2013 | December 31, 2012 | |||||||||||||||||||||||||||
| Estimated Useful Life (Years) |
Gross Carrying Amount |
Accumulated Amortization |
Net | Gross Carrying Amount |
Accumulated Amortization |
Net | ||||||||||||||||||||||
| Developed technology |
15 | $ | 210,546 | $ | (49,713 | ) | $ | 160,833 | $ | 203,812 | $ | (34,535 | ) | $ | 169,277 | |||||||||||||
| Software |
5 | 11,034 | (4,099 | ) | 6,935 | 8,849 | (1,973 | ) | 6,876 | |||||||||||||||||||
| Software in development |
N/A | 3,746 | — | 3,746 | 3,489 | — | 3,489 | |||||||||||||||||||||
|
|
|
|
|
|
|
|
|
|
|
|
|
|||||||||||||||||
| Total |
$ | 225,326 | $ | (53,812 | ) | $ | 171,514 | $ | 216,150 | $ | (36,508 | ) | $ | 179,642 | ||||||||||||||
|
|
|
|
|
|
|
|
|
|
|
|
|
|||||||||||||||||
Amortization expense related to finite-lived intangible assets totaled $15.7 million, $14.7 million, and $15.1 million, for the years ended December 31, 2013, 2012 and 2011, respectively.
| Estimated Amortization Expense for the Next Five Years | ||||||||||||||||
|
2014 |
2015 | 2016 | 2017 | 2018 | ||||||||||||
| $16,249 | $ | 16,238 | $ | 15,674 | $ | 14,837 | $ | 14,121 | ||||||||
F-19
Table of Contents
NOTE I—ACCOUNTS PAYABLE
Accounts payable consisted of the following:
| December 31, | ||||||||
| 2013 | 2012 | |||||||
| Trade payables |
$ | 462,304 | $ | 525,440 | ||||
| Other payables |
46,789 | 46,742 | ||||||
|
|
|
|
|
|||||
| Total |
$ | 509,093 | $ | 572,182 | ||||
|
|
|
|
|
|||||
NOTE J—DEBT
Debt consisted of the following:
| December 31, | ||||||||
| 2013 | 2012 | |||||||
| Senior Secured Credit Facility |
||||||||
| Term Loans |
$ | — | $ | 1,232,585 | ||||
| Revolving Facility |
— | 120,000 | ||||||
| Senior Notes |
1,325,000 | — | ||||||
| Accounts Receivable Securitization Facility |
— | 93,492 | ||||||
| Other indebtedness |
11,421 | 7,507 | ||||||
|
|
|
|
|
|||||
| Total debt |
1,336,421 | 1,453,584 | ||||||
| Less: current portion |
(8,754 | ) | (98,133 | ) | ||||
|
|
|
|
|
|||||
| Total long-term debt |
$ | 1,327,667 | $ | 1,355,451 | ||||
|
|
|
|
|
|||||
The Company was in compliance with all debt covenant requirements as of December 31, 2013. Total accrued interest on outstanding debt as of December 31, 2013 and 2012 was $48.3 million and $8.8 million, respectively. This increase was driven primarily by timing of interest payments on the Senior Notes as compared to the Term Loans in the prior year. Accrued interest is recorded within “Accrued expenses and other current liabilities” in the consolidated balance sheets.
The following is a summary of Trinseo’s debt instruments.
Senior Secured Credit Facility
In June 2010, the Company entered into a credit agreement (the “Senior Secured Credit Facility”) with lenders which included (i) an $800.0 million senior secured term loans (the “2010 Term Loans”) and a (ii) $240.0 million revolving credit facility (the “Revolving Facility”). The proceeds of these borrowings were used to finance, in part, the Acquisition and pay transaction fees and expenses related to the Acquisition. From time to time, the Senior Secured Credit Facility has been amended and restated to, among other things, increase available borrowings, extend maturities, and change borrowing rates.
On February 2, 2011, the Senior Secured Credit Facility was amended (the “2011 Amendment”) to increase the available borrowings under the senior secured term loans from $780.0 million to $1.6 billion. Pursuant to the amendment, the Company borrowed an aggregate principal amount of $1.4 billion (the “2011 Term Loans”, with the 2010 Term Loans, collectively referred to as the “Term Loans”), the proceeds of which were used to repay the 2010 Term Loans and related accrued interest, repay the Seller Note issued by Dow at the time of the Acquisition and related accrued interest, make a distribution to the Parent, and provide general corporate funds. As a result, $749.0 million of the 2010 Term Loans were determined to be extinguished and $31.0 million was determined to be modified in accordance with generally accepted accounting principles. As a result of this extinguishment, the Company recorded a loss on extinguishment of $55.7 million during 2011.
F-20
Table of Contents
In July 2012, the Company further amended the Senior Secured Credit Facility (the “2012 Amendment”) that provided for an increase in the Company’s total leverage ratio and decrease the interest coverage ratio as well as an increase in the permitted accounts receivable securitization facility and increases in the borrowing rates of the Term Loans. The 2012 Amendment became effective on August 9, 2012 with the repayment of $140.0 million of 2011 Term Loans using the proceeds from equity contribution from the Parent. As a result, the 2011 Term Loans were determined to be modified in accordance with generally accepted accounting principles. The Company capitalized $6.2 million of the issuance costs paid to the creditors of the 2011 Term Loans, with the remaining $2.3 million of third-party fees associated with the 2011 Term Loans expensed as incurred within “Other expense (income), net” in the consolidated statement of operations for the year ended December 31, 2012. Costs of $1.2 million which were paid to the creditors of the Revolving Facility were also capitalized and are being amortized over the remaining term of the Revolving Facility.
In January 2013, the Company again amended its senior secured credit facility (the “2013 Amendment”). As part of the 2013 Amendment, the Company increased its Revolving Facility borrowing capacity from $240.0 million to $300.0 million, decreased the borrowing rate of the Revolving Facility through a decrease in the applicable margin rate from 4.75% to 3.00% as applied to base rate loans (which shall bear interest at a rate per annum equal to the base rate plus the applicable margin (as defined therein)), or 5.75% to 4.00% as applied to LIBO rate loans (which shall bear interest at a rate per annum equal to the LIBO rate plus the applicable margin and the mandatory cost (as defined therein), if applicable), extended the maturity date to January 2018 and concurrently repaid its then outstanding 2011 Term Loans of $1,239.0 million using the proceeds from its sale of $1,325.0 million aggregate principal amount of the 8.750% Senior Secured Notes issued in January 2013 (refer below for further discussion).
Prior to the 2013 Amendment, the Senior Secured Credit Facility required that the Company comply with certain affirmative and negative covenants, including restrictions with respect to payment of dividends and other distributions to shareholders, and financial covenants that include the maintenance of certain financial ratios. These ratios include both a maximum leverage ratio no greater than 5.25 to 1.00 and an interest coverage ratio no less than 2.00 to 1.00 for the most recent twelve-month period. Under the terms of the Senior Secured Credit Facility, an event of default can be cured by a Specified Equity Contribution, as defined under the Senior Secured Credit Facility. On May 8, 2012, the Company received a $22.2 million as equity contribution from the Parent in order to cure its covenant default and to meet its required leverage ratio for the period ended March 31, 2012. The Company remained in compliance with all debt covenants in the remainder of 2012.
The 2013 Amendment replaced the Company’s total leverage ratio requirement with a first lien net leverage ratio (as defined under the 2013 Amendment) and removed the interest coverage ratio requirement. If the outstanding balance on the Revolving Facility exceeds 25% of the $300.0 million borrowing capacity (excluding undrawn letters of credit up to $10.0 million) at a quarter end, then the Company’s first lien net leverage ratio may not exceed 5.25 to 1.00 for the quarter ending March 31, 2013, 5.00 to 1.00 for the subsequent quarters through December 31, 2013, 4.50 to 1.00 for each of the quarters ending in 2014 and 4.25 to 1.00 for each of the quarters ending in 2015 and thereafter.
As a result of the 2013 Amendment and repayment of the term loans in January 2013, the Company recognized a $20.7 million loss on extinguishment of debt during the first quarter of 2013, which consisted of the write-off of existing unamortized deferred financing fees and debt discount attributable to the Term Loans. Fees and expenses incurred in connection with the 2013 Amendment were $5.5 million, which were capitalized.
Capitalized fees and costs incurred in connection with the Company’s borrowings are included in “Deferred charges and other assets” in the consolidated balance sheets. For the Term Loans, deferred financing fees and debt discounts are amortized over the term of the respective loan agreements using the effective interest method, while for the Revolving Facility deferred financing fees are being amortized using a straight-line method. Amortization of deferred financing fees and debt discounts are reflected in “Interest expense, net” in the consolidated statement of operations.
F-21
Table of Contents
Unamortized deferred financing fees related to the Term Loans and Revolving Facility, respectively, were $0 and $11.7 million as of December 31, 2013, and $14.6 million and $9.1 million as of December 31, 2012. Debt discount related to the Term Loans was $0 and $6.4 million as of December 31, 2013 and 2012, respectively, and was netted against “Long-term debt” in the consolidated balance sheets. The Company recorded interest expense relating to the amortization of deferred financing fees and debt discounts related to the entire Senior Secured Credit Facility, respectively, of $3.1 million and $0.1 million for the year ended December 31, 2013; $6.5 million and $0.5 million for the year ended December 31, 2012; and $6.3 million and $0.3 million for the year ended December 31, 2011.
At December 31, 2013, there were no amounts outstanding under the Revolving Facility, while available borrowings under the facility were $292.7 million (net of $7.3 million outstanding letters of credit). At December 31, 2012, there were $1,239.0 million and $120.0 million in outstanding borrowings under the 2011 Term Loans and Revolving Facility, respectively, plus $6.8 million in outstanding letters of credit. All obligations under the Revolving Facility are guaranteed and collateralized by substantially all of the tangible and intangible assets of the Company’s subsidiaries.
Interest charges, excluding interest expense relating to the amortization of deferred financing fees and debt discounts, incurred on the Term Loans and Revolving Facility, respectively, were $7.7 million and $2.8 million for the year ended December 31, 2013, $91.0 million and $6.0 million for the year ended December 31, 2012, and $82.6 million and $8.6 million for the year ended December 31, 2011. Cash paid related to interest incurred on the Term Loans and Revolving Facility, respectively, was $16.5 million and $2.8 million for the year ended December 31, 2013, $87.6 million and $6.1 million for the year ended December 31, 2012, and $82.4 million and $8.6 million for the year ended December 31, 2011.
Interest Rate Cap Agreements
Historically, as required under the Senior Secured Credit Facility, the Company used interest rate cap agreements to protect cash flows from fluctuations caused by volatility in interest rates. When outstanding, the Company does not account for the interest rate cap agreements as hedges. As such, changes in the fair value of underlying derivative instruments are recognized in “Interest expense, net” in the consolidated statement of operations. At December 31, 2012, the Company had three outstanding interest rate caps with an aggregate notional amount of $490.0 million, and a fair value of less than $0.1 million, recorded in “Deferred charges and other assets” on the 2012 consolidated balance sheet. These hedges were settled on January 29, 2013, and there were no remaining interest rate cap agreements outstanding at December 31, 2013.
Senior Notes
In January 2013, the Company issued $1,325.0 million 8.750% Senior Secured Notes (the “Senior Notes”). The Senior Notes interest is payable semi-annually on February 1st and August 1st of each year, which commenced on August 1, 2013. The notes will mature on February 1, 2019, at which time the entire $1,325.0 million will be due and payable. The proceeds from the issuance of the Senior Notes were used to repay all of the Company’s outstanding Term Loans under the Senior Secured Credit Facility and related refinancing fees and expenses.
The Company may redeem all or part of the Senior Notes at any time prior to August 1, 2015 by paying a make-whole premium, plus accrued and unpaid interest to the redemption date. The Company may redeem all or part of the Senior Notes at any time after August 1, 2015 at a redemption price equal to the percentage of principal amount set forth below plus accrued and unpaid interest, if any, on the notes redeemed, to the applicable date of redemption, if redeemed during the twelve-month period beginning on of the year indicated below:
| 12-month period commencing August 1 in Year |
Percentage | |||
| 2015 |
104.375 | % | ||
| 2016 |
102.188 | % | ||
| 2017 and thereafter |
100.000 | % | ||
F-22
Table of Contents
In addition, at any time prior to August 1, 2015, the Company may redeem up to 35% of the aggregate principal amount of the notes at a redemption price equal to 108.750% of the face amount thereof plus accrued and unpaid interest, if any, to the redemption date, with the net cash proceeds that the Company raises in certain equity offerings. The Company may also redeem, during any 12-month period commencing from the issue date until August 1, 2015, up to 10% of the original principal amount of the Senior Notes at a redemption price equal to 103% of the principal amount thereof, plus accrued and unpaid interest, if any, to, but not including, the date of redemption.
In connection with the issuance of the Senior Notes, the Company also entered into a registration rights agreement to file a registration statement (the “Registration Statement”) with the Securities and Exchange Commission of the United States (“SEC”) to exchange the Senior Notes for registered notes (the “Exchange Notes”) having terms substantially identical in all material respect to the Senior Notes, within 365 days after the issuance of the Senior Notes. If the Registration Statement, among other conditions, does not become effective within 365 days after the issuance of the Senior Notes, holders of the Senior Notes would be entitled to the payment of additional interest, at a rate of 0.25% per annum (which the rate will be increased by an additional 0.25% per annum for each subsequent 90-day period that such additional interest continues to accrue, provided that the rate at which such additional interest accrues may in no event exceed 1.00% per annum) until the Registration Statement becomes effective or the exchange offer is completed. As of December 31, 2013, the Company had not recorded a liability for this contingent obligation, as it was not deemed probable at the time that the Company would not meet its obligations. Subsequently, on January 29, 2014, the SEC declared effective the Company’s Registration Statement, resulting in the Company fulfilling its obligations under the registration rights agreement, incurring no additional interest penalty.
The Senior Notes rank equally in right of payment with all of the Company’s existing and future senior secured debt and pari passu with the Company and the Guarantors’ (as defined below) indebtedness that is secured by first-priority liens, including the Company’s Senior Secured Credit Facility (as defined above), to the extent of the value of the collateral securing such indebtedness and ranking senior in right of payment to all of the Company’s existing and future subordinated debt. However, claims under the Senior Notes will effectively rank behind the claims of holders of debt, including interest, under our Senior Secured Credit Facility in respect of proceeds from any enforcement action with respect to the collateral or in any bankruptcy, insolvency or liquidation proceeding. The Senior Notes will be unconditionally guaranteed on a senior secured basis by each of our existing and future wholly-owned subsidiaries that guarantee our Senior Secured Credit Facility (other than our subsidiaries in France and Spain) (the “Guarantors”). The note guarantees will rank equally in right of payment with all of the Guarantors’ existing and future senior secured debt and senior in right of payment to all of the Guarantors’ existing and future subordinated debt. The notes will be structurally subordinated to all of the liabilities of each of our subsidiaries that do not guarantee the notes.
The Indenture contains covenants that, among other things, limit the Company’s ability and the ability of the Company’s restricted subsidiaries to incur additional indebtedness, pay dividends or make other distributions, subject to certain exceptions. If the Senior Notes are assigned an investment grade by the rating agencies and the Company is not in default, certain covenants will be suspended. If the ratings on the Senior Notes decline to below investment grade, the suspended covenants will be reinstated.
Fees and expenses incurred in connection with the issuance of Senior Notes were approximately $42.0 million, which were capitalized and included in “Deferred charges and other assets” in the consolidated balance sheet. These deferred financing fees are being amortized using the effective interest rate method and reflected in “Interest expense, net” in the consolidated statement of operations. For the year ended December 31, 2013, the Company recorded $4.9 million in amortization of deferred financing fees, 2013, leaving $37.1 million of unamortized deferred financing fees related to the Senior Notes on the balance sheet as of December 31, 2013.
Interest charges incurred, excluding interest expense relating to the amortization of deferred financing fees, and cash paid on the Senior Notes were $106.9 million and $58.6 million, respectively, for the year ended December 31, 2013.
F-23
Table of Contents
Accounts Receivable Securitization Facility
In August 2010, a VIE in which the Company is the primary beneficiary, Styron Receivable Funding Ltd. (“SRF”), executed an agreement with a bank for an accounts receivable securitization facility (“Accounts Receivable Securitization Facility”). The initial facility permitted borrowings by one of the Company’s subsidiaries, Styron Europe GmbH (“SE”), up to a total of $160.0 million. Under the facility, SE will sell their accounts receivable from time to time to SRF. In turn, SRF may sell undivided ownership interests in such receivables to commercial paper conduits in exchange for cash. The Company has agreed to continue servicing the receivables for SRF. Upon the sale of the interests in the accounts receivable by SRF, the conduits have a first priority perfected security interest in such receivables and, as a result, the receivables will not be available to the creditors of the Company or its other subsidiaries.
Since its inception, the Company has from time to time amended and restated the Accounts Receivable Securitization Facility. In May 2011, the facility was amended to allow for the expansion of the pool of eligible accounts receivable to include a previously excluded German subsidiary. In May 2013, the Company further amended the facility, increasing its borrowing capacity from $160.0 million to $200.0 million, extending the maturity date to May 2016 and allowing for the expansion of the pool of eligible accounts receivable to include previously excluded U.S. and Netherlands subsidiaries. As a result of the amendment, the Company incurred $0.7 million in fees, which were capitalized within “Deferred charges and other assets” in the consolidated balance sheet and are being amortized into interest expense using the straight-line method over the remaining term.
The Accounts Receivable Securitization Facility is subject to interest charges against both the amount of outstanding borrowings as well as the amount of available, but undrawn commitments. As a result of the amendment to our Accounts Receivable Securitization Facility in May 2013 noted above, we lowered our borrowing costs. In regards to the outstanding borrowings, fixed interest charges were decreased from 3.25% plus variable commercial paper rates to 2.6% plus variable commercial paper rates. In regards to available, but undrawn commitments, fixed interest charges were decreased from 1.50% to 1.40%.
As of December 31, 2013 and 2012, there was approximately $143.8 million and $85.7 million, respectively, of accounts receivable available to support this facility, based on our pool of eligible accounts receivable. As of December 31, 2013, there were no outstanding borrowings under this facility. As of December 31, 2012, there were approximately $93.5 million, which includes $7.8 million of cash restricted from use, in outstanding borrowings included in short-term borrowings in the consolidated balance sheet. Interest incurred on the Accounts Receivable Securitization Facility, excluding interest expense relating to the amortization of deferred financing fees, for the years ended December 31, 2013, 2012 and 2011 were $4.2 million, $4.7 million and $5.7 million, respectively, reflected in “Interest expense, net” in the consolidated statements of operations.
As of December 31, 2013 and 2012, deferred financing fees related to the Accounts Receivable Securitization Facility totaled $3.5 million and $4.3 million, respectively, and were included in “Deferred charges and other assets” in the consolidated balance sheet, and which are being amortized using a straight-line method, reflected in “Interest expense, net” in the consolidated statement of operations. The Company recorded $1.4 million, $1.5 million and $1.4 million in amortization of deferred financing fees related to the Accounts Receivable Securitization Facility for the years ended December 31, 2013, 2012 and 2011.
Other indebtedness
Seller Note
On June 17, 2010, the Company entered into a $75.0 million term loan with Dow (the “Seller Note”) which was effectively used to finance the Styron Acquisition. On February 3, 2011, the Company repaid the Seller Note in full and the related accrued interest of approximately $4.5 million.
F-24
Table of Contents
Other Revolving Facilities
During 2011, the Company entered into two short-term revolving facilities through our subsidiary in China that provided for approximately $28.5 million of uncommitted funds available for borrowings, subject to annual renewal. The Company did not renew one of the short-term revolving facilities, with uncommitted funds of $13.5 million, and there were no outstanding borrowings for that facility as of December 31, 2013 or 2012. The remaining facility, which provides for up to $15.0 million of uncommitted funds available for borrowings, is subject to annual renewal.
Outstanding borrowings under the remaining revolving facility were $5.1 million and $1.1 million as of December 31, 2013 and 2012, respectively. The revolving facility is guaranteed by our Holding Company, Trinseo Materials Operating S.C.A. or secured by pledge of certain of our assets in China. At December 31, 2013 and 2012, the weighted average interest rate of the facility was approximately 0.1% and 0.5%, respectively.
The Senior Secured Credit facility limits our foreign working capital facilities to an aggregate principal amount of $75.0 million and, based on the 2013 Amendment, further limits our foreign working capital facilities in certain jurisdictions in Asia, including China, to an aggregate principal amount of $25.0 million, except as otherwise permitted by the Senior Secured Credit Facility.
NOTE K—FOREIGN EXCHANGE FORWARD CONTRACTS
The Company manages its exposures to changes in foreign currency exchange rates where possible by paying expenses in the same currency in which we generate sales in a particular country as well as using derivative contracts which are not designated for hedge accounting treatment. During 2012, the Company entered into foreign exchange forward contracts that were not designated as hedging instruments to manage volatility in foreign currency exposures. As of December 31, 2012, the Company had open foreign exchange forward contracts with various expiration dates to buy euro currency with a notional U.S. dollar equivalent of $82.0 million. The fair value of the foreign exchange forward contracts amounted to $3.8 million as of December 31, 2012 recorded in “Accounts payable” in the consolidated balance sheet. As these foreign exchange forward contracts were not designated for hedge accounting treatment, changes in the fair value of underlying instruments are recognized in “Other expense (income)” in the consolidated statement of operations.
These contracts were settled in February and May 2013 and no contracts were outstanding as of December 31, 2013. The Company recognized losses $0.6 million and $4.8 million during the years ended December 31, 2013 and 2012, respectively, related to these contracts.
NOTE L—SHAREHOLDER’S EQUITY
Common Stock
On February 3, 2011, $471.4 million of the net cash proceeds from the 2011 Term Loans under the amended Senior Secured Credit Facility were used to pay a distribution to the Parent. The distribution coincided with the redemption and subsequent cancellation of 11.9 billion shares of our common stock. Further, in December 2011, we made additional cash distributions to our Parent of $50.0 million. The amended Senior Secured Credit Facility places certain restrictions on the payment of future dividends and other distributions to shareholders.
On May 8, 2012, the Company issued 2.2 billion shares of common stock to the Parent with $0.01 nominal value for $22.2 million of proceeds. The proceeds from the issuance were used as equity contribution required under the terms of the Senior Secured Credit Facility in order to cure the covenant default for the period ended March 31, 2012. Also, on August 8, 2012, the Parent received an additional $140.0 million from shareholders and contributed the same amount to the Company through the issuance of 14.0 billion shares of common stock with a nominal value of $0.01. The proceeds from the issuance of the common stock were used to repay a portion of the 2011 Term Loans in connection with the 2012 Amendment. See Note J for further discussion.
F-25
Table of Contents
NOTE M—FAIR VALUE MEASUREMENTS
Fair value is defined as the price that would be received to sell an asset or paid to transfer a liability in an orderly transaction between market participants at the measurement date. Assets and liabilities measured at fair value are classified using the following hierarchy, which is based upon the transparency of inputs to the valuation as of the measurement date.
Level 1—Valuation is based upon quoted prices (unadjusted) for identical assets or liabilities in active markets.
Level 2—Valuation is based upon quoted prices for similar assets and liabilities in active markets, or other inputs that are observable for the asset or liability, either directly or indirectly, for substantially the full term of the financial instrument.
Level 3—Valuation is based upon other unobservable inputs that are significant to the fair value measurement.
The following tables summarize the bases used to measure certain assets and liabilities at fair value on a recurring basis in the balance sheet at December 31, 2012. As discussed in Notes J and K, all interest rate cap agreements and foreign exchange forward contracts were settled in 2013, and as such, there are no remaining balances to be recorded at fair value as of December 31, 2013.
| December 31, 2012 | ||||||||||||||||
| Assets (Liabilities) at Fair Value |
Quoted Prices in Active Markets for Identical Items (Level 1) |
Significant Other Observable Inputs (Level 2) |
Significant Unobservable Inputs (Level 3) |
Total | ||||||||||||
| Interest rate cap agreements(1) |
$ | — | $ | — | $ | — | $ | — | ||||||||
| Foreign exchange forward contracts |
— | (3,802 | ) | — | (3,802 | ) | ||||||||||
|
|
|
|
|
|
|
|
|
|||||||||
| Total fair value |
$ | — | $ | (3,802 | ) | $ | — | $ | (3,802 | ) | ||||||
|
|
|
|
|
|
|
|
|
|||||||||
| (1) | As of December 31, 2012, the fair value of interest rate cap agreements was less than $0.1 million. |
For assets and liabilities classified as Level 2 measurements, fair value is based on the closing price at the end of the period, adjusted for any terms specific to that asset or liability, or by using observable market data points of similar assets and liabilities. Market inputs are obtained from broker quotations or from listed or over-the-counter market data.
Fair Value of Debt Instruments
The following tables present the estimated fair value of the Company’s outstanding debt not carried at fair value as of December 31, 2013 and 2012, respectively:
| Quoted Prices in Active Markets for Identical Items (Level 1) |
Significant Other Observable Inputs (Level 2) |
Total | ||||||||||
| December 31, 2013 |
||||||||||||
| Senior Notes |
$ | — | $ | 1,366,406 | $ | 1,366,406 | ||||||
| Revolving Facility |
— | — | — | |||||||||
| Accounts Receivable Securitization Facility |
— | — | — | |||||||||
|
|
|
|
|
|
|
|||||||
| Total fair value |
$ | — | $ | 1,366,406 | $ | 1,366,406 | ||||||
|
|
|
|
|
|
|
|||||||
F-26
Table of Contents
| Quoted Prices in Active Markets for Identical Items (Level 1) |
Significant Other Observable Inputs (Level 2) |
Total | ||||||||||
| December 31, 2012 |
||||||||||||
| Term Loans |
$ | 1,239,000 | $ | — | $ | 1,239,000 | ||||||
| Revolving Facility |
— | 120,000 | 120,000 | |||||||||
| Accounts Receivable Securitization Facility |
— | 93,492 | 93,492 | |||||||||
|
|
|
|
|
|
|
|||||||
| Total fair value |
$ | 1,239,000 | $ | 213,492 | $ | 1,452,492 | ||||||
|
|
|
|
|
|
|
|||||||
As of December 31, 2012, the Term Loans’ carrying amount of $1,239.0 million approximates fair value as the term loans were redeemed at par in January 2013. The carrying amount of borrowings under the Revolving Facility and Accounts Receivable Securitization Facility approximates fair value as these borrowings bear interest based on prevailing variable market rates.
NOTE N—INCOME TAXES
Income (loss) before income taxes earned within and outside the United States is shown below:
| Year Ended December 31, |
||||||||||||
| 2013 | 2012 | 2011 | ||||||||||
| United States |
$ | 25,228 | $ | 49,193 | $ | (12,516 | ) | |||||
| Outside of the United States |
(25,597 | ) | (1,351 | ) | (23,661 | ) | ||||||
|
|
|
|
|
|
|
|||||||
| Income (loss) before income taxes |
$ | (369 | ) | $ | 47,842 | $ | (36,177 | ) | ||||
|
|
|
|
|
|
|
|||||||
The provision for (benefit from) income taxes is composed of:
| December 31, 2013 | December 31, 2012 | December 31, 2011 | ||||||||||||||||||||||||||||||||||
| Current | Deferred | Total | Current | Deferred | Total | Current | Deferred | Total | ||||||||||||||||||||||||||||
| U.S. federal |
$ | 8,617 | $ | 1,252 | $ | 9,869 | $ | 5,094 | $ | 8,070 | $ | 13,164 | $ | (9,896 | ) | $ | 10,039 | $ | 143 | |||||||||||||||||
| U.S. state and other |
820 | 70 | 890 | 229 | 1,174 | 1,403 | 220 | (1,060 | ) | (840 | ) | |||||||||||||||||||||||||
| Non-U.S. |
8,197 | 2,893 | 11,090 | 7,503 | (4,510 | ) | 2,993 | 42,362 | (1,937 | ) | 40,425 | |||||||||||||||||||||||||
|
|
|
|
|
|
|
|
|
|
|
|
|
|
|
|
|
|
|
|||||||||||||||||||
| Total |
$ | 17,634 | $ | 4,215 | $ | 21,849 | $ | 12,826 | $ | 4,734 | $ | 17,560 | $ | 32,686 | $ | 7,042 | $ | 39,728 | ||||||||||||||||||
|
|
|
|
|
|
|
|
|
|
|
|
|
|
|
|
|
|
|
|||||||||||||||||||
F-27
Table of Contents
The effective tax rate on pre-tax income differs from the U.S. statutory rate due to the following:
| Year Ended December 31, |
||||||||||||
| 2013 | 2012 | 2011 | ||||||||||
| Taxes at U.S. statutory rate(1) |
$ | (129 | ) | $ | 16,745 | $ | (12,662 | ) | ||||
| State and local income taxes |
603 | 1,493 | (273 | ) | ||||||||
| Non U.S. statutory rates, including credits |
(4,988 | ) | (5,185 | ) | 9,105 | |||||||
| U.S. tax effect of foreign earnings and dividends |
(942 | ) | (2,890 | ) | — | |||||||
| Unremitted earnings |
(157 | ) | 3,087 | (298 | ) | |||||||
| Stock-based compensation |
3,112 | 2,466 | 7,125 | |||||||||
| Non-deductible interest |
5,258 | 5,203 | 1,257 | |||||||||
| Change in valuation allowances |
16,430 | (8,780 | ) | 5,506 | ||||||||
| Uncertain tax positions |
(1,465 | ) | 1,882 | 14,454 | ||||||||
| Withholding taxes on interest and royalties |
2,992 | 7,064 | 8,606 | |||||||||
| U.S. manufacturing deduction |
(229 | ) | (1,057 | ) | 300 | |||||||
| Provision to return adjustments |
3,814 | (3,943 | ) | 4,092 | ||||||||
| Non-deductible other expenses |
1,573 | 2,004 | 1,743 | |||||||||
| Government subsidy income |
(4,219 | ) | — | — | ||||||||
| Impact on foreign currency exchange |
71 | 291 | 371 | |||||||||
| Other—net |
125 | (820 | ) | 402 | ||||||||
|
|
|
|
|
|
|
|||||||
| Total provision for income taxes |
$ | 21,849 | $ | 17,560 | $ | 39,728 | ||||||
|
|
|
|
|
|
|
|||||||
| Effective tax rate |
(5,921 | )% | 37 | % | 110 | % | ||||||
|
|
|
|
|
|
|
|||||||
| (1) | The U.S. statutory rate has been used as management believes it is more meaningful to the Company. |
Deferred income taxes reflect temporary differences between the valuation of assets and liabilities for financial and tax reporting:
| December 31, | ||||||||||||||||
| 2013 | 2012 | |||||||||||||||
| Deferred Tax Assets |
Deferred Tax Liabilities |
Deferred Tax Assets |
Deferred Tax Liabilities |
|||||||||||||
| Tax loss and credit carry forwards |
$ | 40,007 | $ | — | $ | 47,214 | $ | — | ||||||||
| Unremitted earnings |
— | 9,462 | — | 9,619 | ||||||||||||
| Unconsolidated affiliates |
12,257 | — | 12,393 | — | ||||||||||||
| Other accruals and reserves |
13,556 | — | 5,019 | — | ||||||||||||
| Property, plant and equipment |
— | 45,314 | — | 51,288 | ||||||||||||
| Goodwill and other intangible assets |
23,452 | — | 29,645 | — | ||||||||||||
| Deferred financing fees |
6,973 | — | 5,825 | — | ||||||||||||
| Employee benefits |
31,858 | — | 30,653 | — | ||||||||||||
|
|
|
|
|
|
|
|
|
|||||||||
| 128,103 | 54,776 | 130,749 | 60,907 | |||||||||||||
| Valuation allowance |
(50,404 | ) | — | (41,280 | ) | — | ||||||||||
|
|
|
|
|
|
|
|
|
|||||||||
| Total |
$ | 77,699 | $ | 54,776 | $ | 89,469 | $ | 60,907 | ||||||||
|
|
|
|
|
|
|
|
|
|||||||||
At December 31, 2013 and 2012, all undistributed earnings of foreign subsidiaries and affiliates are expected to be repatriated. Operating loss carryforwards amounted to $146.2 million in 2013 and $231.9 million in 2012. At December 31, 2013, $3.4 million of the operating loss carryforwards were subject to expiration in 2014 through 2018, and $142.8 million of the operating loss carryforwards expire in years beyond 2018 or have an indefinite carryforward period.
F-28
Table of Contents
The Company had valuation allowances which were related to the realization of recorded tax benefits on tax loss carryforwards, as well as other net deferred tax assets, primarily from subsidiaries in Luxembourg and Australia, of $50.4 million at December 31, 2013 and $41.3 million at December 31, 2012. Valuation allowances increased by $9.1 million in 2013.
For the years presented, a reconciliation of the beginning and ending amount of the unrecognized tax benefits is as follows:
| Balance as of December 31, 2010 |
$ | 7,690 | ||
| Increases related to current year tax positions |
15,583 | |||
| Increases related to prior year tax positions |
2,158 | |||
|
|
|
|||
| Balance as of December 31, 2011 |
$ | 25,431 | ||
| Increases related to current year tax positions |
6,757 | |||
| Decreases related to prior year tax positions |
(2,109 | ) | ||
|
|
|
|||
| Balance as of December 31, 2012 |
$ | 30,079 | ||
| Increases related to current year tax positions |
1,225 | |||
| Decreases related to prior year tax positions |
(4,405 | ) | ||
|
|
|
|||
| Balance as of December 31, 2013 |
$ | 26,899 | ||
|
|
|
The Company recognized interest and penalties of $0.7 million, $0.8 million, and $0.5 million for the years ended December 31, 2013, 2012, and 2011 which was included as a component of income tax expense in the consolidated statements of operations. As of December 31, 2013 and 2012, the Company has $2.0 million and $1.3 million, respectively, accrued for interest and penalties. Within the next twelve months, the Company expects the resolution of federal, state, and foreign examinations and appeals, and the expiration of various statutes of limitation, which may favorably impact the effective tax rate by approximately $3.0 million. To the extent that the gross unrecognized tax benefits are recognized in the future, $18.0 million will impact the Company’s effective tax rate.
NOTE O—COMMITMENTS AND CONTINGENCIES
Leased Property
The Company routinely leases premises for use as sales and administrative offices, warehouses and tanks for product storage, motor vehicles, railcars, computers, office machines, and equipment under operating leases. Rental expense was $16.2 million, $17.7 million and $15.1 million during the years ended December 31, 2013, 2012 and 2011, respectively.
Future minimum rental payments under operating leases with remaining non-cancelable terms in excess of one year are as follows:
| Year |
Annual Commitment |
|||
| 2014 |
$ | 9,010 | ||
| 2015 |
7,634 | |||
| 2016 |
6,319 | |||
| 2017 |
4,437 | |||
| 2018 |
4,139 | |||
| 2019 and beyond |
16,910 | |||
|
|
|
|||
| Total |
$ | 48,449 | ||
|
|
|
|||
F-29
Table of Contents
Environmental Matters
Accruals for environmental matters are recorded when it is probable that a liability has been incurred and the amount of the liability can be reasonably estimated, based on current law, existing technologies and other information. At December 31, 2013 and December 31, 2012, the Company had no accrued obligations for environmental remediation and restoration costs. Pursuant to the terms of the Styron sales and purchase agreement, the pre-closing environmental conditions were retained by Dow and the Company has been indemnified by Dow from and against all environmental liabilities incurred or relating to the predecessor periods. There are several properties which the Company now owns on which Dow has been conducting remediation to address historical contamination. Those properties include Allyn’s Point, Connecticut, Dalton, Georgia, and Livorno, Italy. There are other properties with historical contamination that are owned by Dow that the Company leases for its operations, including its facilities in Midland, Michigan, Schkopau, Germany, Terneuzen, The Netherlands, and Guaruja, Brazil. No environmental claims have been asserted or threatened against the Company, and the Company is not a potentially responsible party at any Superfund Sites.
Inherent uncertainties exist in Trinseo’s potential environmental liabilities primarily due to unknown conditions whether future claims may fall outside the scope of the indemnity, changing governmental regulations and legal standards regarding liability, and evolving technologies for handling site remediation and restoration. In connection with the Company’s existing indemnification, the possibility is considered remote that environmental remediation costs will have a material adverse impact on the consolidated financial statements.
There were no amounts recorded in the consolidated statement of operations relating to environmental remediation for the years ended December 31, 2013, 2012, and 2011.
Purchase Commitments
In the normal course of business, Trinseo has certain raw material purchase contracts where it is required to purchase certain minimum volumes at current market prices. These commitments range from 1 to 7 years. The following table presents the fixed and determinable portion of the obligation under Trinseo’s purchase commitments at December 31, 2013 (in millions):
| Year |
Annual Commitment |
|||
| 2014 |
$ | 2,253 | ||
| 2015 |
1,914 | |||
| 2016 |
1,844 | |||
| 2017 |
1,806 | |||
| 2018 |
1,417 | |||
| Thereafter |
2,618 | |||
|
|
|
|||
| Total |
$ | 11,852 | ||
|
|
|
|||
In certain raw material purchase contracts, the Company has the right to purchase less than the required minimums and pay a liquidated damages fee, or, in case of a permanent plant shutdown, to terminate the contracts. In such cases, these obligations would be less than the obligations shown in the table above.
The Company has service agreements with Dow and Bain Capital, some of which contain fixed annual fees. See Note R for further discussion.
Litigation Matters
From time to time, the Company may be subject to various legal claims and proceedings incidental to the normal conduct of business, relating to such matters as product liability, antitrust/competition, past waste
F-30
Table of Contents
disposal practices and release of chemicals into the environment. While it is impossible at this time to determine with certainty the ultimate outcome of these routine claims, the Company does not believe that the ultimate resolution of these claims will have a material adverse effect on the Company’s results of operations, financial condition or cash flow.
Legal costs, including those legal costs expected to be incurred in connection with a loss contingency, are expensed as incurred.
NOTE P—PENSION PLANS AND OTHER POSTRETIREMENT BENEFITS
Defined Benefit Pension Plans
A majority of Company employees are participants in various defined benefit pension and other postretirement plans which are administered and sponsored by Trinseo.
In connection with the Acquisition, the Company and Dow entered into affiliation agreements in certain jurisdictions (the “Affiliation Agreements”) allowing employees who transferred from Dow to the Company as of June 17, 2010 to remain in the Dow operated pension plans (“Dow Plans”) until the Company established its own pension plan. The Company has made the required employer contribution amounts to the Dow Plans for the Company’s employees and the related pension benefit obligations for the Company’s employees have been accumulating in the Dow Plans since the Acquisition Date. In 2011, Dow Plans originally established in Germany and Japan, were legally separated into the Company’s own administered and sponsored plans.
The Affiliation Agreements ended on December 31, 2012. Effective January 1, 2013, all remaining employees of the Company who were previously participants of the Dow Plans in Switzerland and the Netherlands transferred to separately administered and sponsored pension plans of the Company (the “Successor Plans”). The benefit obligation and related plan assets in the Dow Plans belonging to the Company’s employees were transferred to the Successor Plans. As a result of the transfer, the Company recognized prior service credits and net losses of approximately $13.0 million and $1.4 million, respectively in other comprehensive income during the year ended December 31, 2013.
Company employees, who were not previously associated with the acquired pension and postretirement plans, are generally not eligible for enrollment in these plans. Pension benefits are typically based on length of service and the employee’s final average compensation.
Other Postretirement Benefits
The Company provides certain health care and life insurance benefits to Dow heritage retired employees. The Company’s plans outside of the United States are not significant; therefore, this discussion relates to the U.S. plan only. The plan provides for health care benefits, including hospital, physicians’ services, drug and major medical expense coverage. In general, the plan applies to employees hired by Dow before January 1, 2008 and transferred to the Company in connection with the Acquisition, and who are at least 50 years old with 10 years of service. The plan allows for spouse coverage as well; if an employee was hired on or before January 1, 1993 the coverage extends past age 65; anyone hired after January 1, 1993 but before January 1, 2008 coverage ends at age 65. The Company reserves the right to modify the provisions of the plan at anytime including the right to terminate and does not guarantee the continuation of the plan or its provisions.
F-31
Table of Contents
Assumptions
The weighted-average assumptions used to determine pension plan obligations and net periodic benefit costs are provided below:
| Pension Plan Obligations | Net Periodic Benefit Costs | |||||||||||||||||||||||
| December 31, | December 31, | |||||||||||||||||||||||
| 2013 | 2012 | 2011 | 2013 | 2012 | 2011 | |||||||||||||||||||
| Discount rate |
3.30 | % | 3.05 | % | 4.49 | % | 3.05 | % | 4.49 | % | 4.46 | % | ||||||||||||
| Rate of increase in future compensation levels |
2.86 | % | 2.69 | % | 2.64 | % | 2.69 | % | 2.64 | % | 2.94 | % | ||||||||||||
| Expected long-term rate of return on plan assets |
N/A | N/A | N/A | 2.44 | % | 4.09 | % | 4.69 | % | |||||||||||||||
The weighted-average assumptions used to determine other postretirement benefit (“OPEB”) obligations and net periodic benefit costs are provided below:
| OPEB Obligations | Net Periodic Benefit Costs | |||||||||||||||||||||||
| December 31, | December 31, | |||||||||||||||||||||||
| 2013 | 2012 | 2011 | 2013 | 2012 | 2011 | |||||||||||||||||||
| Discount rate |
4.72 | % | 3.93 | % | 5.08 | % | 3.93 | % | 5.08 | % | 5.70 | % | ||||||||||||
| Initial health care cost trend rate |
6.67 | % | 7.00 | % | 7.33 | % | 7.00 | % | 7.33 | % | 7.67 | % | ||||||||||||
| Ultimate health care cost trend rate |
5.00 | % | 5.00 | % | 5.00 | % | 5.00 | % | 5.00 | % | 5.00 | % | ||||||||||||
| Year ultimate trend rate to be reached |
2019 | 2019 | 2019 | 2019 | 2019 | 2019 | ||||||||||||||||||
The discount rate utilized to measure the pension and other postretirement benefit plans is based on the yield of high-quality fixed income debt instruments at the measurement date. Future expected actuarially determined cash flows of the plans are matched against a yield curve to arrive at a single discount rate for each plan.
The expected long-term rate of return on plan assets is determined by performing a detailed analysis of key economic and market factors driving historical returns for each asset class and formulating a projected return based on factors in the current environment. Factors considered include, but are not limited to, inflation, real economic growth, interest rate yield, interest rate spreads, and other valuation measures and market metrics. The expected long-term rate of return for each asset class is then weighted based on the strategic asset allocation approved by the governing body for each plan. The historical experience with the pension fund asset performance is also considered.
A one-percentage point change in the assumed health care cost trend rate would have had a nominal effect on both service and interest costs as well as the projected benefit obligations.
The net periodic benefit costs for the pension and other postretirement benefit plans for the years ended December 31, 2013, 2012, and 2011 were as follows:
| Defined Benefit Pension Plans | Other Postretirement Benefit Plans | |||||||||||||||||||||||
| December 31, | December 31, | |||||||||||||||||||||||
| 2013 | 2012 | 2011 | 2013 | 2012 | 2011 | |||||||||||||||||||
| Net periodic benefit cost |
||||||||||||||||||||||||
| Service cost |
$ | 13,866 | $ | 10,054 | $ | 10,377 | $ | 283 | $ | 252 | $ | 291 | ||||||||||||
| Interest cost |
6,482 | 6,475 | 6,235 | 262 | 275 | 308 | ||||||||||||||||||
| Expected return on plan assets |
(1,710 | ) | (2,251 | ) | (1,740 | ) | — | — | — | |||||||||||||||
| Amortization of prior service cost (credit) |
(989 | ) | 142 | — | — | — | — | |||||||||||||||||
| Amortization of net (gain) loss |
3,093 | (630 | ) | 507 | — | (9 | ) | (4 | ) | |||||||||||||||
| Settlement and curtailment (gain) loss(1) |
2,122 | (247 | ) | (164 | ) | — | — | — | ||||||||||||||||
|
|
|
|
|
|
|
|
|
|
|
|
|
|||||||||||||
| Net periodic benefit cost |
$ | 22,864 | $ | 13,543 | $ | 15,215 | $ | 545 | $ | 518 | $ | 595 | ||||||||||||
|
|
|
|
|
|
|
|
|
|
|
|
|
|||||||||||||
F-32
Table of Contents
| (1) | The amount of $2.1 million represents a curtailment loss from one of our defined benefit plans in Germany due to the reduction or cessation of benefit accruals for certain employees’ future services. The adjustment in the benefit obligation from the curtailment resulted in a loss recognized during the year due to a charge against the unamortized net loss recorded in other comprehensive income. |
| Defined Benefit Pension Plans | Other Postretirement Benefit Plans | |||||||||||||||||||||||
| December 31, | December 31, | |||||||||||||||||||||||
| 2013 | 2012 | 2011 | 2013 | 2012 | 2011 | |||||||||||||||||||
| Amounts recognized in other comprehensive income |
||||||||||||||||||||||||
| Net loss (gain) |
$ | 6,170 | $ | 65,303 | $ | (15,686 | ) | $ | (1,354 | ) | $ | 677 | $ | (497 | ) | |||||||||
| Amortization of prior service (cost) credit |
989 | (142 | ) | — | — | — | — | |||||||||||||||||
| Amortization of net gain (loss) |
(3,093 | ) | 630 | (507 | ) | — | 9 | 4 | ||||||||||||||||
| Settlement and curtailment gain (loss) |
(2,122 | ) | 247 | 164 | — | — | — | |||||||||||||||||
| Prior service cost (credit) |
(12,992 | )(2) | — | 2,463 | 730 | — | — | |||||||||||||||||
| Other |
— | — | 2,022 | — | — | — | ||||||||||||||||||
|
|
|
|
|
|
|
|
|
|
|
|
|
|||||||||||||
| Total recognized in other comprehensive income |
(11,048 | ) | 66,038 | (11,544 | ) | (624 | ) | 686 | (493 | ) | ||||||||||||||
| Net periodic benefit cost |
22,864 | 13,543 | 15,215 | 545 | 518 | 595 | ||||||||||||||||||
|
|
|
|
|
|
|
|
|
|
|
|
|
|||||||||||||
| Total recognized in net periodic benefit cost and other comprehensive income |
$ | 11,816 | $ | 79,581 | $ | 3,671 | $ | (79 | ) | $ | 1,204 | $ | 102 | |||||||||||
|
|
|
|
|
|
|
|
|
|
|
|
|
|||||||||||||
| (2) | This is primarily related to the transfer of all remaining employees who were previously participants in the Dow Plans in Switzerland and the Netherlands to Company Successor Plans effective January 1, 2013, as discussed above. |
The changes in the pension benefit obligations and the fair value of plan assets and the funded status of all significant plans for the year ended December 31, 2013 and 2012 were as follows:
| Defined Benefit Pension Plans |
Other Postretirement Benefit Plans |
|||||||||||||||
| December 31, | December 31, | |||||||||||||||
| 2013 | 2012 | 2013 | 2012 | |||||||||||||
| Change in projected benefit obligations |
||||||||||||||||
| Benefit obligation at beginning of period |
$ | 231,437 | $ | 144,630 | $ | 6,666 | $ | 5,433 | ||||||||
| Service cost |
13,866 | 10,054 | 283 | 252 | ||||||||||||
| Interest cost |
6,482 | 6,475 | 262 | 275 | ||||||||||||
| Plan participants’ contributions |
1,831 | 1,810 | — | — | ||||||||||||
| Actuarial changes in assumptions and experience |
(10,376 | ) | 64,662 | (1,354 | ) | 677 | ||||||||||
| Benefits paid |
(3,362 | ) | (1,925 | ) | — | — | ||||||||||
| Benefit payments by employer |
(1,367 | ) | (798 | ) | — | — | ||||||||||
| Divestiture |
(333 | ) | — | — | — | |||||||||||
| Plan amendments |
(12,992 | ) | — | 730 | — | |||||||||||
| Curtailments |
2,124 | (239 | ) | — | — | |||||||||||
| Settlements |
(1,633 | ) | (832 | ) | — | — | ||||||||||
| Other |
4,576 | 3,288 | — | — | ||||||||||||
| Currency impact |
7,661 | 4,312 | 73 | 29 | ||||||||||||
|
|
|
|
|
|
|
|
|
|||||||||
| Benefit obligation at end of period |
$ | 237,914 | $ | 231,437 | $ | 6,660 | $ | 6,666 | ||||||||
|
|
|
|
|
|
|
|
|
|||||||||
F-33
Table of Contents
| Defined Benefit Pension Plans |
Other Postretirement Benefit Plans |
|||||||||||||||
| December 31, | December 31, | |||||||||||||||
| 2013 | 2012 | 2013 | 2012 | |||||||||||||
| Change in plan assets |
||||||||||||||||
| Fair value of plan assets at beginning of period |
$ | 72,350 | $ | 50,229 | $ | — | $ | — | ||||||||
| Actual return on plan assets(3) |
(12,713 | ) | 1,371 | — | — | |||||||||||
| Settlements |
(1,633 | ) | (832 | ) | — | — | ||||||||||
| Employer contributions |
17,665 | 18,537 | — | — | ||||||||||||
| Plan participants’ contributions |
1,831 | 1,810 | — | — | ||||||||||||
| Benefits paid |
(3,609 | ) | (1,980 | ) | — | — | ||||||||||
| Other |
4,576 | 1,501 | — | — | ||||||||||||
| Currency impact |
2,880 | 1,714 | — | — | ||||||||||||
|
|
|
|
|
|
|
|
|
|||||||||
| Fair value of plan assets at end of period |
81,347 | 72,350 | — | — | ||||||||||||
|
|
|
|
|
|
|
|
|
|||||||||
| Funded status at end of period |
$ | (156,567 | ) | $ | (159,087 | ) | $ | (6,660 | ) | $ | (6,666 | ) | ||||
|
|
|
|
|
|
|
|
|
|||||||||
| (3) | Certain plan assets fair values were determined using cash surrender values provided under the insurance contracts which took effect on January 1, 2013. The resulting change in the fair value of plan assets due to the use of cash surrender values was included as “return on plan assets”. |
The net amounts recognized in the balance sheet as of December 31, 2013 and 2012 were as follows:
| Defined Benefit Pension Plans |
Other Postretirement Benefit Plans |
|||||||||||||||
| December 31, | December 31, | |||||||||||||||
| 2013 | 2012 | 2013 | 2012 | |||||||||||||
| Net amounts recognized in the balance sheets at December 31 |
||||||||||||||||
| Current liabilities |
$ | (1,599 | ) | $ | (2,665 | ) | $ | (26 | ) | $ | (30 | ) | ||||
| Noncurrent liabilities |
(154,968 | ) | (156,422 | ) | (6,634 | ) | (6,636 | ) | ||||||||
|
|
|
|
|
|
|
|
|
|||||||||
| Net amounts recognized in the balance sheet |
$ | (156,567 | ) | $ | (159,087 | ) | $ | (6,660 | ) | $ | (6,666 | ) | ||||
|
|
|
|
|
|
|
|
|
|||||||||
| Accumulated benefit obligation at the end of the period |
$ | 178,987 | $ | 163,207 | $ | 6,660 | $ | 6,666 | ||||||||
|
|
|
|
|
|
|
|
|
|||||||||
| Pretax amounts recognized in AOCI at December 31: |
||||||||||||||||
| Net prior service cost (credit) |
$ | (9,682 | ) | $ | 2,321 | $ | 730 | $ | — | |||||||
| Net gain (loss) |
44,883 | 43,927 | (1,332 | ) | 22 | |||||||||||
|
|
|
|
|
|
|
|
|
|||||||||
| Total at end of period |
$ | 35,201 | $ | 46,248 | $ | (602 | ) | $ | 22 | |||||||
|
|
|
|
|
|
|
|
|
|||||||||
Approximately $2.1 million and $1.0 million of net loss and net prior service credit, respectively, for the defined benefit pension plans and $0.1 million and $0.1 million of net gain and net prior service cost, respectively, for other postretirement benefit plans will be amortized from accumulated other comprehensive income (“AOCI”) to net periodic benefit cost in 2014.
F-34
Table of Contents
The estimated future benefit payments, reflecting expected future service, as appropriate, are presented in the following table:
| 2014 | 2015 | 2016 | 2017 | 2018 | 2019 through 2023 |
Total | ||||||||||||||||||||||
| Defined benefit pension plans |
$ | 4,878 | $ | 4,770 | $ | 3,930 | $ | 5,329 | $ | 5,443 | $ | 36,946 | $ | 61,296 | ||||||||||||||
| Other postretirement benefit plans |
27 | 47 | 72 | 105 | 141 | 1,630 | 2,022 | |||||||||||||||||||||
|
|
|
|
|
|
|
|
|
|
|
|
|
|
|
|||||||||||||||
| Total |
$ | 4,905 | $ | 4,817 | $ | 4,002 | $ | 5,434 | $ | 5,584 | $ | 38,576 | $ | 63,318 | ||||||||||||||
|
|
|
|
|
|
|
|
|
|
|
|
|
|
|
|||||||||||||||
Estimated contributions to the defined benefit pension plans in 2014 are $14.1 million.
The following information relates to pension plans with projected and accumulated benefit obligations in excess of the fair value of plan assets at December 31, 2013 and December 31, 2012:
| Projected Benefit Obligation Exceeds the Fair Value of Plan Assets |
December 31, | |||||||
| 2013 | 2012 | |||||||
| Projected benefit obligations |
$ | 237,914 | $ | 228,942 | ||||
| Fair value of plan assets |
$ | 81,347 | $ | 72,350 | ||||
| Accumulated Benefit Obligation Exceeds the Fair Value of Plan Assets |
December 31, | |||||||
| 2013 | 2012 | |||||||
| Accumulated benefit obligations |
$ | 152,056 | $ | 140,890 | ||||
| Fair value of plan assets |
$ | 50,004 | $ | 42,441 | ||||
Plan Assets
Prior to 2013, plan assets specific to the Dow Plans consisted primarily of receivables from Dow, which were based on a contractually determined proportion of Dow’s plan assets. Dow’s underlying plan assets consisted of equity and fixed income securities of U.S. and foreign issuers and insurance contracts, and may have included alternative investments such as real estate and private equity. Effective January 1, 2013, all remaining employees of the Company who were previously participating in Dow Plans were transferred to the Successor Plans. The related assets were also transferred to the Successor Plans and invested into insurance contracts that provide for guaranteed returns. At December 31, 2012, plan assets totaled $72.3 million consisting of $58.2 million receivables from Dow, which were based on the Company’s proportionate share in Dow plan assets, and remaining $14.1 million were invested in insurance contracts. At December 31, 2013, plan assets totaled $81.3 million, consisting of investments in insurance contracts.
Investments in the pension plan insurance were valued utilizing unobservable inputs, which are contractually determined based on cash surrender values, returns, fees, and the present value of the future cash flows of the contracts.
The Dow receivables and insurance contracts are classified as Level 3 investments. Changes in the fair value of these level 3 investments during the years ended December 31, 2013 and 2012 are included in the “Change in plan assets” table above.
Concentration of Risk
The Company mitigates the credit risk of investments by establishing guidelines with investment managers that limit investment in any single issue or issuer to an amount that is not material to the portfolio being
F-35
Table of Contents
managed. These guidelines are monitored for compliance both by the Company and external managers. Credit risk related to derivative activity is mitigated by utilizing multiple counterparties and through collateral support agreements.
Supplemental Employee Retirement Plan
The Company established a non-qualified Supplemental Employee Retirement Plan in 2010. The net benefit costs recognized for the years ended December 31, 2013, 2012, and 2011 were $2.3 million, $2.6 million, and $2.8 million, respectively. As of December 31, 2012, the Company had a change in the plan assumptions, which resulted in an actuarial loss of approximately $2.2 million, net of tax of $1.4 million. The amount was recognized in the other comprehensive income. There was no further change in plan assumptions as of December 31, 2013. Benefit obligations under this plan were $12.7 million and $11.2 million as of December 31, 2013 and 2012, respectively. As of December 31, 2013 and 2012, the amounts of net loss included in AOCI were $2.9 million and $3.6 million, respectively, with $0.7 million amortized from AOCI into net periodic benefit costs during the year ended December 31, 2013. Approximately $0.7 million is expected to be amortized from AOCI into net periodic benefit cost in 2014.
Defined Contribution Plans
The Company also offers defined contribution plans to eligible employees in the U.S. and in other countries, including Australia, China, Brazil, Hong Kong, Switzerland, Taiwan and the United Kingdom. The defined contribution plans are comprised of a non-discretionary elective matching contribution component as well as a discretionary non-elective contribution component. Employees participate in the non-discretionary component by contributing a portion of their eligible compensation to the plan, which is partially matched by the Company. Non-elective contributions are made at the discretion of the Company and are based on a combination of eligible employee compensation and performance award targets. For the years ended December 31, 2013, 2012, and 2011, respectively, the Company contributed $6.3 million, $7.0 million, and $7.7 million to the defined contribution plans.
NOTE Q—STOCK-BASED COMPENSATION
Time-Based and Performance-Based Restricted Stock
On June 17, 2010, the Parent authorized the issuance of up to 750,000 shares in time-based and performance-based restricted stock to certain key members of management. Any related compensation associated with these awards is allocated to the Company from the Parent.
Time-based restricted stock awards, which contain a service-based condition requiring continued employment with the Company, vest over three to five years of service with a portion (20% to 40%) cliff vesting after one or two years. The remaining portion of the awards vest ratably over the subsequent service period, subject to the participant’s continued employment with the Company, and vest automatically upon a change of control of the Company excluding a change in control related to an initial public offering (“IPO”). Should a participant’s termination occur within defined time frames due to death or permanent disability, a termination of the participant by the Company or one of its subsidiaries without cause, or the participant’s voluntary resignation for good reason, the portion of awards that are subject time-vesting that would have vested on the next regular vesting date will accelerate and vest on a pro rata basis based on the number of full months between the last regular vesting date and the termination date.
The performance-based restricted stock awards vest upon the full satisfaction of both time vesting requirements, subject to the participant’s continued employment, and performance vesting criteria. The performance component of the awards can only be satisfied if certain targets are achieved based on various returns realized by our shareholders on a change in control or an IPO. The time vesting requirements for the performance-based restricted stock generally vest in the same manner as the related time-based award. Holders of vested performance-based restricted stock are entitled to distributions from the Parent only after investors in the Parent have received distributions equal to their original investment.
F-36
Table of Contents
The Parent has a call right that gives it the option, but not the obligation, to repurchase vested stock at the then current fair value upon an employee’s termination, or at cost in certain circumstances. In 2013, as the result of certain employee terminations, the Parent repurchased a total of 3,372 previously vested time-based restricted stock awards at cost, resulting in a $0.9 million favorable adjustment to stock-based compensation expense.
A summary of our time-based restricted stock awards activity during 2013 are as follows:
| Time-based restricted stock |
Shares | Weighted-Average Grant Date Fair Value(1) |
||||||
| Unvested, December 31, 2012 |
91,831 | $ | 194.13 | |||||
| Granted |
89,078 | 155.40 | ||||||
| Vested |
(43,723 | ) | 193.69 | |||||
| Forfeited |
(5,996 | ) | 259.68 | |||||
|
|
|
|||||||
| Unvested, December 31, 2013 |
131,190 | $ | 164.97 | |||||
|
|
|
|||||||
| (1) | Weighted-average per share |
Total compensation expense for time-based restricted stock awards was $8.3 million, $4.2 million, and $10.2 million, for the years ended December 31, 2013, 2012, and 2011, respectively.
Compensation expense recognized for the year ended December 31, 2012 includes an adjustment, which resulted in a reduction of expense of approximately $2.5 million. The adjustments relate to the correction of prior period grant date fair values of time-based and performance-based restricted stock awards and the correction of prior period grant service based stock award vesting periods. The Company does not believe these adjustments were material to the 2012 or previous period financial statements.
Based on the nature of the employee groups who received awards and the limited number of employees who received grants during the year ended December 31, 2013, 2012, and 2011, the Company is currently anticipating no significant forfeitures in future periods. To the extent actual forfeitures occur, they are recorded as adjustments to compensation expense in the periods in which they occur. As of December 31, 2013, there was $12.4 million of total unrecognized compensation cost related to time-based restricted stock awards. That cost is expected to be recognized over a weighted-average period of 3.4 years.
The fair values of performance-based restricted stock awards were estimated on the date of grant using a combination of a call option and digital option model that uses assumptions about expected volatility, risk-free interest rates, the expected time until a performance condition will be met, and dividend yield. The expected volatilities are based on a combination of implied and historical volatilities of a peer group of companies, as the Company is a non-publicly traded company. The risk-free rate is based on the U.S. Treasury yield curve in effect at the time of grant for periods corresponding with the expected life of the awards. The expected term represents management’s probability-weighted estimate of the expected time until a change in control or IPO occurs. The expected dividend yield is based on an assumption that no dividends are expected to be approved in the near future.
F-37
Table of Contents
The following are the weighted average assumptions used for grants during the years ended December 31, 2013, 2012, and 2011, respectively:
| Year Ended December 31, |
||||||||||||
| 2013 | 2012 | 2011 | ||||||||||
| Dividend yield |
0.00 | % | 0.00 | % | 0.00 | % | ||||||
| Expected volatility |
73.25 | % | 75.71 | % | 68.03 | % | ||||||
| Risk-free interest rate |
0.52 | % | 0.58 | % | 0.98 | % | ||||||
| Expected term (in years) for performance-based shares |
3.85 | 3.85 | 2.54 | |||||||||
| Expected term (in years) for service-based shares |
9.21 | 10.32 | 11.42 | |||||||||
A summary of the performance-based restricted stock award activity during 2013 are as follows:
| Performance-based restricted stock |
Shares | Weighted-Average Grant Date Fair Value(1) |
||||||
| Unvested, December 31, 2012 |
111,033 | $ | 143.26 | |||||
| Granted |
16,458 | 114.50 | ||||||
| Vested |
— | — | ||||||
| Forfeited |
(9,368 | ) | 236.81 | |||||
|
|
|
|||||||
| Unvested, December 31, 2013 |
118,123 | $ | 131.83 | |||||
|
|
|
|||||||
| (1) | Weighted-average per share |
With the exception of compensation expense recorded in 2011 on the redemption of performance-based restricted stock awards as a part of the shareholder distribution and share redemption during the first quarter of 2011, the Company has not recorded compensation expense related to performance-based restricted stock awards as the likelihood of achieving the performance condition was not deemed to be probable as of December 31, 2013. Should this determination change in the future, compensation expense will be recognized over any remaining service period at that time. As of December 31, 2013, there was $15.6 million of total unrecognized compensation cost related to performance-based restricted stock awards.
Additional information for our time-based and performance-based restricted stock awards for the years ended December 31, 2013, 2012, and 2011, respectively, were as follows:
| Time-Based Restricted Stock | Performance-Based Restricted Stock | |||||||||||||||
| Weighted-Average Grant Date Fair Value(1) |
Total Fair Value of Shares Vested |
Weighted-Average Grant Date Fair Value(1) |
Total Fair Value of Shares Vested |
|||||||||||||
| Year Ended December 31, 2013 |
$ | 155.40 | $ | 6,795 | $ | 114.50 | $ | — | ||||||||
| Year Ended December 31, 2012 |
$ | 204.32 | $ | 9,100 | $ | 170.43 | $ | — | ||||||||
| Year Ended December 31, 2011 |
$ | 350.16 | $ | 9,436 | $ | 267.29 | $ | — | ||||||||
| (1) | Weighted-average per share |
Shareholder distribution and share redemption
On February 3, 2011, the Company used a portion of the proceeds from the 2011 Term Loans to pay a distribution to the shareholders of the Parent, including investment funds advised or managed by Bain Capital, Dow and certain executives, through a redemption of certain classes of the Parent’s shares. The shares redeemed included a portion of the outstanding unvested time-based and performance-based restricted stock awards as well as a portion of the issued and outstanding restricted stock. As a result of the share redemption, the Company
F-38
Table of Contents
recorded a one-time stock-based compensation charge of $11.1 million in the first quarter of 2011 reflecting the settlement of previously unvested time-based and performance-based restricted stock awards redeemed.
For certain employees, a portion or all of this distribution attributable to unvested time-based and performance-based restricted awards was withheld and put in escrow, to be paid out two years from the employees’ date of hire, subject to the participant’s continued employment with the Company. The amounts held in escrow vest ratably over the two year period of time after the employee’s hire date. At the date of the redemption, the Parent recorded a liability to reflect the amount held in escrow each employee had already vested in as of the date of the redemption. Compensation expense on the unvested amount of the distribution withheld in escrow will be recognized ratably over the remaining service period from the time of the redemption. Total compensation expense for these liability awards was less than $0.1 million, $0.9 million, and $0.8 million for the years ended December 31, 2013, 2012, and 2011, respectively. As of December 31, 2013, there was no remaining unrecognized compensation cost related to these liability awards.
Management Retention Awards
During the year ended December 31, 2012, the Parent agreed to retention awards with certain officers. These awards generally vest over one to four years, and are payable upon vesting subject to the participant’s continued employment with the Company on the vesting date. Compensation expense related to these retention awards is equivalent to the value of the award, and is being recognized as compensation expense ratably over the applicable service period. There were no retention awards granted by the Parent and no compensation expense recorded during the year ended December 31, 2011. Total compensation expense for these retention awards was $1.4 million and $2.3 million for the years ended December 31, 2013 and 2012, respectively. As of December 31, 2013, there was $1.3 million in unrecognized compensation cost related to these retention awards, which is expected to be recognized over a period of 2.1 years.
Restricted Stock
During the year ended December 31, 2013, the Parent sold 779 shares of non-transferable restricted stock to certain employees, all of which were sold at a purchase price less than the fair value of the Parent’s common stock. As a result, during the year ended December 31, 2013, the Company recorded compensation expense of approximately $0.2 million related to these restricted stock sales.
There were no restricted stock sales during the year ended December 31, 2012. During the year ended December 31, 2011, the Parent sold 1,561 shares of non-transferable restricted stock to certain employees at a purchase price less than the then fair value of the Parent’s common stock, resulting in compensation expense of $0.2 million during the year ended December 31, 2011.
The restricted stock may not be transferred without the Parent’s consent except for a sale to the Parent or its investors in connection with a termination or on an IPO or other liquidation event.
The amount of stock-based compensation expense recorded within “Selling, general and administrative expenses” in the consolidated statement of operations for the years ended December 31, 2013, 2012, and 2011, respectively, was as follows:
| Year Ended December 31, |
||||||||||||
| 2013 | 2012 | 2011 | ||||||||||
| Time-based restricted stock |
$ | 8,346 | $ | 4,192 | $ | 10,244 | ||||||
| Restricted stock |
171 | — | 164 | |||||||||
| Share redemption |
— | — | 11,125 | |||||||||
| Liability awards |
46 | 861 | 761 | |||||||||
| Retention awards |
1,416 | 2,275 | — | |||||||||
|
|
|
|
|
|
|
|||||||
| $ | 9,979 | $ | 7,328 | $ | 22,294 | |||||||
|
|
|
|
|
|
|
|||||||
F-39
Table of Contents
NOTE R—RELATED PARTY AND DOW TRANSACTIONS
In conjunction with the Acquisition, the Company entered into certain agreements with Dow, including a five-year Master Outsourcing Services Agreement (“MOSA”) and certain Site and Operating Service Agreements. The MOSA provides for ongoing services from Dow in areas such as information technology, human resources, finance, environmental health and safety, training, supply chain and purchasing. Effective June 1, 2013, the Company entered into a Second Amended and Restated Master Outsourcing Services Agreement (“SAR MOSA”). The SAR MOSA replaces, modifies and extends the earlier MOSA, extending the term through December 31, 2020. Under the SAR MOSA, the Company continues to hold the option to terminate substantially all of the services provided under this arrangement after June 1, 2015, wherein the Company’s contractual commitments for these services will terminate upon 180 days after the appropriate notice is provided, subject to termination penalty. As of December 31, 2013, the estimated minimum contractual obligations under the SAR MOSA were $47.0 million in 2014, $20.0 million through June 1, 2015, and $32.0 million thereafter.
In addition, the Company entered into certain Site and Operating Service Agreements. Under the Site Services Agreement (“SSA”), Dow provides the Company utilities and other site services for Company-owned plants. Under the Operating Services agreements the Company provides services to Dow and receives payments for the operation of a Dow-owned plant. Similar to the above SAR MOSA, effective June 1, 2013, the Company entered into Second Amended and Restated Site Services Agreements (“SAR SSAs”). The SAR SSAs replace, modify and extend the original SSAs. These agreements generally have 25-year terms, with automatic renewals for five-year terms unless one party gives notice at least 18 months prior to the end of the period. The Company has the option to terminate these agreements subject to certain ongoing capital costs for each site agreement. The Company’s contractual commitments for these site services would generally be for a period of 45 to 60 months upon appropriate notice of termination of each site service agreement. For the years ended December 31, 2013, 2012 and 2011, the Company incurred a total of $303.2 million, $317.6 million and $354.6 million in expenses under these agreements, respectively, including $235.1 million, $214.5 million and $232.9 million, for both the variable and fixed cost components of the Site Service Agreements, respectively, and $68.1 million, $103.1 million and $121.7 million covering all other agreements, respectively.
In connection with the Acquisition and the execution of the Purchase Agreement, on June 17, 2010, the Styron Holdcos entered into a latex joint venture option agreement (the “Latex JV Option Agreement”) with Dow, pursuant to which Trinseo granted Dow an irrevocable option to purchase 50% of the issued and outstanding interests in a joint venture to be formed by Dow and the Styron Holdcos with respect to the SB Latex business in Asia, Latin America, the Middle East, Africa, Eastern Europe, Russian and India (the “Emerging Markets SB Latex Business”), at a purchase price equal to the fair value attributable to the Emerging Markets SB Latex Business as defined in the Latex JV Option Agreement. On July 8, 2011, Dow exercised its option pursuant to the Latex JV Option Agreement and, under the terms thereof, Dow and the Styron Holdcos must (i) form the joint venture, (ii) enter into a joint venture formation agreement pursuant to which all of the assets of the Emerging Markets SB Latex Business shall be contributed to the joint venture, (iii) enter into a shareholders’ agreement with respect to the governance of the joint venture and (iv) enter into customary ancillary agreement with respect to the joint venture and the transfer of the interests in the joint venture to Dow. Trinseo entered into an amendment, effective as of August 9, 2011, to the Latex JV Option Agreement to suspend the timing of the JV Latex Option to allow for additional business discussions. Dow and Trinseo agreed to suspend the requirements to take certain actions required in light of Dow’s exercise of its option through the earlier of June 17, 2015 or the completion of an initial public offering by the Company. In addition, if we do not come to an agreement with Dow, the amendment allows Dow to either reinstate the exercise under the terms of the original agreement or terminate the Latex JV Option Agreement in its entirety.
In addition, the Company has transactions in the normal course of business with Dow and its affiliates. For the years ended December 31, 2013, 2012, and 2011, sales to Dow and its affiliated companies were approximately $294.7 million, $311.4 million and $331.1 million, respectively. For the years ended December 31, 2013, 2012, and 2011, purchases (including MOSA and SSA services) from Dow and its affiliated companies were approximately $2,336.5 million, $2,654.7 million and $2,538.7 million, respectively.
F-40
Table of Contents
As of December 31, 2013 and 2012, receivables from Dow and its affiliated companies were approximately $31.6 million and $22.1 million, respectively, and are included in “Accounts receivable” in the consolidated balance sheet. As of December 31, 2013 and 2012, payables to Dow and its affiliated companies were approximately $218.9 million and $244.6 million, respectively, and are included in “Accounts payable” in the consolidated balance sheet.
Bain Capital provides management services to the Company pursuant to a 10-year initial term advisory agreement, under which the Company incurred $4.7 million of fees for the year ended December 31, 2013. Bain Capital also provides advice pursuant to a 10-year initial term transaction services agreement, with fees payable as a percentage of the transaction value of each financing, acquisition, or similar transaction. In 2013, in connection with the issuance of the Senior Notes and the amendment to the Company’s Senior Secured Credit Facility in January 2013, the Company incurred approximately $13.9 million of fees paid to Bain Capital pursuant to this agreement. The fees incurred were included in the refinancing fees capitalized as deferred charges (refer to Note J for further discussion).
Total fees incurred from Bain Capital for these management and transaction advisory services, including fees related to the Acquisition and the Company’s financing arrangements, were $18.6 million, $4.6 million and $11.4 million, respectively, for the years ended December 31, 2013, 2012 and 2011.
NOTE S—SEGMENTS
The Company operates four segments under two principal business units. The Emulsion Polymers business unit includes a Latex segment and a Synthetic Rubber segment. The Plastics business unit includes a Styrenics segment and an Engineered Polymers segment.
The Latex segment produces SB latex primarily for coated paper and packaging board, carpet and artificial turf backings, as well as a number of performance latex applications. The Synthetic Rubber segment produces synthetic rubber products used predominantly in tires, with additional applications in polymer modification and technical rubber goods, including conveyer and fan belts, hoses, seals and gaskets. The Styrenics and Engineered Polymers segments offer complementary plastics products with formulations developed for durable applications, such as consumer electronics, automotive and construction. Through these two segments, the Company provides a broad set of plastics product solutions to its customers.
| Emulsion Polymers | Plastics | |||||||||||||||||||||||
| For the year ended |
Latex | Synthetic Rubber |
Styrenics | Engineered Polymers |
Corporate Unallocated |
Total | ||||||||||||||||||
| December 31, 2013 |
||||||||||||||||||||||||
| Sales to external customers |
$ | 1,341,424 | $ | 622,059 | $ | 2,305,434 | $ | 1,038,497 | $ | — | $ | 5,307,414 | ||||||||||||
| Equity in earnings (losses) of unconsolidated affiliates |
— | — | 39,447 | (309 | ) | — | 39,138 | |||||||||||||||||
| EBITDA(1) |
95,398 | 113,459 | 160,724 | (9,058 | ) | |||||||||||||||||||
| Investment in unconsolidated affiliates |
— | — | 118,263 | 37,624 | — | 155,887 | ||||||||||||||||||
| Depreciation and amortization |
26,092 | 28,937 | 28,956 | 7,375 | 3,836 | 95,196 | ||||||||||||||||||
| December 31, 2012 |
||||||||||||||||||||||||
| Sales to external customers |
$ | 1,545,064 | $ | 701,962 | $ | 2,149,202 | $ | 1,055,681 | $ | — | $ | 5,451,909 | ||||||||||||
| Equity in earnings of unconsolidated affiliates |
— | — | 27,026 | 114 | — | 27,140 | ||||||||||||||||||
| EBITDA(1) |
125,473 | 111,051 | 82,947 | 31,503 | ||||||||||||||||||||
| Investment in unconsolidated affiliates |
— | — | 101,316 | 38,988 | — | 140,304 | ||||||||||||||||||
| Depreciation and amortization |
27,037 | 18,080 | 30,618 | 6,936 | 2,933 | 85,604 | ||||||||||||||||||
F-41
Table of Contents
| Emulsion Polymers | Plastics | |||||||||||||||||||||||
| For the year ended |
Latex | Synthetic Rubber |
Styrenics | Engineered Polymers |
Corporate Unallocated |
Total | ||||||||||||||||||
| December 31, 2011 |
||||||||||||||||||||||||
| Sales to external customers |
$ | 1,843,529 | $ | 849,426 | $ | 2,306,989 | $ | 1,192,914 | $ | — | $ | 6,192,858 | ||||||||||||
| Equity in earnings (losses) of unconsolidated affiliates |
— | — | 24,078 | (204 | ) | — | 23,874 | |||||||||||||||||
| EBITDA(1) |
121,495 | 174,571 | 72,154 | 26,346 | ||||||||||||||||||||
| Investment in unconsolidated affiliates |
— | — | 94,289 | 39,846 | — | 134,135 | ||||||||||||||||||
| Depreciation and amortization |
37,430 | 16,911 | 37,251 | 9,006 | 1,013 | 101,611 | ||||||||||||||||||
| (1) | Reconciliation of EBITDA to net income (loss) is as follows: |
| Year Ended December 31, |
||||||||||||
| 2013 | 2012 | 2011 | ||||||||||
| Total segment EBITDA |
$ | 360,523 | $ | 350,974 | $ | 394,566 | ||||||
| Corporate unallocated |
(133,658 | ) | (107,557 | ) | (217,716 | ) | ||||||
| Less: Interest expense, net |
132,038 | 109,971 | 111,416 | |||||||||
| Less: Provision for income taxes |
21,849 | 17,560 | 39,728 | |||||||||
| Less: Depreciation and amortization |
95,196 | 85,604 | 101,611 | |||||||||
|
|
|
|
|
|
|
|||||||
| Net income (loss) |
$ | (22,218 | ) | $ | 30,282 | $ | (75,905 | ) | ||||
|
|
|
|
|
|
|
|||||||
Corporate unallocated includes corporate overhead costs, loss on extinguishment of long-term debt, and certain other income and expenses.
The primary measure of segment operating performance is EBITDA, which is defined as net income (loss) before interest, income taxes, depreciation and amortization. EBITDA is a key metric that is used by management to evaluate business performance in comparison to budgets, forecasts, and prior year financial results, providing a measure that management believes reflects the Company’s core operating performance. EBITDA is useful for analysis purposes; however, it should not be considered an alternative to the Company’s reported GAAP results, as there are limitations in using such financial measures. Other companies in the industry may define EBITDA differently than the Company, and as a result, it may be difficult to use EBITDA, or similarly-named financial measures, that other companies may use to compare the performance of those companies to the Company’s performance.
Asset and capital expenditure information is not accounted for at the segment level and consequently is not reviewed or included with the Company’s internal management reporting. Therefore, the Company has not disclosed asset and capital expenditure information for each reportable segment.
Styron operates 35 manufacturing plants (which include a total of 83 production units) at 27 sites in 14 countries, inclusive of joint ventures and contract manufacturers. Sales are attributed to geographic areas based on the location where sales originated; long-lived assets are attributed to geographic areas based on asset location.
F-42
Table of Contents
| Year Ended December 31, |
||||||||||||
| 2013 | 2012 | 2011 | ||||||||||
| United States |
||||||||||||
| Sales to external customers |
$ | 665,801 | $ | 683,570 | $ | 812,230 | ||||||
| Long-lived assets |
73,932 | 84,992 | 95,907 | |||||||||
| Europe |
||||||||||||
| Sales to external customers |
$ | 3,186,659 | $ | 3,324,064 | $ | 3,898,815 | ||||||
| Long-lived assets |
431,494 | 449,834 | 396,707 | |||||||||
| Asia-Pacific |
||||||||||||
| Sales to external customers |
$ | 1,214,093 | $ | 1,200,747 | $ | 1,236,555 | ||||||
| Long-lived assets |
92,691 | 91,885 | 91,590 | |||||||||
| Rest of World |
||||||||||||
| Sales to external customers |
$ | 240,861 | $ | 243,528 | $ | 245,258 | ||||||
| Long-lived assets |
8,310 | 6,561 | 6,678 | |||||||||
| Total |
||||||||||||
| Sales to external customers(1) |
$ | 5,307,414 | $ | 5,451,909 | $ | 6,192,858 | ||||||
| Long-lived assets(2)(3) |
606,427 | 633,272 | 590,882 | |||||||||
| (1) | Sales to external customers in China represented approximately 8%, 8% and 7% of the total for the years ended December 31, 2013, 2012, and 2011, respectively. Sales to external customers in Germany represented approximately 11%, 10% and 10% of the total for the years ended December 31, 2013, 2012, and 2011, respectively. Sales to external customers in Hong Kong represented approximately 10%, 9% and 8% of the total for the years ended December 31, 2013, 2012, and 2011, respectively. |
| (2) | Long-lived assets in China represented approximately 4%, 4%, and 6% of the total for the years ended December 31, 2013, 2012, and 2011, respectively. Long-lived assets in Germany represented approximately 44%, 45%, and 39% of the total for the years ended December 31, 2013, 2012, and 2011, respectively. Long-lived assets in Netherlands represented approximately 13%, 13%, and 13% of the total for the years ended December 31, 2013, 2012, and 2011, respectively. |
| (3) | Long-lived assets consist of property, plant and equipment, net. |
NOTE T—RESTRUCTURING
In February 2012, the Company announced an organizational restructuring program that included changes to many employees’ roles and elimination of approximately 90 roles globally. This restructuring was driven by the business organization, as well as the need to further reduce costs due to the challenging economic outlook in 2012. As a result of this and other employee separations during 2012, the Company recorded special termination benefit charges of approximately $7.5 million for the year ended December 31, 2012 within Corporate unallocated. For the year ended December 31, 2011, the Company recorded special termination benefit charges of approximately $9.2 million within Corporate unallocated, all of which were paid out in 2012. These restructuring charges were included in “Selling, general and administrative expenses” in the consolidated statement of operations and the related liability is included in “Accrued expenses and other current liabilities” in the consolidated balance sheet. As of December 31, 2012, approximately $6.7 million of the special termination benefits expensed in 2012 had been paid out to terminated employees and the remaining charges were paid out during 2013. No additional charges have been incurred in conjunction with these initiatives, and there are no amounts accrued as of December 31, 2013.
Separately, in July 2013, the Company’s board of directors approved the plan to close the Company’s latex manufacturing facility in Altona, Australia. This restructuring plan was a strategic business decision to improve the results of the overall Latex segment. The facility manufactured SB latex used in the carpet and paper markets. Production at the facility ceased in the third quarter of 2013, followed by decommissioning, with demolition expected in 2014. As a result of the plant closure, the Company recorded restructuring charges of $10.8 million for the year ended December 31, 2013. These charges consisted of property, plant and equipment and other asset
F-43
Table of Contents
impairment charges of $4.1 million, employee termination benefit charges of $2.6 million, contract termination charges of $3.9 million, and decommissioning charges of $0.2 million. These charges were included in “Selling, general and administrative expenses” in the condensed consolidated statements of operations, and were allocated entirely to the Latex segment. The employee termination benefits, contract termination costs, and decommissioning costs were recorded in “Accrued expenses and other current liabilities” in the consolidated balance sheet.
The following table provides a rollforward of the liability balances associated with the Altona plant shutdown:
| Balance at December 31, 2012 |
Expenses | Deductions* | Balance at December 31, 2013 |
|||||||||||||
| Employee termination benefit charges |
$ | — | $ | 2,589 | $ | (1,181 | ) | $ | 1,408 | |||||||
| Contract termination charges |
— | 3,934 | (546 | ) | 3,388 | |||||||||||
| Other** |
— | 215 | (189 | ) | 26 | |||||||||||
|
|
|
|
|
|
|
|
|
|||||||||
| Total |
$ | — | $ | 6,738 | $ | (1,916 | ) | $ | 4,822 | |||||||
|
|
|
|
|
|
|
|
|
|||||||||
| * | Includes primarily payments made against the existing accrual, as well as immaterial impacts of foreign currency remeasurement. |
| ** | Includes decommissioning charges incurred in 2013, primarily related to labor service costs. |
The Company expects to incur additional decommissioning and demolition costs associated with this plant shutdown in 2014, the cost of which will be expensed as incurred.
NOTE U— ACCUMULATED OTHER COMPREHENSIVE INCOME (LOSS)
The components of accumulated other comprehensive income (loss), net of income taxes, consisted of:
| Currency Translation Adjustment, Net |
Employee Benefits, Net |
Total | ||||||||||
| Balance at December 31, 2010 |
$ | 78,295 | $ | 5,794 | $ | 84,089 | ||||||
| Accumulated other comprehensive income (loss) |
(39,360 | ) | 8,459 | (30,901 | ) | |||||||
|
|
|
|
|
|
|
|||||||
| Balance at December 31, 2011 |
38,935 | 14,253 | 53,188 | |||||||||
| Accumulated other comprehensive income (loss) |
23,872 | (52,487 | ) | (28,615 | ) | |||||||
|
|
|
|
|
|
|
|||||||
| Balance at December 31, 2012 |
62,807 | (38,234 | ) | 24,573 | ||||||||
| Accumulated other comprehensive income (loss) |
53,339 | 10,466 | 63,805 | |||||||||
|
|
|
|
|
|
|
|||||||
| Balance at December 31, 2013 |
$ | 116,146 | $ | (27,768 | ) | $ | 88,378 | |||||
|
|
|
|
|
|
|
|||||||
NOTE V—SUBSEQUENT EVENTS
In February 2014, the Company announced that it has reached an agreement with material supplier JSR to acquire its current production capacity rights at the Company’s world-scale rubber production hub in Schkopau, Germany for a purchase price of €19.0 million (approximately $25.7 million). Prior to this agreement, JSR held the capacity rights to 50% of one of Styron’s three SSBR production trains in Schkopau. As a result, effective April 1, 2014 the Company will have full capacity rights to this train, enabling it to increase its capabilities to serve the global tire market.
F-44
Table of Contents
NOTE W—SUPPLEMENTAL GUARANTOR CONDENSED CONSOLIDATING FINANCIAL STATEMENTS
In connection with the issuance of the Senior Notes by Trinseo Materials Operating S.C.A. and Trinseo Materials Finance, Inc. (the “Issuers”), this supplemental guarantor financial statement disclosure is included in accordance with Rule 3-10 of Regulation S-X. The Senior Notes are fully and unconditionally guaranteed, jointly and severally, on a senior unsecured basis, in each case, subject to certain exceptions, by Trinseo S.A. (the “Parent Guarantor”) and by certain subsidiaries (together, the “Guarantor Subsidiaries”).
Each of the Guarantor Subsidiaries is 100 percent owned by the Company. None of the other subsidiaries of the Company, either direct or indirect, guarantee the Senior Notes (together, the “Non-Guarantor Subsidiaries”). The Guarantor Subsidiaries of the Senior Notes, excluding the Parent Guarantor, will be automatically released from those guarantees upon the occurrence of certain customary release provisions.
The following supplemental condensed consolidating financial information is presented to comply with the Company’s requirements under Rule 3-10 of Regulation S-X:
| • | the Condensed Consolidating Balance Sheets as of December 31, 2013 and December 31, 2012; |
| • | the Condensed Consolidating Statements of Comprehensive Income (Loss) for the years ended December 31, 2013, 2012 and 2011; and |
| • | the Condensed Consolidating Statements of Cash Flows for the years ended December 31, 2013, 2012 and 2011. |
The Condensed Consolidating Financial Statements are presented using the equity method of accounting for its investments in 100 percent owned subsidiaries. Under the equity method, the investments in subsidiaries are recorded at cost and adjusted for our share of the subsidiaries cumulative results of operations, capital contributions, distributions and other equity changes. The elimination entries principally eliminate investments in subsidiaries and intercompany balances and transactions. The financial information in this footnote should be read in conjunction with the Consolidated Financial Statements presented and other notes related thereto contained within this Annual Report.
F-45
Table of Contents
SUPPLEMENTAL CONDENSED CONSOLIDATING BALANCE SHEET
(In thousands)
| December 31, 2013 | ||||||||||||||||||||||||
| Parent Guarantor |
Issuers | Guarantor Subsidiaries |
Non-Guarantor Subsidiaries |
Eliminations | Consolidated | |||||||||||||||||||
| Assets |
||||||||||||||||||||||||
| Current assets |
||||||||||||||||||||||||
| Cash and cash equivalents |
$ | 2 | $ | 954 | $ | 154,770 | $ | 40,777 | $ | — | $ | 196,503 | ||||||||||||
| Accounts receivable, net of allowance |
— | — | 272,745 | 444,739 | (2 | ) | 717,482 | |||||||||||||||||
| Intercompany receivables |
— | 554,795 | 1,242,405 | 93,841 | (1,891,041 | ) | — | |||||||||||||||||
| Inventories |
— | — | 439,952 | 93,019 | (2,780 | ) | 530,191 | |||||||||||||||||
| Deferred income tax assets |
— | — | 5,077 | 4,743 | — | 9,820 | ||||||||||||||||||
| Other current assets |
— | 3,954 | 4,386 | 14,410 | — | 22,750 | ||||||||||||||||||
|
|
|
|
|
|
|
|
|
|
|
|
|
|||||||||||||
| Total current assets |
2 | 559,703 | 2,119,335 | 691,529 | (1,893,823 | ) | 1,476,746 | |||||||||||||||||
|
|
|
|
|
|
|
|
|
|
|
|
|
|||||||||||||
| Investments in unconsolidated affiliates |
— | — | 155,887 | — | — | 155,887 | ||||||||||||||||||
| Property, plant and equipment, net |
— | — | 476,137 | 130,290 | — | 606,427 | ||||||||||||||||||
| Other assets |
||||||||||||||||||||||||
| Goodwill |
— | — | 37,273 | — | — | 37,273 | ||||||||||||||||||
| Other intangible assets, net |
— | — | 171,352 | 162 | — | 171,514 | ||||||||||||||||||
| Investments in subsidiaries |
343,429 | 1,232,608 | 615,153 | — | (2,191,190 | ) | — | |||||||||||||||||
| Intercompany notes receivable—noncurrent |
— | 1,359,637 | 17,739 | — | (1,377,376 | ) | — | |||||||||||||||||
| Deferred income tax assets—noncurrent |
— | — | 36,260 | 6,678 | — | 42,938 | ||||||||||||||||||
| Deferred charges and other assets |
— | 48,801 | 33,607 | 990 | 598 | 83,996 | ||||||||||||||||||
|
|
|
|
|
|
|
|
|
|
|
|
|
|||||||||||||
| Total other assets |
343,429 | 2,641,046 | 911,384 | 7,830 | (3,567,968 | ) | 335,721 | |||||||||||||||||
|
|
|
|
|
|
|
|
|
|
|
|
|
|||||||||||||
| Total assets |
$ | 343,431 | $ | 3,200,749 | $ | 3,662,743 | $ | 829,649 | $ | (5,461,791 | ) | $ | 2,574,781 | |||||||||||
|
|
|
|
|
|
|
|
|
|
|
|
|
|||||||||||||
| Liabilities and shareholder’s equity |
||||||||||||||||||||||||
| Current liabilities |
||||||||||||||||||||||||
| Short-term borrowings and current portion of long-term debt |
$ | — | $ | 3,646 | $ | — | $ | 5,108 | $ | — | $ | 8,754 | ||||||||||||
| Accounts payable |
— | 2,570 | 436,147 | 70,378 | (2 | ) | 509,093 | |||||||||||||||||
| Intercompany payables |
158 | 763,022 | 550,741 | 576,354 | (1,890,275 | ) | — | |||||||||||||||||
| Income taxes payable |
— | — | 9,407 | 276 | — | 9,683 | ||||||||||||||||||
| Deferred income tax liabilities |
— | — | 784 | 2,119 | — | 2,903 | ||||||||||||||||||
| Accrued expenses and other current liabilities |
71 | 58,977 | 66,061 | 11,020 | — | 136,129 | ||||||||||||||||||
|
|
|
|
|
|
|
|
|
|
|
|
|
|||||||||||||
| Total current liabilities |
229 | 828,215 | 1,063,140 | 665,255 | (1,890,277 | ) | 666,562 | |||||||||||||||||
|
|
|
|
|
|
|
|
|
|
|
|
|
|||||||||||||
| Noncurrent liabilities |
||||||||||||||||||||||||
| Long-term debt |
— | 1,325,000 | 2,667 | — | — | 1,327,667 | ||||||||||||||||||
| Intercompany notes payable—noncurrent |
— | — | 1,347,773 | 29,602 | (1,377,375 | ) | — | |||||||||||||||||
| Deferred income tax liabilities—noncurrent |
— | 1,600 | 17,115 | 8,217 | — | 26,932 | ||||||||||||||||||
| Other noncurrent obligations |
— | — | 198,479 | 11,939 | — | 210,418 | ||||||||||||||||||
|
|
|
|
|
|
|
|
|
|
|
|
|
|||||||||||||
| Total noncurrent liabilities |
— | 1,326,600 | 1,566,034 | 49,758 | (1,377,375 | ) | 1,565,017 | |||||||||||||||||
|
|
|
|
|
|
|
|
|
|
|
|
|
|||||||||||||
| Commitments and contingencies (Note O) |
||||||||||||||||||||||||
| Shareholder’s equity |
343,202 | 1,045,934 | 1,033,569 | 114,636 | (2,194,139 | ) | 343,202 | |||||||||||||||||
|
|
|
|
|
|
|
|
|
|
|
|
|
|||||||||||||
| Total liabilities and shareholder’s equity |
$ | 343,431 | $ | 3,200,749 | $ | 3,662,743 | $ | 829,649 | $ | (5,461,791 | ) | $ | 2,574,781 | |||||||||||
|
|
|
|
|
|
|
|
|
|
|
|
|
|||||||||||||
F-46
Table of Contents
SUPPLEMENTAL CONDENSED CONSOLIDATING BALANCE SHEET
(In thousands)
| December 31, 2012 | ||||||||||||||||||||||||
| Parent Guarantor |
Issuers | Guarantor Subsidiaries |
Non-Guarantor Subsidiaries |
Eliminations | Consolidated | |||||||||||||||||||
| Assets |
||||||||||||||||||||||||
| Current assets |
||||||||||||||||||||||||
| Cash and cash equivalents |
$ | 3 | $ | 29,411 | $ | 182,088 | $ | 24,855 | $ | — | $ | 236,357 | ||||||||||||
| Restricted cash |
— | — | — | 7,852 | — | 7,852 | ||||||||||||||||||
| Accounts receivable, net of allowance |
— | 5,798 | 273,491 | 416,104 | (29 | ) | 695,364 | |||||||||||||||||
| Intercompany receivables |
— | 517,640 | 1,106,234 | 50,322 | (1,674,196 | ) | — | |||||||||||||||||
| Inventories |
— | — | 481,503 | 105,527 | (4,290 | ) | 582,740 | |||||||||||||||||
| Deferred income tax assets |
— | — | 1,373 | 2,980 | — | 4,353 | ||||||||||||||||||
| Other current assets |
— | 3,980 | 4,484 | 12,547 | — | 21,011 | ||||||||||||||||||
|
|
|
|
|
|
|
|
|
|
|
|
|
|||||||||||||
| Total current assets |
3 | 556,829 | 2,049,173 | 620,187 | (1,678,515 | ) | 1,547,677 | |||||||||||||||||
|
|
|
|
|
|
|
|
|
|
|
|
|
|||||||||||||
| Investments in unconsolidated affiliates |
— | — | 140,304 | — | — | 140,304 | ||||||||||||||||||
| Property, plant and equipment, net |
— | — | 509,450 | 123,822 | — | 633,272 | ||||||||||||||||||
| Other assets |
||||||||||||||||||||||||
| Goodwill |
— | — | 36,103 | — | — | 36,103 | ||||||||||||||||||
| Other intangible assets, net |
— | — | 179,439 | 203 | — | 179,642 | ||||||||||||||||||
| Investments in subsidiaries |
291,752 | 596,693 | 519,667 | — | (1,408,112 | ) | — | |||||||||||||||||
| Intercompany notes receivable—noncurrent |
— | 1,421,676 | 101,000 | — | (1,522,676 | ) | — | |||||||||||||||||
| Deferred income tax assets—noncurrent |
— | — | 59,489 | 7,715 | — | 67,204 | ||||||||||||||||||
| Deferred charges and other assets |
— | 23,782 | 35,878 | 693 | 1,141 | 61,494 | ||||||||||||||||||
|
|
|
|
|
|
|
|
|
|
|
|
|
|||||||||||||
| Total other assets |
291,752 | 2,042,151 | 931,576 | 8,611 | (2,929,647 | ) | 344,443 | |||||||||||||||||
|
|
|
|
|
|
|
|
|
|
|
|
|
|||||||||||||
| Total assets |
$ | 291,755 | $ | 2,598,980 | $ | 3,630,503 | $ | 752,620 | $ | (4,608,162 | ) | $ | 2,665,696 | |||||||||||
|
|
|
|
|
|
|
|
|
|
|
|
|
|||||||||||||
| Liabilities and shareholder’s equity |
||||||||||||||||||||||||
| Current liabilities |
||||||||||||||||||||||||
| Short-term borrowings and current portion of long-term debt |
$ | — | $ | 3,541 | $ | — | $ | 94,592 | $ | — | $ | 98,133 | ||||||||||||
| Accounts payable |
8 | 1,588 | 509,985 | 60,601 | — | 572,182 | ||||||||||||||||||
| Intercompany payables |
72 | 692,417 | 525,101 | 455,432 | (1,673,022 | ) | — | |||||||||||||||||
| Income taxes payable |
— | — | 9,193 | 1,891 | — | 11,084 | ||||||||||||||||||
| Deferred income tax liabilities |
— | — | 1,959 | 669 | — | 2,628 | ||||||||||||||||||
| Accrued expenses and other current liabilities |
10 | 22,080 | 47,833 | 15,652 | — | 85,575 | ||||||||||||||||||
|
|
|
|
|
|
|
|
|
|
|
|
|
|||||||||||||
| Total current liabilities |
90 | 719,626 | 1,094,071 | 628,837 | (1,673,022 | ) | 769,602 | |||||||||||||||||
|
|
|
|
|
|
|
|
|
|
|
|
|
|||||||||||||
| Noncurrent liabilities |
||||||||||||||||||||||||
| Long-term debt |
— | 1,352,584 | 2,867 | — | — | 1,355,451 | ||||||||||||||||||
| Intercompany notes payable—noncurrent |
— | 83,999 | 1,418,444 | 20,233 | (1,522,676 | ) | — | |||||||||||||||||
| Deferred income tax liabilities—noncurrent |
— | 850 | 28,940 | 10,577 | — | 40,367 | ||||||||||||||||||
| Other noncurrent obligations |
— | — | 197,709 | 10,902 | — | 208,611 | ||||||||||||||||||
|
|
|
|
|
|
|
|
|
|
|
|
|
|||||||||||||
| Total noncurrent liabilities |
— | 1,437,433 | 1,647,960 | 41,712 | (1,522,676 | ) | 1,604,429 | |||||||||||||||||
|
|
|
|
|
|
|
|
|
|
|
|
|
|||||||||||||
| Commitments and contingencies (Note O) |
||||||||||||||||||||||||
| Shareholder’s equity |
291,665 | 441,921 | 888,472 | 82,071 | (1,412,464 | ) | 291,665 | |||||||||||||||||
|
|
|
|
|
|
|
|
|
|
|
|
|
|||||||||||||
| Total liabilities and shareholder’s equity |
$ | 291,755 | $ | 2,598,980 | $ | 3,630,503 | $ | 752,620 | $ | (4,608,162 | ) | $ | 2,665,696 | |||||||||||
|
|
|
|
|
|
|
|
|
|
|
|
|
|||||||||||||
F-47
Table of Contents
SUPPLEMENTAL CONDENSED CONSOLIDATING STATEMENT OF COMPREHENSIVE INCOME (LOSS)
(In thousands)
| Year Ended December 31, 2013 | ||||||||||||||||||||||||
| Parent Guarantor |
Issuers | Guarantor Subsidiaries |
Non- Guarantor Subsidiaries |
Eliminations | Consolidated | |||||||||||||||||||
| Net sales |
$ | — | $ | — | $ | 4,793,183 | $ | 1,476,538 | $ | (962,307 | ) | $ | 5,307,414 | |||||||||||
| Cost of sales |
— | 996 | 4,485,470 | 1,427,391 | (964,453 | ) | 4,949,404 | |||||||||||||||||
|
|
|
|
|
|
|
|
|
|
|
|
|
|||||||||||||
| Gross profit |
— | (996 | ) | 307,713 | 49,147 | 2,146 | 358,010 | |||||||||||||||||
| Selling, general and administrative expenses |
10,073 | 3,981 | 181,756 | 21,048 | — | 216,858 | ||||||||||||||||||
| Equity in earnings of unconsolidated affiliates |
— | — | 39,138 | — | — | 39,138 | ||||||||||||||||||
|
|
|
|
|
|
|
|
|
|
|
|
|
|||||||||||||
| Operating income (loss) |
(10,073 | ) | (4,977 | ) | 165,095 | 28,099 | 2,146 | 180,290 | ||||||||||||||||
| Interest expense, net |
— | 125,711 | 3,656 | 2,671 | — | 132,038 | ||||||||||||||||||
| Intercompany interest expense (income), net |
7 | (88,851 | ) | 76,042 | 12,803 | (1 | ) | — | ||||||||||||||||
| Loss on extinguishment of long-term debt |
— | 20,744 | — | — | — | 20,744 | ||||||||||||||||||
| Other expense (income) |
6 | (32,325 | ) | 39,534 | 20,647 | 15 | 27,877 | |||||||||||||||||
| Equity in loss (earnings) of subsidiaries |
12,128 | (44,373 | ) | (3,346 | ) | — | 35,591 | — | ||||||||||||||||
|
|
|
|
|
|
|
|
|
|
|
|
|
|||||||||||||
| Income (loss) before income taxes |
(22,214 | ) | 14,117 | 49,209 | (8,022 | ) | (33,459 | ) | (369 | ) | ||||||||||||||
| Provision for (benefit from) income taxes |
4 | 1,735 | 16,964 | 2,593 | 553 | 21,849 | ||||||||||||||||||
|
|
|
|
|
|
|
|
|
|
|
|
|
|||||||||||||
| Net income (loss) |
$ | (22,218 | ) | $ | 12,382 | $ | 32,245 | $ | (10,615 | ) | $ | (34,012 | ) | $ | (22,218 | ) | ||||||||
|
|
|
|
|
|
|
|
|
|
|
|
|
|||||||||||||
| Comprehensive income (loss) |
$ | 41,587 | $ | 76,187 | $ | 91,240 | $ | (5,805 | ) | $ | (161,622 | ) | $ | 41,587 | ||||||||||
|
|
|
|
|
|
|
|
|
|
|
|
|
|||||||||||||
F-48
Table of Contents
SUPPLEMENTAL CONDENSED CONSOLIDATING STATEMENT OF COMPREHENSIVE INCOME (LOSS)
(In thousands)
| Year Ended December 31, 2012 | ||||||||||||||||||||||||
| Parent Guarantor |
Issuers | Guarantor Subsidiaries |
Non- Guarantor Subsidiaries |
Eliminations | Consolidated | |||||||||||||||||||
| Net sales |
$ | — | $ | — | $ | 4,947,970 | $ | 1,613,401 | $ | (1,109,462 | ) | $ | 5,451,909 | |||||||||||
| Cost of sales |
— | 279 | 4,691,834 | 1,532,264 | (1,109,189 | ) | 5,115,188 | |||||||||||||||||
|
|
|
|
|
|
|
|
|
|
|
|
|
|||||||||||||
| Gross profit |
— | (279 | ) | 256,136 | 81,137 | (273 | ) | 336,721 | ||||||||||||||||
| Selling, general and administrative expenses |
7,374 | 3,994 | 147,454 | 23,247 | — | 182,069 | ||||||||||||||||||
| Equity in earnings of unconsolidated affiliates |
— | — | 27,140 | — | — | 27,140 | ||||||||||||||||||
|
|
|
|
|
|
|
|
|
|
|
|
|
|||||||||||||
| Operating income (loss) |
(7,374 | ) | (4,273 | ) | 135,822 | 57,890 | (273 | ) | 181,792 | |||||||||||||||
| Interest expense, net |
— | 104,069 | 917 | 4,985 | — | 109,971 | ||||||||||||||||||
| Intercompany interest expense (income), net |
1 | (88,245 | ) | 76,510 | 11,782 | (48 | ) | — | ||||||||||||||||
| Other expense (income) |
4 | (20,515 | ) | 21,376 | 23,125 | (11 | ) | 23,979 | ||||||||||||||||
| Equity in loss (earnings) of subsidiaries |
(37,661 | ) | (53,200 | ) | (75,950 | ) | — | 166,811 | — | |||||||||||||||
|
|
|
|
|
|
|
|
|
|
|
|
|
|||||||||||||
| Income (loss) before income taxes |
30,282 | 53,618 | 112,969 | 17,998 | (167,025 | ) | 47,842 | |||||||||||||||||
| Provision for (benefit from) income taxes |
— | (808 | ) | 22,159 | (3,739 | ) | (52 | ) | 17,560 | |||||||||||||||
|
|
|
|
|
|
|
|
|
|
|
|
|
|||||||||||||
| Net income (loss) |
$ | 30,282 | $ | 54,426 | $ | 90,810 | $ | 21,737 | $ | (166,973 | ) | $ | 30,282 | |||||||||||
|
|
|
|
|
|
|
|
|
|
|
|
|
|||||||||||||
| Comprehensive income (loss) |
$ | 1,667 | $ | 25,811 | $ | 59,111 | $ | 24,821 | $ | (109,743 | ) | $ | 1,667 | |||||||||||
|
|
|
|
|
|
|
|
|
|
|
|
|
|||||||||||||
SUPPLEMENTAL CONDENSED CONSOLIDATING STATEMENT OF COMPREHENSIVE INCOME (LOSS)
(In thousands)
| Year Ended December 31, 2011 | ||||||||||||||||||||||||
| Parent Guarantor |
Issuers | Guarantor Subsidiaries |
Non- Guarantor Subsidiaries |
Eliminations | Consolidated | |||||||||||||||||||
| Net sales |
$ | — | $ | — | $ | 5,670,403 | $ | 1,791,243 | $ | (1,268,788 | ) | $ | 6,192,858 | |||||||||||
| Cost of sales |
— | — | 5,353,573 | 1,712,009 | (1,268,305 | ) | 5,797,277 | |||||||||||||||||
|
|
|
|
|
|
|
|
|
|
|
|
|
|||||||||||||
| Gross profit |
— | — | 316,830 | 79,234 | (483 | ) | 395,581 | |||||||||||||||||
| Selling, general and administrative expenses |
22,331 | 4,249 | 255,805 | 26,259 | — | 308,644 | ||||||||||||||||||
| Equity in earnings of unconsolidated affiliates |
— | — | 23,874 | — | — | 23,874 | ||||||||||||||||||
|
|
|
|
|
|
|
|
|
|
|
|
|
|||||||||||||
| Operating income (loss) |
(22,331 | ) | (4,249 | ) | 84,899 | 52,975 | (483 | ) | 110,811 | |||||||||||||||
| Interest expense, net |
671 | 99,002 | 5,279 | 6,464 | — | 111,416 | ||||||||||||||||||
| Intercompany interest expense (income), net |
— | (59,041 | ) | 48,250 | 10,542 | 249 | — | |||||||||||||||||
| Loss on extinguishment of long-term debt |
— | 55,666 | — | — | — | 55,666 | ||||||||||||||||||
| Other expense (income) |
— | (33,301 | ) | 1,634 | 11,605 | (32 | ) | (20,094 | ) | |||||||||||||||
| Equity in loss (earnings) of subsidiaries |
52,903 | (37,571 | ) | 16,085 | — | (31,417 | ) | — | ||||||||||||||||
|
|
|
|
|
|
|
|
|
|
|
|
|
|||||||||||||
| Income (loss) before income taxes |
(75,905 | ) | (29,004 | ) | 13,651 | 24,364 | 30,717 | (36,177 | ) | |||||||||||||||
| Provision for (benefit from) income taxes |
— | 3,208 | 29,034 | 7,770 | (284 | ) | 39,728 | |||||||||||||||||
|
|
|
|
|
|
|
|
|
|
|
|
|
|||||||||||||
| Net income (loss) |
$ | (75,905 | ) | $ | (32,212 | ) | $ | (15,383 | ) | $ | 16,594 | $ | 31,001 | $ | (75,905 | ) | ||||||||
|
|
|
|
|
|
|
|
|
|
|
|
|
|||||||||||||
| Comprehensive income (loss) |
$ | (106,806 | ) | $ | (63,113 | ) | $ | (44,276 | ) | $ | 14,586 | $ | 92,803 | $ | (106,806 | ) | ||||||||
|
|
|
|
|
|
|
|
|
|
|
|
|
|||||||||||||
F-49
Table of Contents
SUPPLEMENTAL CONDENSED CONSOLIDATING STATEMENT OF CASH FLOWS
(In thousands)
| Year Ended December 31, 2013 | ||||||||||||||||||||||||
| Parent Guarantor |
Issuers | Guarantor Subsidiaries |
Non- Guarantor Subsidiaries |
Eliminations | Consolidated | |||||||||||||||||||
| Cash flows from operating activities |
||||||||||||||||||||||||
| Cash provided by (used in) operating activities |
$ | (78 | ) | $ | 27,101 | $ | 34,470 | $ | 149,842 | $ | — | $ | 211,335 | |||||||||||
| Cash flows from investing activities |
||||||||||||||||||||||||
| Capital expenditures |
— | — | (61,573 | ) | (11,971 | ) | — | (73,544 | ) | |||||||||||||||
| Proceeds from capital expenditures subsidy |
— | — | 18,769 | — | — | 18,769 | ||||||||||||||||||
| Proceeds from the sale of businesses and assets |
— | — | 15,221 | — | — | 15,221 | ||||||||||||||||||
| Advance payment refunded |
— | — | — | (2,711 | ) | — | (2,711 | ) | ||||||||||||||||
| Distributions from unconsolidated affiliates |
— | — | 1,055 | — | — | 1,055 | ||||||||||||||||||
| Intercompany investing activities |
— | (4,000 | ) | (43,012 | ) | — | 47,012 | — | ||||||||||||||||
| Decrease in restricted cash |
— | — | — | 7,852 | — | 7,852 | ||||||||||||||||||
|
|
|
|
|
|
|
|
|
|
|
|
|
|||||||||||||
| Cash provided by (used in) investing activities |
— | (4,000 | ) | (69,540 | ) | (6,830 | ) | 47,012 | (33,358 | ) | ||||||||||||||
|
|
|
|
|
|
|
|
|
|
|
|
|
|||||||||||||
| Cash flows from financing activities |
||||||||||||||||||||||||
| Deferred financing fees |
— | (47,488 | ) | (767 | ) | — | — | (48,255 | ) | |||||||||||||||
| Intercompany short-term borrowings, net |
77 | 37,793 | 5,991 | (849 | ) | (43,012 | ) | — | ||||||||||||||||
| Short-term borrowings, net |
— | (7,727 | ) | (267 | ) | (34,883 | ) | — | (42,877 | ) | ||||||||||||||
| Proceeds from issuance of intercompany long-term debt |
— | — | — | 4,000 | (4,000 | ) | — | |||||||||||||||||
| Repayments of Term Loans |
— | (1,239,000 | ) | — | — | — | (1,239,000 | ) | ||||||||||||||||
| Proceeds from issuance of Senior Notes |
— | 1,325,000 | — | — | — | 1,325,000 | ||||||||||||||||||
| Proceeds from issuance of Accounts Receivable Securitization Facility |
— | — | — | 376,630 | — | 376,630 | ||||||||||||||||||
| Repayments of Accounts Receivable Securitization Facility |
— | — | — | (471,696 | ) | — | (471,696 | ) | ||||||||||||||||
| Proceeds from the draw of revolving debt |
— | 405,000 | — | — | — | 405,000 | ||||||||||||||||||
| Repayments on the revolving debt |
— | (525,000 | ) | — | — | — | (525,000 | ) | ||||||||||||||||
|
|
|
|
|
|
|
|
|
|
|
|
|
|||||||||||||
| Cash provided by (used in) financing activities |
77 | (51,422 | ) | 4,957 | (126,798 | ) | (47,012 | ) | (220,198 | ) | ||||||||||||||
| Effect of exchange rates on cash |
— | (136 | ) | 2,795 | (292 | ) | — | 2,367 | ||||||||||||||||
|
|
|
|
|
|
|
|
|
|
|
|
|
|||||||||||||
| Net change in cash and cash equivalents |
(1 | ) | (28,457 | ) | (27,318 | ) | 15,922 | — | (39,854 | ) | ||||||||||||||
| Cash and cash equivalents—beginning of period |
3 | 29,411 | 182,088 | 24,855 | — | 236,357 | ||||||||||||||||||
|
|
|
|
|
|
|
|
|
|
|
|
|
|||||||||||||
| Cash and cash equivalents—end of period |
$ | 2 | $ | 954 | $ | 154,770 | $ | 40,777 | $ | — | $ | 196,503 | ||||||||||||
|
|
|
|
|
|
|
|
|
|
|
|
|
|||||||||||||
F-50
Table of Contents
SUPPLEMENTAL CONDENSED CONSOLIDATING STATEMENT OF CASH FLOWS
(In thousands)
| Year Ended December 31, 2012 | ||||||||||||||||||||||||
| Parent Guarantor |
Issuers | Guarantor Subsidiaries |
Non- Guarantor Subsidiaries |
Eliminations | Consolidated | |||||||||||||||||||
| Cash flows from operating activities |
||||||||||||||||||||||||
| Cash provided by (used in) operating activities |
$ | (48 | ) | $ | 7,865 | $ | 113,446 | $ | 64,852 | $ | — | $ | 186,115 | |||||||||||
| Cash flows from investing activities |
||||||||||||||||||||||||
| Capital expenditures |
— | — | (110,746 | ) | (7,758 | ) | — | (118,504 | ) | |||||||||||||||
| Proceeds from capital expenditures subsidy |
— | — | 6,079 | — | — | 6,079 | ||||||||||||||||||
| Proceeds from the sale of property, plant and equipment |
— | — | 206 | 47 | — | 253 | ||||||||||||||||||
| Advance payment received |
— | — | — | 2,602 | — | 2,602 | ||||||||||||||||||
| Investments in subsidiaries |
(162,155 | ) | — | (22,155 | ) | — | 184,310 | — | ||||||||||||||||
| Intercompany investing activities |
— | 144,463 | 68,268 | — | (212,731 | ) | — | |||||||||||||||||
| Increase in restricted cash |
— | — | — | (7,725 | ) | — | (7,725 | ) | ||||||||||||||||
|
|
|
|
|
|
|
|
|
|
|
|
|
|||||||||||||
| Cash provided by (used in) investing activities |
(162,155 | ) | 144,463 | (58,348 | ) | (12,834 | ) | (28,421 | ) | (117,295 | ) | |||||||||||||
|
|
|
|
|
|
|
|
|
|
|
|
|
|||||||||||||
| Cash flows from financing activities |
||||||||||||||||||||||||
| Deferred financing fees |
— | (7,392 | ) | (688 | ) | — | — | (8,080 | ) | |||||||||||||||
| Intercompany short-term borrowings, net |
51 | (49,818 | ) | 1,444 | (18,625 | ) | 66,948 | — | ||||||||||||||||
| Short-term borrowings, net |
— | (4,159 | ) | (407 | ) | (33,321 | ) | — | (37,887 | ) | ||||||||||||||
| Contributions from parent companies |
— | 22,155 | 162,155 | — | (184,310 | ) | — | |||||||||||||||||
| Capital contributions from shareholder |
162,155 | — | — | — | — | 162,155 | ||||||||||||||||||
| Repayments of intercompany indebtedness |
— | — | (144,183 | ) | (1,600 | ) | 145,783 | — | ||||||||||||||||
| Repayments of Term Loans |
— | (147,000 | ) | — | — | — | (147,000 | ) | ||||||||||||||||
| Proceeds from issuance of Accounts Receivable Securitization Facility |
— | — | — | 113,828 | — | 113,828 | ||||||||||||||||||
| Repayments of Accounts Receivable Securitization Facility |
— | — | — | (130,233 | ) | — | (130,233 | ) | ||||||||||||||||
| Proceeds from the draw of revolving debt |
— | 1,105,000 | — | — | — | 1,105,000 | ||||||||||||||||||
| Repayments on the revolving debt |
— | (1,135,000 | ) | — | — | — | (1,135,000 | ) | ||||||||||||||||
|
|
|
|
|
|
|
|
|
|
|
|
|
|||||||||||||
| Cash provided by (used in) financing activities |
162,206 | (216,214 | ) | 18,321 | (69,951 | ) | 28,421 | (77,217 | ) | |||||||||||||||
| Effect of exchange rates on cash |
— | 16 | 246 | (821 | ) | — | (559 | ) | ||||||||||||||||
|
|
|
|
|
|
|
|
|
|
|
|
|
|||||||||||||
| Net change in cash and cash equivalents |
3 | (63,870 | ) | 73,665 | (18,754 | ) | — | (8,956 | ) | |||||||||||||||
| Cash and cash equivalents—beginning of period |
— | 93,281 | 108,423 | 43,609 | — | 245,313 | ||||||||||||||||||
|
|
|
|
|
|
|
|
|
|
|
|
|
|||||||||||||
| Cash and cash equivalents—end of period |
$ | 3 | $ | 29,411 | $ | 182,088 | $ | 24,855 | $ | — | $ | 236,357 | ||||||||||||
|
|
|
|
|
|
|
|
|
|
|
|
|
|||||||||||||
F-51
Table of Contents
SUPPLEMENTAL CONDENSED CONSOLIDATING STATEMENT OF CASH FLOWS
(In thousands)
| Year Ended December 31, 2011 | ||||||||||||||||||||||||
| Parent Guarantor |
Issuers | Guarantor Subsidiaries |
Non- Guarantor Subsidiaries |
Eliminations | Consolidated | |||||||||||||||||||
| Cash flows from operating activities |
||||||||||||||||||||||||
| Cash provided by (used in) operating activities |
$ | (4,523 | ) | $ | (81,586 | ) | $ | 277,361 | $ | (40,166 | ) | $ | — | $ | 151,086 | |||||||||
| Cash flows from investing activities |
||||||||||||||||||||||||
| Capital expenditures |
— | — | (90,548 | ) | (9,263 | ) | — | (99,811 | ) | |||||||||||||||
| Distributions from unconsolidated affiliates |
— | — | 7,196 | — | — | 7,196 | ||||||||||||||||||
| Interest rate caps |
— | (262 | ) | — | — | — | (262 | ) | ||||||||||||||||
| Distributions from subsidiaries |
550,990 | — | — | — | (550,990 | ) | — | |||||||||||||||||
| Increase in restricted cash |
— | — | — | (6,250 | ) | — | (6,250 | ) | ||||||||||||||||
| Investments in subsidiaries |
— | (49,000 | ) | (6,155 | ) | — | 55,155 | — | ||||||||||||||||
| Intercompany investing activities |
— | (550,990 | ) | 28,859 | — | 522,131 | — | |||||||||||||||||
|
|
|
|
|
|
|
|
|
|
|
|
|
|||||||||||||
| Cash provided by (used in) investing activities |
550,990 | (600,252 | ) | (60,648 | ) | (15,513 | ) | 26,296 | (99,127 | ) | ||||||||||||||
|
|
|
|
|
|
|
|
|
|
|
|
|
|||||||||||||
| Cash flows from financing activities |
||||||||||||||||||||||||
| Deferred financing fees |
— | (18,704 | ) | (1,600 | ) | — | — | (20,304 | ) | |||||||||||||||
| Short-term borrowings, net |
— | — | — | 737 | — | 737 | ||||||||||||||||||
| Intercompany short-term borrowings, net |
— | 212,728 | (234,847 | ) | (6,740 | ) | 28,859 | — | ||||||||||||||||
| Proceeds from issuance of intercompany indebtedness |
— | — | 550,990 | — | (550,990 | ) | — | |||||||||||||||||
| Distribution to shareholder |
(471,467 | ) | (50,000 | ) | — | — | — | (521,467 | ) | |||||||||||||||
| Distribution to parent |
— | — | (550,990 | ) | — | 550,990 | — | |||||||||||||||||
| Contributions from parent companies |
— | — | 49,000 | 6,155 | (55,155 | ) | — | |||||||||||||||||
| Net proceeds from issuance of Term Loans |
— | 1,400,000 | (310 | ) | — | — | 1,399,690 | |||||||||||||||||
| Repayments of Term Loans |
— | (794,000 | ) | — | — | — | (794,000 | ) | ||||||||||||||||
| Principal payments on Seller Note |
(75,000 | ) | — | — | — | — | (75,000 | ) | ||||||||||||||||
| Proceeds from issuance of Accounts Receivable Securitization Facility |
— | — | — | 66,784 | — | 66,784 | ||||||||||||||||||
| Repayments of Accounts Receivable Securitization Facility |
— | — | — | (31,574 | ) | — | (31,574 | ) | ||||||||||||||||
| Proceeds from the draw of revolving debt |
— | 1,125,000 | — | — | — | 1,125,000 | ||||||||||||||||||
| Repayments on the revolving debt |
— | (1,105,000 | ) | — | — | — | (1,105,000 | ) | ||||||||||||||||
|
|
|
|
|
|
|
|
|
|
|
|
|
|||||||||||||
| Cash provided by (used in) financing activities |
(546,467 | ) | 770,024 | (187,757 | ) | 35,362 | (26,296 | ) | 44,866 | |||||||||||||||
| Effect of exchange rates on cash |
— | — | 492 | (142 | ) | — | 350 | |||||||||||||||||
|
|
|
|
|
|
|
|
|
|
|
|
|
|||||||||||||
| Net change in cash and cash equivalents |
— | 88,186 | 29,448 | (20,459 | ) | — | 97,175 | |||||||||||||||||
| Cash and cash equivalents—beginning of period |
— | 5,095 | 78,975 | 64,068 | — | 148,138 | ||||||||||||||||||
|
|
|
|
|
|
|
|
|
|
|
|
|
|||||||||||||
| Cash and cash equivalents—end of period |
$ | — | $ | 93,281 | $ | 108,423 | $ | 43,609 | $ | — | $ | 245,313 | ||||||||||||
|
|
|
|
|
|
|
|
|
|
|
|
|
|||||||||||||
F-52
Table of Contents
TRINSEO S.A.
SCHEDULE II—FINANCIAL STATEMENT SCHEDULE
VALUATION AND QUALIFYING ACCOUNTS
(In Millions)
| Additions | ||||||||||||||||||||
| Balance at Beginning of the Period |
Charged to Cost and Expense |
Currency Translation Adjustments |
Deduction from Reserves |
Balance at End of the Period |
||||||||||||||||
| Allowance for doubtful accounts: |
||||||||||||||||||||
| Year ended December 31, 2013 |
$ | 8.4 | $ | (3.0 | ) | $ | 0.6 | $ | (0.1 | )(a) | $ | 5.9 | ||||||||
| Year ended December 31, 2012 |
8.7 | 0.3 | (0.3 | ) | $ | (0.3 | )(a) | 8.4 | ||||||||||||
| Year ended December 31, 2011 |
4.3 | 4.6 | (0.2 | ) | — | (a) | 8.7 | |||||||||||||
| Tax valuation allowances: |
||||||||||||||||||||
| Year ended December 31, 2013 |
$ | 41.3 | $ | 10.7 | $ | (1.6 | ) | $ | — | $ | 50.4 | |||||||||
| Year ended December 31, 2012 |
47.4 | (5.5 | ) | (0.6 | ) | — | 41.3 | |||||||||||||
| Year ended December 31, 2011 |
19.6 | 27.6 | 0.2 | — | 47.4 | |||||||||||||||
| (a) | Amounts written off, net of recoveries. |
F-53
Table of Contents
To the Board of Directors and Members of
Americas Styrenics LLC
The Woodlands, Texas
We have audited the accompanying consolidated financial statements of Americas Styrenics LLC and its subsidiaries (the “Company”), which comprise the consolidated balance sheets as of December 31, 2013 and 2012, and the related consolidated statements of comprehensive income (loss), members’ equity, and cash flows for each of the three years in the period ended December 31, 2013, and the related notes to the consolidated financial statements.
Management’s Responsibility for the Consolidated Financial Statements
Management is responsible for the preparation and fair presentation of these consolidated financial statements in accordance with accounting principles generally accepted in the United States of America; this includes the design, implementation, and maintenance of internal control relevant to the preparation and fair presentation of consolidated financial statements that are free from material misstatement, whether due to fraud or error.
Auditors’ Responsibility
Our responsibility is to express an opinion on these consolidated financial statements based on our audits. We conducted our audits in accordance with auditing standards generally accepted in the United States of America and in accordance with the auditing standards of the Public Company Accounting Oversight Board (United States). Those standards require that we plan and perform the audit to obtain reasonable assurance about whether the consolidated financial statements are free from material misstatement.
An audit involves performing procedures to obtain audit evidence about the amounts and disclosures in the consolidated financial statements. The procedures selected depend on the auditor’s judgment, including the assessment of the risks of material misstatement of the consolidated financial statements, whether due to fraud or error. In making those risk assessments, the auditor considers internal control relevant to the Company’s preparation and fair presentation of the consolidated financial statements in order to design audit procedures that are appropriate in the circumstances, but not for the purpose of expressing an opinion on the effectiveness of the Company’s internal control. Accordingly, we express no such opinion. An audit also includes evaluating the appropriateness of accounting policies used and the reasonableness of significant accounting estimates made by management, as well as evaluating the overall presentation of the consolidated financial statements.
We believe that the audit evidence we have obtained is sufficient and appropriate to provide a basis for our audit opinion.
Opinion
In our opinion, the consolidated financial statements referred to above present fairly, in all material respects, the financial position of Americas Styrenics LLC and its subsidiaries as of December 31, 2013 and 2012, and the results of their operations and their cash flows for each of the three years in the period ended December 31, 2013 in accordance with accounting principles generally accepted in the United States of America.
/s/ DELOITTE & TOUCHE LLP
Houston, Texas
February 28, 2014
F-54
Table of Contents
AMERICAS STYRENICS LLC
AS OF DECEMBER 31, 2013 AND 2012
(In millions of dollars)
| 2013 | 2012 | |||||||
| ASSETS |
||||||||
| CURRENT ASSETS: |
||||||||
| Cash and cash equivalents |
$ | 66.2 | $ | 71.4 | ||||
| Trade receivables (net of allowance of $1.6 in 2013 and $2.1 in 2012) |
197.7 | 160.6 | ||||||
| Related company receivables |
22.4 | 18.8 | ||||||
| Inventories |
125.6 | 137.4 | ||||||
| Other current assets |
13.0 | 16.7 | ||||||
| Deferred income taxes |
1.4 | 0.1 | ||||||
|
|
|
|
|
|||||
| Total current assets |
426.3 | 405.0 | ||||||
|
|
|
|
|
|||||
| NET PROPERTY, PLANT AND EQUIPMENT |
282.3 | 300.0 | ||||||
|
|
|
|
|
|||||
| OTHER ASSETS: |
||||||||
| Deferred income taxes |
3.1 | 4.3 | ||||||
| Other assets |
12.6 | 10.4 | ||||||
|
|
|
|
|
|||||
| Total other assets |
15.7 | 14.7 | ||||||
|
|
|
|
|
|||||
| TOTAL |
$ | 724.3 | $ | 719.7 | ||||
|
|
|
|
|
|||||
| LIABILITIES AND MEMBERS’ EQUITY |
||||||||
| CURRENT LIABILITIES: |
||||||||
| Trade payables |
$ | 67.1 | $ | 71.4 | ||||
| Related company payables |
102.2 | 93.8 | ||||||
| Other payables |
23.1 | 16.4 | ||||||
| Income taxes payable |
1.0 | 1.2 | ||||||
| Accrued liabilities |
16.7 | 16.2 | ||||||
|
|
|
|
|
|||||
| Total current liabilities |
210.1 | 199.0 | ||||||
| POSTRETIREMENT BENEFIT LIABILITY |
14.2 | 14.8 | ||||||
| OTHER LONG-TERM LIABILITIES |
1.8 | 1.3 | ||||||
|
|
|
|
|
|||||
| Total liabilities |
226.1 | 215.1 | ||||||
|
|
|
|
|
|||||
| COMMITMENTS AND CONTINGENCIES (Note 6) |
||||||||
| MEMBERS’ EQUITY: |
||||||||
| Paid-in capital |
547.0 | 592.0 | ||||||
| Accumulated deficit |
(43.3 | ) | (79.8 | ) | ||||
| Accumulated other comprehensive loss |
(5.5 | ) | (7.6 | ) | ||||
|
|
|
|
|
|||||
| Total members’ equity |
498.2 | 504.6 | ||||||
|
|
|
|
|
|||||
| TOTAL |
$ | 724.3 | $ | 719.7 | ||||
|
|
|
|
|
|||||
See notes to consolidated financial statements.
F-55
Table of Contents
AMERICAS STYRENICS LLC
CONSOLIDATED STATEMENTS OF COMPREHENSIVE INCOME (LOSS)
FOR THE YEARS ENDED DECEMBER 31, 2013, 2012 AND 2011
(In millions of dollars)
| 2013 | 2012 | 2011 | ||||||||||
| Net sales |
$ | 2,103.1 | $ | 1,845.8 | $ | 1,736.9 | ||||||
| Cost of sales |
2,021.5 | 1,789.9 | 1,706.3 | |||||||||
|
|
|
|
|
|
|
|||||||
| Gross margin |
81.6 | 55.9 | 30.6 | |||||||||
|
|
|
|
|
|
|
|||||||
| Technical service and development |
2.6 | 2.6 | 2.3 | |||||||||
| Selling and marketing |
6.7 | 6.2 | 4.9 | |||||||||
| Administrative |
14.5 | 12.4 | 11.9 | |||||||||
| Foreign exchange (gain) loss |
2.9 | (2.9 | ) | 0.6 | ||||||||
| Other expense—net |
14.6 | 11.3 | 14.6 | |||||||||
|
|
|
|
|
|
|
|||||||
| Operating income (loss) |
40.3 | 26.3 | (3.7 | ) | ||||||||
| Interest income |
— | 0.1 | 0.1 | |||||||||
| Income tax expense |
(3.8 | ) | (7.9 | ) | (3.9 | ) | ||||||
|
|
|
|
|
|
|
|||||||
| Net income (loss) |
36.5 | 18.5 | (7.5 | ) | ||||||||
| Other comprehensive income (loss)—defined benefit plans |
2.1 | (0.9 | ) | (1.0 | ) | |||||||
|
|
|
|
|
|
|
|||||||
| Total comprehensive income (loss) |
$ | 38.6 | $ | 17.6 | $ | (8.5 | ) | |||||
|
|
|
|
|
|
|
|||||||
See notes to consolidated financial statements.
F-56
Table of Contents
AMERICAS STYRENICS LLC
CONSOLIDATED STATEMENTS OF MEMBERS’ EQUITY
FOR THE YEARS ENDED DECEMBER 31, 2013, 2012 AND 2011
(In millions of dollars)
| Paid-In Capital |
Accumulated Deficit |
Accumulated Other Comprehensive (Loss) |
Total | |||||||||||||
| BALANCE—January 1, 2011 |
$ | 658.5 | $ | (90.8 | ) | $ | (5.7 | ) | $ | 562.0 | ||||||
| Dissolution of Brazil partnership |
(6.5 | ) | — | — | (6.5 | ) | ||||||||||
| Distribution to Members |
(20.0 | ) | — | — | (20.0 | ) | ||||||||||
| Other |
(0.8 | ) | — | — | (0.8 | ) | ||||||||||
| Defined benefit plans—other comprehensive loss |
— | — | (1.0 | ) | (1.0 | ) | ||||||||||
| Net loss |
— | (7.5 | ) | — | (7.5 | ) | ||||||||||
|
|
|
|
|
|
|
|
|
|||||||||
| BALANCE—December 31, 2011 |
631.2 | (98.3 | ) | (6.7 | ) | 526.2 | ||||||||||
| Distribution to Members |
(40.0 | ) | — | — | (40.0 | ) | ||||||||||
| Other |
0.8 | — | — | 0.8 | ||||||||||||
| Defined benefit plans—other comprehensive loss |
— | — | (0.9 | ) | (0.9 | ) | ||||||||||
| Net income |
— | 18.5 | — | 18.5 | ||||||||||||
|
|
|
|
|
|
|
|
|
|||||||||
| BALANCE—December 31, 2012 |
592.0 | (79.8 | ) | (7.6 | ) | 504.6 | ||||||||||
| Distribution to Members |
(45.0 | ) | — | — | (45.0 | ) | ||||||||||
| Defined benefit plans—other comprehensive income |
— | — | 2.1 | 2.1 | ||||||||||||
| Net income |
— | 36.5 | — | 36.5 | ||||||||||||
|
|
|
|
|
|
|
|
|
|||||||||
| BALANCE—December 31, 2013 |
$ | 547.0 | $ | (43.3 | ) | $ | (5.5 | ) | $ | 498.2 | ||||||
|
|
|
|
|
|
|
|
|
|||||||||
See notes to consolidated financial statements.
F-57
Table of Contents
AMERICAS STYRENICS LLC
CONSOLIDATED STATEMENTS OF CASH FLOWS
FOR THE YEARS ENDED DECEMBER 31, 2013, 2012 AND 2011
(In millions of dollars)
| 2013 | 2012 | 2011 | ||||||||||
| OPERATING ACTIVITIES: |
||||||||||||
| Net income (loss) |
$ | 36.5 | $ | 18.5 | $ | (7.5 | ) | |||||
| Adjustments to reconcile net income (loss) to net cash provided by operating activities: |
||||||||||||
| Depreciation and amortization |
37.3 | 41.8 | 39.1 | |||||||||
| Net gain on disposal of assets |
(0.1 | ) | — | (0.1 | ) | |||||||
| Deferred income taxes |
(0.1 | ) | 0.9 | 0.4 | ||||||||
| Allowance for doubtful accounts |
(0.5 | ) | (1.2 | ) | 0.7 | |||||||
| Changes in assets and liabilities that provided (used) cash: |
||||||||||||
| Trade receivables |
(36.6 | ) | (16.0 | ) | (26.0 | ) | ||||||
| Related company receivables |
(3.6 | ) | 3.9 | 1.1 | ||||||||
| Inventories |
9.4 | (14.7 | ) | 1.8 | ||||||||
| Trade payables |
(4.3 | ) | 4.7 | (11.5 | ) | |||||||
| Related company payables |
8.4 | 21.2 | 11.3 | |||||||||
| Other assets and liabilities |
16.9 | 3.1 | (0.8 | ) | ||||||||
|
|
|
|
|
|
|
|||||||
| Net cash provided by operating activities |
63.3 | 62.2 | 8.5 | |||||||||
|
|
|
|
|
|
|
|||||||
| INVESTING ACTIVITIES: |
||||||||||||
| Capital expenditures |
(23.6 | ) | (17.6 | ) | (21.5 | ) | ||||||
| Disposal of assets |
0.1 | — | 0.1 | |||||||||
| Proceeds from Brazil Partnership liquidation |
— | — | 6.5 | |||||||||
|
|
|
|
|
|
|
|||||||
| Net cash used in investing activities |
(23.5 | ) | (17.6 | ) | (14.9 | ) | ||||||
|
|
|
|
|
|
|
|||||||
| FINANCING ACTIVITIES: |
||||||||||||
| Distribution to Members |
(45.0 | ) | (40.0 | ) | (20.0 | ) | ||||||
| Distribution of Brazil Partnership proceeds |
— | — | (6.5 | ) | ||||||||
|
|
|
|
|
|
|
|||||||
| Net cash used in financing activities |
(45.0 | ) | (40.0 | ) | (26.5 | ) | ||||||
|
|
|
|
|
|
|
|||||||
| INCREASE (DECREASE) IN CASH AND CASH EQUIVALENTS |
(5.2 | ) | 4.6 | (32.9 | ) | |||||||
| CASH AND CASH EQUIVALENTS—Beginning of year |
71.4 | 66.8 | 99.7 | |||||||||
|
|
|
|
|
|
|
|||||||
| CASH AND CASH EQUIVALENTS—End of year |
$ | 66.2 | $ | 71.4 | $ | 66.8 | ||||||
|
|
|
|
|
|
|
|||||||
| SUPPLEMENTAL CASH FLOW INFORMATION: |
||||||||||||
| Noncash investing activity—Capital expenditures payable |
$ | 4.7 | $ | 3.0 | $ | 2.1 | ||||||
|
|
|
|
|
|
|
|||||||
| Cash paid for income taxes |
$ | 4.5 | $ | 4.8 | $ | 3.8 | ||||||
|
|
|
|
|
|
|
|||||||
See notes to consolidated financial statements.
F-58
Table of Contents
AMERICAS STYRENICS LLC
NOTES TO CONSOLIDATED FINANCIAL STATEMENTS
AS OF DECEMBER 31, 2013 AND 2012 AND FOR THE YEARS ENDED DECEMBER 31,
2013, 2012 AND 2011
(Amounts in millions of dollars)
| 1. | FORMATION OF VENTURE |
Effective May 1, 2008, Chevron Phillips Chemical (“CPChem”) and The Dow Chemical Company (“Dow”) joined forces in styrenics by creating Americas Styrenics LLC (the “Company”). Effective July 1, 2009, Dow formed a separate plastics division, Styron Corp., which held its investment in the Company. Effective June 17, 2010, Dow divested its ownership in Styron Corp., making it an independent company, Styron LLC. CPChem, Dow (through June 17, 2010) and Styron LLC (subsequent to June 17, 2010) are referred to herein as the “Members.” The Members share equally in the profits and losses of the Company.
| 2. | NATURE OF OPERATIONS AND SIGNIFICANT ACCOUNTING POLICIES |
Principles of Consolidation—The consolidated financial statements include the accounts of the Company and its subsidiaries. All intercompany accounts and transactions have been eliminated in consolidation. The Company’s subsidiaries and partnership interests are as follows: Americas Styrenics Colombia Ltda, Americas Styrenics Argentina S.R.L. (liquidated in 2013), Americas Styrenics Chile Commercial Ltda, Americas Styrenics de Mexico, de R.L. de C.V., Americas Styrenics Canada Inc., and Americas Styrenics Industria e Comercio de Poliestireno Ltda (Brazil).
Nature of Operations—The Company was formed as a joint venture and focuses on styrenics (styrene and polystyrene) production, sales and distribution in North and South America.
Cash and Cash Equivalents—Included in cash and cash equivalents, from time to time, are short-term interest-bearing investments on deposit with financial institutions. There were nil and $55.0 of interest-bearing overnight investments at December 31, 2013 and 2012, respectively.
Trade Receivables—The Company’s United States customers are primarily in the packaging industry, but also consist of other chemical and plastics manufacturers. The Company’s foreign customers reside primarily in Argentina, Chile, Colombia, Mexico and Brazil. The Company evaluates the creditworthiness of customers and in certain circumstances, may require letters of credit to support product sales. The Company maintains an allowance for doubtful accounts based on anticipated collection of its accounts receivable.
Inventories— Inventories at December 31, 2013 and 2012 were as follows:
| 2013 | 2012 | |||||||
| Finished goods |
$ | 43.8 | $ | 53.5 | ||||
| Work in process |
68.7 | 76.2 | ||||||
| Raw materials |
4.4 | 2.0 | ||||||
| Supplies |
8.7 | 5.7 | ||||||
|
|
|
|
|
|||||
| Total inventories |
$ | 125.6 | $ | 137.4 | ||||
|
|
|
|
|
|||||
Inventories are stated at the lower of cost or market. Finished products and work-in-process inventories include material, labor, and manufacturing overhead costs. The reserves reducing inventories from a first-in, first-out (FIFO) basis to a last-in, first-out (LIFO) basis amounted to $113.4 at December 31, 2013, and $122.9 at December 31, 2012. In 2012, the liquidation of certain of the Company’s LIFO inventory layers increased operating income by $5.8. Foreign inventories are accounted for on a FIFO basis.
F-59
Table of Contents
Property, Plant, and Equipment—Upon formation of the Company, property, plant, and equipment were recorded at the Members’ net book value. Current additions of property, plant, and equipment are recorded at cost. The Company provides for depreciation using the straight-line method at rates based on the estimated service lives of the various classes of assets (3–45 years). Expenditures for repairs and maintenance, including major maintenance commonly known as turnarounds, are expensed as incurred. Components of property, plant, and equipment at December 31, 2013 and 2012 are as follows:
| 2013 | 2012 | |||||||
| Land and waterway improvements |
$ | 8.9 | $ | 8.5 | ||||
| Buildings |
25.1 | 24.4 | ||||||
| Transportation and construction equipment |
47.7 | 47.9 | ||||||
| Machinery and other equipment |
848.9 | 829.3 | ||||||
| Utilities and supply lines/other property |
6.5 | 6.4 | ||||||
| Construction in progress |
10.8 | 14.7 | ||||||
|
|
|
|
|
|||||
| Total property, plant, and equipment |
947.9 | 931.2 | ||||||
| Less accumulated depreciation |
(665.6 | ) | (631.2 | ) | ||||
|
|
|
|
|
|||||
| Net property, plant, and equipment |
$ | 282.3 | $ | 300.0 | ||||
|
|
|
|
|
|||||
Income Taxes—The Company is treated as a flow-through partnership for U.S. federal income tax purposes and for most state income tax purposes. As such, the Company itself is not liable for U.S. federal income taxes. The Company files a U.S. partnership return which reflects each Member’s share of income or loss. The Members are responsible for reporting and paying any tax on their respective income tax returns. The Company is directly liable for certain state income and franchise taxes, foreign withholding, and foreign direct or indirect taxes.
The Company has foreign subsidiaries in Mexico, Chile, Colombia, Argentina (liquidated in 2013), and Canada. All foreign entities except the Canadian subsidiary have elected to be treated as disregarded foreign branches of the Company for U.S. purposes. As such, the income or loss of the respective disregarded entities will be included in the U.S. federal partnership return. The foreign subsidiaries are responsible for all applicable taxes on foreign operations, and these taxes have been provided for in the consolidated financial statements.
The Company has not recorded any liabilities for uncertain tax positions required under Financial Accounting Standards Board Accounting Standards Codification Topic 740, Income Taxes, which prescribes the accounting for uncertainty in income taxes recognized in an enterprise’s financial statements.
Impairment of Long-Lived Assets—The Company evaluates the carrying value of long-lived assets to be held and used, including intangible assets, when events or circumstances warrant such a review. The carrying value of a long-lived asset to be held and used is considered impaired when the anticipated, separately identifiable undiscounted cash flows from such an asset are less than the carrying value of the asset. In that event, a loss is recognized based on the amount by which the carrying value exceeds the fair value of the long-lived asset. Fair value is determined primarily using the anticipated cash flows discounted at a rate commensurate with the risk involved. The Company’s management concluded no impairment should be recorded in 2013, 2012, or 2011.
Asset Retirement Obligation—The Company assesses whether it has legal obligations associated with the retirement of tangible long-lived assets that result from the acquisition, construction, or development and (or) the normal operation of a long-lived asset, including any legal obligations that require disposal of a replaced part that is a component of a tangible long-lived asset. At December 31, 2013 and 2012, the Company had no significant asset retirement obligations.
Insurance—The Company maintains insurance for automobile risks, general liability including products, director and officers, workers compensation and property. This insurance is placed with highly rated insurance carriers. The limits and deductibles are consistent for a company of this size and structure.
F-60
Table of Contents
Foreign Currency—The functional currency for the Company’s foreign operations is the U.S. dollar, resulting in no currency translation adjustments. Foreign currency gains and losses are reflected in operations.
Use of Estimates—The preparation of the consolidated financial statements in conformity with accounting principles generally accepted in the United States of America requires management to make estimates and assumptions that affect the reported amounts of assets and liabilities and disclosure of contingent assets and liabilities at the date of the financial statements and the reported amounts of revenues and expenses during the reporting period. Actual results could differ from those estimates.
Revenue Recognition—The Company recognizes revenue when there is evidence of a sales agreement, the delivery of goods has occurred, the sales price is fixed or determinable, and the collectability of revenue is reasonably assured. Revenue includes the selling price of the product and all related delivery charges paid by the customer. Freight costs and any directly related associated costs of transporting finished product to customers are recorded as “cost of sales.” Revenue is reduced at the time of sale for estimated customer-related incentives (mostly volume-related incentives).
Subsequent Events—The Company has evaluated subsequent events through the date the financial statements were available to be issued of February 28, 2014.
| 3. | REVOLVING CREDIT FACILITY |
In August 2011, the Company entered into a $50.0 revolving credit facility with Comerica Bank that terminates in August 2015. At the Company’s option, the interest rate under this facility equals either the prime or the London InterBank Offered Rate based rate as defined in the credit agreement. The Company’s accounts receivable have been pledged as collateral for the credit facility.
There were no outstanding borrowings at December 31, 2013 or 2012.
| 4. | INCOME TAXES |
The components of the income (loss) before taxes for the years ended December 31, 2013, 2012 and 2011 are as follows:
| 2013 | 2012 | 2011 | ||||||||||
| Domestic |
$ | 35.5 | $ | 2.9 | $ | (13.7 | ) | |||||
| Foreign |
4.8 | 23.5 | 10.1 | |||||||||
|
|
|
|
|
|
|
|||||||
| Total income (loss) before taxes |
$ | 40.3 | $ | 26.4 | $ | (3.6 | ) | |||||
|
|
|
|
|
|
|
|||||||
The components of income tax expense for the years ended December 31, 2013, 2012 and 2011 are as follows:
| 2013 | 2012 | 2011 | ||||||||||
| State—current |
$ | 0.6 | $ | — | $ | 1.0 | ||||||
| Foreign—current |
3.7 | 5.2 | 3.4 | |||||||||
| Foreign—deferred |
(0.5 | ) | 2.2 | (0.5 | ) | |||||||
| Foreign—withholding |
— | 0.5 | — | |||||||||
|
|
|
|
|
|
|
|||||||
| Total income tax expense |
$ | 3.8 | $ | 7.9 | $ | 3.9 | ||||||
|
|
|
|
|
|
|
|||||||
F-61
Table of Contents
The components of deferred income tax assets and liabilities at December 31, 2013 and 2012, are as follows:
| 2013 | 2012 | |||||||
| Fixed assets |
$ | 3.1 | $ | 4.3 | ||||
| Other temporary differences |
1.4 | 0.1 | ||||||
|
|
|
|
|
|||||
| Deferred tax assets |
$ | 4.5 | $ | 4.4 | ||||
|
|
|
|
|
|||||
Undistributed earnings of foreign subsidiaries are not deemed to be permanently reinvested. Currently, undistributed earnings exist in the Canadian, Mexican, and Colombian subsidiaries. In 2012, the Company repatriated $6.5 in cash from its foreign subsidiaries. Future repatriation of earnings will not be subject to tax by the Company (but rather its Members); however, foreign withholding taxes may apply.
| 5. | EMPLOYEE BENEFIT PLANS |
The Company provides reimbursement of medical and dental costs to retired employees. The Company’s plan, the Retiree Reimbursement Account (RRA), was implemented on January 1, 2009, and is funded at the time of the employees’ retirement based on years of credited service which includes service rendered as employees of Dow or CPChem. Thereafter, the Company is not obligated to make additional contributions. The Company has the ability to change the benefits at any time. All employees are eligible, except for former Dow employees that choose to participate in The Dow Chemical Company Retiree Medical Care Program upon retirement. The Company uses a December 31 measurement date for the RRA.
At December 31, 2013 and 2012, the RRA had a benefit obligation in the amount of $14.6 and $15.2, respectively. The Company contributed and paid benefits in the amount of $0.3 in 2013 and $0.2 in each of the years 2012 and 2011.
At December 31, 2013 and 2012, amounts recognized in the consolidated balance sheets consist of:
| 2013 | 2012 | |||||||
| Current liabilities |
$ | (0.4 | ) | $ | (0.4 | ) | ||
| Noncurrent liabilities |
(14.2 | ) | (14.8 | ) | ||||
|
|
|
|
|
|||||
| Total |
$ | (14.6 | ) | $ | (15.2 | ) | ||
|
|
|
|
|
|||||
At December 31, 2013 and 2012, amounts recognized in accumulated other comprehensive loss were as follows:
| 2013 | 2012 | |||||||
| Net actuarial loss |
$ | 0.8 | $ | 2.2 | ||||
| Prior service cost |
4.7 | 5.4 | ||||||
|
|
|
|
|
|||||
| Total |
$ | 5.5 | $ | 7.6 | ||||
|
|
|
|
|
|||||
In 2014, $0.7 of estimated prior service cost will be amortized from accumulated other comprehensive loss into net periodic benefit cost.
F-62
Table of Contents
Net periodic benefit cost and components of other amounts recognized in other comprehensive (income) loss were as follows:
| 2013 | 2012 | 2011 | ||||||||||
| Net periodic postretirement benefit cost |
$ | 1.8 | $ | 1.7 | $ | 1.7 | ||||||
|
|
|
|
|
|
|
|||||||
| Other changes in benefit obligations recognized in other comprehensive loss: |
||||||||||||
| Net actuarial (gain) loss |
(1.3 | ) | 1.6 | 1.6 | ||||||||
| Recognized actuarial loss |
(0.1 | ) | — | — | ||||||||
| Recognized prior service cost |
(0.7 | ) | (0.7 | ) | (0.6 | ) | ||||||
|
|
|
|
|
|
|
|||||||
| Total recognized in other comprehensive (income) loss |
(2.1 | ) | 0.9 | 1.0 | ||||||||
|
|
|
|
|
|
|
|||||||
| Total recognized in net periodic benefit cost and other comprehensive (income) loss |
$ | (0.3 | ) | $ | 2.6 | $ | 2.7 | |||||
|
|
|
|
|
|
|
|||||||
Actuarial assumptions used to determine benefit obligations and net periodic benefit cost were as follows:
| 2013 | 2012 | 2011 | ||||||||||
| Discount rate used to determine net periodic benefit cost |
3.44 | % | 4.86 | % | 5.25 | % | ||||||
| Discount rate used to determine benefit obligation at December 31 |
4.27 | % | 3.44 | % | N/A | |||||||
| 2013 | 2012 | 2011 | ||||||||||
| Health Care Cost Assumptions |
||||||||||||
| Initial health care cost trend rate |
9.00 | % | 9.50 | % | 9.50 | % | ||||||
| Ultimate health care cost trend rate |
4.50 | % | 4.50 | % | 4.50 | % | ||||||
| Year ultimate reached |
2022 | 2022 | 2022 | |||||||||
Estimated health care cost trend rates can have a significant effect on the amounts reported for the RRA.
The Company expects to contribute approximately $0.4 to its RRA plan in 2014.
At December 31, 2013, the estimated future benefit payments, reflecting expected future service, as appropriate, are expected to be paid as follows:
| 2014 |
$ | 0.4 | ||
| 2015 |
0.5 | |||
| 2016 |
0.7 | |||
| 2017 |
0.9 | |||
| 2018 |
1.0 | |||
| 2019 through 2023 |
7.6 | |||
|
|
|
|||
| Total |
$ | 11.1 | ||
|
|
|
The Company also has a defined contribution employee savings plan and made discretionary contributions of $3.2, $3.0 and $2.9 in 2013, 2012 and 2011, respectively.
| 6. | COMMITMENTS AND CONTINGENCIES |
The Company and its subsidiaries maintain outside service agreements and lease buildings, ground and easements, rail cars, and other vehicles under noncancelable operating leases, which expire on varying dates between 2014 and 2018.
F-63
Table of Contents
Total future minimum annual rentals in effect at December 31, 2013, for noncancelable operating leases are as follows:
| Years Ending December 31 |
||||
| 2014 |
$ | 10.5 | ||
| 2015 |
4.0 | |||
| 2016 |
2.8 | |||
| 2017 |
1.9 | |||
| 2018 |
1.1 | |||
| 2019 through 2023 |
0.4 | |||
|
|
|
|||
| Total |
$ | 20.7 | ||
|
|
|
Expense for total rental and long-term commitments was $23.8, $22.1 and $21.3 for the years ended December 31, 2013, 2012 and 2011, respectively.
The Company has entered into long-term sales commitments and purchase agreements with several of its key suppliers, including its Members (See Note 7). The commitment contracts are for one- to three-year periods with some cost efficiency incentives. Because the pricing and supply fluctuates with the commodity market, a definitive dollar value cannot be determined.
In addition, the Company has purchase commitments of $54.9 mainly related to certain feedstock, utility and capital projects costs. The Company does not consider purchase orders to be firm commitments. If the Company chooses to cancel a purchase order, it may be obligated to reimburse the vendor for unrecoverable outlays incurred prior to cancellation under certain circumstances.
The Company is a party to various legal proceedings and claims incidental to the normal conduct of its business. Management believes that the ultimate disposition of these matters will not have a material adverse effect on the Company’s consolidated financial position or results of operations.
Pursuant to the contribution agreement, all preexisting environmental matters have been outlined for each site and any contingencies are the responsibility of Dow, per Section 4.10, and CPChem, per Section 5.10. All subsequent obligations will be the liability of the Company. No environmental reserve was recorded as of December 31, 2013, 2012, or 2011.
| 7. | RELATED-PARTY TRANSACTIONS |
The Company entered into various supply and purchase agreements with the Members and their affiliated companies. These agreements include sales and purchases of energy, raw materials and services. A summary of transactions for the years ended December 31, 2013, 2012, and 2011 is as follows:
| 2013 | 2012 | 2011 | ||||||||||
| Sales |
$ | 255.1 | $ | 251.8 | $ | 255.8 | ||||||
| Purchases |
980.6 | 948.8 | 859.0 | |||||||||
Balances receivable and payable to the Members are included in the December 31, 2013 and 2012 consolidated balance sheets as related company receivables and payables.
| 8. | INTEREST IN SILENT PARTNERSHIP |
Upon formation of the Company, a Complementary Special Partnership Agreement (the “Silent Partnership”) was signed between a subsidiary of Dow and Americas Styrenics Industria E Comercio de Polistireno for the purpose of producing, marketing, and selling polystyrene from a polystyrene facility in Brazil.
F-64
Table of Contents
On December 28, 2010, the Company, Styron LLC, and CPChem entered into a series of agreements, which resulted in the sale of the facility to an unrelated third party and an agreement to liquidate the Silent Partnership.
During 2011, the Silent Partnership progressed toward liquidation and the Company recognized a gain of $0.2 on settlement of certain liabilities included in other expense, net. The Company collected and then distributed liquidation proceeds of $6.5 to CPChem in 2011.
******
F-65
Table of Contents
| Exhibit No. |
Description | |
| 3.1 | Articles of Association of Trinseo Materials Operating S.C.A. (incorporated herein by reference to Exhibit 3.2 to the Registration Statement filed on Form S-4, File No. 333-191460, filed September 30, 2013) | |
| 3.2 | Certificate of Incorporation of Trinseo Materials Finance, Inc., as amended. (incorporated herein by reference to Exhibit 3.3 to the Registration Statement filed on Form S-4, File No. 333-191460, filed September 30, 2013) | |
| 3.3 | Bylaws of Trinseo Materials Finance, Inc. (incorporated herein by reference to Exhibit 3.4 to the Registration Statement filed on Form S-4, File No. 333-191460, filed September 30, 2013) | |
| 4.1 | Indenture, dated as of January 29, 2013, including Form of 8.750% Senior Secured Notes due 2019, by and among Trinseo Materials Operating S.C.A., Trinseo Materials Finance, Inc., the Guarantors named therein and Wilmington Trust, National Association, as trustee and collateral agent. (incorporated herein by reference to Exhibit 4.1 to the Registration Statement filed on Form S-4, File No. 333-191460, filed September 30, 2013) | |
| 4.2 | First Supplemental Indenture, dated as of March 12, 2013, by and among Trinseo Materials Operating S.C.A., Trinseo Materials Finance, Inc., the Guarantors named therein and Wilmington Trust, National Association, as trustee and collateral agent. (incorporated herein by reference to Exhibit 4.2 to the Registration Statement filed on Form S-4, File No. 333-191460, filed September 30, 2013) | |
| 4.3 | Second Supplemental Indenture, dated as of May 10, 2013, by and among Trinseo Materials Operating S.C.A., Trinseo Materials Finance, Inc., the Guarantors named therein and Wilmington Trust, National Association, as trustee and collateral agent. (incorporated herein by reference to Exhibit 4.3 to the Registration Statement filed on Form S-4, File No. 333-191460, filed September 30, 2013) | |
| 4.4 | Third Supplemental Indenture, dated as of September 16, 2013, by and among Trinseo Materials Operating S.C.A., Trinseo Materials Finance, Inc., the Guarantors named therein and Wilmington Trust, National Association, as trustee and collateral agent. (incorporated herein by reference to Exhibit 4.4 to the Registration Statement filed on Form S-4, File No. 333-191460, filed September 30, 2013) | |
| 4.5 | Intercreditor and Collateral Agency Agreement, dated as of January 29, 2013, by and among Trinseo Materials Operating S.C.A., the other Grantors party hereto, Deutsche Bank AG New York Branch, Wilmington Trust, National Association and each Additional Collateral Agent from time to time party hereto. (incorporated herein by reference to Exhibit 4.5 to the Registration Statement filed on Form S-4, File No. 333-191460, filed September 30, 2013) | |
| 4.6 | Registration Rights Agreement, dated as of January 29, 2013, by and among Trinseo Materials Operating S.C.A., Trinseo Materials Finance, Inc., the Guarantors party hereto and Deutsche Bank Securities Inc. (incorporated herein by reference to Exhibit 4.6 to the Registration Statement filed on Form S-4, File No. 333-191460, filed September 30, 2013) | |
| 4.7 | Joinder to Purchase Agreement, dated May 10, 2013, by and among Trinseo Materials Operating S.C.A., Trinseo Materials Finance, Inc., the Guarantors party hereto and Deutsche Bank Securities Inc. (incorporated herein by reference to Exhibit 4.7 to the Registration Statement filed on Form S-4, File No. 333-191460, filed September 30, 2013) | |
| 4.8 | Purchase Agreement, dated January 24, 2013, by and among Trinseo Materials Operating S.C.A., Trinseo Materials Finance, Inc., the Guarantors party hereto and Deutsche Bank Securities Inc. (incorporated herein by reference to Exhibit 4.8 to Amendment No. 1 to the Registration Statement filed on Form S-4, File No. 333-191460, filed December 6, 2013) | |
Table of Contents
| Exhibit No. |
Description | |
| 4.9 | Fourth Supplemental Indenture, dated as of December 3, 2013, by and among Trinseo Materials Operating S.C.A., Trinseo Materials Finance, Inc., the Guarantors named therein and Wilmington Trust, National Association, as trustee and collateral agent. (incorporated herein by reference to Exhibit 4.9 to Amendment No. 1 to the Registration Statement filed on Form S-4, File No. 333-191460, filed December 6, 2013) | |
| 10.1 | Credit Agreement, dated as of June 17, 2010, by and among Trinseo Materials Operating S.C.A., the Guarantors, the Lenders and Deutsche Bank AG New York Branch. (incorporated herein by reference to Exhibit 10.1 to the Registration Statement filed on Form S-4, File No. 333-191460, filed September 30, 2013) | |
| 10.2 | First Amendment to Credit Agreement, dated as of February 2, 2011, by and among Trinseo Materials Operating S.C.A., the Guarantors, the Lenders and Deutsche Bank AG New York Branch. (incorporated herein by reference to Exhibit 10.2 to the Registration Statement filed on Form S-4, File No. 333-191460, filed September 30, 2013) | |
| 10.3 | Second Amendment to Credit Agreement, dated as of July 28, 2011, by and among Trinseo Materials Operating S.C.A., the Guarantors, the Lenders and Deutsche Bank AG New York Branch. (incorporated herein by reference to Exhibit 10.3 to the Registration Statement filed on Form S-4, File No. 333-191460, filed September 30, 2013) | |
| 10.4 | Third Amendment to Credit Agreement, dated as of February 13, 2012, by and among Trinseo Materials Operating S.C.A., the Guarantors, the Lenders and Deutsche Bank AG New York Branch. (incorporated herein by reference to Exhibit 10.4 to the Registration Statement filed on Form S-4, File No. 333-191460, filed September 30, 2013) | |
| 10.5 | Fourth Amendment to Credit Agreement, dated as of August 9, 2012, by and among Trinseo Materials Operating S.C.A., the Guarantors, the Lenders and Deutsche Bank AG New York Branch. (incorporated herein by reference to Exhibit 10.5 to the Registration Statement filed on Form S-4, File No. 333-191460, filed September 30, 2013) | |
| 10.6 | Fifth Amendment to Credit Agreement, dated as of January 29, 2013, by and among Trinseo Materials Operating S.C.A., the Guarantors, the Lenders and Deutsche Bank AG New York Branch. (incorporated herein by reference to Exhibit 10.6 to the Registration Statement filed on Form S-4, File No. 333-191460, filed September 30, 2013) | |
| 10.7 | Amended and Restated Employment Agreement, among Styron US Holding, Inc., Bain Capital Everest Manager Holding SCA and Christopher D. Pappas, dated April 11, 2013. (incorporated herein by reference to Exhibit 10.7 to the Registration Statement filed on Form S-4, File No. 333-191460, filed September 30, 2013) | |
| 10.8 | Employment Agreement, among Bain Capital Everest US Holding, Inc., Bain Capital Everest Manager Holding SCA and Curtis S. Shaw, dated July 1, 2010, as amended by Amendment No. 1 dated August 18, 2010, and Amendment No. 2 dated February 14, 2012. (incorporated herein by reference to Exhibit 10.8 to the Registration Statement filed on Form S-4, File No. 333-191460, filed September 30, 2013) | |
| 10.9 | Employment Agreement, among Bain Capital Everest US Holding, Inc., Bain Capital Everest Manager Holding SCA and John A. Feenan, dated December 22, 2011. (incorporated herein by reference to Exhibit 10.9 to the Registration Statement filed on Form S-4, File No. 333-191460, filed September 30, 2013) | |
| 10.10 | Employment Offer Letter, by and between Bain Capital Everest US Holding, Inc. and Marco Levi, dated September 22, 2010. (incorporated herein by reference to Exhibit 10.10 to the Registration Statement filed on Form S-4, File No. 333-191460, filed September 30, 2013) | |
Table of Contents
| Exhibit No. |
Description | |
| 10.11 | Employment Offer Letter, by and between Bain Capital Everest US Holding, Inc. and Paul F. Moyer, dated September 22, 2010. (incorporated herein by reference to Exhibit 10.11 to the Registration Statement filed on Form S-4, File No. 333-191460, filed September 30, 2013) | |
| 10.12 | Form of Amended and Restated Executive Subscription and Securityholder’s Agreement, by and among Bain Capital Everest Manager Holding S.C.A., Bain Capital Everest Manager, the executive named therein and the other investors named therein. (incorporated herein by reference to Exhibit 10.12 to the Registration Statement filed on Form S-4, File No. 333-191460, filed September 30, 2013) | |
| 10.13 | Amended and Restated Executive Subscription and Securityholder’s Agreement, by and among Bain Capital Everest Manager Holding S.C.A., Bain Capital Everest Manager, Christopher D. Pappas and the other investors named therein, dated February 3, 2011. (incorporated herein by reference to Exhibit 10.13 to the Registration Statement filed on Form S-4, File No. 333-191460, filed September 30, 2013) | |
| 10.14 | Investor Subscription and Shareholder Agreement by and among Bain Capital Everest Managers Holding SCA and the various investors named therein, dated June 17, 2010. (incorporated herein by reference to Exhibit 10.14 to the Registration Statement filed on Form S-4, File No. 333-191460, filed September 30, 2013) | |
| 10.15 | Registration Rights Agreement, by and among Bain Capital Everest Managers Holding SCA and the investors named therein, dated June 17, 2010. (incorporated herein by reference to Exhibit 10.15 to the Registration Statement filed on Form S-4, File No. 333-191460, filed September 30, 2013) | |
| 10.16 | Advisory Agreement, by and between Bain Capital Partners, LLC, Portfolio Company Advisors Limited, Styron Holding BC and Bain Capital Everest US Holding Inc., dated June 17, 2010. (incorporated herein by reference to Exhibit 10.16 to the Registration Statement filed on Form S-4, File No. 333-191460, filed September 30, 2013) | |
| 10.17 | Transaction Services Agreement, by and between Bain Capital Everest US Holding Inc. and Bain Capital Partners, dated June 17, 2010. (incorporated herein by reference to Exhibit 10.17 to the Registration Statement filed on Form S-4, File No. 333-191460, filed September 30, 2013) | |
| 10.18 | Latex Joint Venture Option Agreement, among The Dow Chemical Company, Styron LLC and Styron Holding B.V., dated June 17, 2010, as amended by the Latex Joint Venture Option Agreement Amendment, dated August 9, 2011. (incorporated herein by reference to Exhibit 10.18 to the Registration Statement filed on Form S-4, File No. 333-191460, filed September 30, 2013) | |
| 10.19* | Second Amended and Restated Master Outsourcing Services Agreement, among The Dow Chemical Company and Styron LLC and Styron Holding B.V., dated June 1, 2013. (incorporated herein by reference to Exhibit 10.19 to Amendment No. 2 to the Registration Statement filed on Form S-4, File No. 333-191460, filed December 17, 2013) | |
| 10.20* | Contract of Sale, by and between Americas Styrenics LLC and The Dow Chemical Company, dated December 1, 2009, as amended by that certain Amendment to and Consent to Partial Assignment, dated April 1, 2010. (incorporated herein by reference to Exhibit 10.20 to Amendment No. 2 to the Registration Statement filed on Form S-4, File No. 333-191460, filed December 17, 2013) | |
| 10.21* | Styrene Baseload Sale and Purchase Agreement, between Dow Europe GmbH and Jubail Chevron Phillips Company, dated June 30, 2004. (incorporated herein by reference to Exhibit 10.21 to Amendment No. 2 to the Registration Statement filed on Form S-4, File No. 333-191460, filed December 17, 2013) | |
| 10.22* | Amended and Restated Ethylene Sales Contract (Europe), between Dow Europe GmbH and Styron Europe GmbH, dated June 17, 2010. (incorporated herein by reference to Exhibit 10.22 to Amendment No. 2 to the Registration Statement filed on Form S-4, File No. 333-191460, filed December 17, 2013) | |
Table of Contents
| Exhibit No. |
Description | |
| 10.23* | Amended and Restated Benzene Sales Contract (Europe), between Dow Europe GmbH and Styron Europe GmbH, dated June 17, 2010. (incorporated herein by reference to Exhibit 10.23 to Amendment No. 2 to the Registration Statement filed on Form S-4, File No. 333-191460, filed December 17, 2013) | |
| 10.24* | Amended and Restated Bisphenol A Sales Contract, between Dow Europe GmbH and Styron Europe GmbH, dated June 17, 2010. (incorporated herein by reference to Exhibit 10.24 to Amendment No. 2 the Registration Statement filed on Form S-4, File No. 333-191460, filed December 17, 2013) | |
| 10.25* | First Amendment to the Amended and Restated Bisphenol A Sales Contract between Dow Europe GmbH and Styron Europe GmbH, dated October 26, 2011. (incorporated herein by reference to Exhibit 10.25 to Amendment No. 2 to the Registration Statement filed on Form S-4, File No. 333-191460, filed December 17, 2013) | |
| 10.26* | Second Amendment to the Amended and Restated Bisphenol A Sales Contract between Dow Europe GmbH and Styron Europe GmbH, dated November 9, 2012. (incorporated herein by reference to Exhibit 10.26 to Amendment No. 2 to the Registration Statement filed on Form S-4, File No. 333-191460, filed December 17, 2013) | |
| 10.27* | Amended and Restated Butadiene Sales Contract (Europe), between Dow Europe GmbH and Styron Europe GmbH, dated June 17, 2010. (incorporated herein by reference to Exhibit 10.27 to Amendment No. 2 to the Registration Statement filed on Form S-4, File No. 333-191460, filed December 17, 2013) | |
| 10.28* | SSBR Toll Conversion and Capacity Rights Agreement, between JSR Corporation Tokyo, Wallisellen and Dow Europe GmbH, dated May 31, 2007. (incorporated herein by reference to Exhibit 10.28 to Amendment No. 2 to the Registration Statement filed on Form S-4, File No. 333-191460, filed December 17, 2013) | |
| 10.29* | Amended and Restated MOD5 Computerized Process Control Software Agreement, Licenses and Services, between Rofan Services Inc. and Styron LLC, dated as of June 17, 2010. (incorporated herein by reference to Exhibit 10.29 to the Registration Statement filed on Form S-4, File No. 333-191460, filed September 30, 2013) | |
| 10.30* | Amendment No. 1 to the Amended and Restated MOD5 Computerized Process Control Software Agreement, Licenses and Services, between Rofan Services Inc. and Styron LLC, dated as of June 1, 2013. (incorporated herein by reference to Exhibit 10.30 to Amendment No. 2 to the Registration Statement filed on Form S-4, File No. 333-191460, filed December 17, 2013) | |
| 10.31* | Amended and Restated Styron License Agreement, among The Dow Chemical Company, Dow Global Technologies Inc. and Styron LLC, dated as of June 17, 2010. (incorporated herein by reference to Exhibit 10.31 to Amendment No. 2 to the Registration Statement filed on Form S-4, File No. 333-191460, filed December 17, 2013) | |
| 10.32 | Deed of Amendment, Restatement and Accession, dated May 30, 2013, by and among Styron Europe GmbH, Styron Deutschland Anlagengesellschaft mbH, Styron Netherlands B.V., Styron LLC, Trinseo U.S. Receivables Company SPV LLC, Styron Receivables Funding Limited, Styron Finance Luxembourg s.à r.l., Luxembourg, Zweigniederlassung Horgen, Regency Assets Limited, HSBC Bank plc, Styron Holding S.à.r.l, as parent and guarantor, TMF Administration Services Limited, as corporate administrator and registrar and the Law Debenture Trust Corporation plc, as Styron security trustee. (incorporated herein by reference to Exhibit 10.32 to the Registration Statement filed on Form S-4, File No. 333-191460, filed September 30, 2013) | |
| 10.33* | Amendment Agreement No. 1 to the SSBR Conversion and Capacity Rights Agreement, dated December 3, 2012, by and between Styron Europe GmbH and JSR Corporation Tokyo Wallisellen Branch. (incorporated herein by reference to Exhibit 10.33 to Amendment No. 2 to the Registration Statement filed on Form S-4, File No. 333-191460, filed December 17, 2013) | |
Table of Contents
| Exhibit No. |
Description | |
| 10.34 | Sixth Amendment to Credit Agreement, dated as of December 3, 2013, among Trinseo Materials Operating S.C.A., Styron Italia S.R.L. and each Lender party. (incorporated herein by reference to Exhibit 10.34 to Amendment No. 1 to the Registration Statement filed on Form S-4, File No. 333-191460, filed December 6, 2013) | |
| 10.35† | Employment Agreements, dated March 1, 2013, among Styron US Holding, Inc., Bain Capital Everest Manager Holding S.C.A. and Martin Pugh | |
| 10.36 | First Amendment to the Employment Agreement, dated January 17, 2014, by and between Styron US Holding, Inc. and Martin Pugh. (incorporated herein by reference to Exhibit 10.35 to Amendment No. 6 to the Registration Statement filed on Form S-4, File No. 333-191460, filed January 17, 2014) | |
| 10.37 | First Amendment to the Employment Letter Agreement, dated as of January 17, 2014, by and between Styron US Holding, Inc. and Marco Levi. (incorporated herein by reference to Exhibit 10.36 to Amendment No. 6 to the Registration Statement filed on Form S-4, File No. 333-191460, filed January 17, 2014) | |
| 12.1† | Statement of Computation of Ratios of Earnings to Fixed Charges | |
| 21.1 | Subsidiaries of Trinseo Materials Operating S.C.A. and Trinseo Materials Finance, Inc. (incorporated herein by reference to Exhibit 21.1 to the Registration Statement filed on Form S-4, File No. 333-191460, filed September 30, 2013) | |
| 24.1† | Powers of Attorney (included as part of the signature pages) | |
| 31.1† | Certification of Chief Executive Officer Pursuant to 18 U.S.C. Section 1350, as adopted pursuant to Section 302 of the Sarbanes-Oxley Act of 2002 | |
| 31.2† | Certification of Chief Financial Officer Pursuant to 18 U.S.C. Section 1350, as adopted pursuant to Section 302 of the Sarbanes-Oxley Act of 2002 | |
| 32.1† | Certification of Chief Executive Officer Pursuant to 18 U.S.C. Section 1350, as adopted pursuant to Section 906 of the Sarbanes-Oxley Act of 2002 | |
| 32.2† | Certification of Chief Financial Officer Pursuant to 18 U.S.C. Section 1350, as adopted pursuant to Section 906 of the Sarbanes-Oxley Act of 2002 | |
| * | Application has been made to the Securities and Exchange Commission for confidential treatment of certain provisions of these exhibits. Omitted material for which confidential treatment has been requested has been filed separately with the Securities and Exchange Commission. |
| † | Filed herewith. |