Attached files
| file | filename |
|---|---|
| 8-K - 8-K - VANTAGESOUTH BANCSHARES, INC. | form8k-030414.htm |
NYSE: VSB NASDAQ: YDKN Q1 2014 Investor Presentation March 2014
Cautionary statement regarding forward-looking statements 2 This presentation contains forward-looking statements within the meaning of the Private Securities Litigation Reform Act of 1995. You can identify forward-looking statements by words such as “may,” “hope,” “will,” “should,” “expect,” “plan,” “anticipate,” “intend,” “believe,” “estimate,” “predict,” “potential,” “continue,” “could,” “future” or the negative of those terms or other words of similar meaning. You should read statements that contain these words carefully because they discuss our future expectations or state other “forward-looking” information. These forward-looking statements involve a number of risks and uncertainties. VantageSouth Bancshares, Inc. (“Vantage”) and Yadkin Financial Corporation (“Yadkin”) caution readers that any forward-looking statement is not a guarantee of future performance and that actual results could differ materially from those contained in the forward-looking statement. Such forward-looking statements include, but are not limited to, statements about the benefits of the proposed merger involving Vantage and Yadkin, Vantage’s and Yadkin’s plans, objectives, expectations and intentions, the expected timing of completion of the transaction and other statements that are not historical facts. Important factors that could cause actual results to differ materially from those indicated by such forward-looking statements are set forth in Vantage’s and Yadkin’s filings with the SEC. These include risks and uncertainties relating to: the ability to obtain the requisite shareholder approvals; the risk that Vantage and Yadkin may be unable to obtain governmental and regulatory approvals required for the merger, or required governmental and regulatory approvals may delay the merger; the risk that a condition to closing of the merger may not be satisfied; the risk that a condition to the closing of Vantage’s private placement may not be satisfied; the timing to consummate the proposed merger; the risk that the business will not be integrated successfully; the risk that the cost savings and any other synergies from the transaction may not be fully realized or may take longer than expected; disruption from the transaction making it more difficult to maintain relationships with customers and employees; the diversion of management time on merger-related issues; general worldwide economic conditions and related uncertainties; the effect of changes in governmental regulations; and other factors discussed or referred to in the “Risk Factors” section of each of Vantage’s and Yadkin’s most recent Annual Report on Form 10-K filed with the SEC and their respective quarterly reports filed on Form 10-Qs and current reports on Form 8-K. Each forward-looking statement speaks only as of the date of the particular statement and except as may be required by law, neither Vantage nor Yadkin undertakes any obligation to publicly update any forward-looking statement, whether as a result of new information, future events or otherwise. Annualized, pro forma, projected and estimated numbers are used for illustrative purpose only, are not forecasts and may not reflect actual results.

VantageSouth financial performance 3 Source: SNL Financial *Efficiency ratio calculation excludes impact of acquisition gains and merger and conversion costs Core Pre-Tax, Pre-Provision Net Income Q / Q Loan Growth (Annualized) Efficiency Ratio* Net Interest Margin $1,465 $1,248 $5,981 $6,238 $6,840 $0 $2,000 $4,000 $6,000 $8,000 2012Q4 2013Q1 2013Q2 2013Q3 2013Q4 85.6% 82.6% 75.9% 74.5% 71.9% 50.0% 60.0% 70.0% 80.0% 90.0% 100.0% 2012Q4 2013Q1 2013Q2 2013Q3 2013Q4 13.2% 16.4% 24.0% 8.9% 10.7% 0.0% 5.0% 10.0% 15.0% 20.0% 25.0% 30.0% 2012Q4 2013Q1 2013Q2 2013Q3 2013Q4 4.37% 4.24% 4.67% 4.39% 4.31% 3.00% 3.50% 4.00% 4.50% 5.00% 2012Q4 2013Q1 2013Q2 2013Q3 2013Q4

VantageSouth Q4 earnings 4 Core pre-tax, pre-provision earnings approximately $6.8 million in Q4; up from $6.2 million in Q3 Net income in Q4 was $3.3 million, which was an improvement from $1.5 million in Q3 Government-guaranteed, small business lending income increased to $1.9 million in Q4 from $1.5 million in Q3 • VSB was named the top small business lender in North Carolina by the U.S. Small Business Association Operating efficiency ratio improved to 71.9% in Q4, down from 74.5% in Q3 Net interest margin of 4.31% in Q4, down from 4.39% in Q3 VantageSouth Q4 Operating Highlights Source: SNL Financial *Efficiency ratio calculation excludes impact of acquisition gains and merger and conversion costs ($ in thousands) 2012Q4 2013Q1 2013Q2 2013Q3 2013Q4 Net interest income 10,175$ 9,944$ 20,428$ 19,906$ 19,811$ Provision for loan losses 1,167 1,940 1,492 1,280 757 Net interest income after provision 9,008 8,004 18,936 18,626 19,054 Service charges and fees 508$ 515$ 1,525$ 1,512$ 1,407$ Securities gains (losses), net 603 1,092 123 - - Mortgage loan and related fees 771 391 1,096 310 468 SBA loan and related fees 1,718 1,119 1,058 1,525 1,884 Other noninterest income 533 345 1,053 1,190 794 Noninterest income 4,133 3,462 4,855 4,537 4,553 Salaries and employee benefits 6,588$ 5,991$ 11,009$ 10,034$ 9,452$ Occupancy 1,321 1,547 2,408 2,497 2,600 Other noninterest expense 4,331 3,528 5,762 5,674 5,472 Noninterest expense 12,240 11,066 19,179 18,205 17,524 Income before taxes & M&A costs 901$ 400$ 4,612$ 4,958$ 6,083$ Gain on acquisitions - - 7,809 - - Merger & conversion costs 2,114 1,601 11,961 477 599 Income before taxes (1,213) (1,201) 460 4,481 5,484 Tax expense (benefit) (3,326) (395) (2,808) 2,997 2,220 Net Income (loss) 2,113$ (806)$ 3,268$ 1,484$ 3,264$ Dividends & accretion on preferred stock 368 369 705 708 711 Net income (loss ) to cmn. shareholders 1,745$ (1,175)$ 2,563$ 776$ 2,553$ Net income (loss) to cmn. per share 0.05$ (0.03)$ 0.06$ 0.02$ 0.06$ Core pre-tax, pre-provision earnings 1,465$ 1,248$ 5,981$ 6,238$ 6,840$ Efficiency Ratio* 85.6% 82.6% 75.9% 74.5% 71.9%
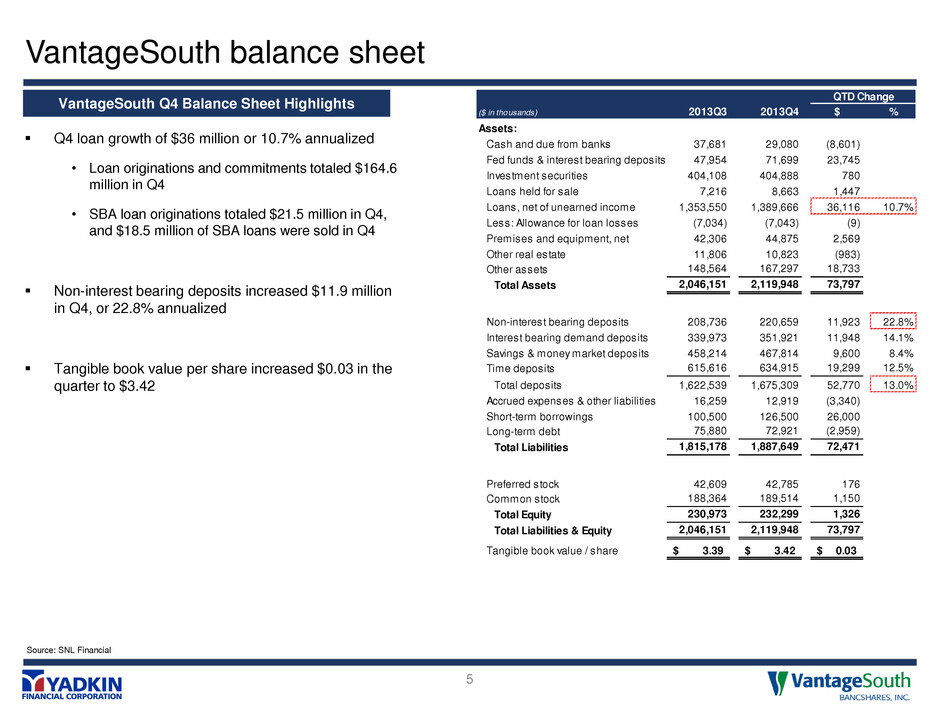
VantageSouth balance sheet 5 Q4 loan growth of $36 million or 10.7% annualized • Loan originations and commitments totaled $164.6 million in Q4 • SBA loan originations totaled $21.5 million in Q4, and $18.5 million of SBA loans were sold in Q4 Non-interest bearing deposits increased $11.9 million in Q4, or 22.8% annualized Tangible book value per share increased $0.03 in the quarter to $3.42 QTD Change ($ in thousands) 2013Q3 2013Q4 $ % Assets: Cash and due from banks 37,681 29,080 (8,601) Fed funds & interest bearing deposits 47,954 71,699 23,745 Investment securities 404,108 404,888 780 Loans held for sale 7,216 8,663 1,447 Loans, net of unearned income 1,353,550 1,389,666 36,116 10.7% Less: Allowance for loan losses (7,034) (7,043) (9) Premises and equipment, net 42,306 44,875 2,569 Other real estate 11,806 10,823 (983) Other assets 148,564 167,297 18,733 Total Assets 2,046,151 2,119,948 73,797 Non-interest bearing deposits 208,736 220,659 11,923 22.8% Interest bearing demand deposits 339,973 351,921 11,948 14.1% Savings & money market deposits 458,214 467,814 9,600 8.4% Time deposits 615,616 634,915 19,299 12.5% Total deposits 1,622,539 1,675,309 52,770 13.0% Accrued expenses & other liabilities 16,259 12,919 (3,340) Short-term borrowings 100,500 126,500 26,000 Long-term debt 75,880 72,921 (2,959) Total Liabilities 1,815,178 1,887,649 72,471 Preferred stock 42,609 42,785 176 Common stock 188,364 189,514 1,150 Total Equity 230,973 232,299 1,326 Total Liabilities & Equity 2,046,151 2,119,948 73,797 Tangible book value / share 3.39$ 3.42$ 0.03$ VantageSouth Q4 Balance Sheet Highlights Source: SNL Financial

Yadkin Financial financial performance 6 Source: SNL Financial *Efficiency ratio is calculated by taking noninterest expense less the amortization of intangibles and gains on sale of OREO, as a percentage of total taxable equivalent net interest income and noninterest income less gains on sale of securities, gains (losses) on sale of loans, gains on sale of branch and other than temporary impairment of investments Core Pre-Tax, Pre-Provision Net Income Core ROAA & ROATCE Efficiency Ratio* Net Interest Margin ($3,769) $7,491 $6,817 $6,958 $6,889 ($6,000) ($3,000) $0 $3,000 $6,000 $9,000 2012Q4 2013Q1 2013Q2 2013Q3 2013Q4 86.6% 66.4% 66.6% 63.5% 62.8% 50.0% 60.0% 70.0% 80.0% 90.0% 100.0% 2012Q4 2013Q1 2013Q2 2013Q3 2013Q4 NM 1.02% 0.99% 1.02% 1.44%13.5% 12.5% 12.5% 17.2% 0.0% 5.0% 10.0% 15.0% 20.0% 0.00% 0.50% 1.00% 1.50% 2.00% 2012Q4 2013Q1 2013Q2 2013Q3 2013Q4 Core ROATCECo re RO AA 3.28% 3.57% 3.90% 3.93% 4.04% 2.00% 2.50% 3.00% 3.50% 4.00% 4.50% 2012Q4 2013Q1 2013Q2 2013Q3 2013Q4
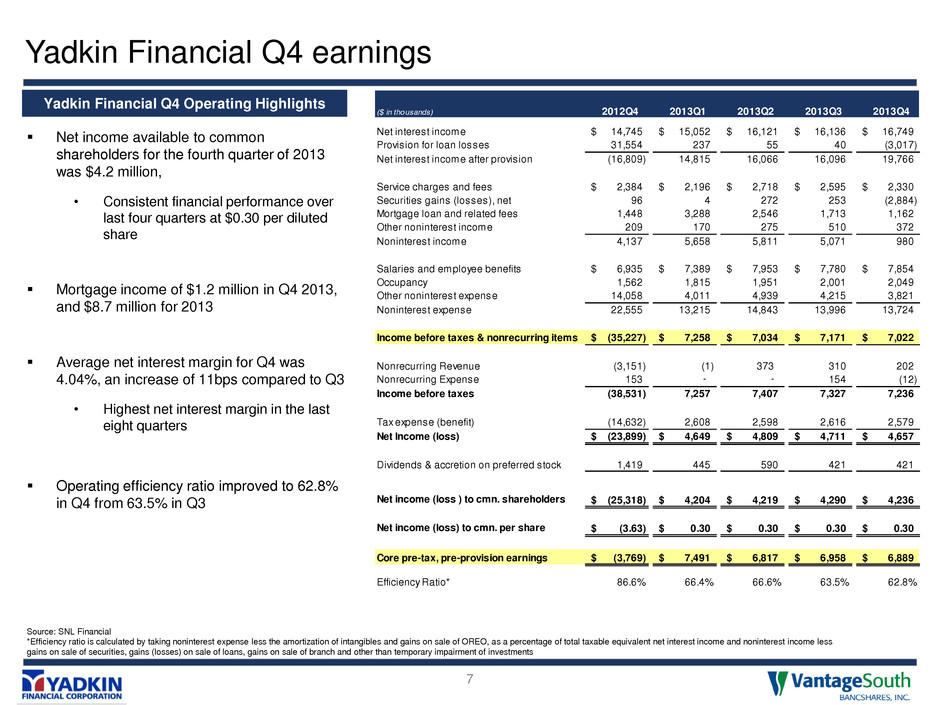
Yadkin Financial Q4 earnings 7 Net income available to common shareholders for the fourth quarter of 2013 was $4.2 million, • Consistent financial performance over last four quarters at $0.30 per diluted share Mortgage income of $1.2 million in Q4 2013, and $8.7 million for 2013 Average net interest margin for Q4 was 4.04%, an increase of 11bps compared to Q3 • Highest net interest margin in the last eight quarters Operating efficiency ratio improved to 62.8% in Q4 from 63.5% in Q3 Yadkin Financial Q4 Operating Highlights Source: SNL Financial *Efficiency ratio is calculated by taking noninterest expense less the amortization of intangibles and gains on sale of OREO, as a percentage of total taxable equivalent net interest income and noninterest income less gains on sale of securities, gains (losses) on sale of loans, gains on sale of branch and other than temporary impairment of investments ($ in thousands) 2012Q4 2013Q1 2013Q2 2013Q3 2013Q4 Net interest income 14,745$ 15,052$ 16,121$ 16,136$ 16,749$ Provision for loan losses 31,554 237 55 40 (3,017) Net interest income after provision (16,809) 14,815 16,066 16,096 19,766 Service charges and fees 2,384$ 2,196$ 2,718$ 2,595$ 2,330$ Securities gains (losses), net 96 4 272 253 (2,884) Mortgage loan and related fees 1,448 3,288 2,546 1,713 1,162 Other noninterest income 209 170 275 510 372 Noninterest income 4,137 5,658 5,811 5,071 980 Salaries and employee benefits 6,935$ 7,389$ 7,953$ 7,780$ 7,854$ Occupancy 1,562 1,815 1,951 2,001 2,049 Other noninterest expense 14,058 4,011 4,939 4,215 3,821 Noninterest expense 22,555 13,215 14,843 13,996 13,724 Income before taxes & nonrecurring items (35,227)$ 7,258$ 7,034$ 7,171$ 7,022$ Nonrecurring Revenue (3,151) (1) 373 310 202 Nonrecurring Expense 153 - - 154 (12) Income before taxes (38,531) 7,257 7,407 7,327 7,236 Tax expense (benefit) (14,632) 2,608 2,598 2,616 2,579 Net Income (loss) (23,899)$ 4,649$ 4,809$ 4,711$ 4,657$ Dividends & accretion on preferred stock 1,419 445 590 421 421 Net income (loss ) to cmn. shareholders (25,318)$ 4,204$ 4,219$ 4,290$ 4,236$ Net income (loss) to cmn. per share (3.63)$ 0.30$ 0.30$ 0.30$ 0.30$ Core pre-tax, pre-provision earnings (3,769)$ 7,491$ 6,817$ 6,958$ 6,889$ Efficiency Ratio* 86.6% 66.4% 66.6% 63.5% 62.8%

Yadkin Financial balance sheet 8 Q4 loan growth of $25.3 million or 7.6% annualized • Third consecutive quarter of loan growth Total deposits increased $27.1 million in Q4, or 7.3% annualized • Core deposits represent 63.3% of total deposits Nonperforming assets decreased for the fifth consecutive quarter, ending the quarter at 1.03% of total assets Tangible book value per share increased $0.39 in the quarter to $10.71 Yadkin Financial Q4 Balance Sheet Highlights Source: SNL Financial QTD Change ($ in thousands) 2013Q3 2013Q4 $ % Assets: Cash and due from banks 32,417 32,226 (191) Fed funds & interest bearing deposits 6,710 8,769 2,059 Investment securities 328,690 288,922 (39,768) Loans held for sale 12,632 18,913 6,281 Loans, net of unearned income 1,333,437 1,358,746 25,309 7.6% Less: Allowance for loan losses (21,014) (18,063) 2,951 Premises and equipment, net 41,050 40,698 (352) Other real estate 2,989 3,267 278 Other assets 76,606 72,570 (4,036) Total Assets 1,813,517 1,806,048 (7,469) Non-interest bearing deposits 266,951 267,596 645 1.0% NOW, Savings & money market deposits 676,502 693,558 17,056 10.1% Time deposits 547,883 557,269 9,386 6.9% Total deposits 1,491,336 1,518,423 27,087 7.3% Accrued expenses & other liabilities 12,229 13,920 1,691 Short-term borrowings 131,080 89,214 (41,866) Total Liabilities 1,634,645 1,621,557 (13,088) Preferred stock 28,339 28,339 0 Common stock 150,533 156,152 5,619 Total Equity 178,872 184,491 5,619 Total Liabilities & Equity 1,813,517 1,806,048 (7,469) Tangible book value / share 10.32$ 10.71$ 0.39$

Strategic rationale 9 Largest community bank in North Carolina with $4 billion in assets and a statewide presence, based in one of the strongest U.S. growth markets Significant presence in Raleigh and Charlotte Complementary business lines drive diversified revenue stream Leading North Carolina community bank in SBA lending, mortgage lending, and wealth management Both banks in good regulatory standing Greater than 15% EPS accretion TBV accretive in approximately 2 years IRR of approximately 20% Conservative cost saves (8% of pro forma company after realization of standalone cost save initiatives) No revenue synergies assumed in pro forma results but substantial opportunities identified Strong pro forma capital ratios and repayment of TARP provide capital flexibility Extensive pre-announcement discussions and similar cultures will support smooth integration Comprehensive due diligence process, including thorough two-way loan review (discussions and diligence over several months) ~78% of combined loan portfolio has been marked-to-market Enhanced management team combines strengths from both organizations Converting to VSB technology platform; 5th merger integration in last four years Strategically Compelling Financially Attractive Low Risk Profile
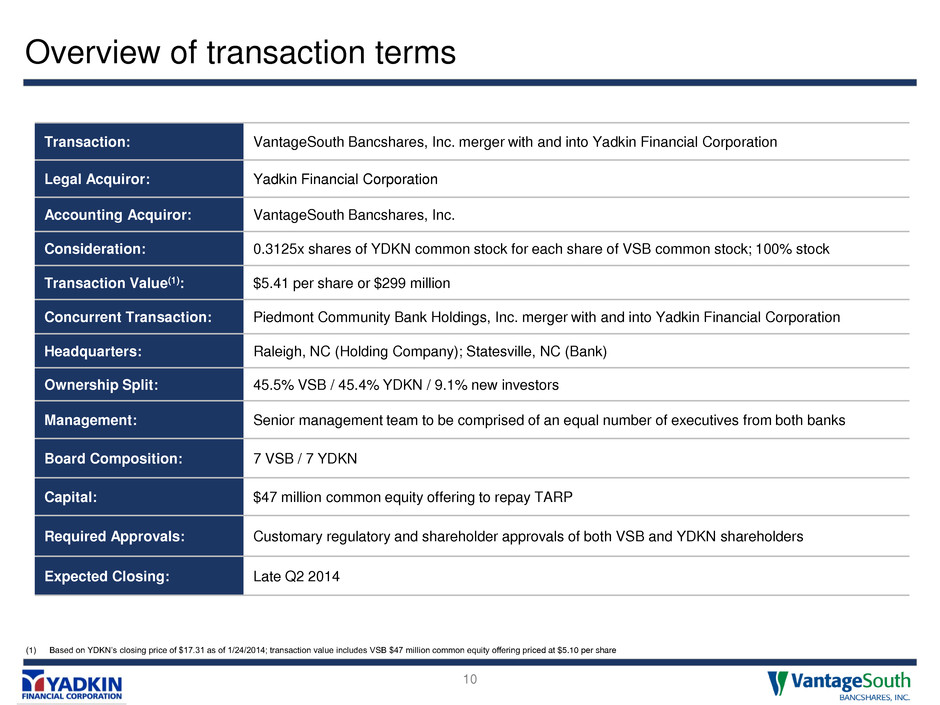
Overview of transaction terms 10 Transaction: VantageSouth Bancshares, Inc. merger with and into Yadkin Financial Corporation Legal Acquiror: Yadkin Financial Corporation Accounting Acquiror: VantageSouth Bancshares, Inc. Consideration: 0.3125x shares of YDKN common stock for each share of VSB common stock; 100% stock Transaction Value(1): $5.41 per share or $299 million Concurrent Transaction: Piedmont Community Bank Holdings, Inc. merger with and into Yadkin Financial Corporation Headquarters: Raleigh, NC (Holding Company); Statesville, NC (Bank) Ownership Split: 45.5% VSB / 45.4% YDKN / 9.1% new investors Management: Senior management team to be comprised of an equal number of executives from both banks Board Composition: 7 VSB / 7 YDKN Capital: $47 million common equity offering to repay TARP Required Approvals: Customary regulatory and shareholder approvals of both VSB and YDKN shareholders Expected Closing: Late Q2 2014 (1) Based on YDKN’s closing price of $17.31 as of 1/24/2014; transaction value includes VSB $47 million common equity offering priced at $5.10 per share

Strong proposed combined management team 11 Selected Management From Yadkin Selected Management From VantageSouth Scott M. Custer Chief Executive Officer Terry S. Earley Chief Financial Officer William Mark DeMarcus Sr. Chief Operating Officer Steven W. Jones President Edwin H. Shuford Chief Credit Officer Joseph H. Towell Executive Chairman Board of Directors 7 VSB / 7 YDKN Laura Blalock Chief Human Resources Officer
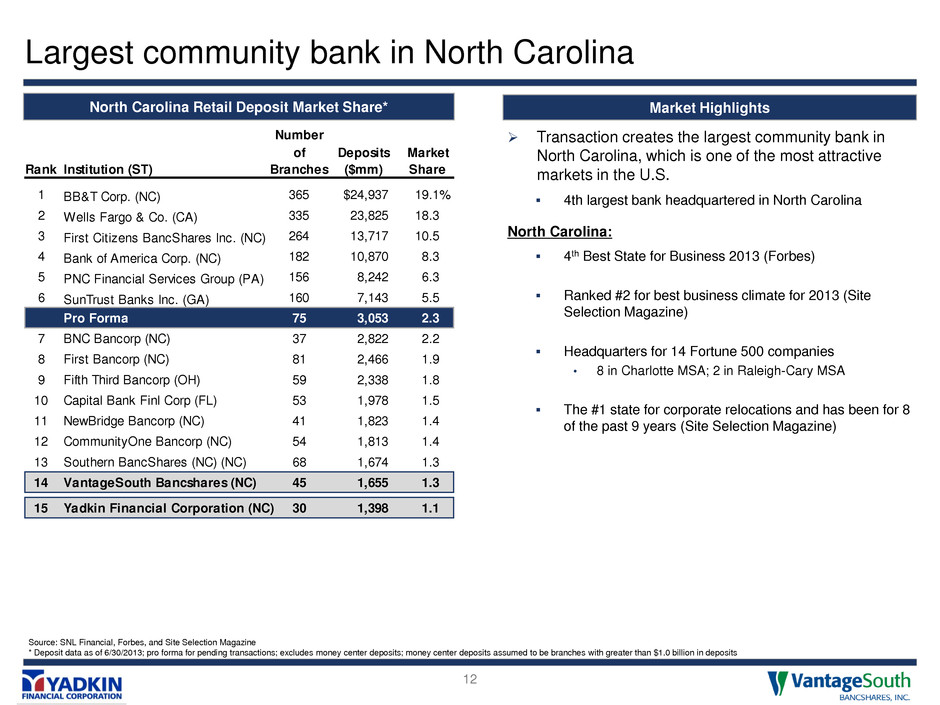
Largest community bank in North Carolina 12 Source: SNL Financial, Forbes, and Site Selection Magazine * Deposit data as of 6/30/2013; pro forma for pending transactions; excludes money center deposits; money center deposits assumed to be branches with greater than $1.0 billion in deposits Transaction creates the largest community bank in North Carolina, which is one of the most attractive markets in the U.S. 4th largest bank headquartered in North Carolina North Carolina: 4th Best State for Business 2013 (Forbes) Ranked #2 for best business climate for 2013 (Site Selection Magazine) Headquarters for 14 Fortune 500 companies • 8 in Charlotte MSA; 2 in Raleigh-Cary MSA The #1 state for corporate relocations and has been for 8 of the past 9 years (Site Selection Magazine) Market Highlights North Carolina Retail Deposit Market Share* Number of Deposits Market Rank Institution (ST) Branches ($mm) Share 1 BB&T Corp. (NC) 365 $24,937 19.1% 2 Wells Fargo & Co. (CA) 335 23,825 18.3 3 First Citizens BancShares Inc. (NC) 264 13,717 10.5 4 Bank of America Corp. (NC) 182 10,870 8.3 5 PNC Financial Services Group (PA) 156 8,242 6.3 6 SunTrust Banks Inc. (GA) 160 7,143 5.5 Pro Forma 75 3,053 2.3 7 BNC Bancorp (NC) 37 2,822 2.2 8 First Bancorp (NC) 81 2,466 1.9 9 Fifth Third Bancorp (OH) 59 2,338 1.8 10 Capital Bank Finl Corp (FL) 53 1,978 1.5 11 NewBridge Bancorp (NC) 41 1,823 1.4 12 CommunityOne Bancorp (NC) 54 1,813 1.4 13 Southern BancShares (NC) (NC) 68 1,674 1.3 14 VantageSouth Bancshares (NC) 45 1,655 1.3 15 Yadkin Financial Corporation (NC) 30 1,398 1.1
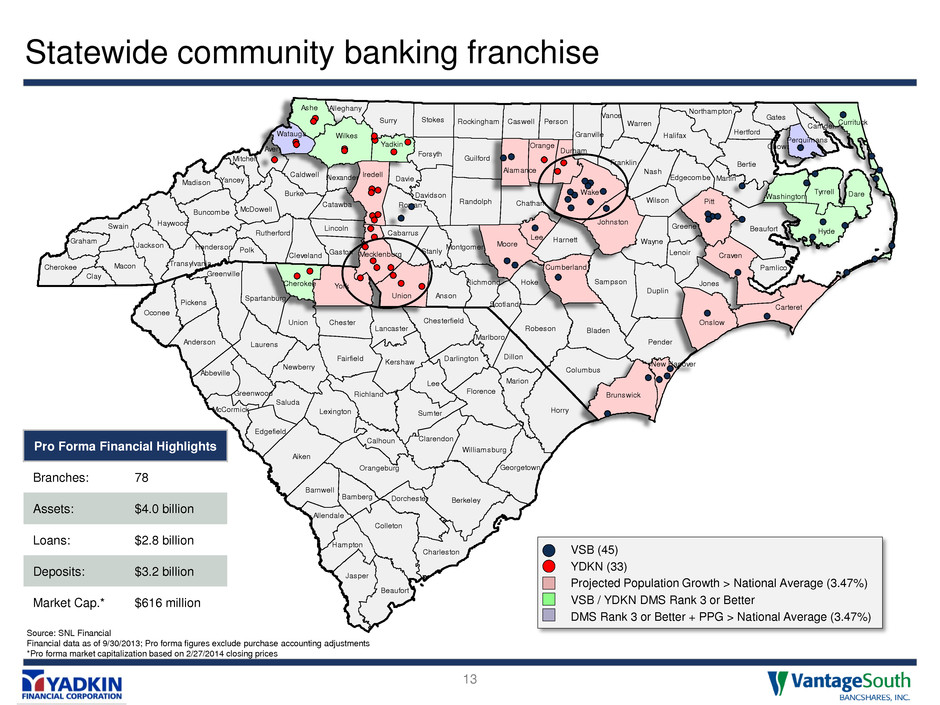
Stanly Cabarrus Vance Richmond Anson Florence Marion Darlington Marlboro Barnwell Greenwood Dillon Chesterfield Lancaster Columbus Lenoir Wayne Cleveland Rutherford Sampson Richland Greenville Halifax Alleghany Mitchell Avery McDowell McCormick Transylvania Martin Jackson Cherokee Graham Swain Haywood Hertford Northampton DorchesterBamberg Jasper Charleston Colleton Allendale Beaufort Alexander Beaufort Bertie Bladen Buncombe Burke Caldwell Camden Caswell Catawba Chatham Chowan Clay Davidson Davie Duplin Edgecombe Forsyth Franklin Gaston Gates Granville Greene Guilford Harnett Henderson Hoke Jones Lincoln Macon Madison Montgomery Nash Pamlico Pender Person Polk Randolph Robeson Rockingham Rowan Scotland StokesSurry Warren Wilson Yancey Abbeville Aiken Anderson Berkeley Calhoun Chester Clarendon Edgefield Fairfield Georgetown Hampton Horry Kershaw Laurens Lee Lexington Newberry Oconee Orangeburg Pickens Saluda Spartanburg Sumter Union Williamsburg Mecklenburg Union Brunswick Cumberland New Hanover Moore Lee Alamance Durham Orange Iredell Wake Pitt Carteret Onslow Craven Watauga Perquimans Ashe Wilkes Yadkin Washington Currituck Hyde Johnston York DareTyrrell Cherokee Statewide community banking franchise 13 Source: SNL Financial Financial data as of 9/30/2013; Pro forma figures exclude purchase accounting adjustments *Pro forma market capitalization based on 2/27/2014 closing prices Pro Forma Financial Highlights Branches: 78 Assets: $4.0 billion Loans: $2.8 billion Deposits: $3.2 billion Market Cap.* $616 million • VSB (45) • YDKN (33) • Projected Population Growth > National Average (3.47%) • VSB / YDKN DMS Rank 3 or Better • DMS Rank 3 or Better + PPG > National Average (3.47%)

Deep presence in attractive North Carolina markets 14 SNL Financial, Bloomberg, MSN Real Estate, Forbes, Site Selection Magazine. Deposit data as of 6/30/2013; pro forma for pending transactions, includes all US banks and thrifts. *Community banks defined as US banks and thrifts less than $10 billion in assets Charlotte-Gastonia MSA Raleigh-Cary / Durham-Chapel Hill MSA MSAs Raleigh-Cary Durham- Chapel Hill Charlotte- Gastonia North Carolina United States Market Statistics: Population 1,177,361 521,014 2,281,912 9,759,332 313,129,017 Proj. Pop. Growth ('12-'17) 12.9% 7.0% 8.2% 6.2% 3.5% Median HHI $56,678 $47,359 $50,588 $42,900 $50,157 Proj. HHI Growth ('12-'17) 12.5% 15.9% 11.3% 18.5% 13.4% Combined Franchise: Deposits ($mm) $611 $144 $681 $3,053 $3,163 Number of Branches 10 3 18 75 78 Deposit Market Share 2.62% 1.94% 0.32% 0.88% 0.04% Market Share Rank 7 9 8 7 154 Community Bank Rank* 1 3 2 1 77
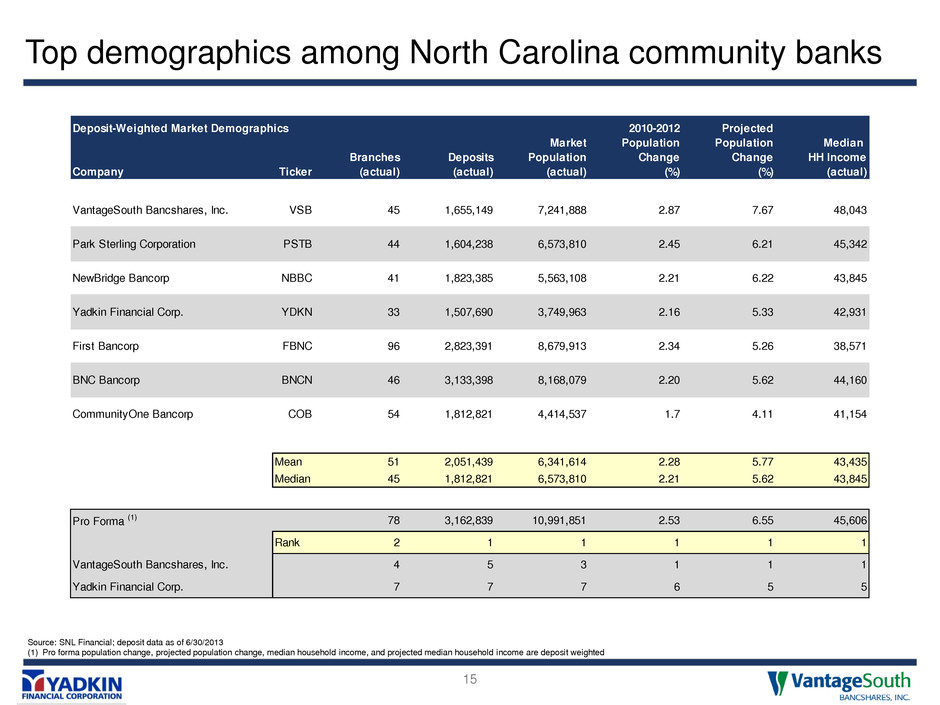
Top demographics among North Carolina community banks 15 Source: SNL Financial; deposit data as of 6/30/2013 (1) Pro forma population change, projected population change, median household income, and projected median household income are deposit weighted Deposit-Weighted Market Demographics 2010-2012 Projected Market Population Population Median Branches Deposits Population Change Change HH Income Company Ticker (actual) (actual) (actual) (%) (%) (actual) VantageSouth Bancshares, Inc. VSB 45 1,655,149 7,241,888 2.87 7.67 48,043 Park Sterling Corporation PSTB 44 1,604,238 6,573,810 2.45 6.21 45,342 NewBridge Bancorp NBBC 41 1,823,385 5,563,108 2.21 6.22 43,845 Yadkin Financial Corp. YDKN 33 1,507,690 3,749,963 2.16 5.33 42,931 First Bancorp FBNC 96 2,823,391 8,679,913 2.34 5.26 38,571 BNC Bancorp BNCN 46 3,133,398 8,168,079 2.20 5.62 44,160 CommunityOne Bancorp COB 54 1,812,821 4,414,537 1.7 4.11 41,154 Mean 51 2,051,439 6,341,614 2.28 5.77 43,435 Median 45 1,812,821 6,573,810 2.21 5.62 43,845 Pro Forma (1) 78 3,162,839 10,991,851 2.53 6.55 45,606 Rank 2 1 1 1 1 1 VantageSouth Bancshares, Inc. 4 5 3 1 1 1 Yadkin Financial Corp. 7 7 7 6 5 5
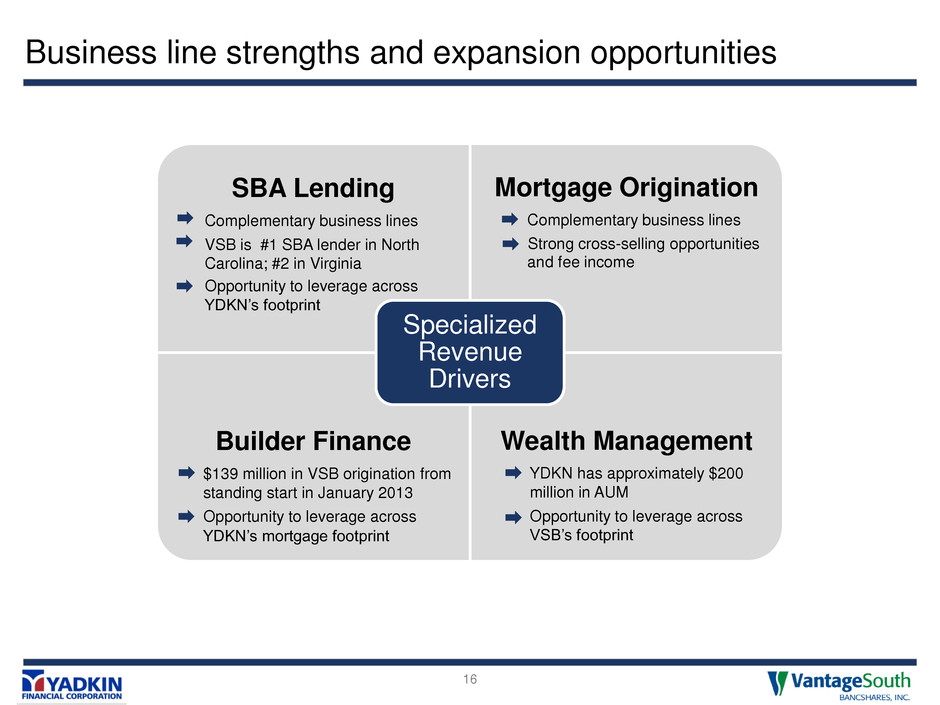
Business line strengths and expansion opportunities 16 SBA Lending Complementary business lines VSB is #1 SBA lender in North Carolina; #2 in Virginia Opportunity to leverage across YDKN’s footprint Mortgage Origination Complementary business lines Strong cross-selling opportunities and fee income Builder Finance $139 million in VSB origination from standing start in January 2013 Opportunity to leverage across YDKN’s mortgage footprint Wealth Management YDKN has approximately $200 million in AUM Opportunity to leverage across VSB’s footprint Specialized Revenue Drivers
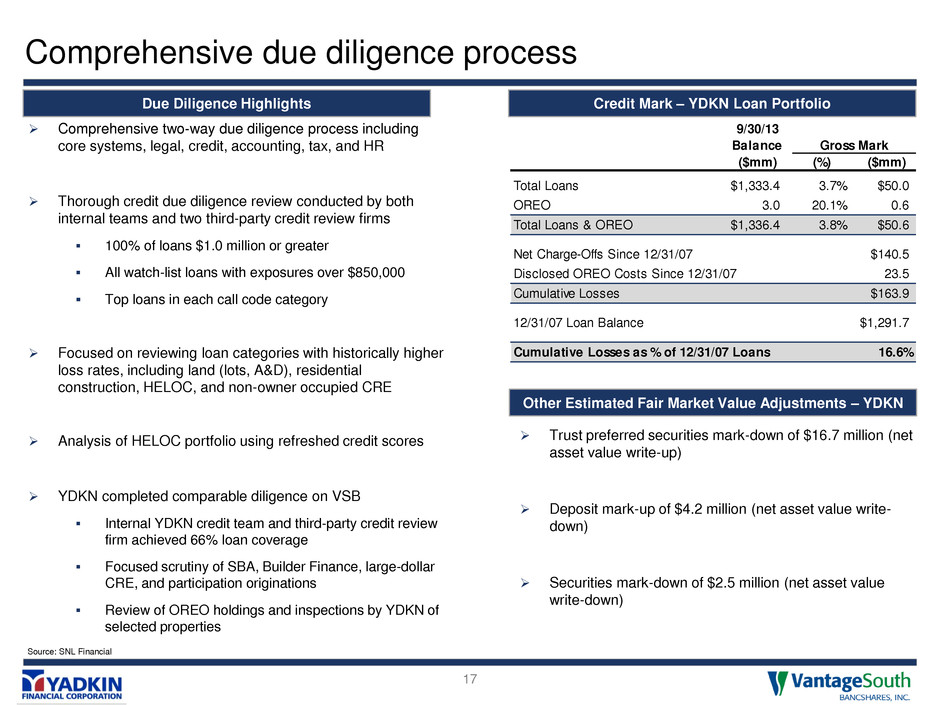
Comprehensive due diligence process 17 Source: SNL Financial Due Diligence Highlights Credit Mark – YDKN Loan Portfolio 9/30/13 Balance Gross Mark ($mm) (%) ($mm) Total Loans $1,333.4 3.7% $50.0 OREO 3.0 20.1% 0.6 Total Loans & OREO $1,336.4 3.8% $50.6 Net Charge-Offs Since 12/31/07 $140.5 Disclosed OREO Costs Since 12/31/07 23.5 Cumulative Losses $163.9 12/31/07 Loan Balance $1,291.7 Cumulative Losses as % of 12/31/07 Loans 16.6% Other Estimated Fair Market Value Adjustments – YDKN Trust preferred securities mark-down of $16.7 million (net asset value write-up) Deposit mark-up of $4.2 million (net asset value write- down) Securities mark-down of $2.5 million (net asset value write-down) Comprehensive two-way due diligence process including core systems, legal, credit, accounting, tax, and HR Thorough credit due diligence review conducted by both internal teams and two third-party credit review firms 100% of loans $1.0 million or greater All watch-list loans with exposures over $850,000 Top loans in each call code category Focused on reviewing loan categories with historically higher loss rates, including land (lots, A&D), residential construction, HELOC, and non-owner occupied CRE Analysis of HELOC portfolio using refreshed credit scores YDKN completed comparable diligence on VSB Internal YDKN credit team and third-party credit review firm achieved 66% loan coverage Focused scrutiny of SBA, Builder Finance, large-dollar CRE, and participation originations Review of OREO holdings and inspections by YDKN of selected properties

Pro forma financial impact 18 Assumptions Earnings estimates based on First Call consensus Gross credit mark of 3.8%, $50.6 million One-time merger related expenses of $23.2 million (pre-tax) Cost savings expected to be 8% of combined non-interest expense base after realization of standalone cost save initiatives ($10.0 million pre-tax) 50% realized in 2014, 100% realized by end of 2015 Revenue synergies identified but not included in modeling Core deposit intangible of 1.25% of non-time deposits, amortized straight-line over 10 years $47 million common equity offering priced at $5.10 per share VSB TARP repaid in Q1 2014 Projected close late Q2 2014 Pro Forma Analysis Financial Impact: Over 15% accretive to both parties Single-digit TBV dilution TBV accretive in 2 years IRR of approximately 20% Balance Sheet at Close: Assets: $4.0 billion Loans: $2.8 billion Deposits: $3.2 billion Capital Ratios at Close: TCE / TA: 8.8% Tier 1 Leverage: 8.8% Tier 1 Capital: 10.6% Total RBC: 12.3% Combined earnings of pro forma company will accelerate DTA utilization Note: Basel III pro forma capital ratios: Leverage Ratio: 8.6%, Common Equity Tier 1 Ratio: 8.9%, Tier 1 Capital Ratio: 10.5%, Total Capital Ratio: 12.1%
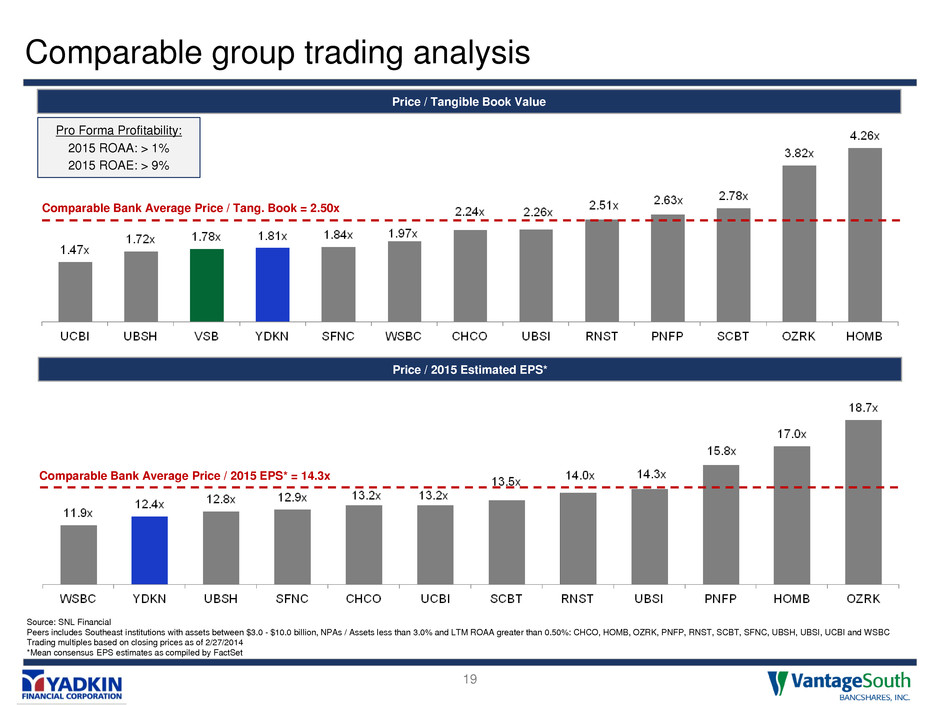
Comparable group trading analysis 19 Price / 2015 Estimated EPS* Comparable Bank Average Price / 2015 EPS* = 14.3x Price / Tangible Book Value Comparable Bank Average Price / Tang. Book = 2.50x Pro Forma Profitability: 2015 ROAA: > 1% 2015 ROAE: > 9% Source: SNL Financial Peers includes Southeast institutions with assets between $3.0 - $10.0 billion, NPAs / Assets less than 3.0% and LTM ROAA greater than 0.50%: CHCO, HOMB, OZRK, PNFP, RNST, SCBT, SFNC, UBSH, UBSI, UCBI and WSBC Trading multiples based on closing prices as of 2/27/2014 *Mean consensus EPS estimates as compiled by FactSet
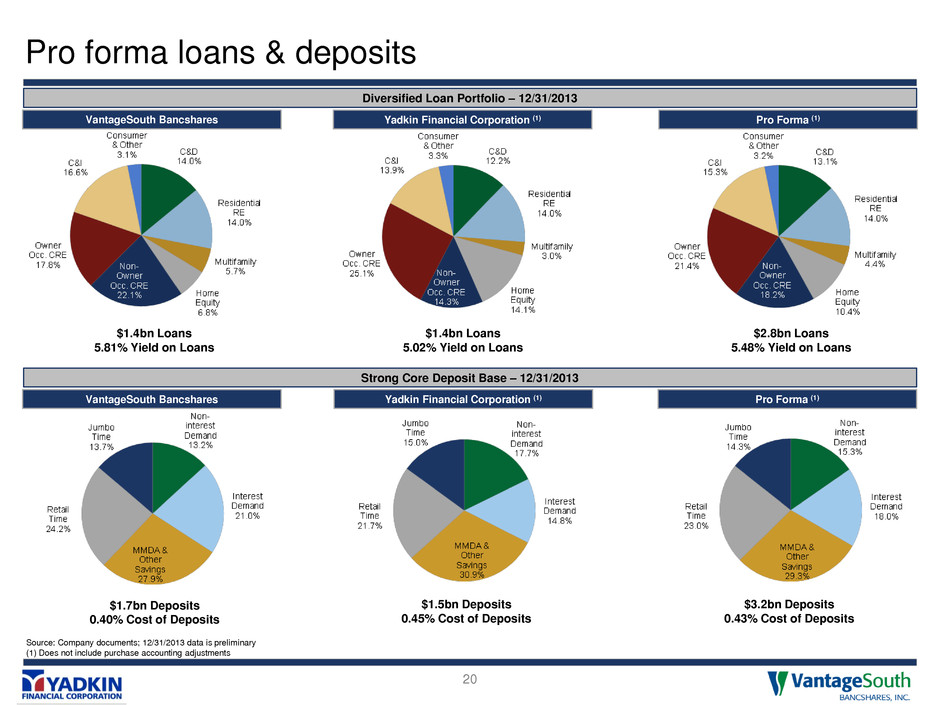
Pro forma loans & deposits 20 VantageSouth Bancshares Yadkin Financial Corporation (1) Pro Forma (1) Source: Company documents; 12/31/2013 data is preliminary (1) Does not include purchase accounting adjustments Strong Core Deposit Base – 12/31/2013 Diversified Loan Portfolio – 12/31/2013 VantageSouth Bancshares Yadkin Financial Corporation (1) Pro Forma (1) $1.4bn Loans 5.81% Yield on Loans $1.4bn Loans 5.02% Yield on Loans $1.7bn Deposits 0.40% Cost of Deposits $1.5bn Deposits 0.45% Cost of Deposits $3.2bn Deposits 0.43% Cost of Deposits $2.8bn Loans 5.48% Yield on Loans

Provides benefits to our stakeholders 21 Pro forma company joins attractive peer group with strong trading multiples Increases shareholder liquidity substantially Reduces downside risk and increases long-term growth potential Diversifies revenue stream and geographic footprint Significantly increases ability to serve larger customers Convenience of expanded branch network with 78 locations across all major North Carolina markets Continuity in customer-facing roles Increases ability to invest in technology Similar cultures Performance-driven objectives Representation from both banks in all key functions Larger organization provides additional opportunities for career advancement Shareholders Customers Employees

Recent developments 22 February 19th – Completed VSB TARP repayment • Negotiating with US Treasury on warrant repurchase March 4th – Integration team kick-off with project management framework and executive management and Board oversight March 5th – Completion of employee Town Hall meetings to discuss rationale for merger, cultural integration, and executive management structure Late Q2 / Early Q3 – Targeted close Late Q3 – Targeted system conversion

Additional information about the merger and where to find it 23 In connection with the proposed merger, Yadkin Financial Corporation (“Yadkin”) will file with the Securities and Exchange Commission (“SEC”) a Registration Statement on Form S-4 that will include a joint proxy statement of Yadkin and VantageSouth Bancshares, Inc. (the “Company”) and a prospectus of Yadkin, as well as other relevant documents concerning the proposed transaction. Both the Company and Yadkin will mail the joint proxy statement/prospectus to their respective stockholders. SHAREHOLDERS OF YADKIN AND THE COMPANY ARE URGED TO READ THE REGISTRATION STATEMENT AND JOINT PROXY STATEMENT/PROSPECTUS REGARDING THE PROPOSED MERGER WHEN IT BECOMES AVAILABLE AND ANY OTHER RELEVANT DOCUMENTS FILED WITH SEC, AS WELL AS ANY AMENDMENTS OR SUPPLEMENTS TO THOSE DOCUMENTS, BECAUSE THEY WILL CONTAIN IMPORTANT INFORMATION. Investors and security holders may obtain a free copy of the proxy statement/prospectus (when available) and other filings containing information about Yadkin and the Company at the SEC’s website at www.sec.gov. The joint proxy statement/prospectus (when available) and the other filings may also be obtained free of charge at Yadkin’s website at www.Yadkinbank.com, or at the Company’s website at www.VSB.com. Yadkin and certain of their respective Directors and executive officers, under the SEC’s rules, may be deemed to be participants in the solicitation of proxies of Yadkin and the Company’s stockholders in connection with the proposed merger. Information about the Directors and executive officers of Yadkin and their ownership of Yadkin common stock is set forth in Yadkin’s Annual Report on Form 10-K, as filed with the SEC on February 28, 2014. Information about the Directors and executive officers of the Company and their ownership of the Company common stock is set forth in the proxy statement for the Company’s 2013 Annual Meeting of Stockholders, as filed with the SEC on a Schedule 14A on April 23, 2013. Additional information regarding the interests of those participants and other persons who may be deemed participants in the transaction may be obtained by reading the joint proxy statement/prospectus regarding the proposed merger when it becomes available. Free copies of this document may be obtained as described in the preceding paragraph. This communication does not constitute an offer to sell or the solicitation of an offer to buy any securities or a solicitation of any vote or approval, nor shall there be any sale of securities in any jurisdiction in which such offer, solicitation or sale would be unlawful prior to registration or qualification under the securities laws of such jurisdiction.
