Attached files
| file | filename |
|---|---|
| 8-K - 8-K - ABM INDUSTRIES INC /DE/ | d686937d8k.htm |
| EX-99.1 - EX-99.1 - ABM INDUSTRIES INC /DE/ | d686937dex991.htm |
Exhibit 99.2

| ABM First Quarter 2014 Teleconference |
| Agenda 2 1 Introduction & Overview | Henrik Slipsager, CEO 2 First Quarter 2014 Review of Financial Results | Jim Lusk, CFO 3 4 Fiscal 2014 Outlook | Henrik Slipsager, CEO Forward-Looking Statements and Non-GAAP Financial Information: Our discussions during this conference call will include forward-looking statements. Actual results could differ materially from those projected in the forward-looking statements. The factors that could cause actual results to differ are discussed in the Company's 2013 Annual Report on Form 10-K and in our 2014 reports on Form 10-Q and Form 8-K. These reports are available on our website at http://investor.abm.com/ under "SEC Filings". A description of factors that could cause actual results to differ is also set forth at the end of this presentation. Also, the discussion during this conference call will include certain financial measures that were not prepared in accordance with U.S. generally accepted accounting principles ("U.S. GAAP"). Reconciliations of those non-GAAP financial measures to the most directly comparable U.S. GAAP financial measures can be found on the Investor Relations portion of our website at http://investor.abm.com and at the end of this presentation. 5 Questions and Answers First Quarter 2014 Operational Review | Jim McClure, EVP, Tracy Price, EVP & Henrik Slipsager, CEO |

| First Quarter 2014 Review of Financial Results |
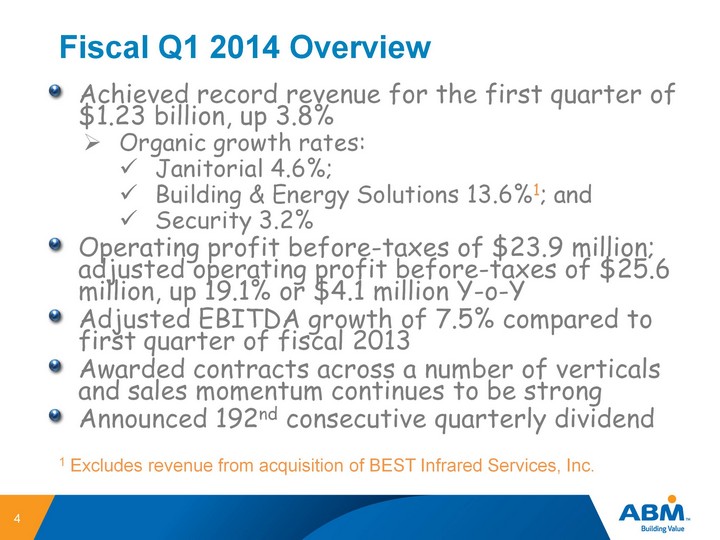
| Fiscal Q1 2014 Overview 4 Achieved record revenue for the first quarter of $1.23 billion, up 3.8% Organic growth rates: Janitorial 4.6%; Building & Energy Solutions 13.6%1; and Security 3.2% Operating profit before-taxes of $23.9 million; adjusted operating profit before-taxes of $25.6 million, up 19.1% or $4.1 million Y-o-Y Adjusted EBITDA growth of 7.5% compared to first quarter of fiscal 2013 Awarded contracts across a number of verticals and sales momentum continues to be strong Announced 192nd consecutive quarterly dividend 1 Excludes revenue from acquisition of BEST Infrared Services, Inc. |
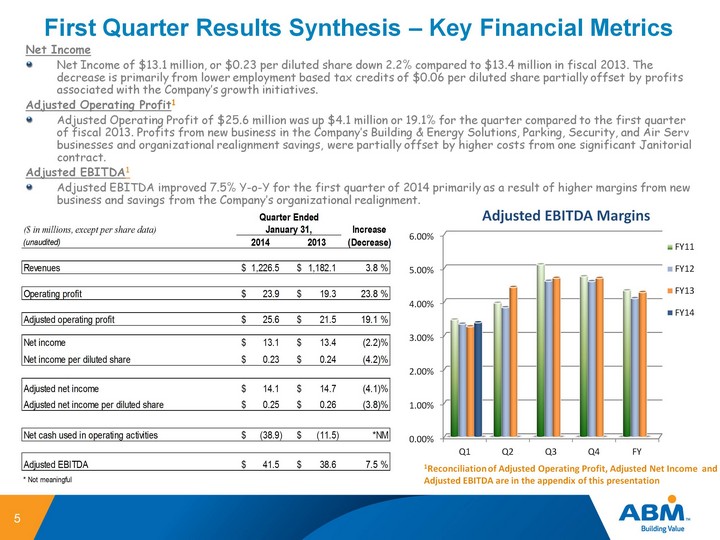
| First Quarter Results Synthesis - Key Financial Metrics 5 Net Income Net Income of $13.1 million, or $0.23 per diluted share down 2.2% compared to $13.4 million in fiscal 2013. The decrease is primarily from lower employment based tax credits of $0.06 per diluted share partially offset by profits associated with the Company's growth initiatives. Adjusted Operating Profit1 Adjusted Operating Profit of $25.6 million was up $4.1 million or 19.1% for the quarter compared to the first quarter of fiscal 2013. Profits from new business in the Company's Building & Energy Solutions, Parking, Security, and Air Serv businesses and organizational realignment savings, were partially offset by higher costs from one significant Janitorial contract. Adjusted EBITDA1 Adjusted EBITDA improved 7.5% Y-o-Y for the first quarter of 2014 primarily as a result of higher margins from new business and savings from the Company's organizational realignment. 1Reconciliation of Adjusted Operating Profit, Adjusted Net Income and Adjusted EBITDA are in the appendix of this presentation (CHART) |
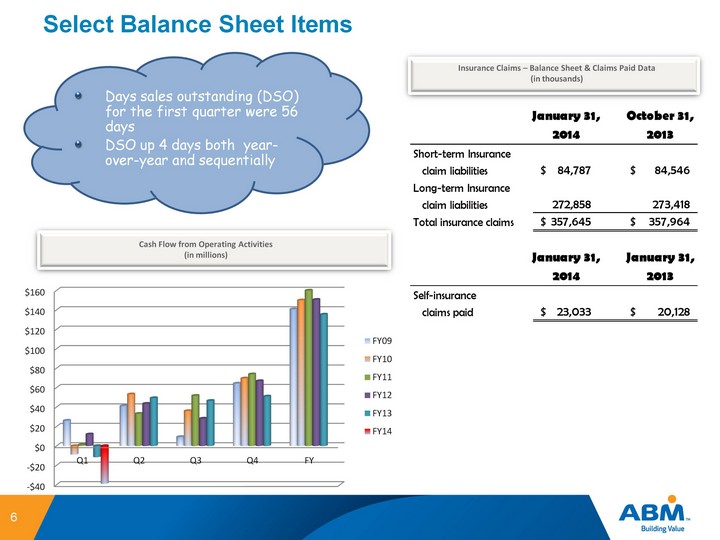
| Select Balance Sheet Items Cash Flow from Operating Activities (in millions) Days sales outstanding (DSO) for the first quarter were 56 days DSO up 4 days both year- over-year and sequentially 6 Insurance Claims - Balance Sheet & Claims Paid Data (in thousands) (CHART) |
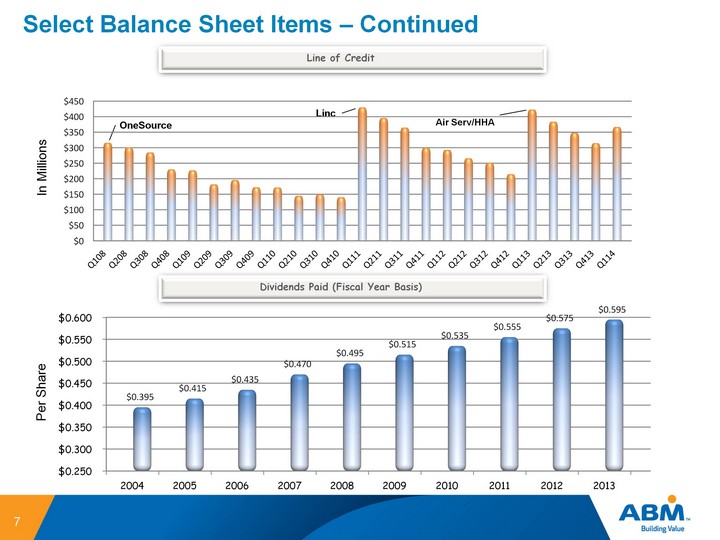
| Select Balance Sheet Items - Continued 7 Line of Credit OneSource Linc Air Serv/HHA In Millions Dividends Paid (Fiscal Year Basis) Per Share (CHART) (CHART) |
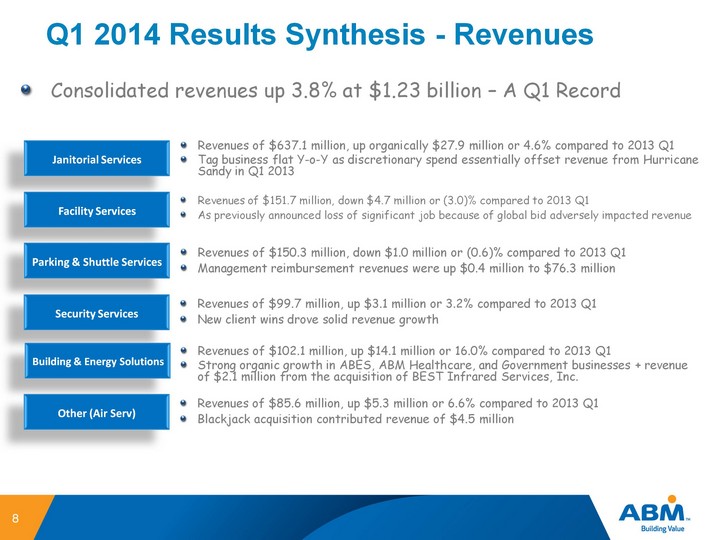
| Q1 2014 Results Synthesis - Revenues Revenues of $637.1 million, up organically $27.9 million or 4.6% compared to 2013 Q1 Tag business flat Y-o-Y as discretionary spend essentially offset revenue from Hurricane Sandy in Q1 2013 Consolidated revenues up 3.8% at $1.23 billion - A Q1 Record Janitorial Services 8 Facility Services Parking & Shuttle Services Security Services Building & Energy Solutions Other (Air Serv) Revenues of $151.7 million, down $4.7 million or (3.0)% compared to 2013 Q1 As previously announced loss of significant job because of global bid adversely impacted revenue Revenues of $150.3 million, down $1.0 million or (0.6)% compared to 2013 Q1 Management reimbursement revenues were up $0.4 million to $76.3 million Revenues of $99.7 million, up $3.1 million or 3.2% compared to 2013 Q1 New client wins drove solid revenue growth Revenues of $102.1 million, up $14.1 million or 16.0% compared to 2013 Q1 Strong organic growth in ABES, ABM Healthcare, and Government businesses + revenue of $2.1 million from the acquisition of BEST Infrared Services, Inc. Revenues of $85.6 million, up $5.3 million or 6.6% compared to 2013 Q1 Blackjack acquisition contributed revenue of $4.5 million |
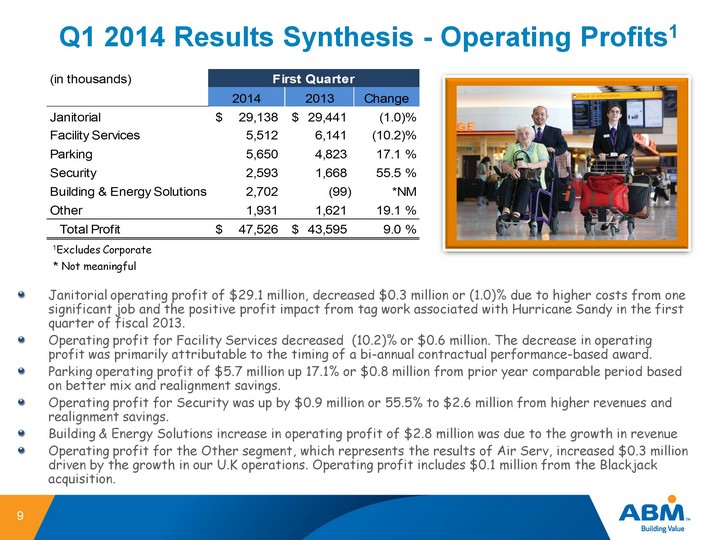
| Q1 2014 Results Synthesis - Operating Profits1 Janitorial operating profit of $29.1 million, decreased $0.3 million or (1.0)% due to higher costs from one significant job and the positive profit impact from tag work associated with Hurricane Sandy in the first quarter of fiscal 2013. Operating profit for Facility Services decreased (10.2)% or $0.6 million. The decrease in operating profit was primarily attributable to the timing of a bi-annual contractual performance-based award. Parking operating profit of $5.7 million up 17.1% or $0.8 million from prior year comparable period based on better mix and realignment savings. Operating profit for Security was up by $0.9 million or 55.5% to $2.6 million from higher revenues and realignment savings. Building & Energy Solutions increase in operating profit of $2.8 million was due to the growth in revenue Operating profit for the Other segment, which represents the results of Air Serv, increased $0.3 million driven by the growth in our U.K operations. Operating profit includes $0.1 million from the Blackjack acquisition. 1Excludes Corporate 9 * Not meaningful |
| Q1 2014 Business & Sales Highlights Organizational realignment continues on schedule and is generating savings in-line with expectations for the Onsite businesses. Air Serv awarded contract to perform shuttle transportation services at one of the major airports in the United Kingdom. We expect the job will begin later in the fiscal year. Momentum for the sports and entertainment vertical continues as Onsite secured commitments for stadiums in Southern California , Louisiana, and the United Kingdom. Selected by several Educational institutions to implement Bundled Energy Solutions projects, including Franklin City, VA Public Schools to implement a district-wide energy & facility improvement project. In addition, awarded first commercial Bundled Energy Solution job under PACE funding program Solve One More sales program since inception has generated 1,524 leads and annualized sales exceeding $40 million. 10 |

| Outlook |
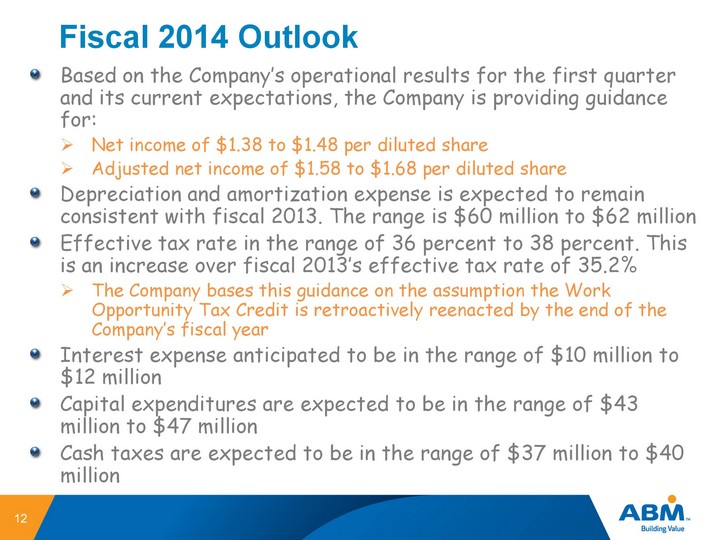
| Fiscal 2014 Outlook Based on the Company's operational results for the first quarter and its current expectations, the Company is providing guidance for: Net income of $1.38 to $1.48 per diluted share Adjusted net income of $1.58 to $1.68 per diluted share Depreciation and amortization expense is expected to remain consistent with fiscal 2013. The range is $60 million to $62 million Effective tax rate in the range of 36 percent to 38 percent. This is an increase over fiscal 2013's effective tax rate of 35.2% The Company bases this guidance on the assumption the Work Opportunity Tax Credit is retroactively reenacted by the end of the Company's fiscal year Interest expense anticipated to be in the range of $10 million to $12 million Capital expenditures are expected to be in the range of $43 million to $47 million Cash taxes are expected to be in the range of $37 million to $40 million 12 |
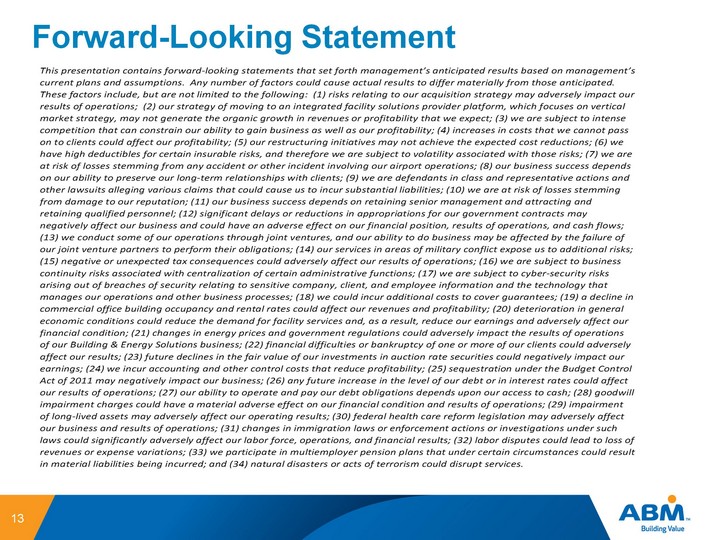
| Forward-Looking Statement 13 |
| Appendix - Unaudited Reconciliation of non-GAAP Financial Measures |
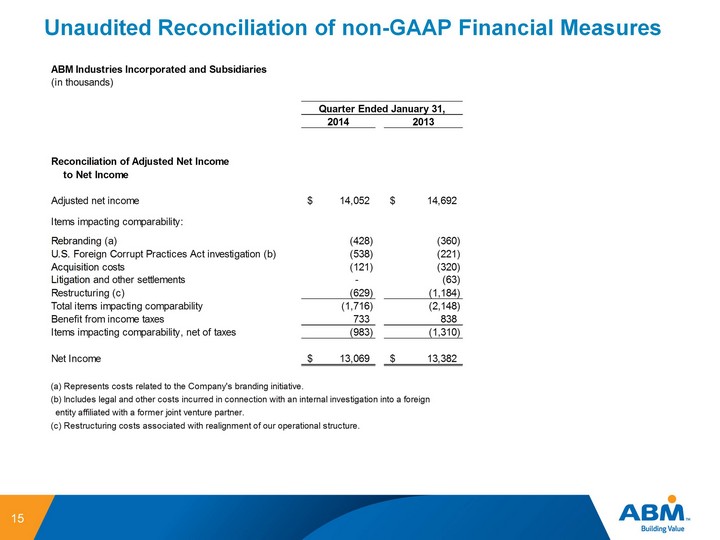
| 15 Unaudited Reconciliation of non-GAAP Financial Measures |
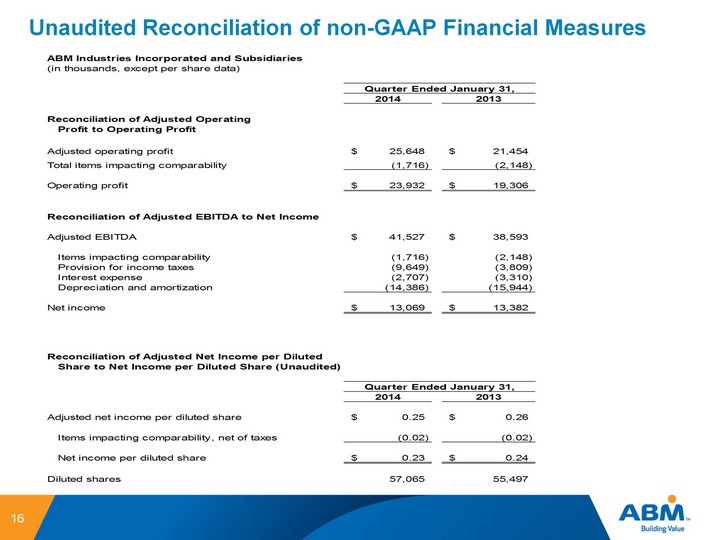
| 16 Unaudited Reconciliation of non-GAAP Financial Measures |
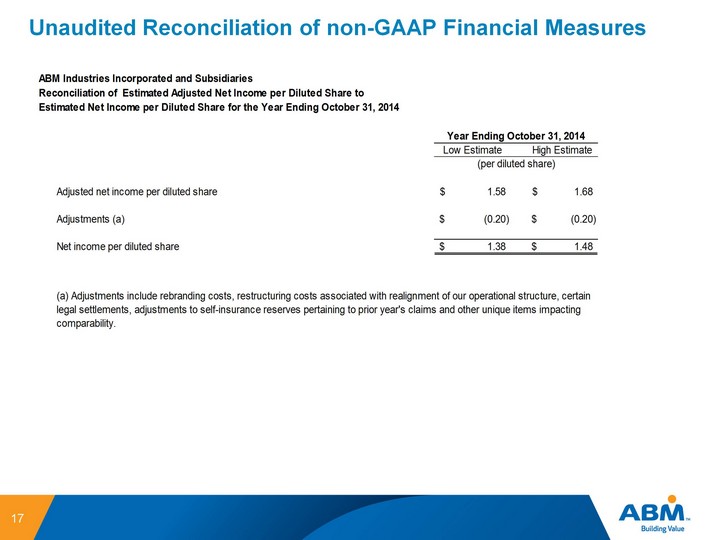
| 17 Unaudited Reconciliation of non-GAAP Financial Measures |