Attached files
| file | filename |
|---|---|
| 8-K - 8-K - Vantage Drilling CO | d680765d8k.htm |
 Vantage Drilling Company
J.P. Morgan High Yield & Leveraged Finance Conference
Miami, Florida
February 24, 2014
Exhibit 99.1 |
 Some of the statements in this presentation constitute
forward-looking statements. Forward-looking statements relate to
expectations,
beliefs,
projections,
future
plans
and
strategies,
anticipated
events
or
trends
and
similar
expressions
concerning
matters that are not historical facts. The forward looking
statements contained in this presentation involve risks and
uncertainties as well as statements as to:
•
our limited operating history;
•
availability of investment opportunities;
•
general volatility of the market price of our securities;
•
changes in our business strategy;
•
our ability to consummate an appropriate investment opportunity within
given time constraints; •
availability of qualified personnel;
•
changes in our industry, interest rates, the debt securities markets
or the general economy; •
changes in governmental, tax and environmental regulations and similar
matters; •
changes in generally accepted accounting principles by
standard-setting bodies; and •
the degree and nature of our competition.
The forward-looking statements are based on our beliefs,
assumptions and expectations of our future performance, taking
into account all information currently available to us. These
beliefs, assumptions and expectations can change as a result of
many possible events or factors, not all of which are known to us or
are within our control. If a change occurs, our business,
financial condition, liquidity and results of operations may vary
materially from those expressed in our forward-looking
statements.
Forward-Looking Statements
2 |
 NYSE:
VTG
Market Cap:
$519 million
Book Value:
$567 million
Enterprise Value:
$3.4 billion
Employees:
> 1,300
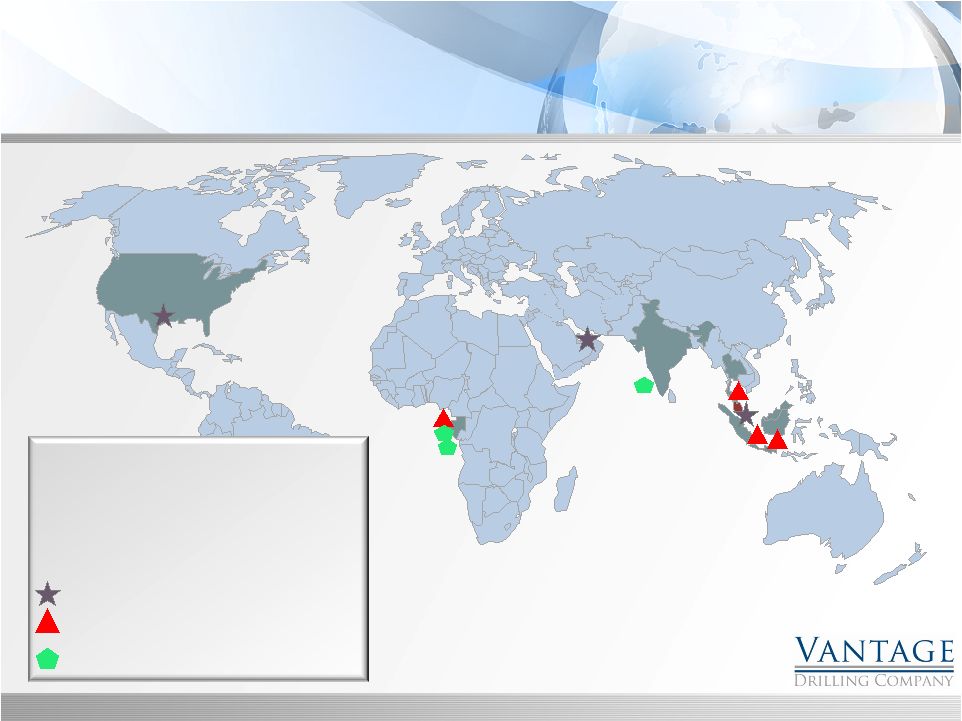
Company Overview
3
Vantage Offices
4
Jackups
3 Drillships, plus
1 under construction |
 2013 Achieved Record Revenue, EBITDA, and
Income from Operations
Ultra-Deepwater Fleet fully contracted through
2015
Jackup fleet 97% contracted for 2014 and 30%
contracted for 2015.
Refinanced Balance Sheet –
Interest savings in excess of $90 million per year
Much longer, staggered maturities
$850 million of pre-payable debt
Ultra-Deepwater drillship, Cobalt Explorer,
under construction will provide continued
growth through 2016.
Hired to manage two Ultra-deepwater newbuild
ship construction projects for customer at DSME
shipyard in Korea.
Highlights
4 |
 Vantage Strategic Focus
5
Vantage was founded with a vision of
bringing the best people together with the
highest specification, modern fleet in the
offshore drilling industry.
With exceptional operating performance
and a focus on service, we have built an
excellent portfolio of customers who have
provided us with significant backlog and
repeat business.
In recent years, we have focused on
improving our financial structure,
reducing our borrowing costs, and now
de-levering the balance sheet.
Financial
Structure
High-Spec
Assets
Long-term
Customer
Relationships
Experienced
People |
 •
Industry leading safety record –
Lost time incident rate in 2013
and 2012 were .32 and .00, respectively, as we completed
approximately 2.5 million and 2.2 million man-hours.
•
Jack-up
fleet
has
achieved
approximately
99%
productive
time
over the first 60 months of operations. Each jack-up
construction project was completed on-time and on budget.
•
Our exceptional operating experience and technical expertise
has
resulted
in
additional
business
opportunities
as
Vantage
has
been
selected
to
manage
3
party
shipyard
projects
and
rig
operations.
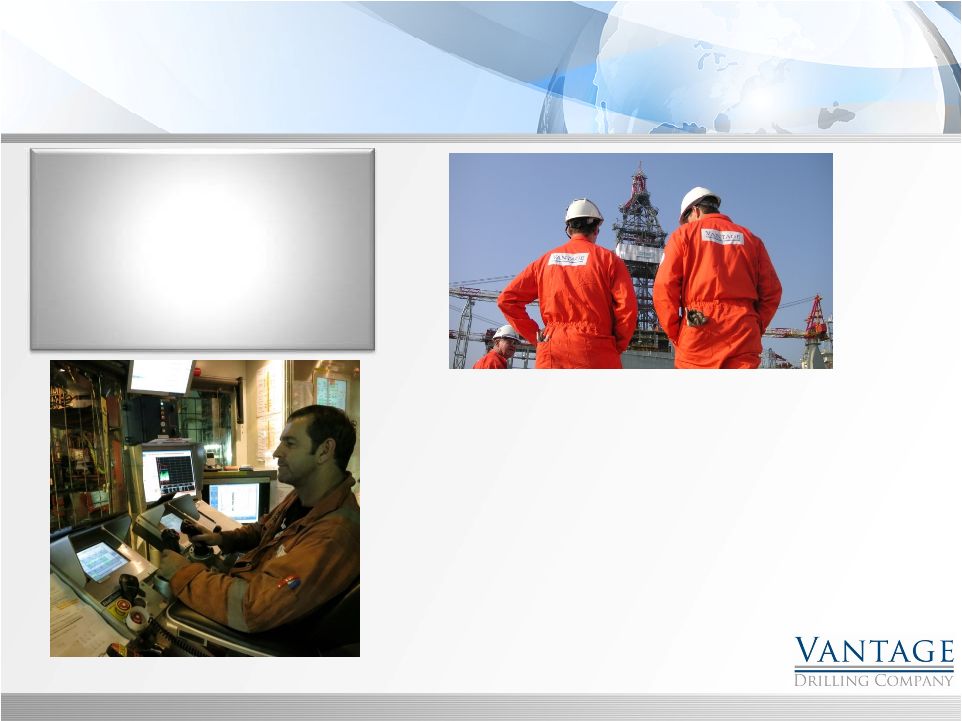
People
6
Our senior management team
averages over 30 years of
Industry experience. The
cornerstones of our corporate
culture are safety and
professionalism.
rd |
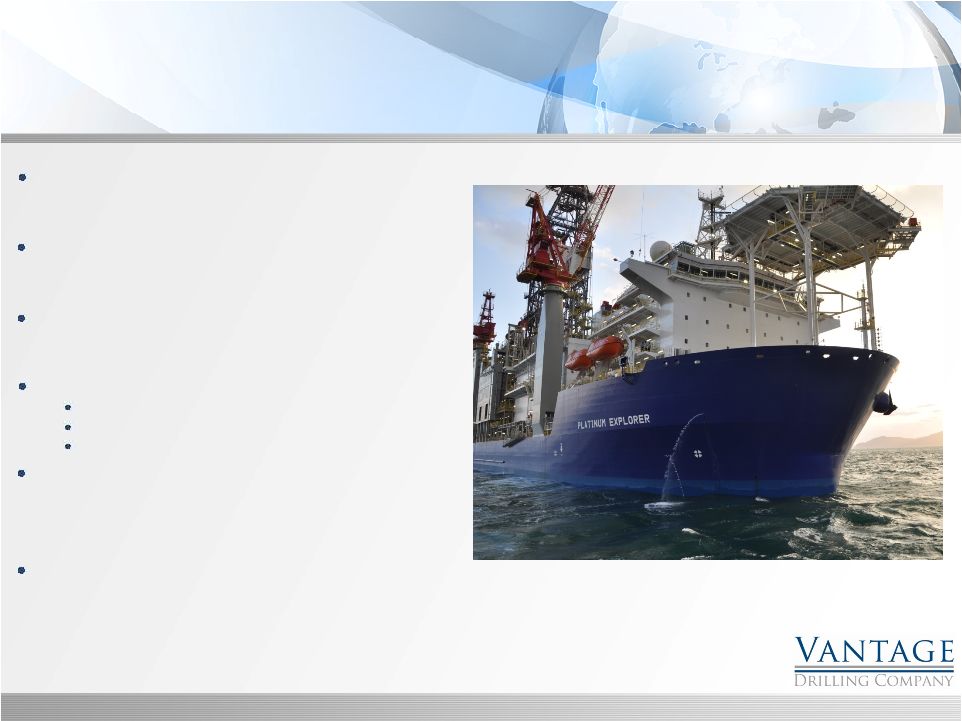
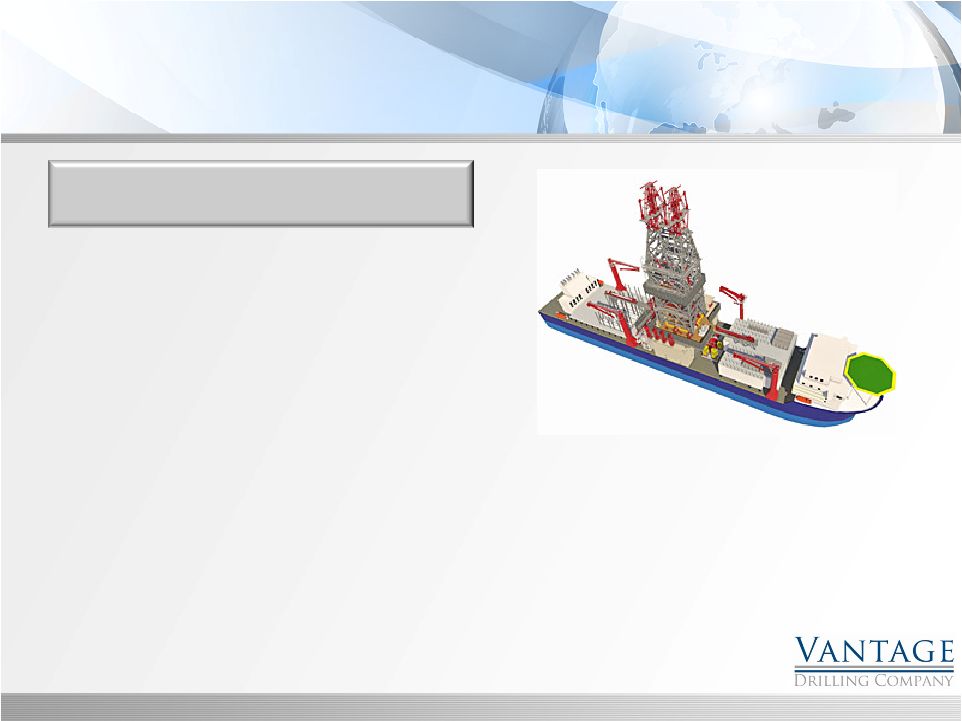
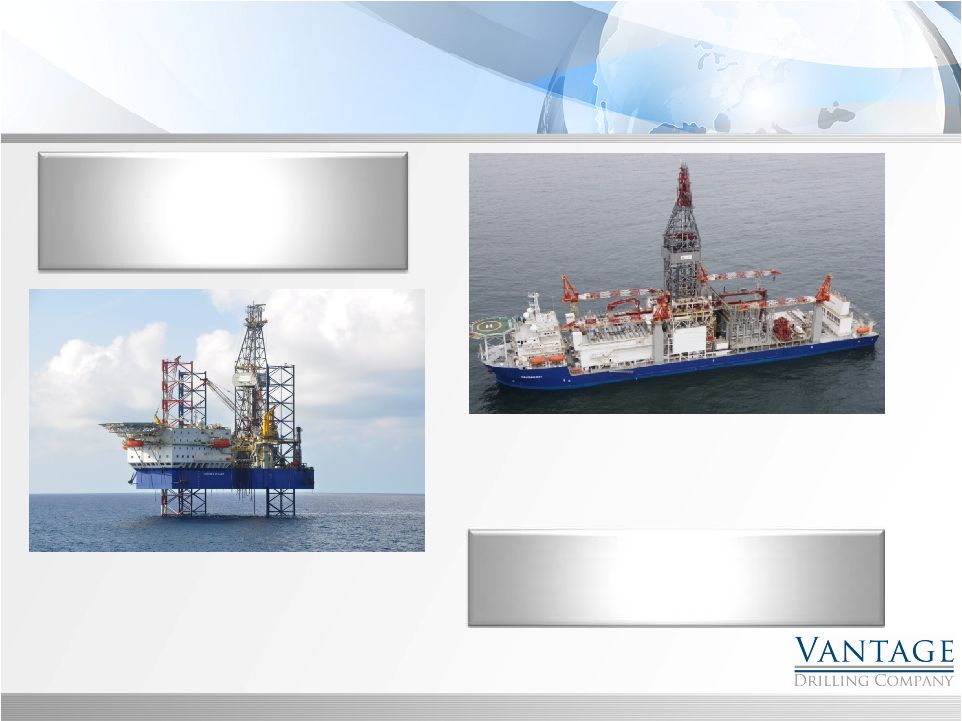 High Specification Assets
7
High-specification drillships combined with deep in-
house operations and technical teams, have been the
key to awards to Vantage of high-profile, complex,
ultra-deepwater projects.
Jackup fleet has achieved approximately
99% productive time
for the first 60
months of operations
Cobalt
Explorer,
a
7
generation,
dual-activity UDW
drillship equipped with (2) seven-ram BOP’s and 12,000 feet
of riser, scheduled for delivery in 2015, will be our most
technically advanced drillship.
th
We have built a fleet of new, premium
assets that our customers demand
now and for the
future. |
 •
Capabilities
and
age
–
The
current
worldwide
fleet
is
comprised
mostly
of
older,
inefficient
rigs
•
Age
is
a
factor
–
Demand
is
increasing
for
high-specification
jackups.
Many
customers
are
implementing
age
restrictions
and new high-specification requirements.
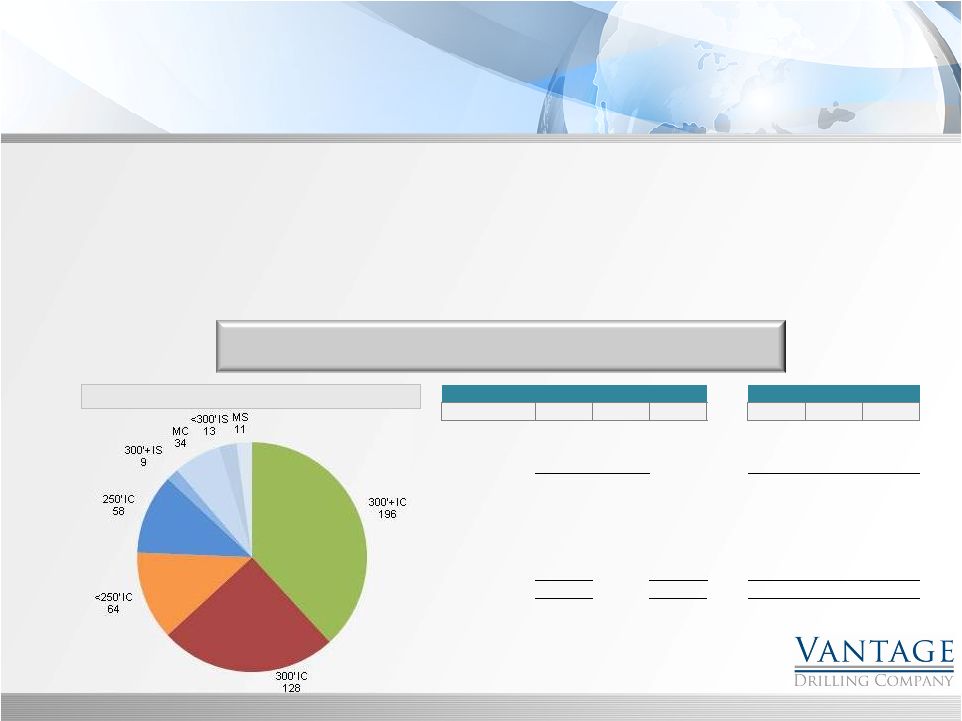
Source: IHS Petrodata
Global Jackup Fleet Distribution
Profile of Global Jackup Fleet
8
Despite 173 newbuild deliveries since 2005, majority of worldwide jackup
fleet remains older than 25 years
Age
Rigs
%
%
300+
200-299
<200
25 years or older
309
60%
47%
149
112
48
10 to 24 years
31
6%
5%
29
1
1
0 to 9 years
173
34%
27%
156
10
7
513
100%
334
123
56
2014 Deliveries
39
6%
36
2
1
2015 Deliveries
61
9%
59
2
0
2016 Deliveries
33
5%
33
0
0
2017 Deliveries
5
1%
5
0
0
651
100%
467
127
57
Age of Jackup Fleet
Water Depth (feet)
–
17% of today’s jackups are mat-supported and/or have less
than 200ft of water depth capability –
60% of today’s jackups are 25 years or older
–
As
of
February
2014
a
total
of
51rigs
were
either
ready
stacked,
cold
stacked,
or
in
an
accommodation
mode
without
contract
–
How many will not return to service? |
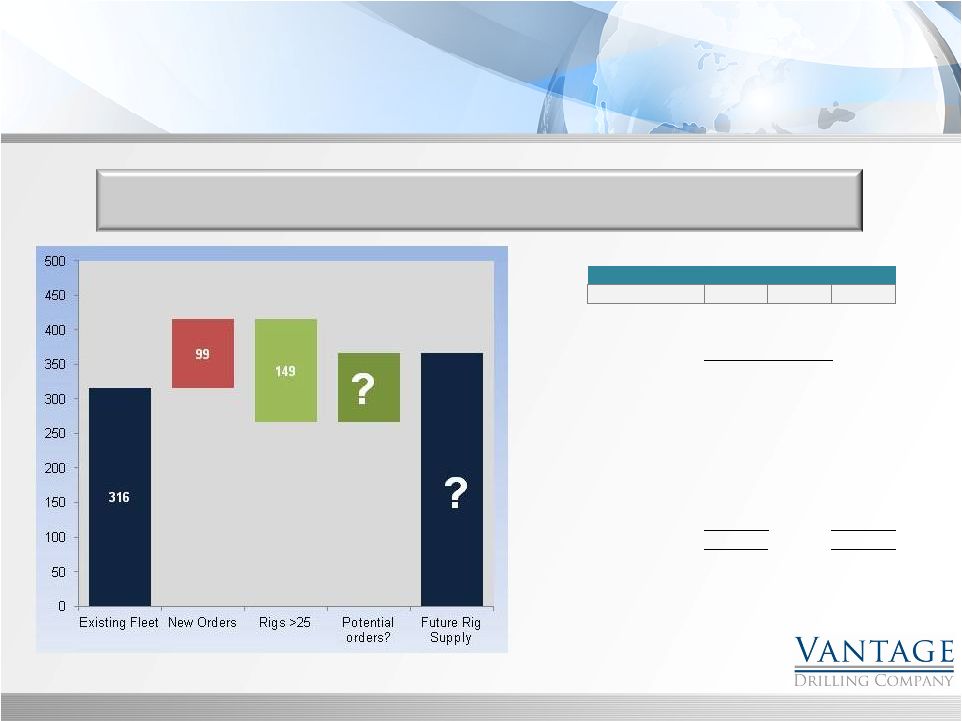 Supply of High Specification Floaters
9
Age
Rigs
%
%
25 years or older
149
47%
36%
10 to 24 years
46
15%
11%
0 to 9 years
121
38%
29%
316
100%
2014 Deliveries
31
7%
2015 Deliveries
27
7%
2016 Deliveries
21
5%
2017 Deliveries
7
2%
2018 Deliveries
8
2%
2019 Deliveries
4
1%
2020 Deliveries
1
0%
415
100%
Age of Floater Fleet
Bifurcation
will
drive
cold
stacking
and
retirements.
Nearly
half
of
the
deepwater
and ultra-deepwater combined fleet is 25 years of age or older.
Source: IHS Petrodata |
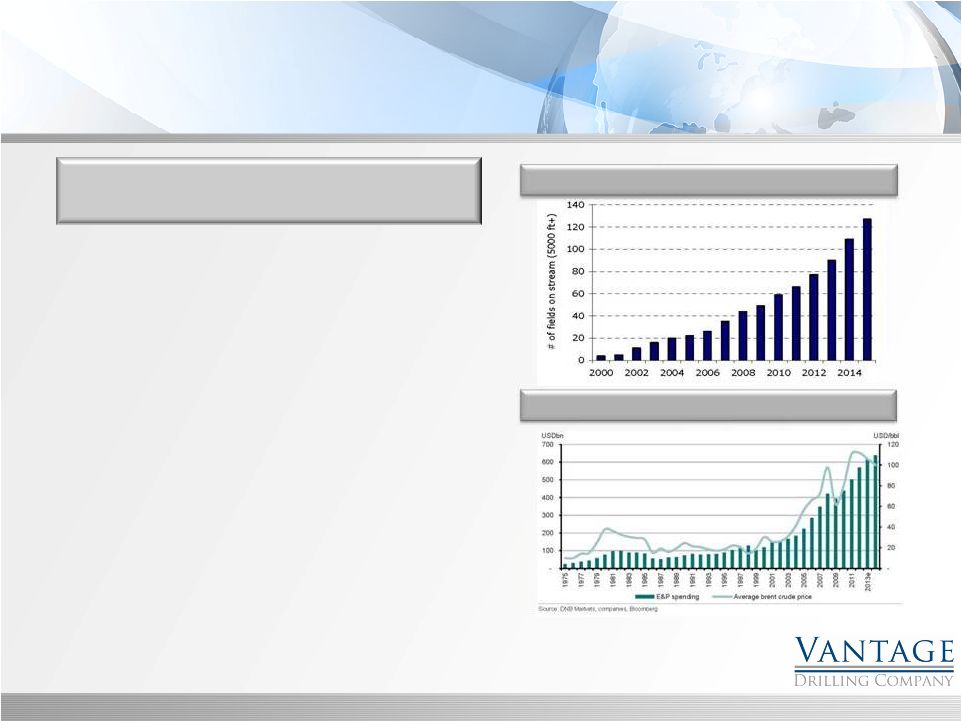 Market Conditions
Long-term Opportunities
•
Global demand for oil & gas continues
growth driven by emerging economies
with long-term forecast for increase E&P
spending.
•
Success in deepwater and ultra-deepwater
exploration should provide the map to
future growth as developmental drilling
increases rig demand.
•
Customers prefer high-specification rigs
due to greater reliability and performance.
With 160 floaters and 216 jackups older
than 30 years of age, there is a significant
opportunity for rig replacement.
10
Continued Growth Cycle
Continued E&P Spending Growth |
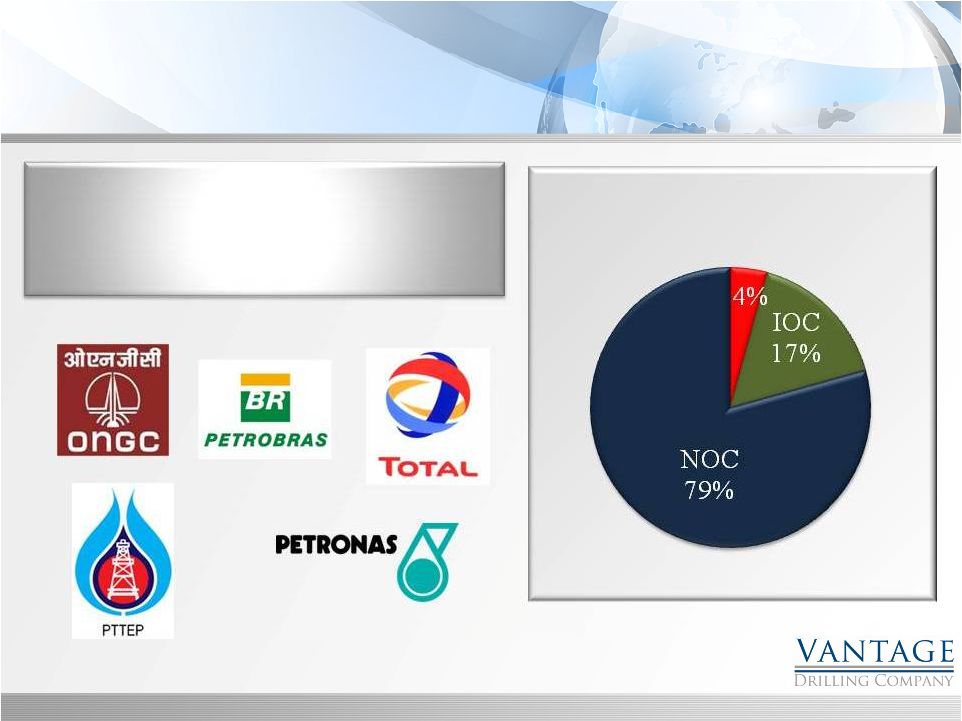
 Market Conditions
Short-term Headwinds
•
Shift in global spending to national oil
companies increases contracting time.
•
North American and European E&P
companies facing wave of shareholder
activism impacting capital allocations
(dividends & share repurchases versus
E&P spending).
•
Confidence in oil and gas demand growth
negatively impacted by emerging
economy liquidity concerns.
•
Large order book of rigs 123 jackups and
93 floaters –
the timing of rigs coming into
the market creates dayrate volatility.
11 |
 Strong Customer Backlog
12
We have focused our marketing efforts on
customers with long-term drilling requirements
with the opportunity for long-term contracts.
$2.8 Billion of backlog with
strong customer base: |
 (1)
Average
drilling
revenue
per
day
is
based
on
the
total
estimated
revenue
divided
by
the
minimum
number
of
days
committed
in
a
contract.
Unless
otherwise
noted,
the
total
revenue
includes
any
mobilization
and demobilization fees and other contractual revenues associated with the drilling
services. (2)
The drilling revenue per day includes the achievement of the 12.5% bonus
opportunity, but excludes mobilization revenues included in the contract.
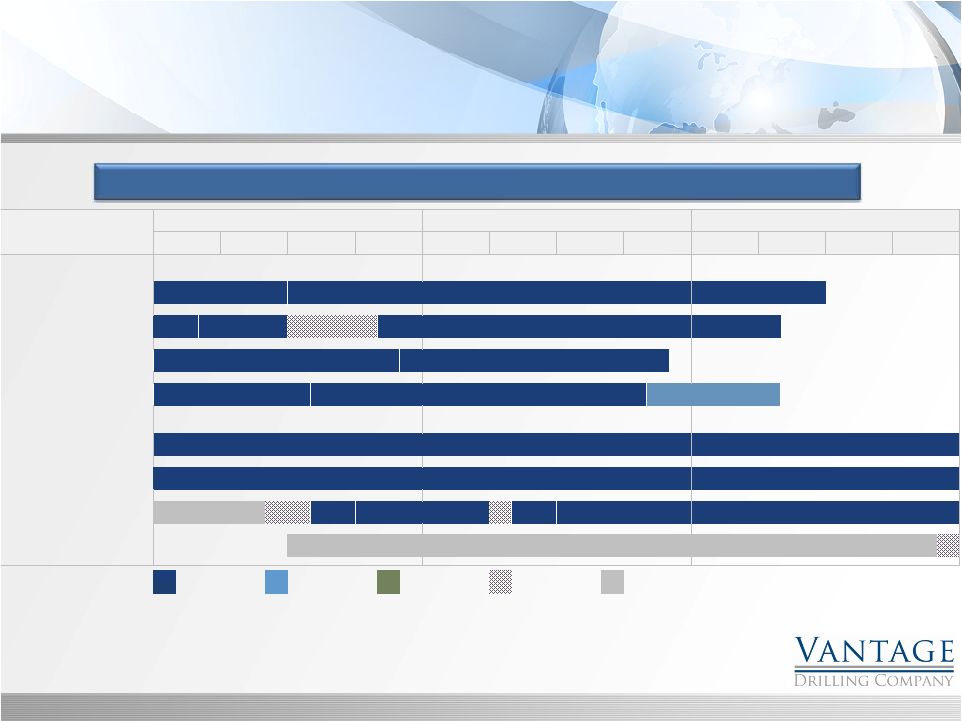
Fleet Status
13
Customer
backlog
of
approximately
$2.8
Billion
provides
visibility
to
cash
flows
Ownership
2013
2014
2015
Rig
%
Q1
Q2
Q3
Q4
Q1
Q2
Q3
Q4
Q1
Q2
Q3
Q4
Jackups
Emerald Driller
100%
$130,000
$156,000 (2 years)
Sapphire Driller
100%
$120,000
$165,000 (net)
$183,000 (18 months)
Aquamarine Driller
100%
$153,000
$155,000
Topaz Driller
100%
$155,000
$155,000
$155,000 (6 mos. - Indonesia)
Drillships
Platinum Explorer
100%
$590,000 (5 years)
Titanium Explorer
(2)
100%
$585,000 (8 years)
Tungsten Explorer
100%
5 wells (175 days)
60 days
$641,000 (2 years firm)
Cobalt Explorer
100%
Contracted
Option
Letter of Award;
Commisioning /
Construction
Contract
subject to conditions
Mobilization |
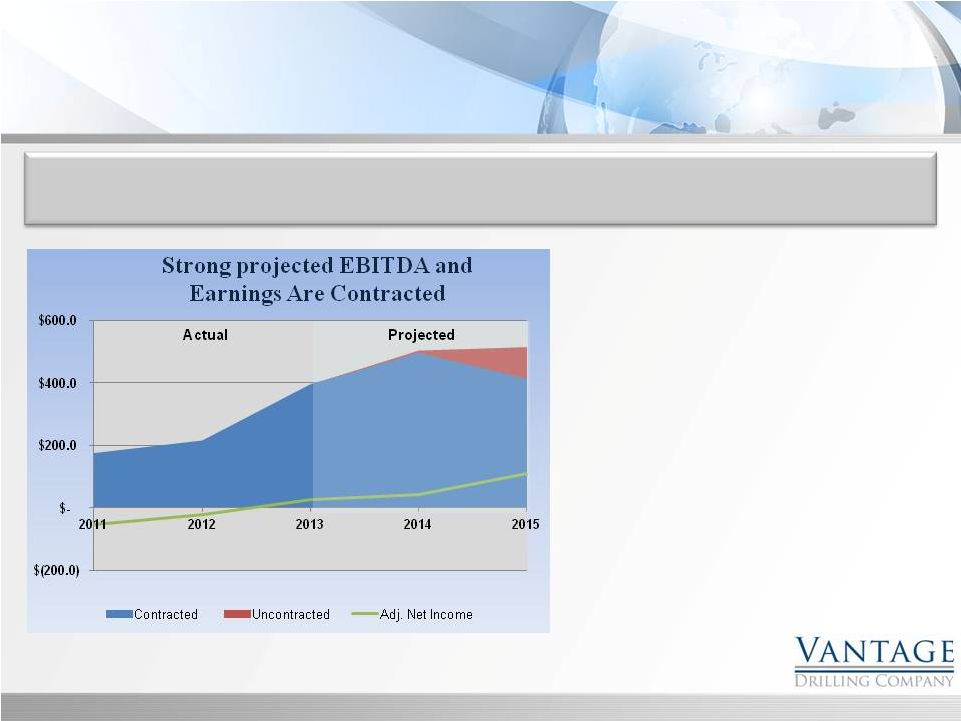 Progress on Financial Targets
14
Long-term contracts provide visibility to cash flow to support our
leverage reduction objectives.
•
4
quarter 2013, with our 7 operational
assets all working, we expect to report
record Revenue, EBITDA and Income
from Operations.
•
We are on target to achieve our goal of
11.0+% Return on Capital Employed in
2014.
•
We have made substantial progress
towards achieving our Net Debt to
EBITDA goal of 5.0X.
•
EBITDA and EPS will be significantly
impacted by mobilizations and potential
client requested upgrade projects:
•
We expect to be compensated for
all of the days and upgrade costs.
•
Should not impact our debt
paydown objectives.
th |
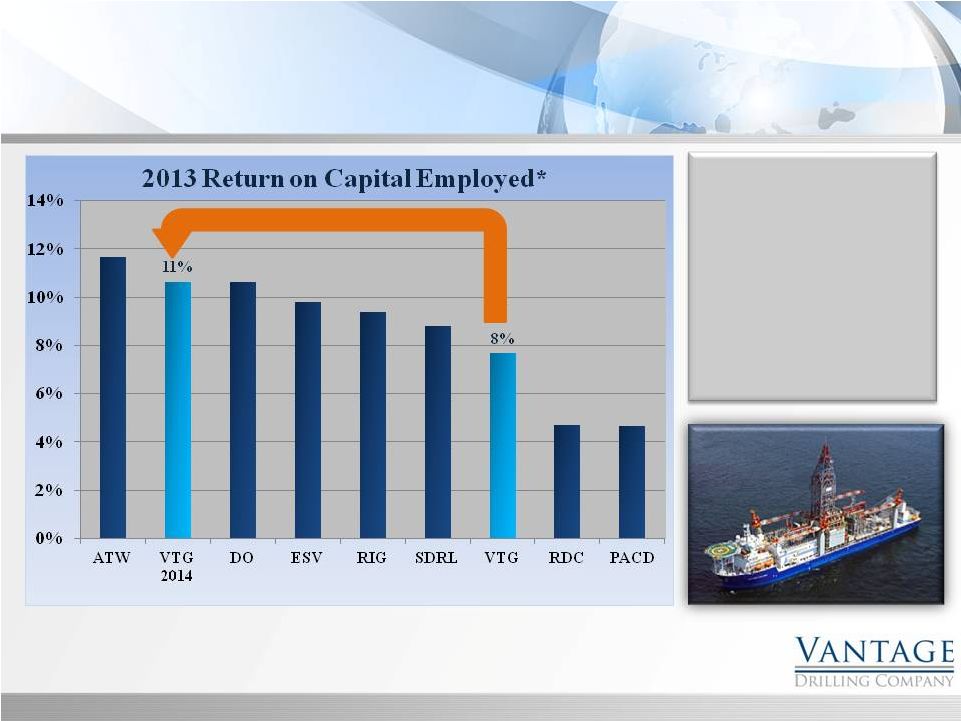 Return on Capital Employed
15
Strong operational
performance from our
first 7 rigs, now fully
deployed, will lead to
industry leading Return on
Capital Employed
(ROCE).
2014 Target: 11+%.
* Based on Last-Twelve-Months reported. |
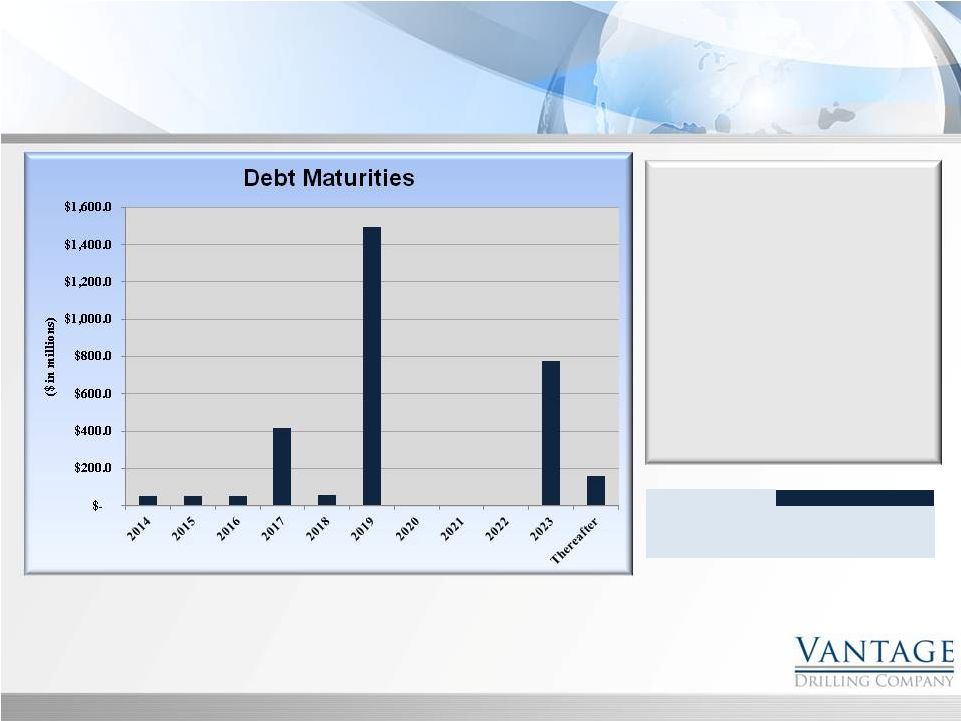 Debt Maturities and Leverage
16
•
No
significant
debt
maturities
until
2017.
•
Cash
flow
from
operations
projected
to
cover
all
debt
service
through
2018.
•
Increased
leverage
over
last
2
years
has
been
to
fund
deployment
of
Titanium
Explorer
and
Tungsten
Explorer.
•
As
current
fleet
is
all
working,
leverage
will
rapidly
decline
–
on
target
for
yearend
2014
leverage
of
5.0
X
EBITDA.
2011
2012
2013
Long-term Debt
1,246.4
$
2,710.6
2,852.1
LT Debt/LTM EBITDA
7.1
X
12.6X
7.8X
LT Debt/4th QTR EBITDA (annualized)
5.5X |
 HISTORICAL FINANCIAL
Appendix |
 Balance Sheet
The Debt to EBITDA leverage
ratio will continue to reduce as
Vantage reports a full year of
operations from the Titanium
Explorer (December 2012) and
the Tungsten Explorer
(September 2013)
18
($ in millions)
December 31,
December 31,
2011
2012
31-Mar-13
30-Jun-13
30-Sep-13
Cash and cash equivalents
117.0
$
506.2
$
460.5
$
443.8
$
71.1
$
Trade receivables
100.9
119.5
101.9
107.9
144.9
Inventory, prepaids & other
41.3
63.1
62.1
64.8
65.9
Total current assets
259.2
688.8
624.5
616.5
281.9
Property and Equipment
1,805.1
2,717.5
2,711.2
2,719.2
3,207.2
Other assets
58.2
123.9
119.9
125.4
128.7
Total assets
2,122.5
$
3,530.2
$
3,455.6
$
3,461.1
$
3,617.8
$
Accounts payable and accruals
150.2
$
174.4
127.5
133.1
176.8
Revolving Credit Agreement
-
-
-
-
10.0
Current maturities
-
31.2
41.0
47.3
53.5
Total current liabilities
150.2
205.6
168.5
180.4
240.3
Long-term debt
1,246.4
2,710.6
2,796.3
2,784.8
2,862.5
Other long-term liabilities
29.8
45.5
43.4
42.7
41.5
Shareholders equity
696.1
568.5
447.4
453.2
473.5
Total liabilities and shareholders' equity
2,122.5
$
3,530.2
$
3,455.6
$
3,461.1
$
3,617.8
$
Long-term Debt/LTM EBITDA
7.1
X
12.6
X
12.6
X
10.7
X
9.9
X
For the Quarter Ended |
 Statement of Operations
19
Net income and cash flow from
operations is increasing
significantly for Vantage as the
Tungsten
Explorer
commenced
operations in September 2013.
($ in millions)
December 31,December 31,
2011
2012
31-Mar-13
30-Jun-13
30-Sep-13
REVENUE
Contract Drilling Services
366.8
$
423.8
$
134.7
$
155.8
$
158.9
$
Management Fees
13.7
6.6
3.2
2.4
3.9
Reimbursables
105.3
41.0
9.1
12.4
13.1
Total revenues
485.8
471.4
147.0
170.6
175.9
OPERATING COSTS AND EXPNSES
Operating Costs
284.9
230.1
75.3
77.1
84.1
General and Administrative
26.3
26.0
7.4
7.0
8.9
Depreciation
64.5
68.7
24.9
25.0
24.9
Total operating expenses
375.7
324.8
107.6
109.1
117.9
INCOME FROM OPERATIONS
110.1
146.6
39.4
61.5
58.0
OTHER INCOME (EXPENSE)
Interest Income
0.1
0.1
0.1
0.1
-
Interest Expense and Financing
(154.9)
(149.1)
(59.7)
(51.3)
(47.4)
Loss on Debt Extinguishment
(25.2)
(124.6)
(98.3)
-
-
Other Income
1.3
0.6
0.9
1.0
0.3
Total other expenses
(178.7)
(273.0)
(157.0)
(50.2)
(47.1)
INCOME (LOSS) BEFORE TAX
(68.6)
(126.4)
(117.6)
11.3
10.9
INCOME TAX PROVISION
11.4
18.9
5.6
7.1
4.1
Net income (loss)
(80.0)
$
(145.3)
$
(123.2)
$
4.2
$
6.8
$
INCOME (LOSS) PER SHARE
(0.28)
$
(0.50)
$
(0.41)
$
0.01
$
0.02
$
PRO FORMA INCOME (LOSS) PER SHARE
(0.19)
$
(0.07)
$
(0.08)
$
0.01
$
0.02
$
EBITDA
174.7
$
215.3
$
64.3
$
86.5
$
83.0
$
LTM EBITDA
174.7
$
215.3
$
222.3
$
260.4
$
290.3
$
For the Quarter Ended |
 EBITDA Reconciliation
20
($ in millions)
December 31,
December 31,
2011
2012
31-Mar-13
30-Jun-13
30-Sep-13
Net Income (Loss)
(80.0)
$
(145.3)
$
(123.2)
$
4.2
$
6.8
$
Interest Expense, Net
154.8
149.0
59.6
51.2
47.4
Income Tax Provision
11.4
18.9
5.6
7.1
4.1
Depreciation
64.5
68.7
24.9
25.0
24.9
Loss on Debt Extinguishment
25.2
124.6
98.3
-
-
Other
(1.2)
(0.6)
(0.9)
(1.0)
(0.2)
EBITDA
174.7
$
215.3
$
64.3
$
86.5
$
83.0
$
For the Quarter Ended |