Attached files
| file | filename |
|---|---|
| 8-K - 8-K - TrueBlue, Inc. | a2014q1ir8-k.htm |

Q1 2014 INVESTOR PRESENTATION The Leader in Blue-Collar Staffing
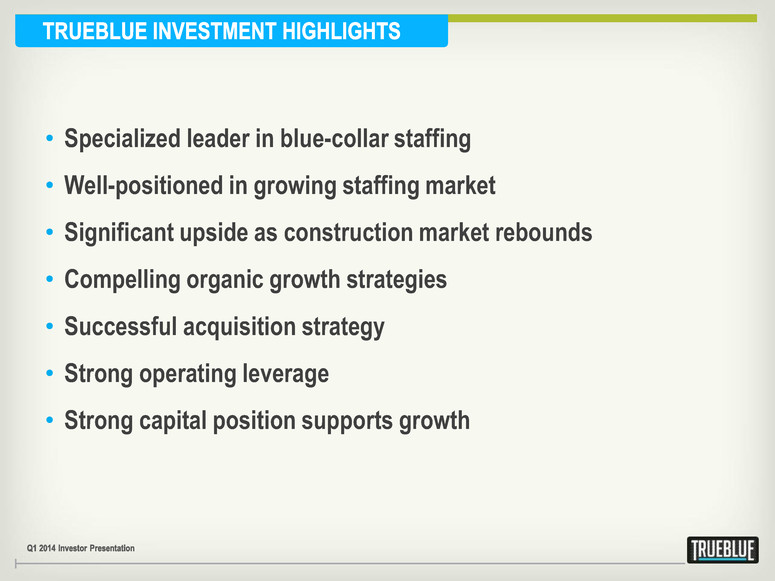
• Specialized leader in blue-collar staffing • Well-positioned in growing staffing market • Significant upside as construction market rebounds • Compelling organic growth strategies • Successful acquisition strategy • Strong operating leverage • Strong capital position supports growth

TrueBlue offers a full-range of specialized blue-collar staffing solutions to industries that include construction, manufacturing, transportation, aviation, wholesale, waste, hospitality and services, retail, energy, and more.
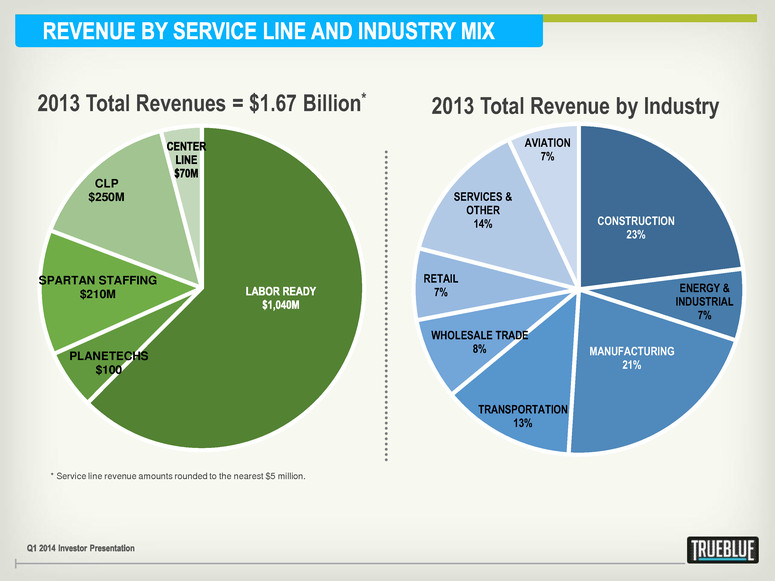
PLANETECHS $100 SPARTAN STAFFING $210M CLP $250M 2013 Total Revenues = $1.67 Billion* * Service line revenue amounts rounded to the nearest $5 million. CONSTRUCTION 23% ENERGY & INDUSTRIAL 7% MANUFACTURING 21% TRANSPORTATION 13% WHOLESALE TRADE 8% RETAIL 7% SERVICES & OTHER 14% AVIATION 7% 2013 Total Revenue by Industry
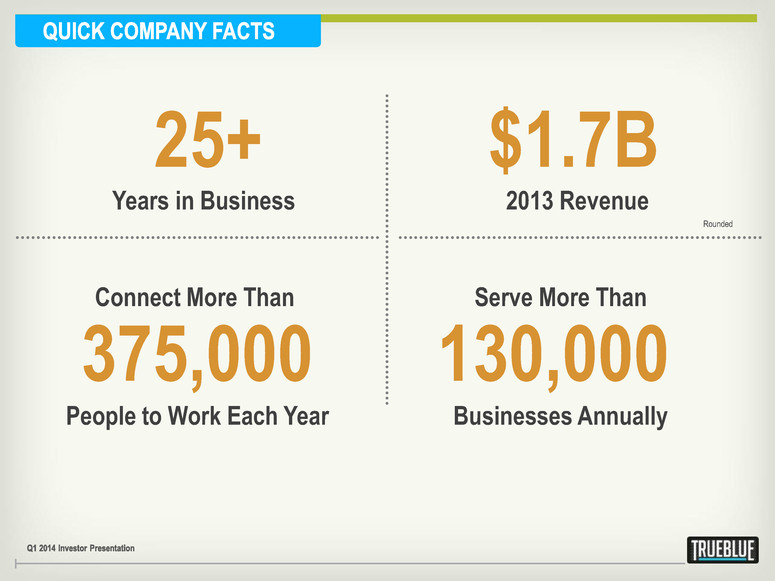
25+ $1.7B Years in Business 2013 Revenue 375,000 Connect More Than People to Work Each Year 130,000 Serve More Than Businesses Annually Rounded
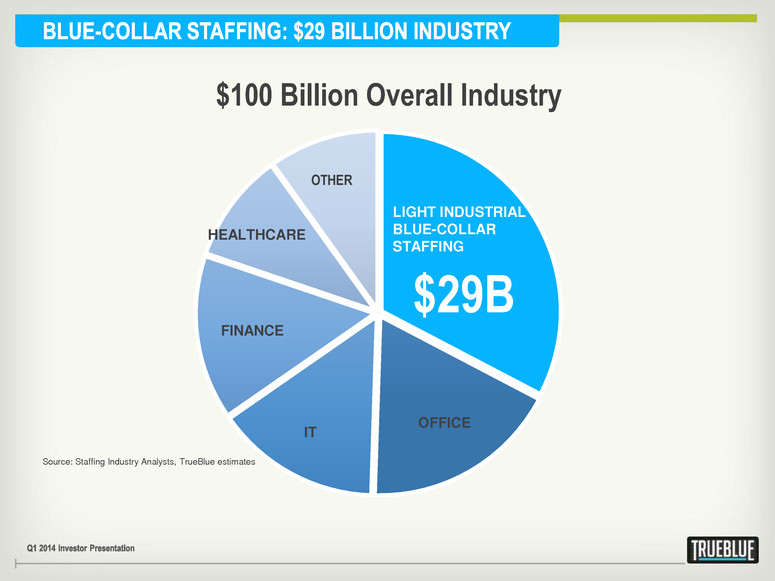
$100 Billion Overall Industry $29B OFFICE IT FINANCE HEALTHCARE OTHER LIGHT INDUSTRIAL BLUE-COLLAR STAFFING Source: Staffing Industry Analysts, TrueBlue estimates
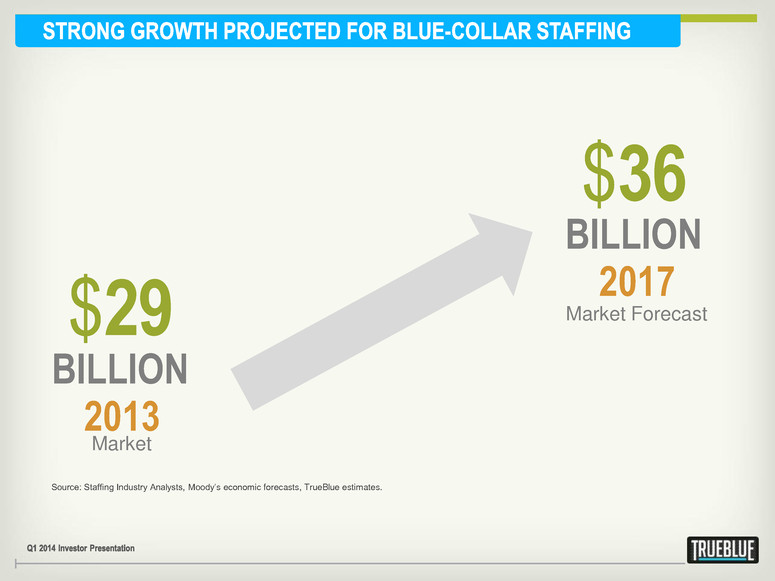
Source: Staffing Industry Analysts, Moody’s economic forecasts, TrueBlue estimates. 2013 2017 $36 BILLION $29 BILLION Market Market Forecast
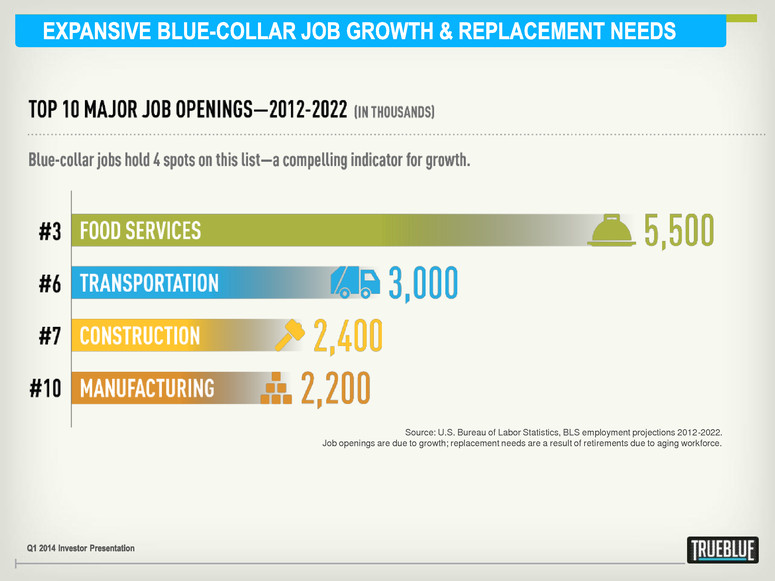
Source: U.S. Bureau of Labor Statistics, BLS employment projections 2012-2022. Job openings are due to growth; replacement needs are a result of retirements due to aging workforce.
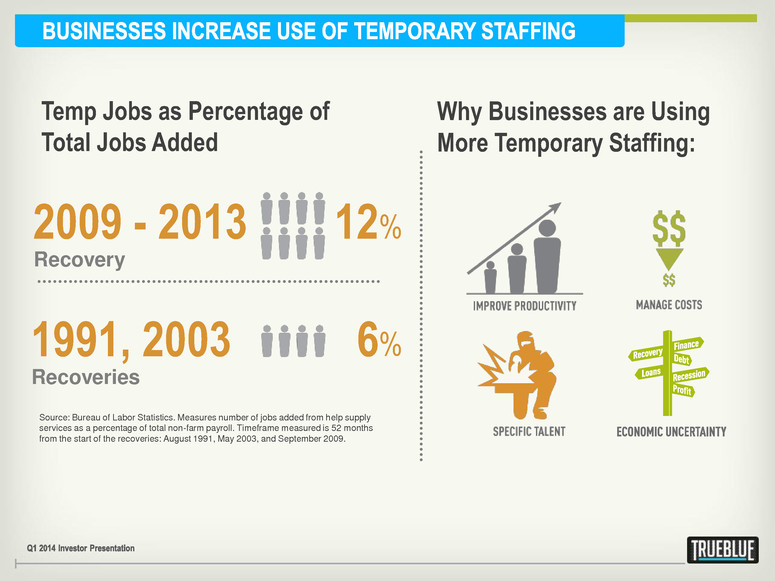
Why Businesses are Using More Temporary Staffing: Source: Bureau of Labor Statistics. Measures number of jobs added from help supply services as a percentage of total non-farm payroll. Timeframe measured is 52 months from the start of the recoveries: August 1991, May 2003, and September 2009. Temp Jobs as Percentage of Total Jobs Added 1991, 2003 Recoveries 6% 2009 - 2013 Recovery 12%
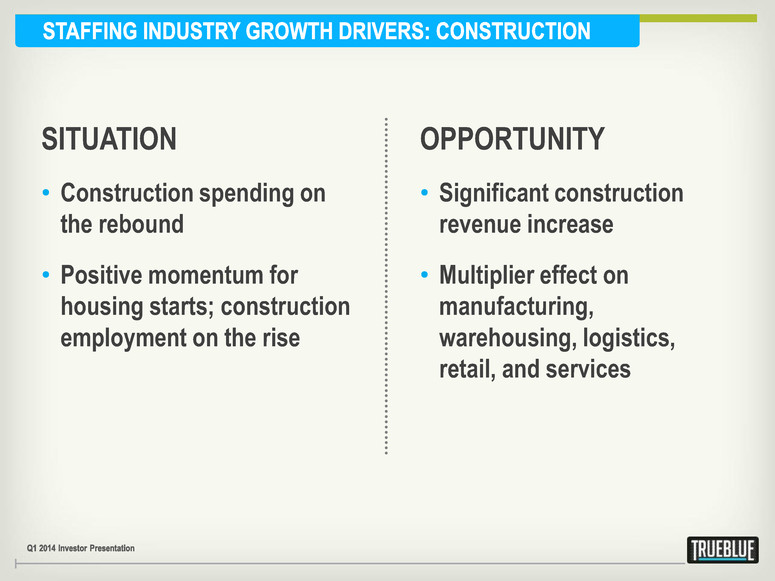
SITUATION • Construction spending on the rebound • Positive momentum for housing starts; construction employment on the rise OPPORTUNITY • Significant construction revenue increase • Multiplier effect on manufacturing, warehousing, logistics, retail, and services
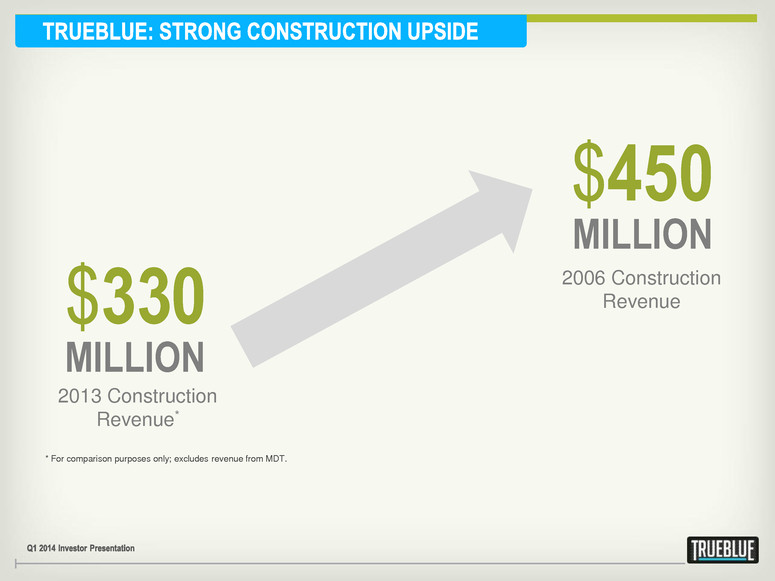
$450 MILLION $330 MILLION 2013 Construction Revenue* 2006 Construction Revenue * For comparison purposes only; excludes revenue from MDT.
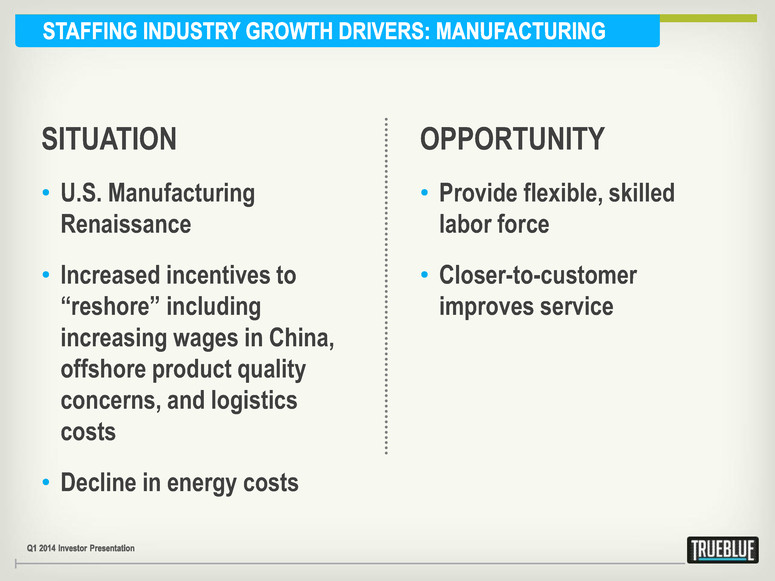
SITUATION • U.S. Manufacturing Renaissance • Increased incentives to “reshore” including increasing wages in China, offshore product quality concerns, and logistics costs • Decline in energy costs OPPORTUNITY • Provide flexible, skilled labor force • Closer-to-customer improves service
SITUATION • High driver turnover • New safety regulations create need for more drivers • 100,000 new drivers needed per year, over the next 10 years* OPPORTUNITY • Access to hard-to-find talent • Safety and compliance leadership • Flexible recruiting model • Logistics company partnerships * Source: The American Trucking Association
SITUATION • Growing energy independence • Skilled worker shortages • More than 100,000 new jobs in the solar industry by 2016* OPPORTUNITY • Deliver and manage skilled work force in remote areas • Deep technical knowledge in green industries • Partner with trades schools to fill skilled-worker gap • Business process improvements, not just service features * Source: The Solar Energy Industry Association
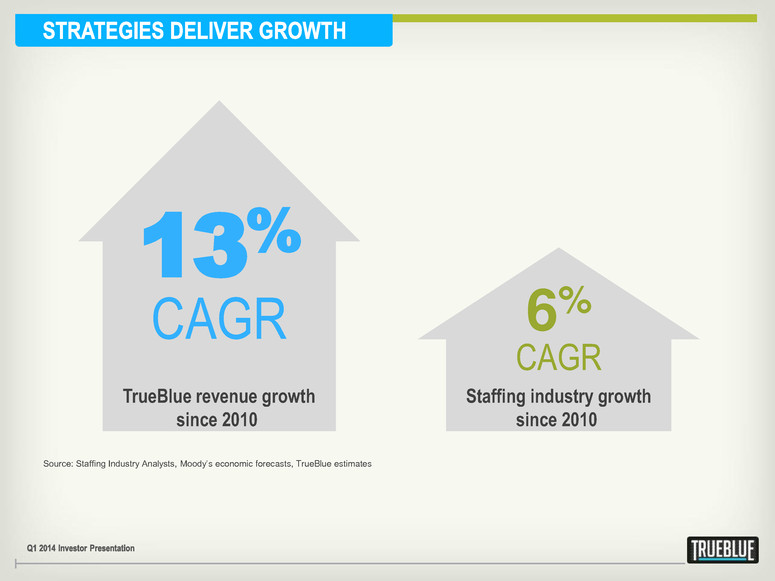
Source: Staffing Industry Analysts, Moody’s economic forecasts, TrueBlue estimates 13% CAGR 6% CAGR TrueBlue revenue growth since 2010 Staffing industry growth since 2010
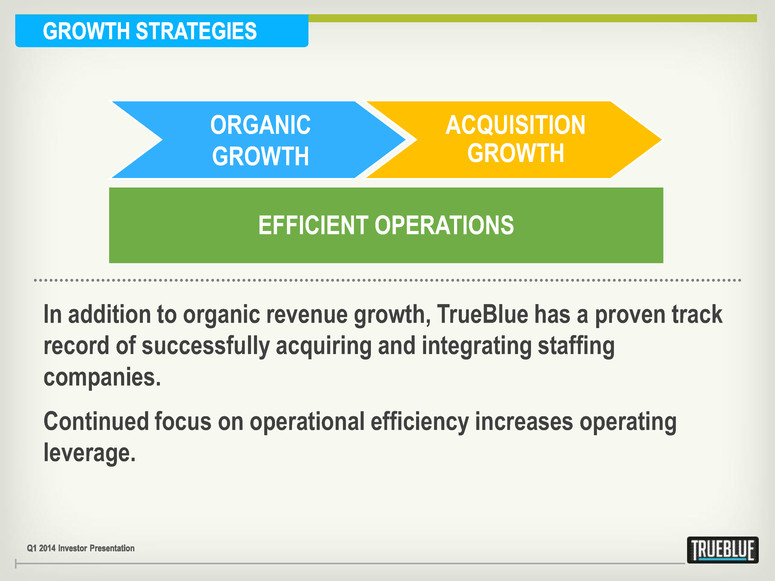
ACQUISITION GROWTH In addition to organic revenue growth, TrueBlue has a proven track record of successfully acquiring and integrating staffing companies. Continued focus on operational efficiency increases operating leverage. ORGANIC GROWTH EFFICIENT OPERATIONS
• Develop new blue-collar service lines • Differentiate through industry specialization • Extend reach through geographic expansion ORGANIC GROWTH
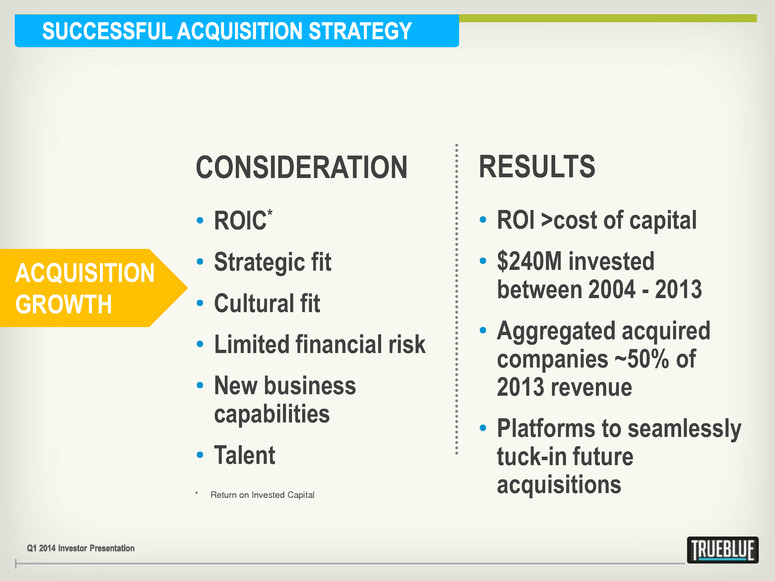
CONSIDERATION • ROIC* • Strategic fit • Cultural fit • Limited financial risk • New business capabilities • Talent RESULTS • ROI >cost of capital • $240M invested between 2004 - 2013 • Aggregated acquired companies ~50% of 2013 revenue • Platforms to seamlessly tuck-in future acquisitions * Return on Invested Capital ACQUISITION GROWTH
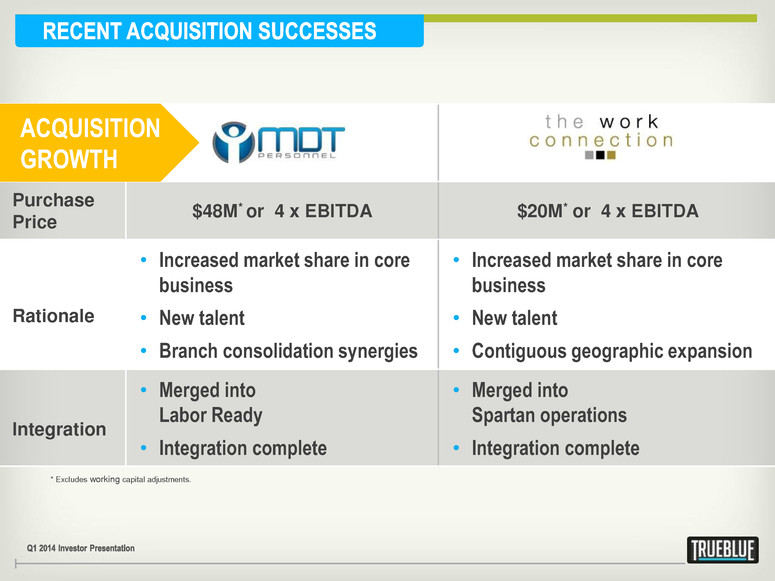
Acquired February 2013 Acquired October 2013 Purchase Price $48M* or 4 x EBITDA $20M* or 4 x EBITDA Rationale • Increased market share in core business • New talent • Branch consolidation synergies • Increased market share in core business • New talent • Contiguous geographic expansion Integration • Merged into Labor Ready • Integration complete • Merged into Spartan operations • Integration complete * Excludes working capital adjustments. ACQUISITION GROWTH
• Reduce physical branch dependency • Increase efficiencies through technology • Centralize services EFFICIENT OPERATION
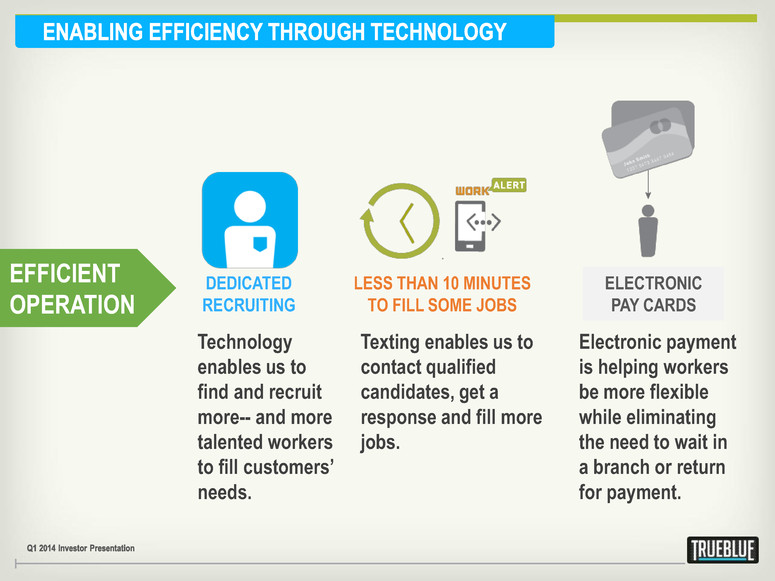
DEDICATED RECRUITING Electronic payment is helping workers be more flexible while eliminating the need to wait in a branch or return for payment. Texting enables us to contact qualified candidates, get a response and fill more jobs. Technology enables us to find and recruit more-- and more talented workers to fill customers’ needs. ELECTRONIC PAY CARDS EFFICIENT OPERATION LESS THAN 10 MINUTES TO FILL SOME JOBS

Financial Review
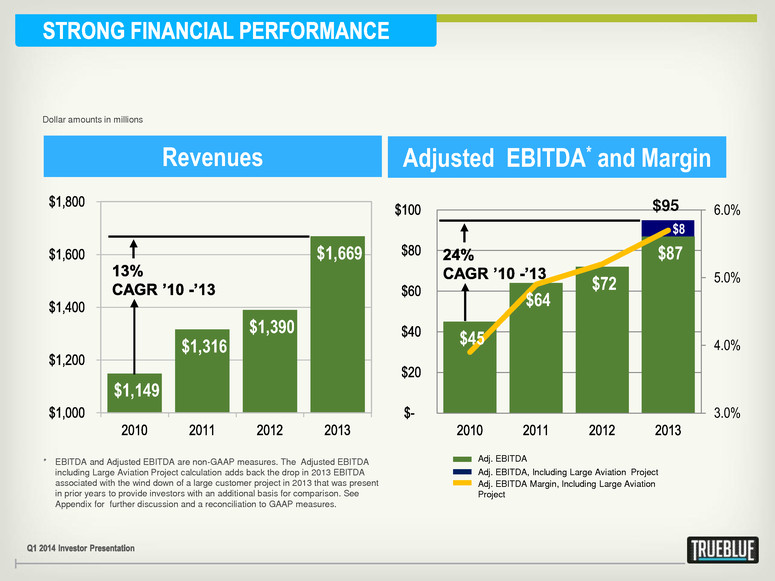
$8 $45 $64 $72 $87 3.0% 4.0% 5.0% 6.0% Revenues Adjusted EBITDA* and Margin * EBITDA and Adjusted EBITDA are non-GAAP measures. The Adjusted EBITDA including Large Aviation Project calculation adds back the drop in 2013 EBITDA associated with the wind down of a large customer project in 2013 that was present in prior years to provide investors with an additional basis for comparison. See Appendix for further discussion and a reconciliation to GAAP measures. $1,149 $1,316 $1,390 $1,669 Dollar amounts in millions $95 Adj. EBITDA Margin, Including Large Aviation Project Adj. EBITDA, Including Large Aviation Project Adj. EBITDA
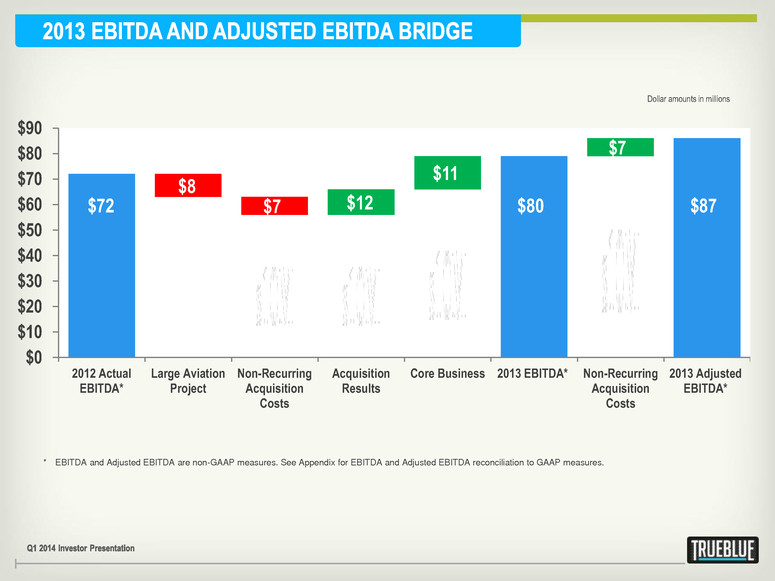
* EBITDA and Adjusted EBITDA are non-GAAP measures. See Appendix for EBITDA and Adjusted EBITDA reconciliation to GAAP measures. $0 $10 $20 $30 $40 $50 $60 $70 $80 $90 2012 Actual EBITDA* Large Aviation Project Non-Recurring Acquisition Costs Acquisition Results Core Business 2013 EBITDA* Non-Recurring Acquisition Costs 2013 Adjusted EBITDA* $72 $8 $80 $87 $7 $7 $11 $12 Dollar amounts in millions
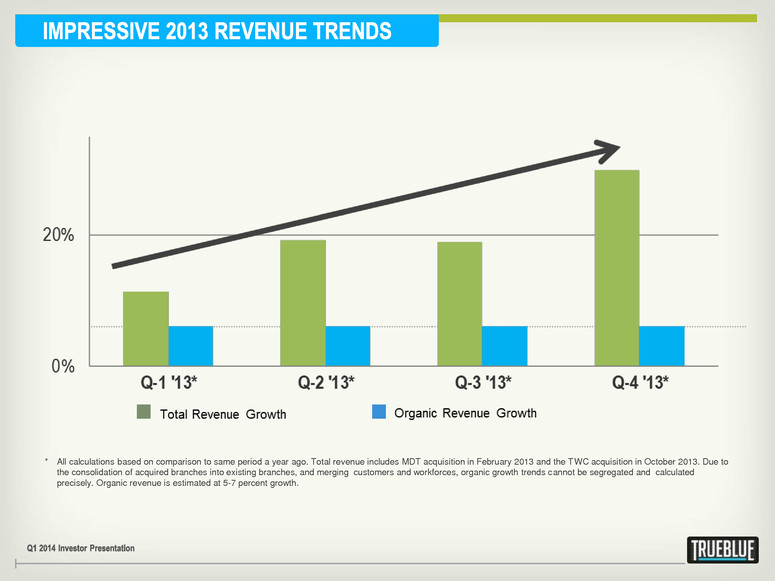
* All calculations based on comparison to same period a year ago. Total revenue includes MDT acquisition in February 2013 and the TWC acquisition in October 2013. Due to the consolidation of acquired branches into existing branches, and merging customers and workforces, organic growth trends cannot be segregated and calculated precisely. Organic revenue is estimated at 5-7 percent growth.
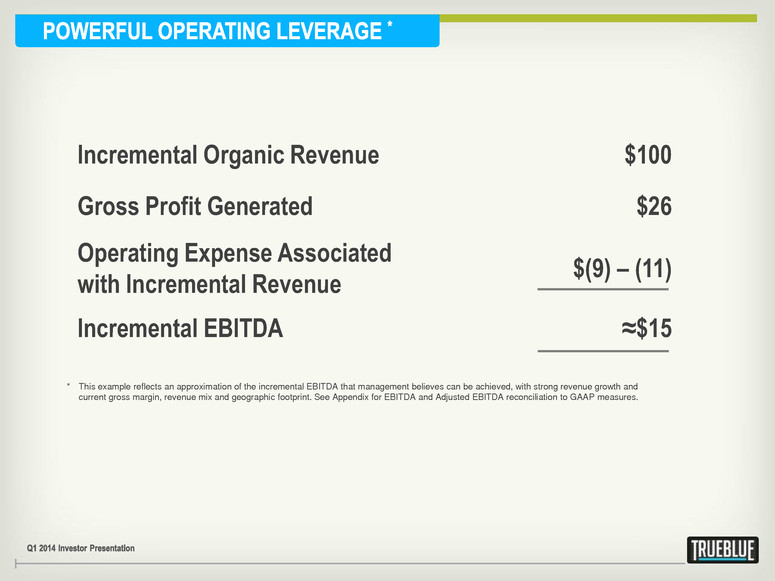
* This example reflects an approximation of the incremental EBITDA that management believes can be achieved, with strong revenue growth and current gross margin, revenue mix and geographic footprint. See Appendix for EBITDA and Adjusted EBITDA reconciliation to GAAP measures. Incremental Organic Revenue $100 Gross Profit Generated $26 Operating Expense Associated with Incremental Revenue $(9) – (11) Incremental EBITDA ≈$15
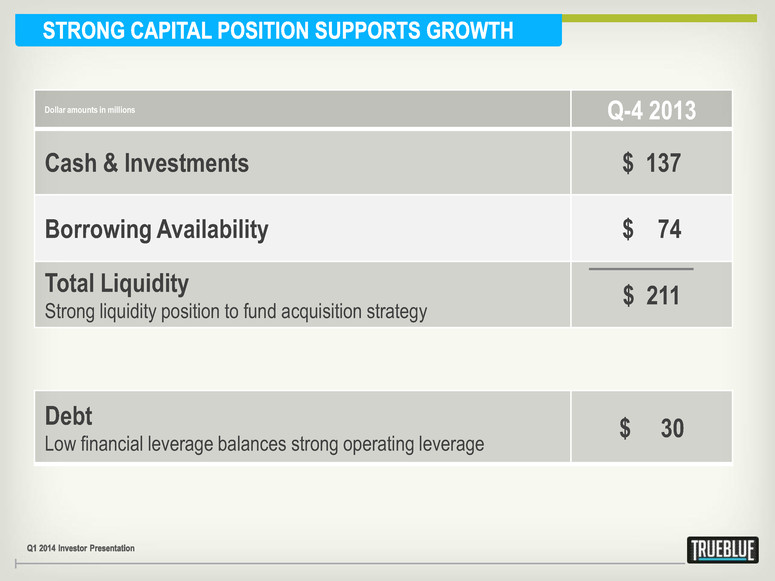
Dollar amounts in millions Q-4 2013 Cash & Investments $ 137 Borrowing Availability $ 74 Total Liquidity Strong liquidity position to fund acquisition strategy $ 211 Debt Low financial leverage balances strong operating leverage $ 30
• Specialized leader in blue-collar staffing • Well-positioned in growing staffing market • Significant upside as construction market rebounds • Compelling organic growth strategies • Successful acquisition strategy • Strong operating leverage • Strong capital position supports growth

Appendix
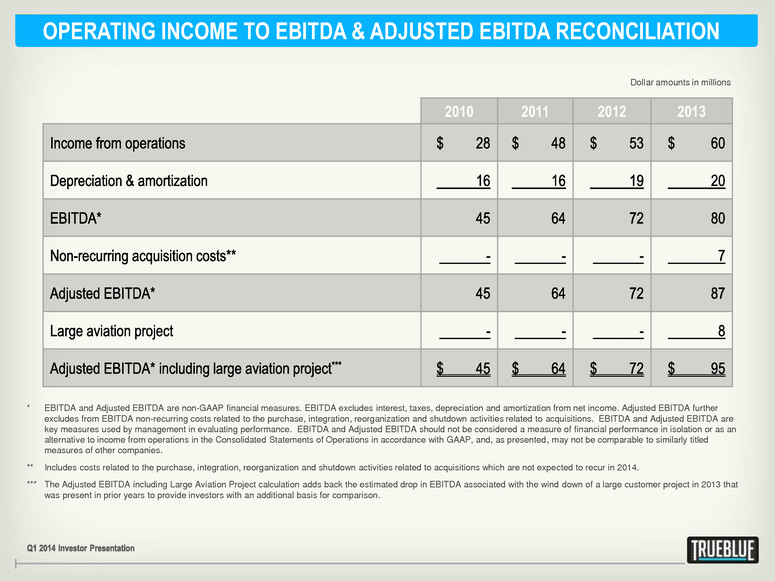
OPERATING INCOME TO EBITDA & ADJUSTED EBITDA RECONCILIATION 2010 2011 2012 2013 * EBITDA and Adjusted EBITDA are non-GAAP financial measures. EBITDA excludes interest, taxes, depreciation and amortization from net income. Adjusted EBITDA further excludes from EBITDA non-recurring costs related to the purchase, integration, reorganization and shutdown activities related to acquisitions. EBITDA and Adjusted EBITDA are key measures used by management in evaluating performance. EBITDA and Adjusted EBITDA should not be considered a measure of financial performance in isolation or as an alternative to income from operations in the Consolidated Statements of Operations in accordance with GAAP, and, as presented, may not be comparable to similarly titled measures of other companies. ** Includes costs related to the purchase, integration, reorganization and shutdown activities related to acquisitions which are not expected to recur in 2014. *** The Adjusted EBITDA including Large Aviation Project calculation adds back the estimated drop in EBITDA associated with the wind down of a large customer project in 2013 that was present in prior years to provide investors with an additional basis for comparison. Dollar amounts in millions
