Attached files
| file | filename |
|---|---|
| 8-K - 8-K - BLACKSTONE MORTGAGE TRUST, INC. | d676229d8k.htm |
| EX-99.1 - EX-99.1 - BLACKSTONE MORTGAGE TRUST, INC. | d676229dex991.htm |
Exhibit 99.2
|
|
Blackstone Mortgage Trust, Inc.
Full Year and Fourth Quarter 2013 Results
February 18, 2014
|
|
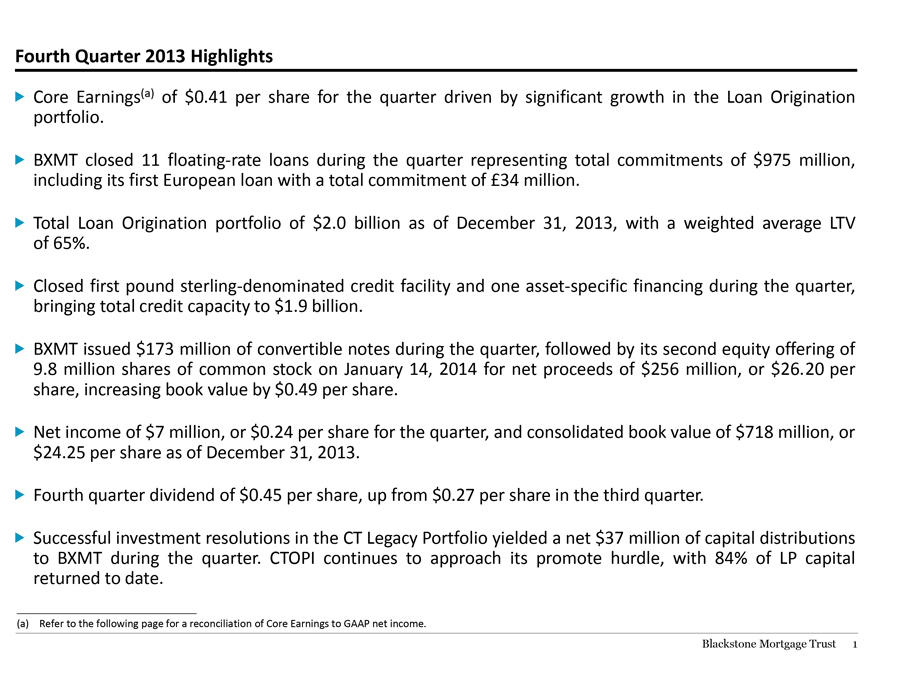
Fourth Quarter 2013 Highlights
Core Earnings(a) of $0.41 per share for the quarter driven by significant growth in the Loan Origination portfolio.
BXMT closed 11 floating-rate loans during the quarter representing total commitments of $975 million, including its first European loan with a total commitment of £34 million.
Total Loan Origination portfolio of $2.0 billion as of December 31, 2013, with a weighted average LTV of 65%.
Closed first pound sterling-denominated credit facility and one asset-specific financing during the quarter, bringing total credit capacity to $1.9 billion.
BXMT issued $173 million of convertible notes during the quarter, followed by its second equity offering of 9.8 million shares of common stock on January 14, 2014 for net proceeds of $256 million, or $26.20 per share, increasing book value by $0.49 per share.
Net income of $7 million, or $0.24 per share for the quarter, and consolidated book value of $718 million, or $24.25 per share as of December 31, 2013.
Fourth quarter dividend of $0.45 per share, up from $0.27 per share in the third quarter.
Successful investment resolutions in the CT Legacy Portfolio yielded a net $37 million of capital distributions to BXMT during the quarter. CTOPI continues to approach its promote hurdle, with 84% of LP capital returned to date.
(a) Refer to the following page for a reconciliation of Core Earnings to GAAP net income. Blackstone Mortgage Trust 1
|
|
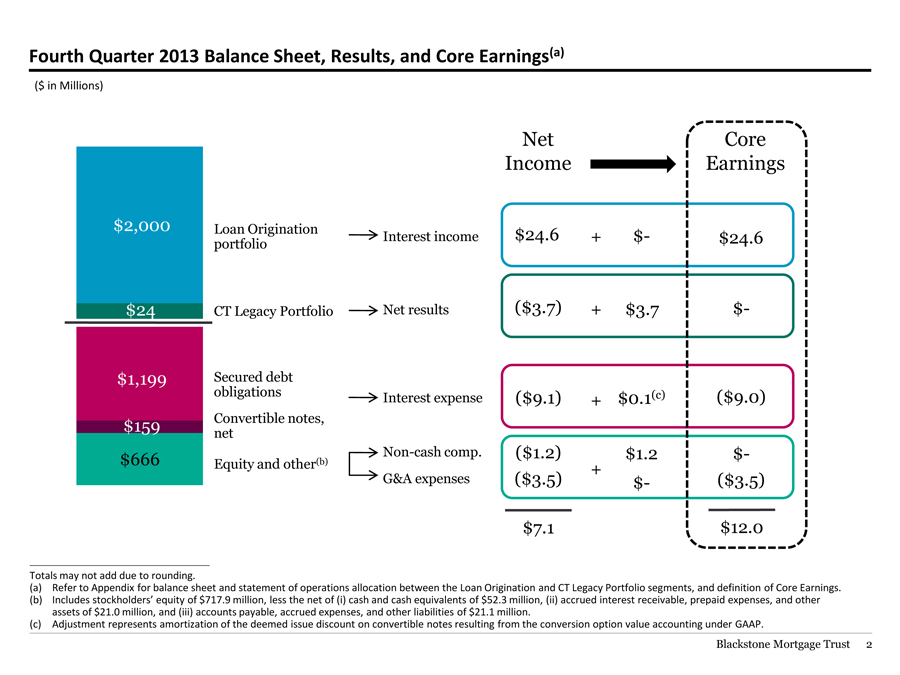
Fourth Quarter 2013 Balance Sheet, Results, and Core Earnings(a)
($ in Millions)
Net Core
Income Earnings
$2,000 Loan Origination Interest income $24.6 + $- $24.6
portfolio
$24 CT Legacy Portfolio Net results ($3.7) + $3.7 $-
$1,199 Secured debt
obligations Interest expense ($9.1) + $0.1(c) ($9.0)
$159 Convertible notes,
net
$666 Equity and other(b) Non-cash comp. ($1.2) $1.2 $-
+
G&A expenses ($3.5) $- ($3.5)
$7.1 $12.0
Totals may not add due to rounding.
(a) Refer to Appendix for balance sheet and statement of operations allocation between the Loan Origination and CT Legacy Portfolio segments, and definition of Core Earnings.
(b) Includes stockholders’ equity of $717.9 million, less the net of (i) cash and cash equivalents of $52.3 million, (ii) accrued interest receivable, prepaid expenses, and other assets of $21.0 million, and (iii) accounts payable, accrued expenses, and other liabilities of $21.1 million.
(c) Adjustment represents amortization of the deemed issue discount on convertible notes resulting from the conversion option value accounting under GAAP.
Blackstone Mortgage Trust 2
|
|
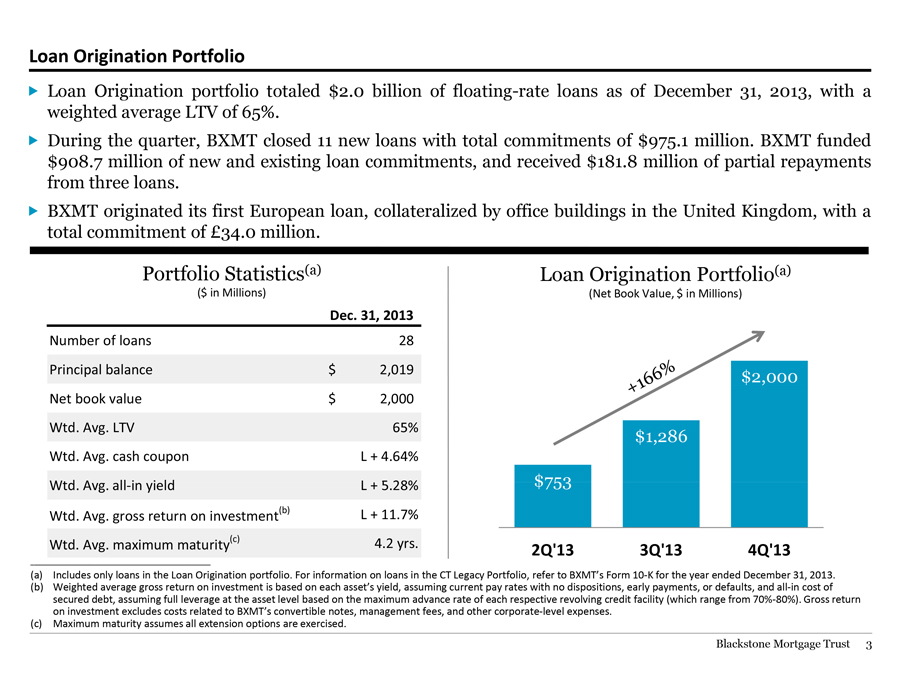
Loan Origination Portfolio
Loan Origination portfolio totaled $2.0 billion of floating-rate loans as of December 31, 2013, with a weighted average LTV of 65%.
During the quarter, BXMT closed 11 new loans with total commitments of $975.1 million. BXMT funded $908.7 million of new and existing loan commitments, and received $181.8 million of partial repayments from three loans.
BXMT originated its first European loan, collateralized by office buildings in the United Kingdom, with a total commitment of £34.0 million.
Portfolio Statistics(a)
($ in Millions)
Dec. 31, 2013
Number of loans 28
Principal balance $ 2,019
Net book value $ 2,000
Wtd. Avg. LTV 65%
Wtd. Avg. cash coupon L + 4.64%
Wtd. Avg. all-in yield L + 5.28%
Wtd. Avg. gross return on investment(b) L + 11.7%
Wtd. Avg. maximum maturity(c) 4.2 yrs.
Loan Origination Portfolio(a)
(Net Book Value, $ in Millions)
$2,000
$1,286
$753
2Q’13 3Q’13 4Q’13 +166%
(a) Includes only loans in the Loan Origination portfolio. For information on loans in the CT Legacy Portfolio, refer to BXMT’s Form 10-K for the year ended December 31, 2013.
(b) Weighted average gross return on investment is based on each asset’s yield, assuming current pay rates with no dispositions, early payments, or defaults, and all-in cost of secured debt, assuming full leverage at the asset level based on the maximum advance rate of each respective revolving credit facility (which range from 70%-80%). Gross return on investment excludes costs related to BXMT’s convertible notes, management fees, and other corporate-level expenses.
(c) Maximum maturity assumes all extension options are exercised.
Blackstone Mortgage Trust 3
|
|
Portfolio Diversification
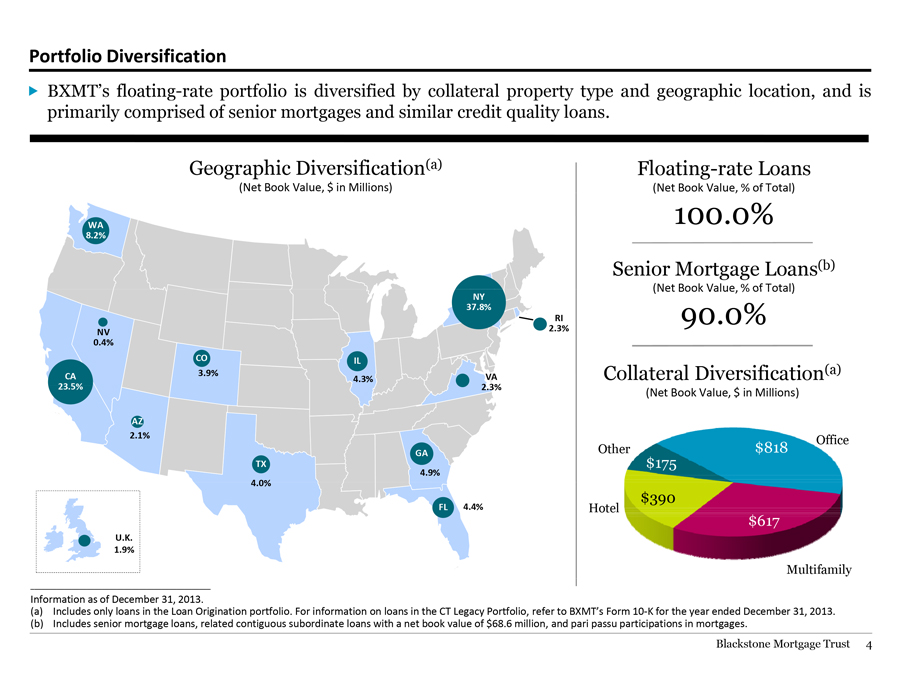
BXMT’s floating-rate portfolio is diversified by collateral property type and geographic location, and is primarily comprised of senior mortgages and similar credit quality loans.
Geographic Diversification(a)
(Net Book Value, $ in Millions)
WA 8.2%
NY 37.8%
RI 2.3%
NV 0.4%
CA 23.5%
CO 3.9%
IL 4.3%
VA 2.3%
AZ 2.1%
TX 4.0%
GA 4.9%
U.K. 1.9%
FL 4.4%
Floating-rate Loans
(Net Book Value, % of Total)
100.0%
Senior Mortgage Loans(b)
Net Book Value, % of Total)
90.0%
Collateral Diversification(a)
(Net Book Value, $ in Millions)
Office
Other $818 $175
$390
Hotel $617
Multifamily
Information as of December 31, 2013.
(a) Includes only loans in the Loan Origination portfolio. For information on loans in the CT Legacy Portfolio, refer to BXMT’s Form 10-K for the year ended December 31, 2013. (b) Includes senior mortgage loans, related contiguous subordinate loans with a net book value of $68.6 million, and pari passu participations in mortgages. Blackstone Mortgage Trust 4
|
|
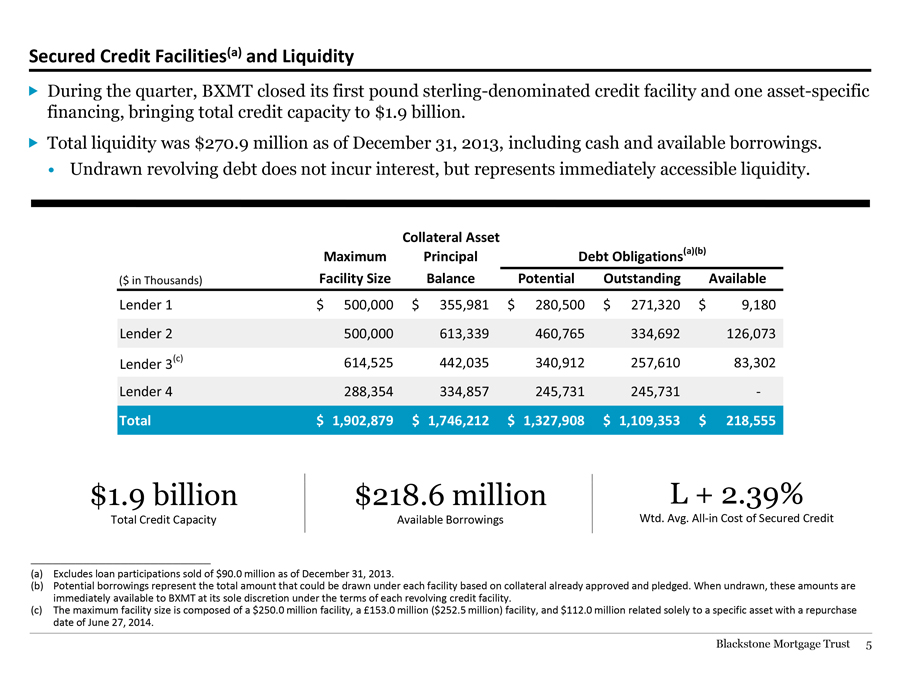
Secured Credit Facilities(a) and Liquidity
During the quarter, BXMT closed its first pound sterling-denominated credit facility and one asset-specific financing, bringing total credit capacity to $1.9 billion.
Total liquidity was $270.9 million as of December 31, 2013, including cash and available borrowings.
Undrawn revolving debt does not incur interest, but represents immediately accessible liquidity.
Collateral Asset
Maximum Principal Debt Obligations(a)(b)
($ in Thousands) Facility Size Balance Potential Outstanding Available
Lender 1 $ 500,000 $ 355,981 $ 280,500 $ 271,320 $ 9,180
Lender 2 500,000 613,339 460,765 334,692 126,073
Lender 3(c) 614,525 442,035 340,912 257,610 83,302
Lender 4 288,354 334,857 245,731 245,731 -
Total $ 1,902,879 $ 1,746,212 $ 1,327,908 $ 1,109,353 $ 218,555
$1.9 billion $218.6 million L + 2.39%
Total Credit Capacity Available Borrowings Wtd. Avg. All-in Cost of Secured Credit
(a) Excludes loan participations sold of $90.0 million as of December 31, 2013.
(b) Potential borrowings represent the total amount that could be drawn under each facility based on collateral already approved and pledged. When undrawn, these amounts are immediately available to BXMT at its sole discretion under the terms of each revolving credit facility.
(c) The maximum facility size is composed of a $250.0 million facility, a Ł153.0 million ($252.5 million) facility, and $112.0 million related solely to a specific asset with a repurchase date of June 27, 2014.
Blackstone Mortgage Trust 5
|
|
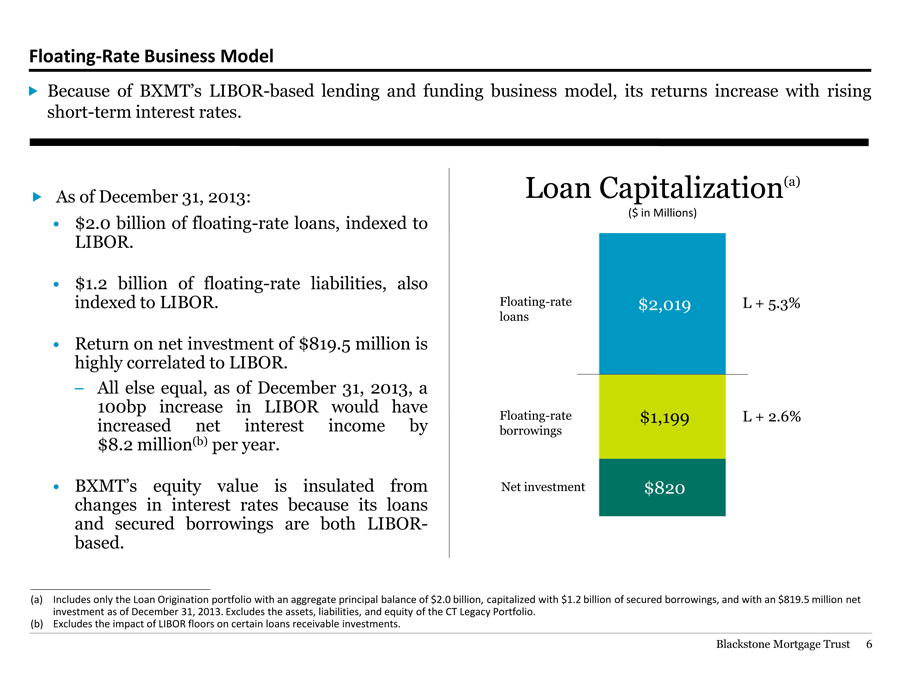
Floating-Rate Business Model
Because of BXMT’s LIBOR-based lending and funding business model, its returns increase with rising short-term interest rates.
As of December 31, 2013:
$2.0 billion of floating-rate loans, indexed to LIBOR.
$1.2 billion of floating-rate liabilities, also indexed to LIBOR.
Return on net investment of $819.5 million is highly correlated to LIBOR.
– All else equal, as of December 31, 2013, a 100bp increase in LIBOR would have increased net interest income by $8.2 million(b) per year.
BXMT’s equity value is insulated from changes in interest rates because its loans and secured borrowings are both LIBOR-based.
Loan Capitalization(a)
($ in Millions)
Floating-rate $2,019 L + 5.3%
loans
Floating-rate $1,199 L + 2.6%
borrowings
Net investment $820
(a) Includes only the Loan Origination portfolio with an aggregate principal balance of $2.0 billion, capitalized with $1.2 billion of secured borrowings, and with an $819.5 million net investment as of December 31, 2013. Excludes the assets, liabilities, and equity of the CT Legacy Portfolio.
| (b) |
|
Excludes the impact of LIBOR floors on certain loans receivable investments. |
Blackstone Mortgage Trust 6
|
|
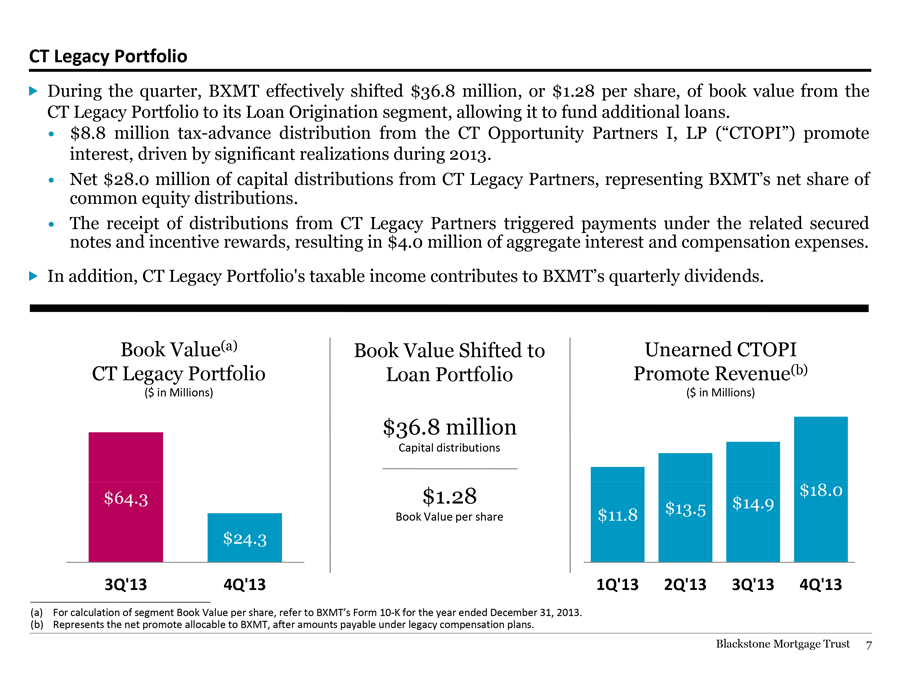
CT Legacy Portfolio
During the quarter, BXMT effectively shifted $36.8 million, or $1.28 per share, of book value from the CT Legacy Portfolio to its Loan Origination segment, allowing it to fund additional loans.
$8.8 million tax-advance distribution from the CT Opportunity Partners I, LP (“CTOPI”) promote interest, driven by significant realizations during 2013.
Net $28.0 million of capital distributions from CT Legacy Partners, representing BXMT’s net share of common equity distributions.
The receipt of distributions from CT Legacy Partners triggered payments under the related secured notes and incentive rewards, resulting in $4.0 million of aggregate interest and compensation expenses.
In addition, CT Legacy Portfolio’s taxable income contributes to BXMT’s quarterly dividends.
Book
Value(a)
CT Legacy Portfolio
($ in Millions)
$64.3
$24.3
3Q’13
4Q’13
Book Value Shifted to Loan Portfolio
$36.8 million
Capital distributions
$1.28
Book Value per share
Unearned CTOPI
Promote Revenue(b)
($ in Millions)
$14.9 $18.0
$11.8 $13.5
1Q’13 2Q’13 3Q’13 4Q’13
(a) For calculation of segment Book Value per share, refer to BXMT’s Form 10-K for the year ended December 31, 2013.
(b) Represents the net promote allocable to BXMT, after amounts payable under legacy compensation plans. Blackstone Mortgage Trust 7
|
|

Appendix
|
|
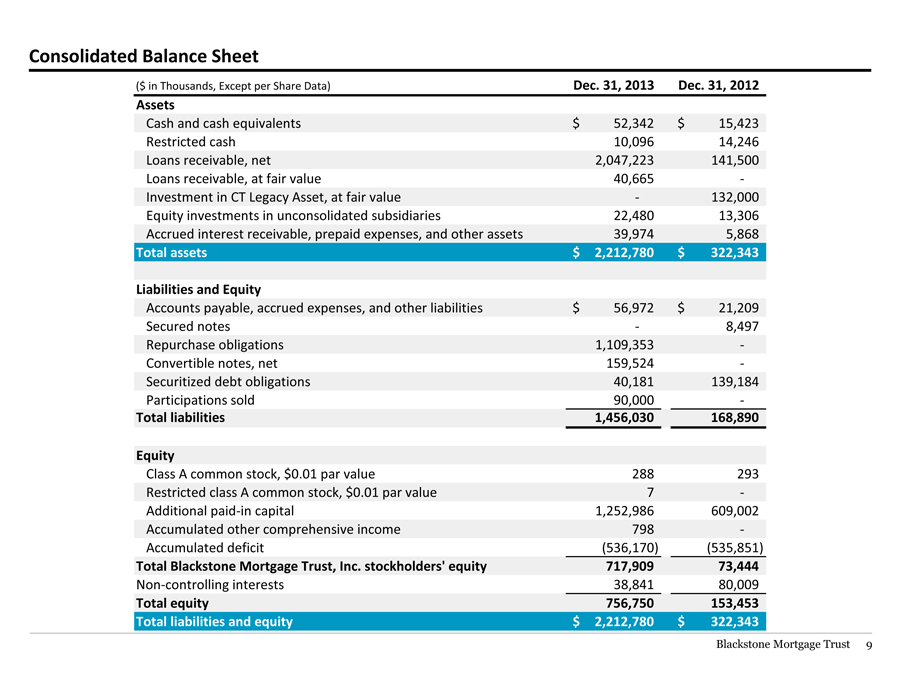
Consolidated Balance Sheet
($ in Thousands, Except per Share Data) Dec. 31, 2013 Dec. 31, 2012
Assets
Cash and cash equivalents $ 52,342 $ 15,423
Restricted cash 10,096 14,246
Loans receivable, net 2,047,223 141,500
Loans receivable, at fair value 40,665 -
Investment in CT Legacy Asset, at fair value—132,000
Equity investments in unconsolidated subsidiaries 22,480 13,306
Accrued interest receivable, prepaid expenses, and other assets 39,974 5,868
Total assets $ 2,212,780 $ 322,343
Liabilities and Equity
Accounts payable, accrued expenses, and other liabilities $ 56,972 $ 21,209
Secured notes—8,497
Repurchase obligations 1,109,353 -
Convertible notes, net 159,524 -
Securitized debt obligations 40,181 139,184
Participations sold 90,000 -
Total liabilities 1,456,030 168,890
Equity
Class A common stock, $0.01 par value 288 293
Restricted class A common stock, $0.01 par value 7 -
Additional paid-in capital 1,252,986 609,002
Accumulated other comprehensive income 798 -
Accumulated deficit (536,170) (535,851)
Total Blackstone Mortgage Trust, Inc. stockholders’ equity 717,909 73,444
Non-controlling interests 38,841 80,009
Total equity 756,750 153,453
Total liabilities and equity $ 2,212,780 $ 322,343
Blackstone Mortgage Trust 9
|
|
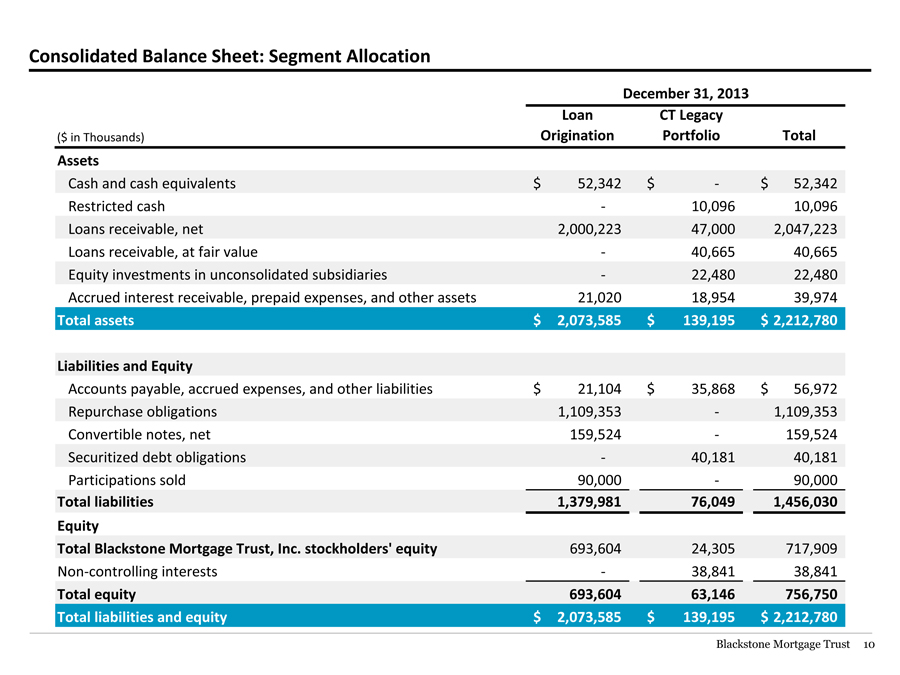
Consolidated Balance Sheet: Segment Allocation
December 31, 2013
Loan CT Legacy
($ in Thousands) Origination Portfolio Total
Assets
Cash and cash equivalents $ 52,342 $—$ 52,342
Restricted cash—10,096 10,096
Loans receivable, net 2,000,223 47,000 2,047,223
Loans receivable, at fair value—40,665 40,665
Equity investments in unconsolidated subsidiaries—22,480 22,480
Accrued interest receivable, prepaid expenses, and other assets 21,020 18,954 39,974
Total assets $ 2,073,585 $ 139,195 $ 2,212,780
Liabilities and Equity
Accounts payable, accrued expenses, and other liabilities $ 21,104 $ 35,868 $ 56,972
Repurchase obligations 1,109,353—1,109,353
Convertible notes, net 159,524—159,524
Securitized debt obligations—40,181 40,181
Participations sold 90,000—90,000
Total liabilities 1,379,981 76,049 1,456,030
Equity
Total Blackstone Mortgage Trust, Inc. stockholders’ equity 693,604 24,305 717,909
Non-controlling interests—38,841 38,841
Total equity 693,604 63,146 756,750
Total liabilities and equity $ 2,073,585 $ 139,195 $ 2,212,780
Blackstone Mortgage Trust 10
|
|
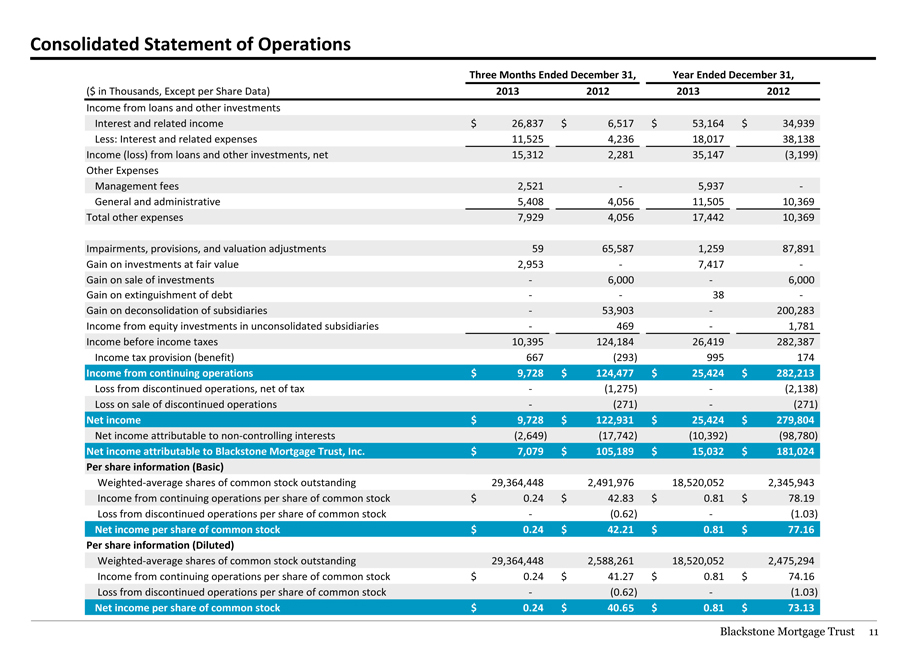
Consolidated Statement of Operations
Three Months Ended December 31, Year Ended December 31,
($ in Thousands, Except per Share Data) 2013 2012 2013 2012
Income from loans and other investments
Interest and related income $ 26,837 $ 6,517 $ 53,164 $ 34,939
Less: Interest and related expenses 11,525 4,236 18,017 38,138
Income (loss) from loans and other investments, net 15,312 2,281 35,147 (3,199)
Other Expenses
Management fees 2,521—5,937 -
General and administrative 5,408 4,056 11,505 10,369
Total other expenses 7,929 4,056 17,442 10,369
Impairments, provisions, and valuation adjustments 59 65,587 1,259 87,891
Gain on investments at fair value 2,953—7,417 -
Gain on sale of investments—6,000—6,000
Gain on extinguishment of debt — 38 -
Gain on deconsolidation of subsidiaries—53,903—200,283
Income from equity investments in unconsolidated subsidiaries—469—1,781
Income before income taxes 10,395 124,184 26,419 282,387
Income tax provision (benefit) 667 (293) 995 174
Income from continuing operations $ 9,728 $ 124,477 $ 25,424 $ 282,213
Loss from discontinued operations, net of tax—(1,275)—(2,138)
Loss on sale of discontinued operations—(271)—(271)
Net income $ 9,728 $ 122,931 $ 25,424 $ 279,804
Net income attributable to non-controlling interests (2,649) (17,742) (10,392) (98,780)
Net income attributable to Blackstone Mortgage Trust, Inc. $ 7,079 $ 105,189 $ 15,032 $ 181,024
Per share information (Basic)
Weighted-average shares of common stock outstanding 29,364,448 2,491,976 18,520,052 2,345,943
Income from continuing operations per share of common stock $ 0.24 $ 42.83 $ 0.81 $ 78.19
Loss from discontinued operations per share of common stock—(0.62)—(1.03)
Net income per share of common stock $ 0.24 $ 42.21 $ 0.81 $ 77.16
Per share information (Diluted)
Weighted-average shares of common stock outstanding 29,364,448 2,588,261 18,520,052 2,475,294
Income from continuing operations per share of common stock $ 0.24 $ 41.27 $ 0.81 $ 74.16
Loss from discontinued operations per share of common stock—(0.62)—(1.03)
Net income per share of common stock $ 0.24 $ 40.65 $ 0.81 $ 73.13
Blackstone Mortgage Trust 11
|
|
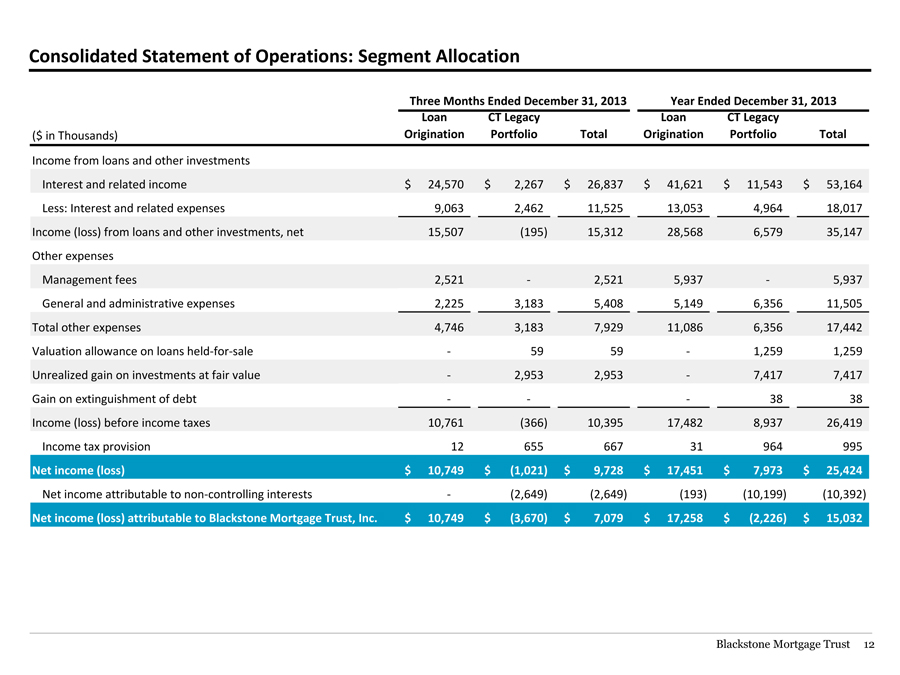
Consolidated Statement of Operations: Segment Allocation
Three Months Ended December 31, 2013 Year Ended December 31, 2013
Loan CT Legacy Loan CT Legacy
($ in Thousands) Origination Portfolio Total Origination Portfolio Total
Income from loans and other investments
Interest and related income $ 24,570 $ 2,267 $ 26,837 $ 41,621 $ 11,543 $ 53,164
Less: Interest and related expenses 9,063 2,462 11,525 13,053 4,964 18,017
Income (loss) from loans and other investments, net 15,507 (195) 15,312 28,568 6,579 35,147
Other expenses
Management fees 2,521—2,521 5,937—5,937
General and administrative expenses 2,225 3,183 5,408 5,149 6,356 11,505
Total other expenses 4,746 3,183 7,929 11,086 6,356 17,442
Valuation allowance on loans held-for-sale—59 59—1,259 1,259
Unrealized gain on investments at fair value—2,953 2,953—7,417 7,417
Gain on extinguishment of debt ——38 38
Income (loss) before income taxes 10,761 (366) 10,395 17,482 8,937 26,419
Income tax provision 12 655 667 31 964 995
Net income (loss) $ 10,749 $ (1,021) $ 9,728 $ 17,451 $ 7,973 $ 25,424
Net income attributable to non-controlling interests—(2,649) (2,649) (193) (10,199) (10,392)
Net income (loss) attributable to Blackstone Mortgage Trust, Inc. $ 10,749 $ (3,670) $ 7,079 $ 17,258 $ (2,226) $ 15,032
Blackstone Mortgage Trust 12
|
|
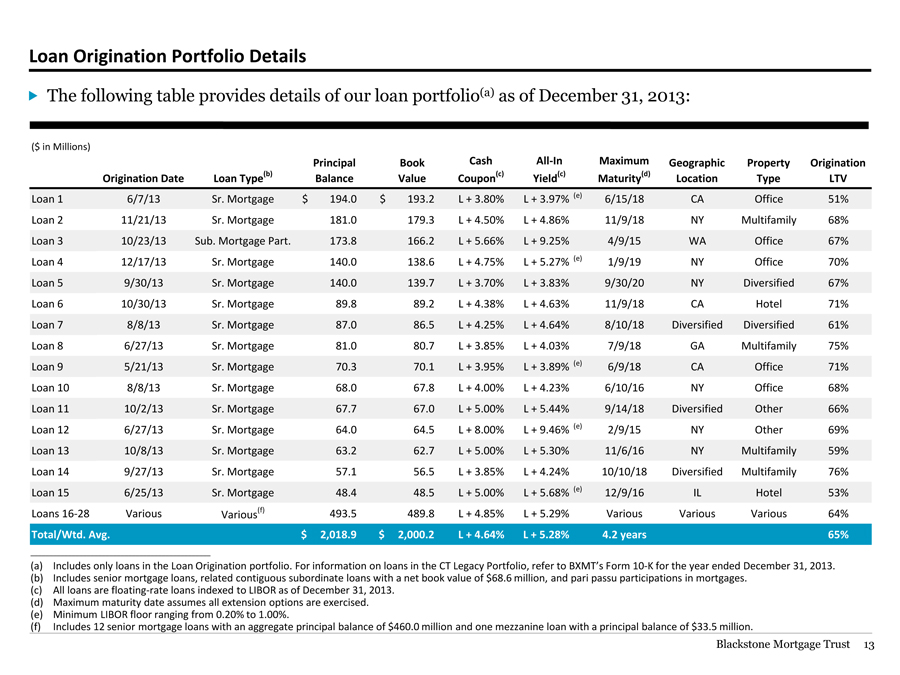
Loan Origination Portfolio Details
The following table provides details of our loan portfolio(a) as of December 31, 2013:
($ in Millions)
Principal Book Cash All-In Maximum Geographic Property Origination
Origination Date Loan Type(b) Balance Value Coupon(c) Yield(c) Maturity(d) Location Type LTV
Loan 1 6/7/13 Sr. Mortgage $ 194.0 $ 193.2 L + 3.80% L + 3.97% (e) 6/15/18 CA Office 51%
Loan 2 11/21/13 Sr. Mortgage 181.0 179.3 L + 4.50% L + 4.86% 11/9/18 NY Multifamily 68%
Loan 3 10/23/13 Sub. Mortgage Part. 173.8 166.2 L + 5.66% L + 9.25% 4/9/15 WA Office 67%
Loan 4 12/17/13 Sr. Mortgage 140.0 138.6 L + 4.75% L + 5.27% (e) 1/9/19 NY Office 70%
Loan 5 9/30/13 Sr. Mortgage 140.0 139.7 L + 3.70% L + 3.83% 9/30/20 NY Diversified 67%
Loan 6 10/30/13 Sr. Mortgage 89.8 89.2 L + 4.38% L + 4.63% 11/9/18 CA Hotel 71%
Loan 7 8/8/13 Sr. Mortgage 87.0 86.5 L + 4.25% L + 4.64% 8/10/18 Diversified Diversified 61%
Loan 8 6/27/13 Sr. Mortgage 81.0 80.7 L + 3.85% L + 4.03% 7/9/18 GA Multifamily 75%
Loan 9 5/21/13 Sr. Mortgage 70.3 70.1 L + 3.95% L + 3.89% (e) 6/9/18 CA Office 71%
Loan 10 8/8/13 Sr. Mortgage 68.0 67.8 L + 4.00% L + 4.23% 6/10/16 NY Office 68%
Loan 11 10/2/13 Sr. Mortgage 67.7 67.0 L + 5.00% L + 5.44% 9/14/18 Diversified Other 66%
Loan 12 6/27/13 Sr. Mortgage 64.0 64.5 L + 8.00% L + 9.46% (e) 2/9/15 NY Other 69%
Loan 13 10/8/13 Sr. Mortgage 63.2 62.7 L + 5.00% L + 5.30% 11/6/16 NY Multifamily 59%
Loan 14 9/27/13 Sr. Mortgage 57.1 56.5 L + 3.85% L + 4.24% 10/10/18 Diversified Multifamily 76%
Loan 15 6/25/13 Sr. Mortgage 48.4 48.5 L + 5.00% L + 5.68% (e) 12/9/16 IL Hotel 53%
Loans 16-28 Various Various(f) 493.5 489.8 L + 4.85% L + 5.29% Various Various Various 64%
Total/Wtd. Avg. $ 2,018.9 $ 2,000.2 L + 4.64% L + 5.28% 4.2 years 65%
(a) Includes only loans in the Loan Origination portfolio. For information on loans in the CT Legacy Portfolio, refer to BXMT’s Form 10-K for the year ended December 31, 2013.
(b) Includes senior mortgage loans, related contiguous subordinate loans with a net book value of $68.6 million, and pari passu participations in mortgages. (c) All loans are floating-rate loans indexed to LIBOR as of December 31, 2013.
(d) Maximum maturity date assumes all extension options are exercised. (e) Minimum LIBOR floor ranging from 0.20% to 1.00%.
(f) Includes 12 senior mortgage loans with an aggregate principal balance of $460.0 million and one mezzanine loan with a principal balance of $33.5 million.
Blackstone Mortgage Trust 13
|
|
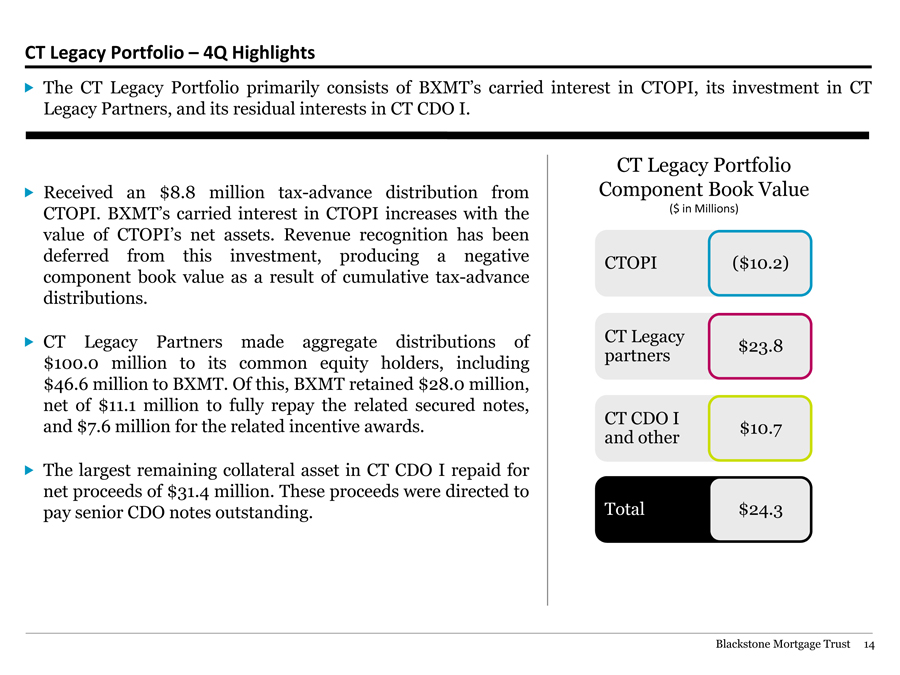
CT Legacy Portfolio – 4Q Highlights
The CT Legacy Portfolio primarily consists of BXMT’s carried interest in CTOPI, its investment in CT Legacy Partners, and its residual interests in CT CDO I.
Received an $8.8 million tax-advance distribution from CTOPI. BXMT’s carried interest in CTOPI increases with the value of CTOPI’s net assets. Revenue recognition has been deferred from this investment, producing a negative component book value as a result of cumulative tax-advance distributions.
CT Legacy Partners made aggregate distributions of $100.0 million to its common equity holders, including $46.6 million to BXMT. Of this, BXMT retained $28.0 million, net of $11.1 million to fully repay the related secured notes, and $7.6 million for the related incentive awards.
The largest remaining collateral asset in CT CDO I repaid for net proceeds of $31.4 million. These proceeds were directed to pay senior CDO notes outstanding.
CT Legacy Portfolio Component Book Value
($ in Millions)
CTOPI ($10.2)
CT Legacy $23.8 partners
CT CDO I $10.7 and other
Total $24.3
Blackstone Mortgage Trust 14
|
|
Definitions
Blackstone Mortgage Trust discloses the following financial measures that are calculated and presented on the basis of methodologies other than in accordance with generally accepted accounting principles in the United States of America in this presentation:
Core Earnings is an adjusted measure that helps BXMT to evaluate its performance excluding the effects of certain transactions and GAAP adjustments that are not necessarily indicative of its current investment portfolio and operations. BXMT also uses Core Earnings to calculate the incentive and base management fees due to its Manager under its management agreement and, as such, BXMT believes that the disclosure of Core Earnings is useful to investors.
Core Earnings is defined as GAAP net income (loss), including realized losses not otherwise included in GAAP net income (loss), and excluding (i) net income (loss) attributable to CT Legacy Portfolio segment, (ii) non-cash equity compensation expense, (iii) incentive management fees, (iv) depreciation and amortization, and (v) unrealized gains (losses) or similar non-cash items. Core Earnings may also be adjusted from time to time to exclude one-time events pursuant to changes in GAAP and certain other non-cash charges as determined by BXMT’s Manager, subject to approval by a majority of its independent directors. BXMT’s Manager determined, and a majority of its independent directors approved, the exclusion from Core Earnings of the amortization of the deemed issue discount on its convertible notes resulting from the conversion option value accounting under GAAP.
Core Earnings does not represent net income or cash generated from operating activities and should not be considered as an alternative to GAAP net income, or an indication of cash flow from GAAP operating activities, a measure of BXMT’s liquidity, or an indication of funds available for its cash needs. In addition, BXMT’s methodology for calculating Core Earnings may differ from the methodologies employed by other companies to calculate the same or similar supplemental performance measures, and accordingly, its reported Core Earnings may not be comparable to the Core Earnings reported by other companies.
Blackstone Mortgage Trust 15
|
|
Forward-Looking Statements
This presentation may contain forward-looking statements within the meaning of Section 27A of the Securities Act of 1933, as amended, and Section 21E of the Securities Exchange Act of 1934, as amended, which reflect Blackstone Mortgage Trust’s current views with respect to, among other things, Blackstone Mortgage Trust’s operations and financial performance. You can identify these forward-looking statements by the use of words such as “outlook,” “believes,” “expects,” “potential,” “continues,” “may,” “will,” “should,” “seeks,” “approximately,” “predicts,” “intends,” “plans,” “estimates,” “anticipates” or the negative version of these words or other comparable words. Such forward-looking statements are subject to various risks and uncertainties. Accordingly, there are or will be important factors that could cause actual outcomes or results to differ materially from those indicated in these statements. Blackstone Mortgage Trust believes these factors include but are not limited to those described under the section entitled “Risk Factors” in its Annual Report on Form 10-K for the fiscal year ended December 31, 2013, as such factors may be updated from time to time in its periodic filings with the Securities and Exchange Commission which are accessible on the SEC’s website at www.sec.gov. These factors should not be construed as exhaustive and should be read in conjunction with the other cautionary statements that are included in this presentation and in the filings. Blackstone Mortgage Trust assumes no obligation to update or supplement forward - looking statements that become untrue because of subsequent events or circumstances.
Blackstone Mortgage Trust 16