Attached files
| file | filename |
|---|---|
| 8-K - WESTFIELD FINANCIAL, INC. 8-K - Western New England Bancorp, Inc. | a50802456.htm |
Exhibit 99.1
WESTFIELD FINANCIAL, INC. NASDAQ: WFD 2014 STERNE AGEE FINANCIAL INSTITUTIONS INVESTOR CONFERENCE FEBRUARY 12 – 14, 2014
FORWARD – LOOKING STATEMENTS
Today’s presentation may contain forward-looking statements, which may be identified by the use of such words as “believe,” “expect,” “anticipate,” “should,” “planned,” “estimated” and “potential.” Examples of forward-looking statements include, but are not limited to, estimates with respect to our financial condition and results of operation and business that are subject to various factors which could cause actual results to differ materially from these estimates. These factors include, but are not limited to: • changes in the interest rate environment that reduce margins; • changes in the regulatory environment; • the highly competitive industry and market area in which we operate; • general economic conditions, either nationally or regionally, resulting in, among other things, a deterioration in credit quality; • changes in business conditions and inflation; • changes in credit market conditions; • changes in the securities markets which affect investment management revenues; • increases in Federal Deposit Insurance Corporation deposit insurance premiums and assessments ; • changes in technology used in the banking business; • the soundness of other financial services institutions; • certain of our intangible assets may become impaired in the future; • our controls and procedures may fail or be circumvented; • new lines of business or new products and services, including the additions of the Westfield Wealth Management and Insurance Group; • changes in key management personnel ; • recent or proposed legislative and regulatory initiatives; • severe weather, natural disasters, acts of war or terrorism and other external events; and • other factors set forth in our Annual Report on Form 10-K for this year ended December 31, 2012, and other reports filed by us with the Securities and Exchange Commission (“SEC”). Any or all of our forward-looking statements in today’s presentation or in any other public statements we make may turn out to be wrong. They can be affected by inaccurate assumptions we might make or known or unknown risks and uncertainties. Consequently, no forward-looking statements can be guaranteed. We disclaim any obligation to subsequently revise any forward-looking statements to reflect events or circumstances after the date of such statements, or to reflect the occurrence of anticipated or unanticipated events 2
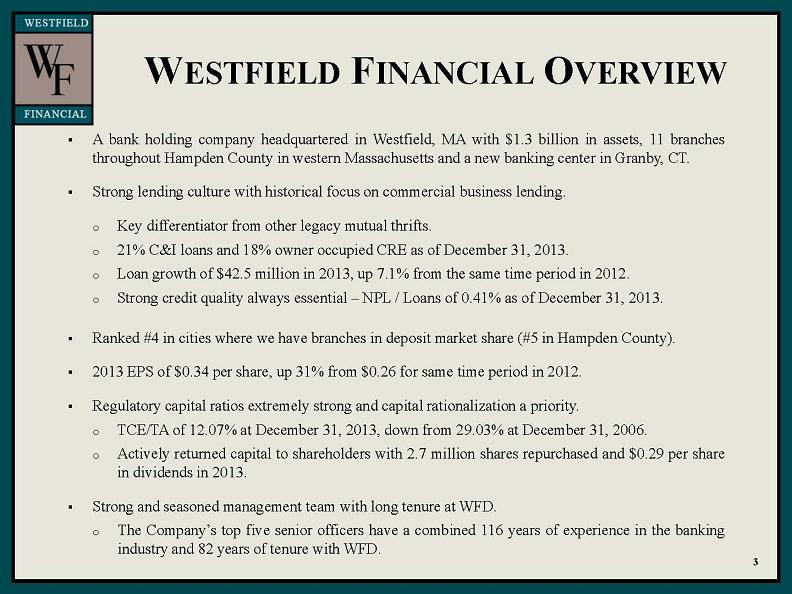
WESTFIELD FINANCIAL OVERVIEW A bank holding company headquartered in Westfield, MA with $1.3 billion in assets, 11 branches throughout Hampden County in western Massachusetts and a new banking center in Granby, CT. Strong lending culture with historical focus on commercial business lending. oKey differentiator from other legacy mutual thrifts.
21% C&I loans and 18% owner occupied CRE as of December 31, 2013Loan growth of $42.5 million in 2013, up 7.1% from the same time period in 2012.Strong credit quality always essential – NPL / Loans of 0.41% as of December 31, 2013. Ranked #4 in cities where we have branches in deposit market share (#5 in Hampden County).2013 EPS of $0.34 per share, up 31% from $0.26 for same time period in 2012.Regulatory capital ratios extremely strong and capital rationalization a priority.
TCE/TA of 12.07% at December 31, 2013, down from 29.03% at December 31, 2006.
Actively returned capital to shareholders with 2.7 million shares repurchased and $0.29 per share in dividends in 2013.Strong and seasoned management team with long tenure at WFD.
The Company’s top five senior officers have a combined 116 years of experience in the banking industry and 82 years of tenure with WFD.
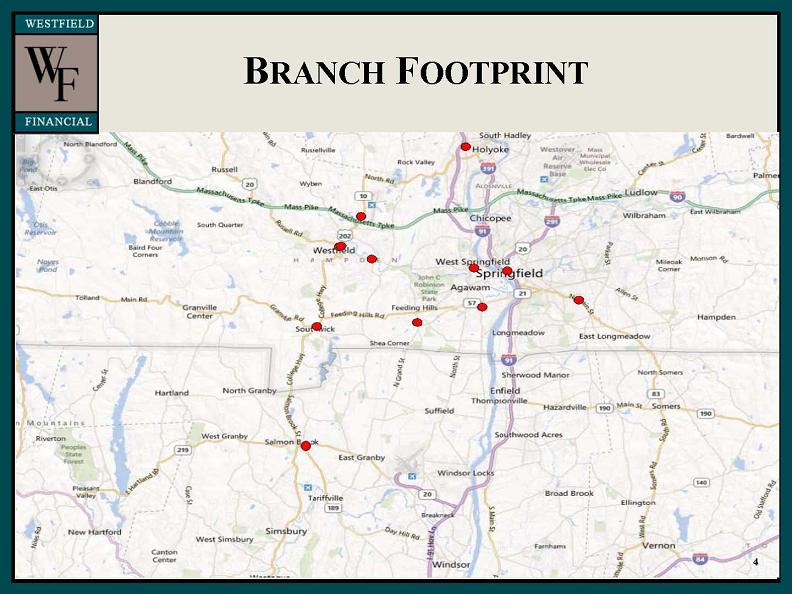
BRANCH FOOTPRINT
4
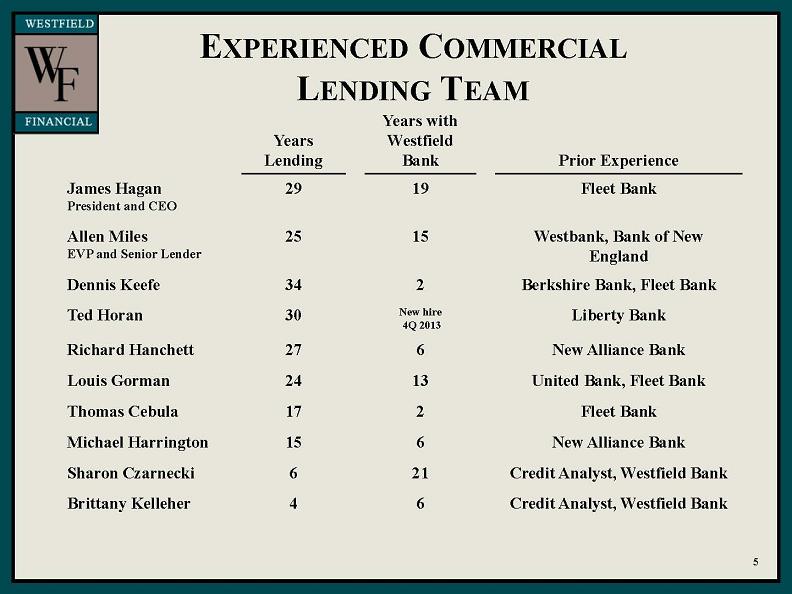
EXPERIENCED COMMERCIAL LENDING TEAM
Years Lending Years with Westfield Bank Prior Experience James Hagan President and CEO 29 19 Fleet Bank Allen Miles EVP and Senior Lender 25 15 Westbank, Bank of New England
Dennis Keefe 34 2 Berkshire Bank, Fleet Bank Ted Horan 30 New hire 4Q 2013 Liberty Bank Richard Hanchett 27 6 New Alliance Bank Louis Gorman 24 13 United Bank, Fleet Bank
Thomas Cebula 17 2 Fleet Bank Michael Harrington 15 6 New Alliance Bank Sharon Czarnecki 6 21 Credit Analyst, Westfield Bank Brittany Kelleher 4 6 Credit Analyst, Westfield Bank
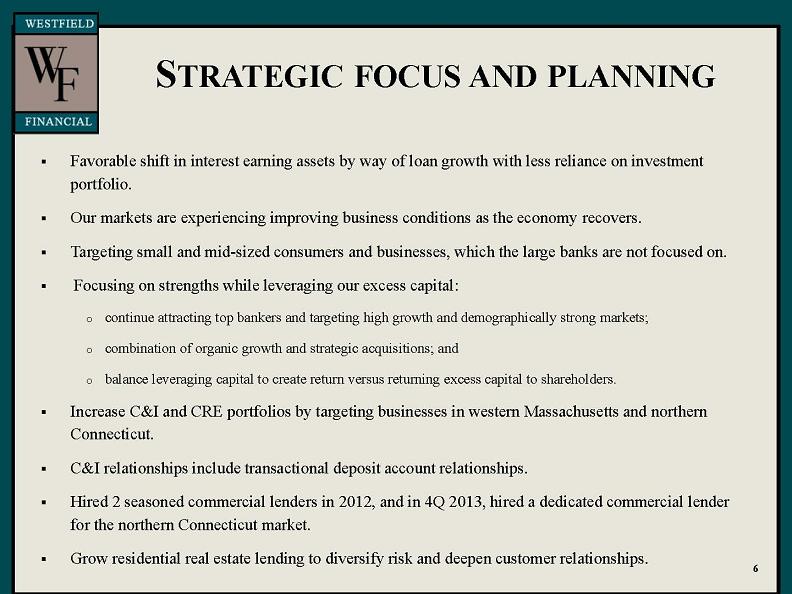
STRATEGIC FOCUS AND PLANNING
Favorable shift in interest earning assets by way of loan growth with less reliance on investment portfolio. Our markets are experiencing improving business conditions as the economy recovers. Targeting small and mid-sized consumers and businesses, which the large banks are not focused on. Focusing on strengths while leveraging our excess capital: ocontinue attracting top bankers and targeting high growth and demographically strong markets; ocombination of organic growth and strategic acquisitions; and balance leveraging capital to create return versus returning excess capital to shareholders. Increase C&I and CRE portfolios by targeting businesses in western Massachusetts and northern Connecticut. C&I relationships include transactional deposit account relationships. Hired 2 seasoned commercial lenders in 2012, and in 4Q 2013, hired a dedicated commercial lender for the northern Connecticut market. Grow residential real estate lending to diversify risk and deepen customer relationships 6
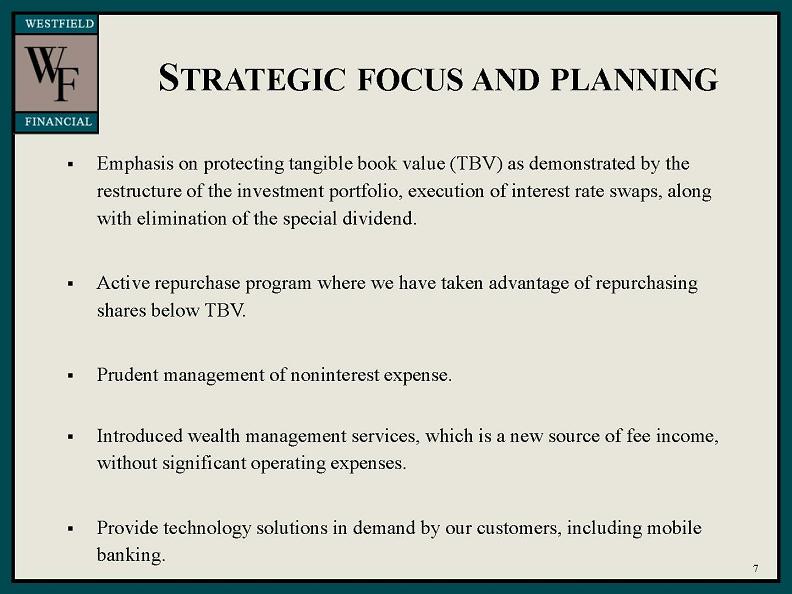
Emphasis on protecting tangible book value (TBV) as demonstrated by the restructure of the investment portfolio, execution of interest rate swaps, along with elimination of the special dividend. Active repurchase program where we have taken advantage of repurchasing shares below TBV. Prudent management of noninterest expense. Introduced wealth management services, which is a new source of fee income, without significant operating expenses. Provide technology solutions in demand by our customers, including mobile banking. 7
STRATEGIC FOCUS AND PLANNING
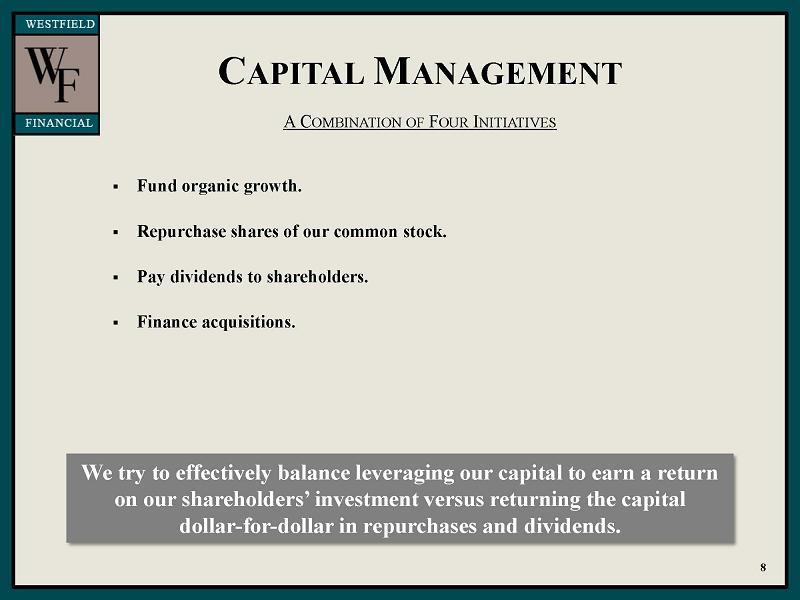
CAPITAL MANAGEMENT A COMBINATION OF FOUR INITIATIVES Fund organic growth. Repurchase shares of our common stock. Pay dividends to shareholders. Finance acquisitions.We try to effectively balance leveraging our capital to earn a return on our shareholders’ investment versus returning the capital dollar-for-dollar in repurchases and dividends.
8
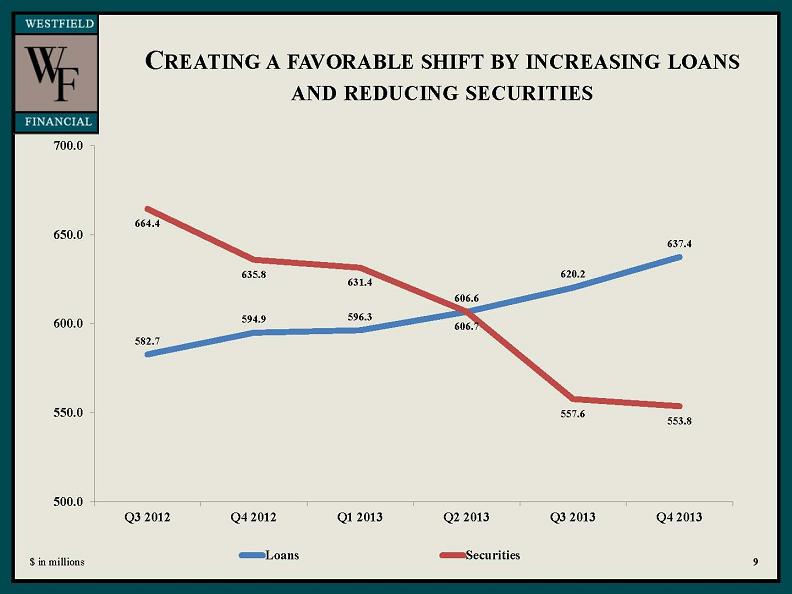
CREATING A FAVORABLE SHIFT BY INCREASING LOANS AND REDUCING SECURITIES 9 $ in millions 582.7 594.9 596.3 606.6 620.2 637.4 664.4 635.8 631.4 606.7 557.6 553.8 500.0
550.0 600.0 650.0 700.0 Q3 2012 Q4 2012 Q1 2013 Q2 2013 Q3 2013 Q4 2013 Loans Securities
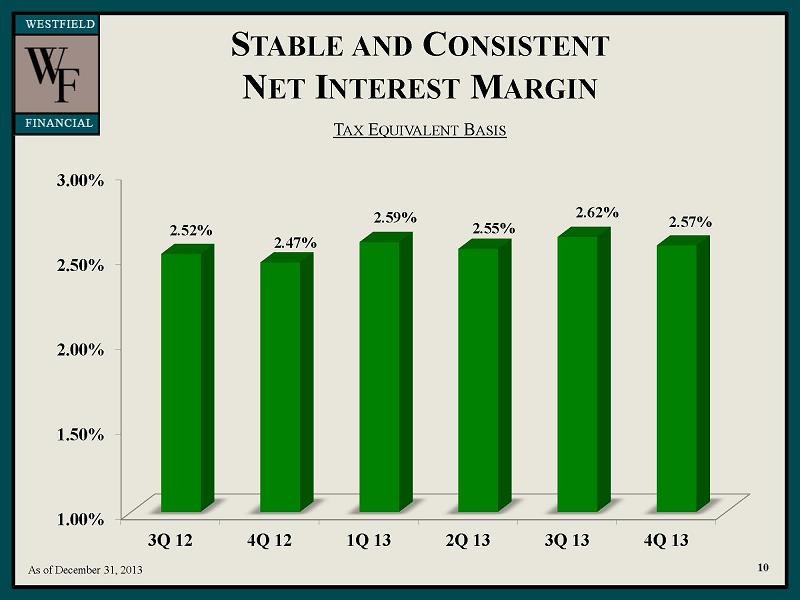
STABLE AND CONSISTENT NET INTEREST MARGIN TAX EQUIVALENT BASIS 10 As of December 31, 2013 1.00% 1.50% 2.00% 2.50% 3.00% 3Q 12 4Q 12
1Q 13 2Q 13 3Q 13 4Q 13 2.52% 2.47% 2.59% 2.55% 2.62% 2.57%
2.57%
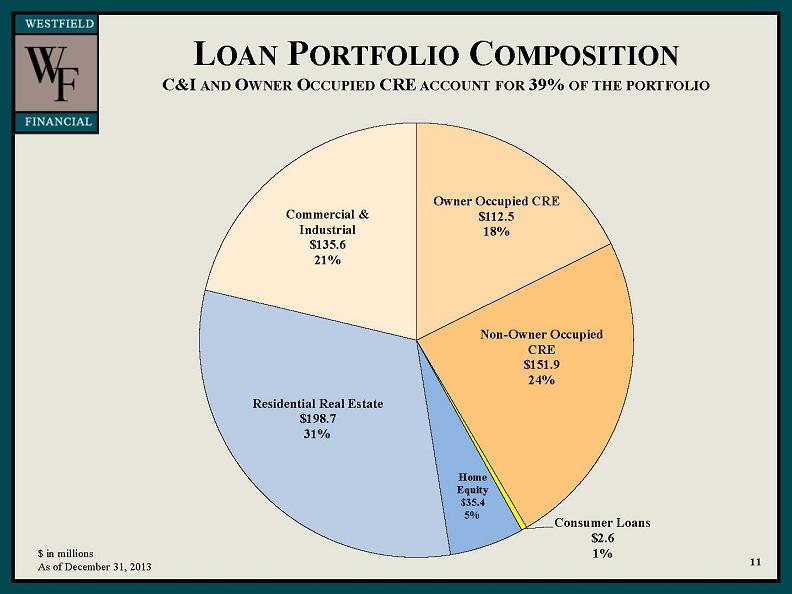
LOAN PORTFOLIO COMPOSITION C&I AND OWNER OCCUPIED CRE ACCOUNT FOR 39% OF THE PORTFOLIO $ in millions As of December 31, 2013 11 Owner Occupied CRE $112.5 18% Non-Owner Occupied CRE $151.9 24% Consumer Loans $2.6 1% Home Equity $35.4 5% Residential Real Estate $198.7 31% Commercial & Industrial $135.6 21%
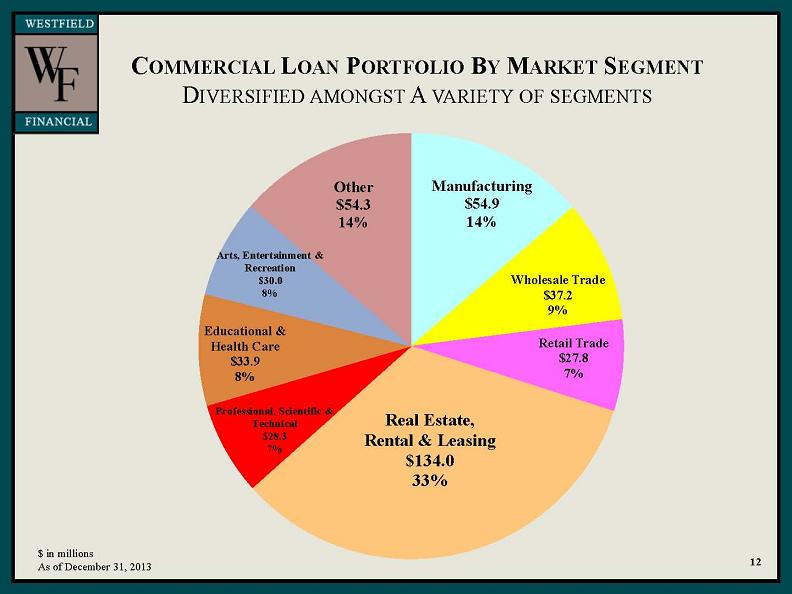
COMMERCIAL LOAN PORTFOLIO BY MARKET SEGMENT DIVERSIFIED AMONGST A VARIETY OF SEGMENTS 12 $ in millions As of December 31, 2013 Manufacturing $54.9 14%
Wholesale Trade $37.2 9% Retail Trade $27.8 7% Real Estate, Rental & Leasing $134.0 33% Professional, Scientific & Technical $28.3 7% Educational & Health Care $33.9 8% Arts, Entertainment & Recreation $30.0 8% Other $54.3 14%
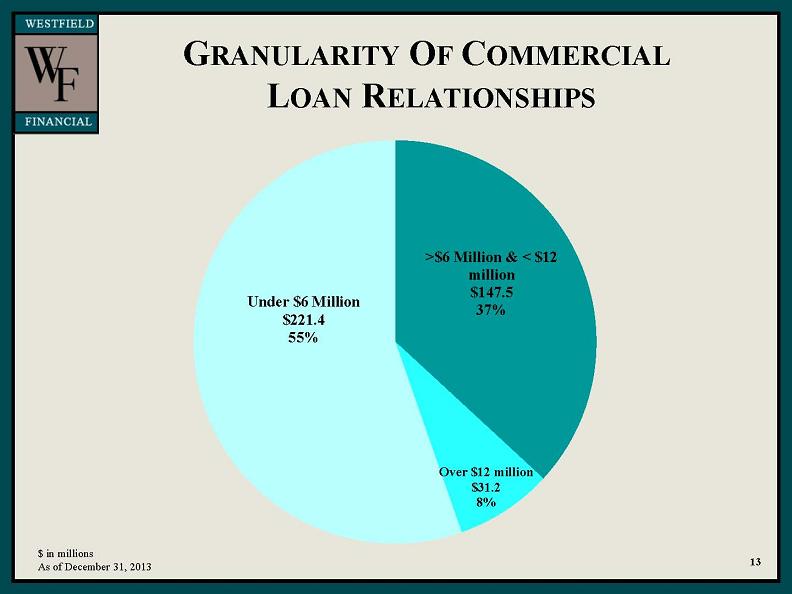
GRANULARITY OF COMMERCIAL LOAN RELATIONSHIPS 13 $ in millions As of December 31, 2013 $6 Million & < $12 million $147.5 37% Over $12 million $31.2 8% Under $6 Million $221.4 55%
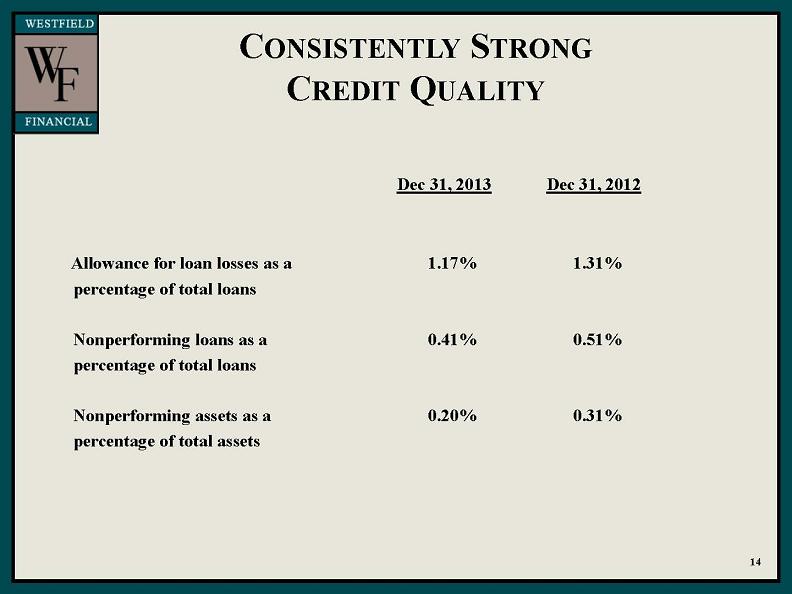
CONSISTENTLY STRONG CREDIT QUALITY Dec 31, 2013 Dec 31, 2012 Allowance for loan losses as a 1.17% 1.31% percentage of total loans Nonperforming loans as a 0.41% 0.51% percentage of total loans Nonperforming assets as a 0.20% 0.31% percentage of total assets 14
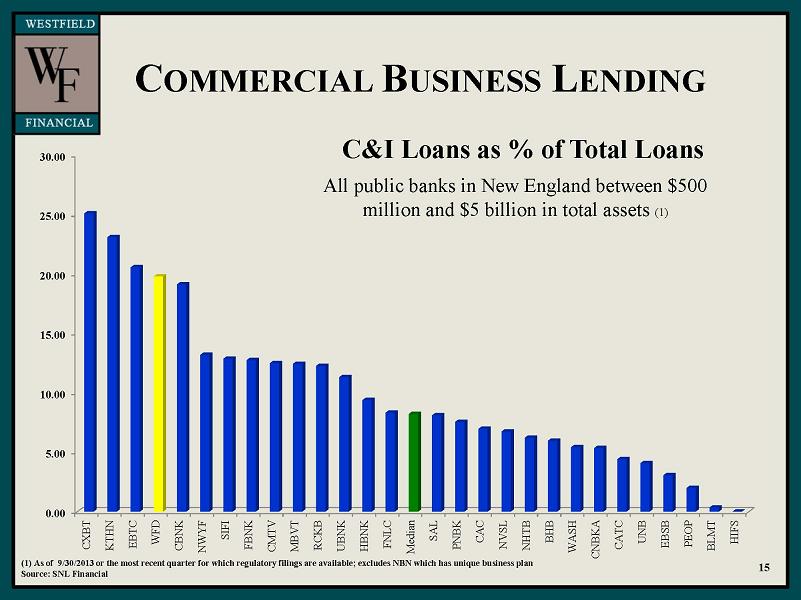
(1) As of 9/30/2013 or the most recent quarter for which regulatory filings are available; excludes NBN which has unique business plan Source: SNL Financial COMMERCIAL BUSINESS LENDING C&I Loans as % of Total Loans All public banks in New England between $500 million and $5 billion in total assets (1) 15 0.00 5.00 10.00 15.00 20.00 25.00 30.00 CXBT
KTHN EBTC WFD CBNK NWYF SIFI FBNK CMTV MBVT RCKB UBNK HBNK FNLC Median SAL PNBK CAC NVSL NHTB BHB WASH CNBKA CATC UNB EBSB PEOP BLMT HIFS
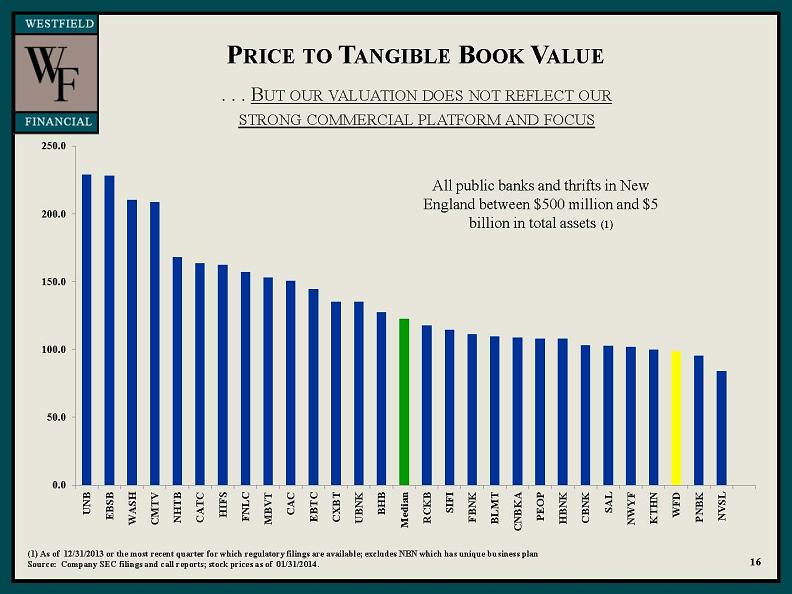
PRICE TO TANGIBLE BOOK VALUE (1) As of 12/31/2013 or the most recent quarter for which regulatory filings are available; excludes NBN which has unique business plan
Source: Company SEC filings and call reports; stock prices as of 01/31/2014. BUT OUR VALUATION DOES NOT REFLECT OUR STRONG COMMERCIAL PLATFORM AND FOCUS
All public banks and thrifts in New England between $500 million and $5 billion in total assets (1) 16 0.0 50.0 100.0 150.0 200.0 250.0 UNB EBSB WASH CMTV NHTB CATC HIFS FNLC MBVT CAC EBTC CXBT UBNK BHB Median RCKB SIFI FBNK BLMT CNBKA PEOP HBNK CBNK SAL NWYF KTHN WFD PNBK NVSL
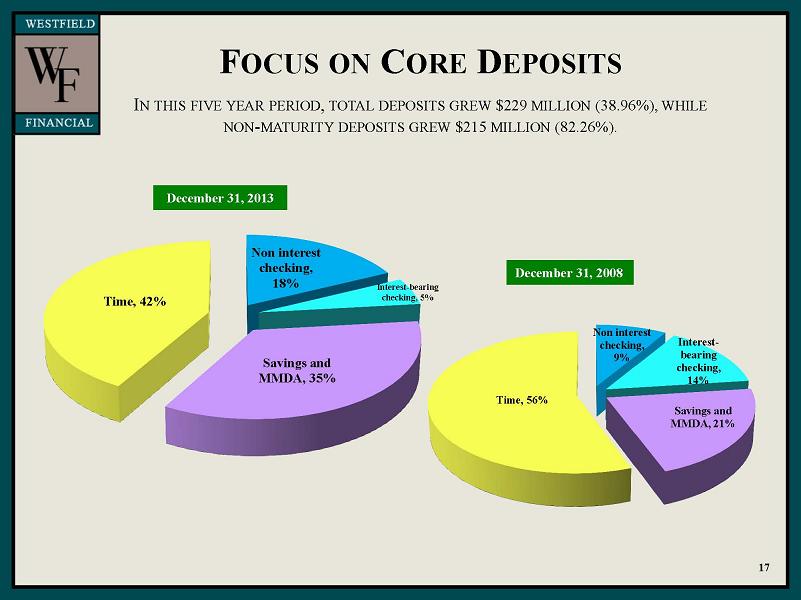
FOCUS ON CORE DEPOSITS IN THIS FIVE YEAR PERIOD, TOTAL DEPOSITS GREW $229 MILLION (38.96%), WHILE NON-MATURITY DEPOSITS GREW $215 MILLION (82.26%).
December 31, 2013 December 31, 2008 Non interest checking, 9% Interest-bearing checking, 14% Savings and MMDA, 21% Time, 56 17
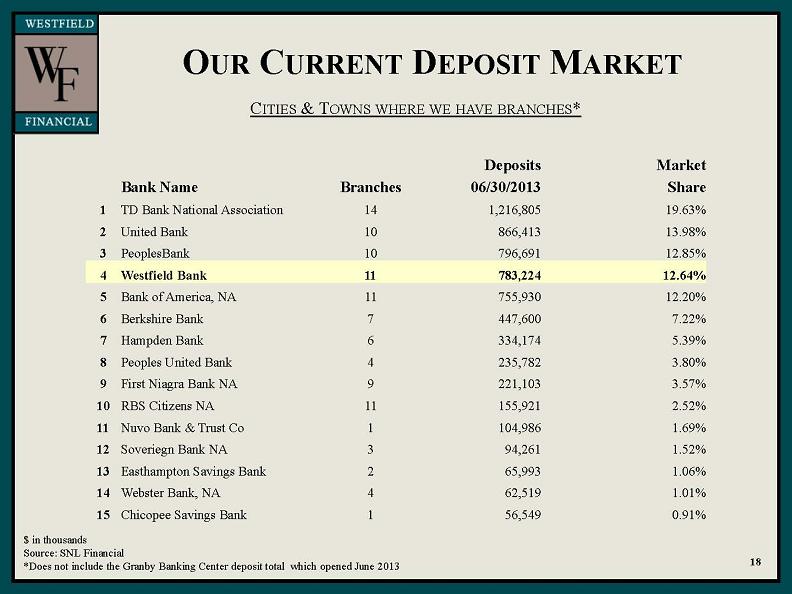
OUR CURRENT DEPOSIT MARKET CITIES & TOWNS WHERE WE HAVE BRANCHES* $ in thousands Source: SNL Financial *Does not include the Granby Banking Center deposit total which opened June 2013 18 Deposits Market Bank Name Branches 06/30/2013 Share TD Bank National Association United Bank 1,216,805 19.63% PeoplesBank 866,413 13.98% 796,691 12.85% Westfield Bank 783,224 12.64% Bank of America, NA 755,930 12.20% Berkshire Bank 447,600 7.22% Hampden Bank 334,174 5.39% Peoples United Bank 235,782 3.80%
First Niagra Bank NA 221,103 3.57% RBS Citizens NA 155,921 2.52% Nuvo Bank & Trust Co 104,986 1.69% Soveriegn Bank NA 94,261 1.52%
Easthampton Savings Bank 65,993 1.06% Webster Bank, NA 62,519 1.01% Chicopee Savings Bank 56,549 0.91% 1 2 3 4 5 6 7 8 9 10 11 12 13 14 15
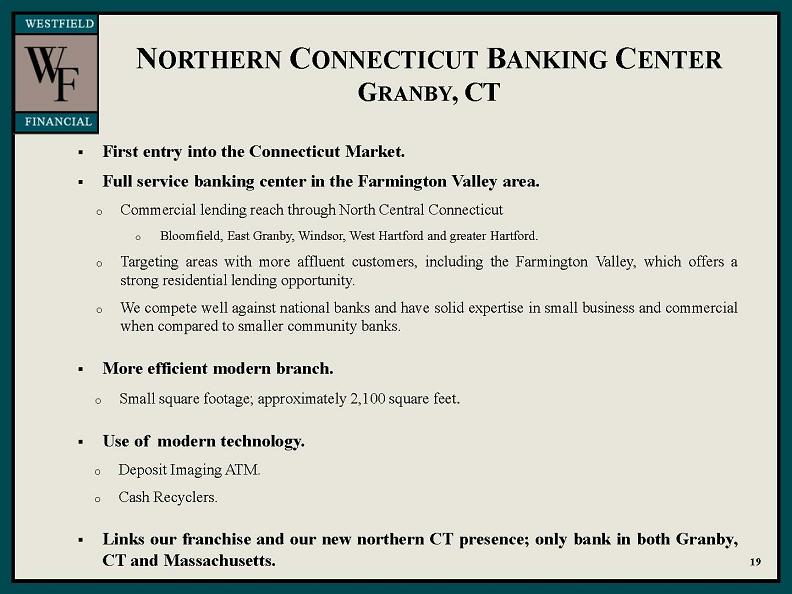
NORTHERN CONNECTICUT BANKING CENTER GRANBY, CT First entry into the Connecticut Market. Full service banking center in the Farmington Valley area. Commercial lending reach through North Central Connecticut Bloomfield, East Granby, Windsor, West Hartford and greater Hartford. Targeting areas with more affluent customers, including the Farmington Valley, which offers a strong residential lending opportunity. We compete well against national banks and have solid expertise in small business and commercial when compared to smaller community banks. More efficient modern branch. Small square footage; approximately 2,100 square feet. Use of modern technology. Deposit Imaging ATM. Cash Recyclers. Links our franchise and our new northern CT presence; only bank in both Granby, CT and Massachusetts.19
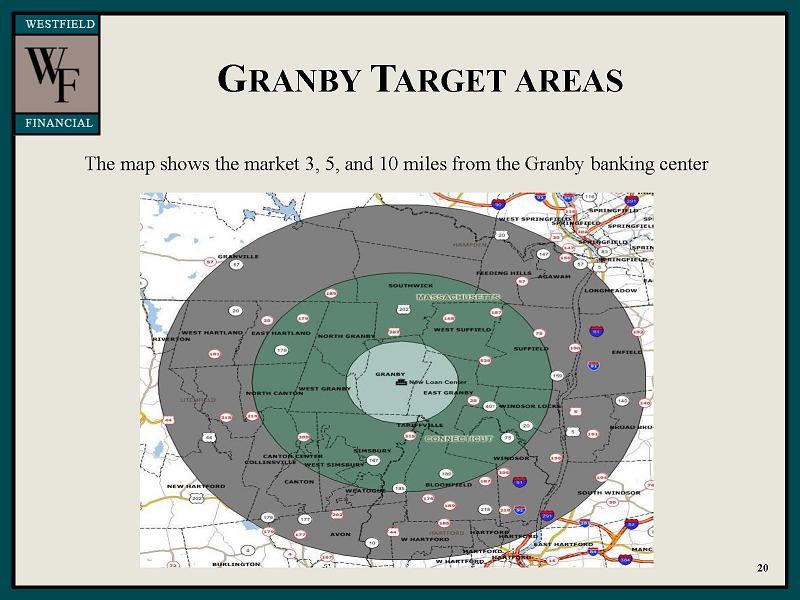
GRANBY TARGET AREAS The map shows the market 3, 5, and 10 miles from the Granby banking center 20
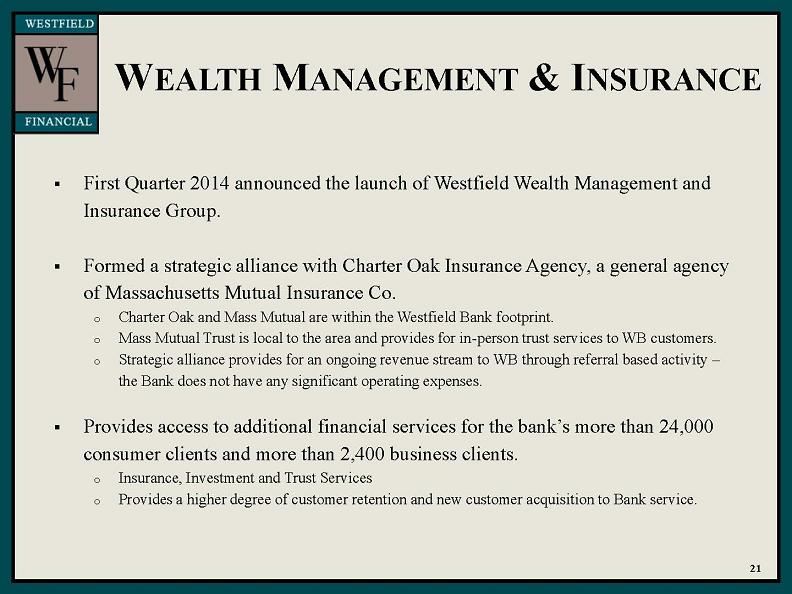
First Quarter 2014 announced the launch of Westfield Wealth Management and Insurance Group. Formed a strategic alliance with Charter Oak Insurance Agency, a general agency of Massachusetts Mutual Insurance Co. Charter Oak and Mass Mutual are within the Westfield Bank footprint. Mass Mutual Trust is local to the area and provides for in-person trust services to WB customers. Strategic alliance provides for an ongoing revenue stream to WB through referral based activity – the Bank does not have any significant operating expenses. Provides access to additional financial services for the bank’s more than 24,000 consumer clients and more than 2,400 business clients. Insurance, Investment and Trust Services Provides a higher degree of customer retention and new customer acquisition to Bank service.21 WEALTH MANAGEMENT & INSURANCE
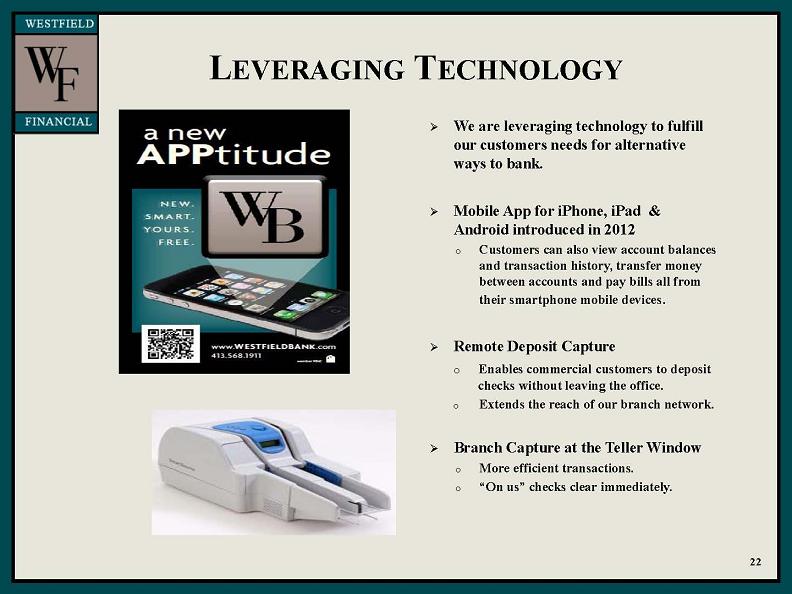
LEVERAGING TECHNOLOGY We are leveraging technology to fulfill our customers needs for alternative ways to bank. Mobile App for iPhone, iPad & Android introduced in 2012 Customers can also view account balances and transaction history, transfer money between accounts and pay bills all from their smartphone mobile devices. Remote Deposit Capture Enables commercial customers to deposit checks without leaving the office. Extends the reach of our branch network. Branch Capture at the Teller Window More efficient transactions. “On us” checks clear immediately.22
APPENDIX 23
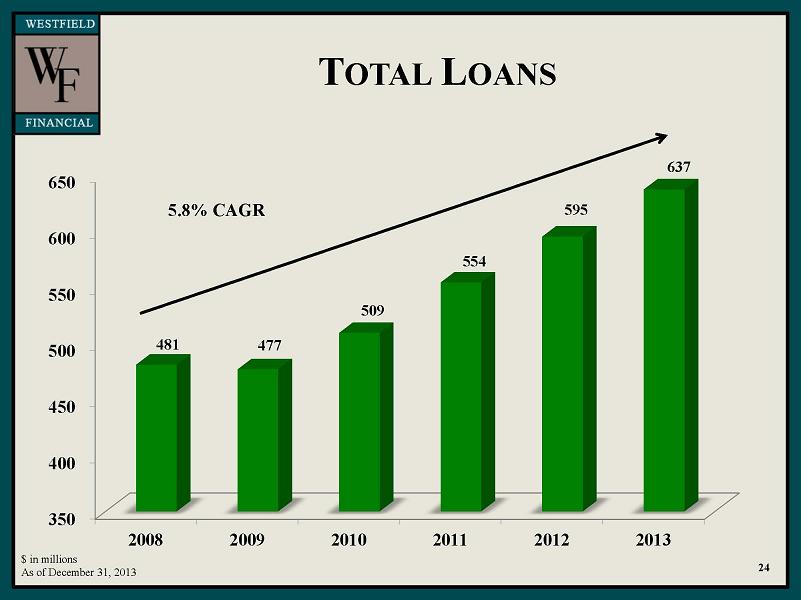
TOTAL LOANS 5.8% CAGR 24 350 400 450 500 550 600 650 2008 2009 2010 2011 2012 2013 481 477 509 554 595 637 $ in millions
As of December 31, 2013
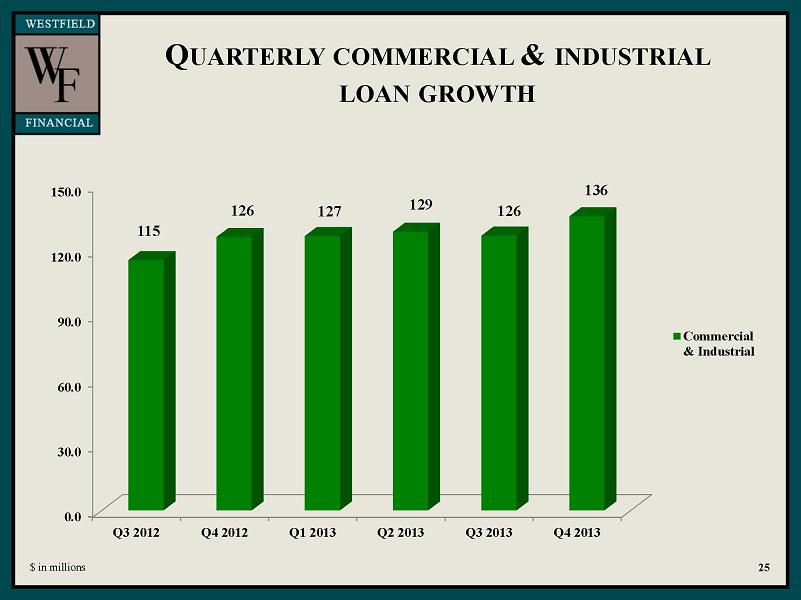
Commercial & Industrial QUARTERLY COMMERCIAL REAL ESTATE LOAN GROWTH 26 $ in millions 0.0 50.0 100.0 150.0 200.0 250.0 300.0 Q3 2012 Q4 2012 Q1 2013 Q2 2013 Q3 2013 Q4 2013 131 133 131 129 143 152 109 113 112 115 114 112
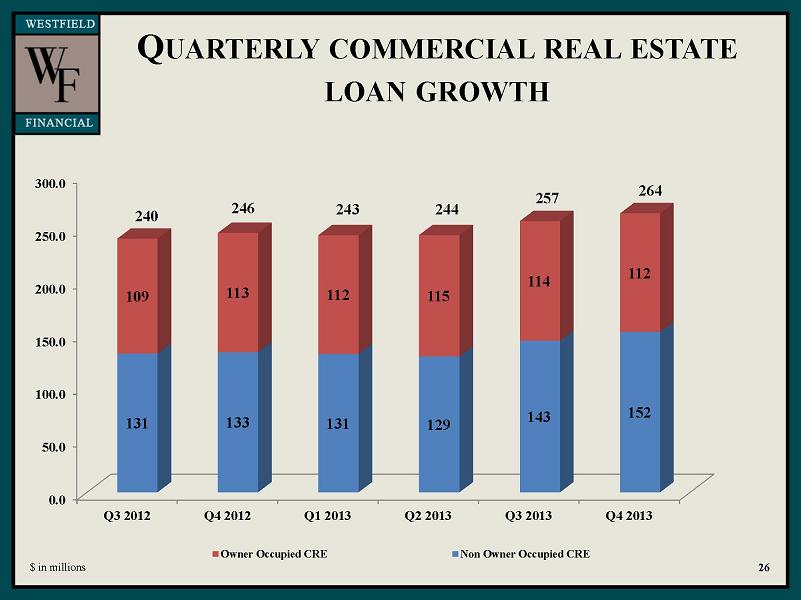
QUARTERLY COMMERCIAL REAL ESTATE LOAN GROWTH 26 $ in millions 0.0 50.0 100.0 150.0 200.0 250.0 300.0 Q3 2012 Q4 2012 Q1 2013 Q2 2013 Q3 2013 Q4 2013 131
133 131 129 143 152 109 113 112 115 114 112 Owner Occupied CRE Non Owner Occupied CRE 240 246 243 244 257 264
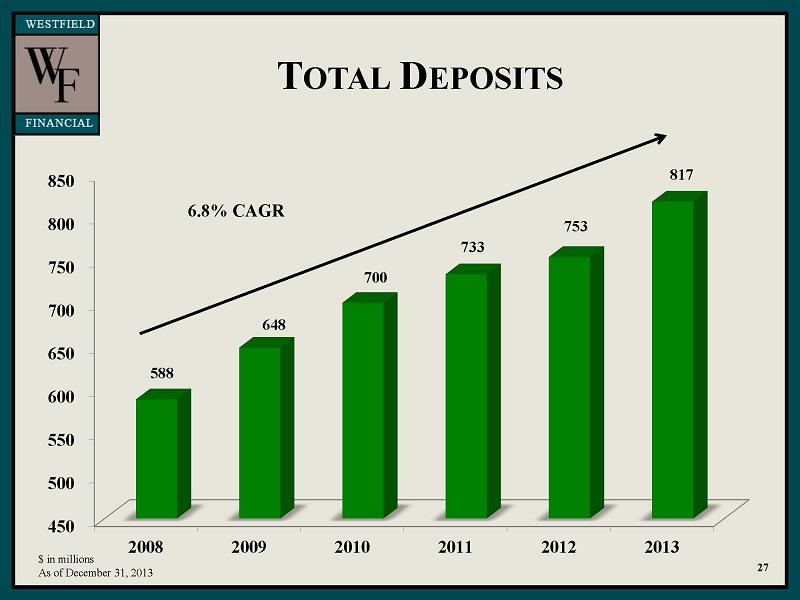
TOTAL DEPOSITS 27 $ in millions As of December 31, 2013 450 500 550 600 650 700 750 800 850 2008 2009 2010 2011
2012 2013 588 648 700 733 753 817 6.8% CAGR
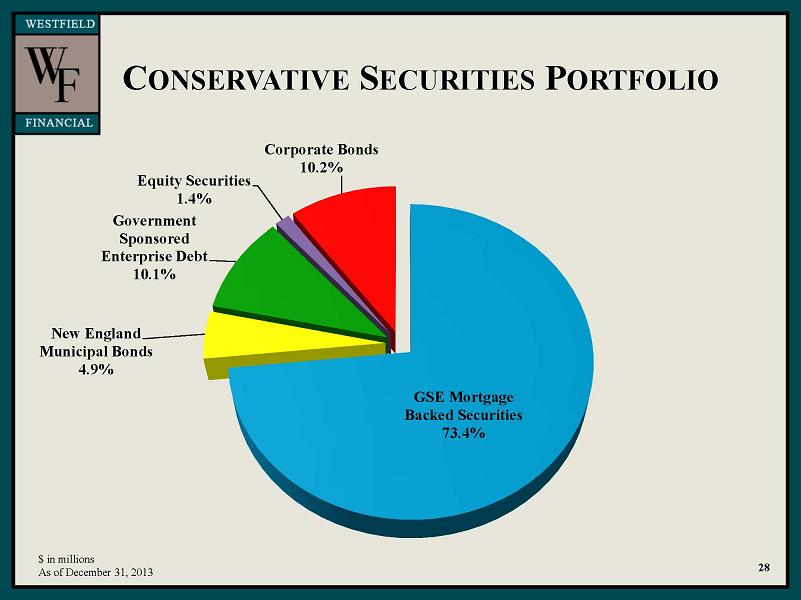
CONSERVATIVE SECURITIES PORTFOLIO 28 $ in millions As of December 31, 2013 GSE Mortgage Backed Securities 73.4% New England Municipal Bonds 4.9% Government Sponsored Enterprise Debt 10.1% Equity Securities 1.4% Corporate Bonds 10.2%
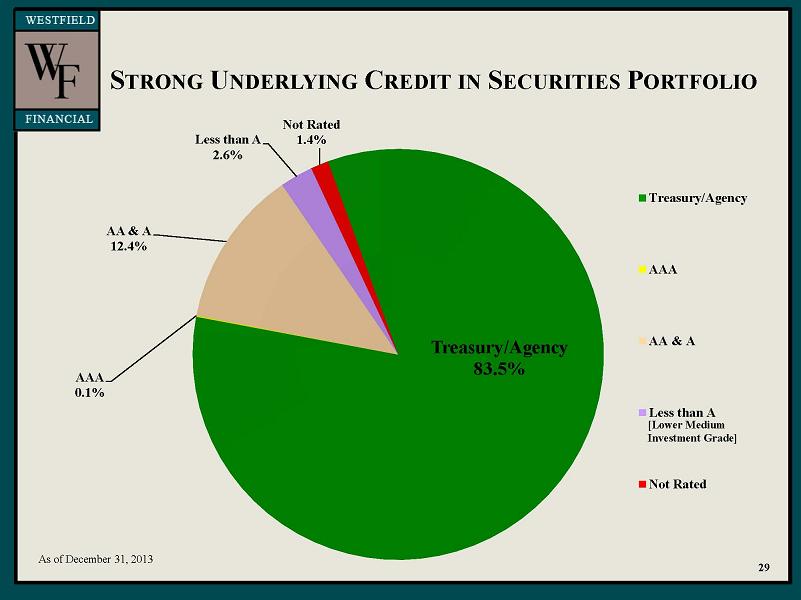
STRONG UNDERLYING CREDIT IN SECURITIES PORTFOLIO [Lower Medium Investment Grade] 29 As of December 31, 2013 Treasury/Agency 83.5% AAA 0.1% AA & A 12.4%
Less than A 2.6% Not Rated 1.4% Treasury/Agency AAA AA & A Less than A Not Rated
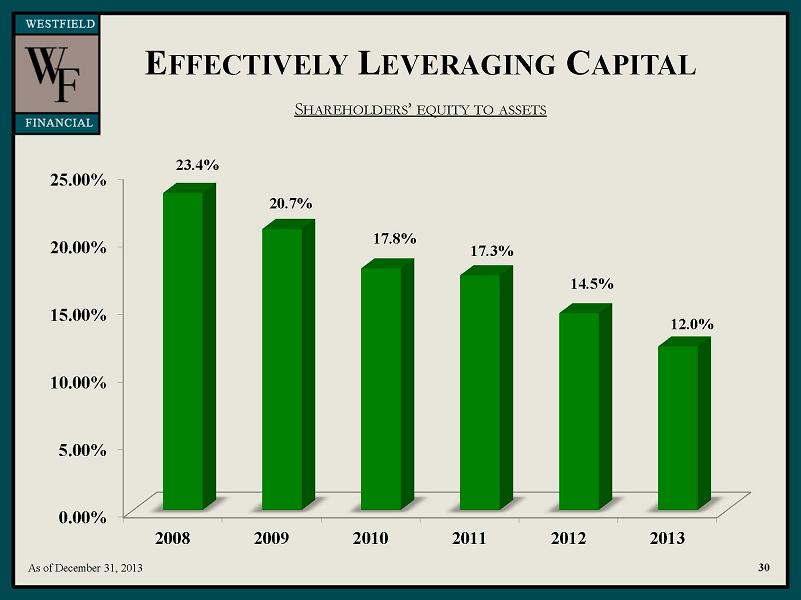
EFFECTIVELY LEVERAGING CAPITAL SHAREHOLDERS’ EQUITY TO ASSETS As of December 31, 2013 0.00% 5.00% 10.00% 15.00% 20.00% 25.00% 2008 2009 2010 2011 2012 2013 23.4% 20.7% 17.8% 17.3% 14.5% 12.0%
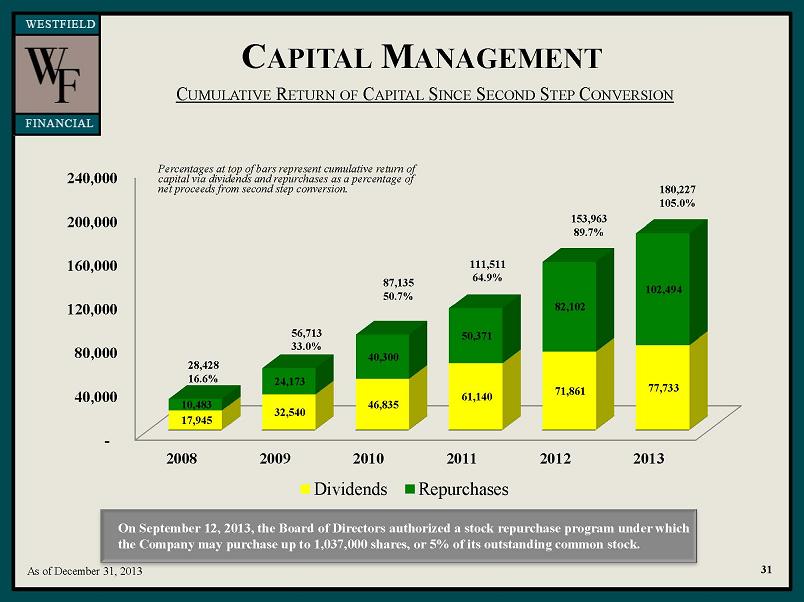
CAPITAL MANAGEMENT CUMULATIVE RETURN OF CAPITAL SINCE SECOND STEP CONVERSION On September 12, 2013, the Board of Directors authorized a stock repurchase program under which the Company may purchase up to 1,037,000 shares, or 5% of its outstanding common stock. 31 28,428 16.6% 56,713 33.0% Percentages at top of bars represent cumulative return of capital via dividends and repurchases as a percentage of net proceeds from second step conversion. 87,135 50.7% 111,511 64.9% 153,963 89.7% 180,227 105.0% As of December 31, 2013 - 40,000 80,000 120,000 160,000 200,000 240,000 2008 2009 2010 2011 2012 2013 17,945 32,540 46,835 61,140 71,861 77,733 10,483 24,173 40,300 50,371 82,102 102,494 Dividends Repurchases
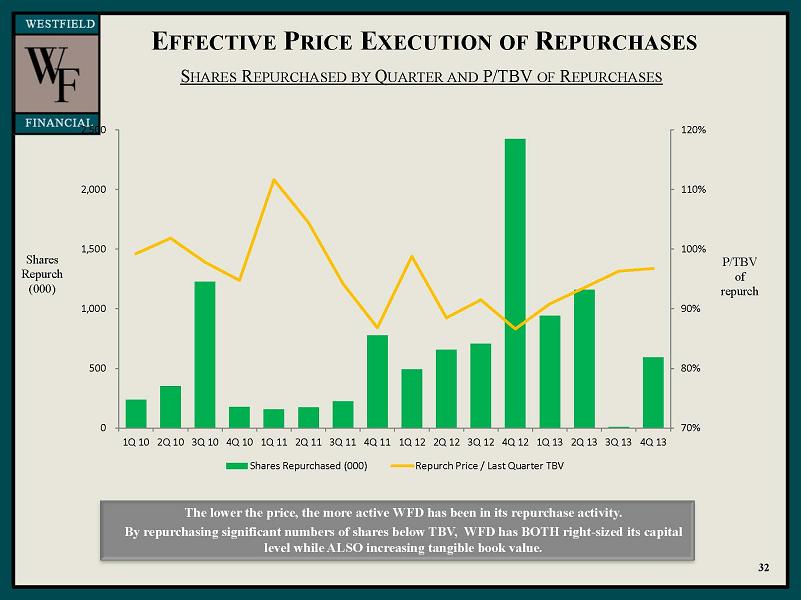
EFFECTIVE PRICE EXECUTION OF REPURCHASES SHARES REPURCHASED BY QUARTER AND P/TBV OF REPURCHASES The lower the price, the more active WFD has been in its repurchase activity. By repurchasing significant numbers of shares below TBV, WFD has BOTH right-sized its capital level while ALSO increasing tangible book value. Shares Repurch (000) P/TBV of repurch 32 70% 80% 90% 100% 110% 120% 0 500 1,000 1,500 2,000 2,500 1Q 10 2Q 10 3Q 10 4Q 10 1Q 11 2Q 11 3Q 11 4Q 11 1Q 12 2Q 12 3Q 12 4Q 12 1Q 13 2Q 13 3Q 13 4Q 13 Shares Repurchased (000) Repurch Price / Last Quarter TBV
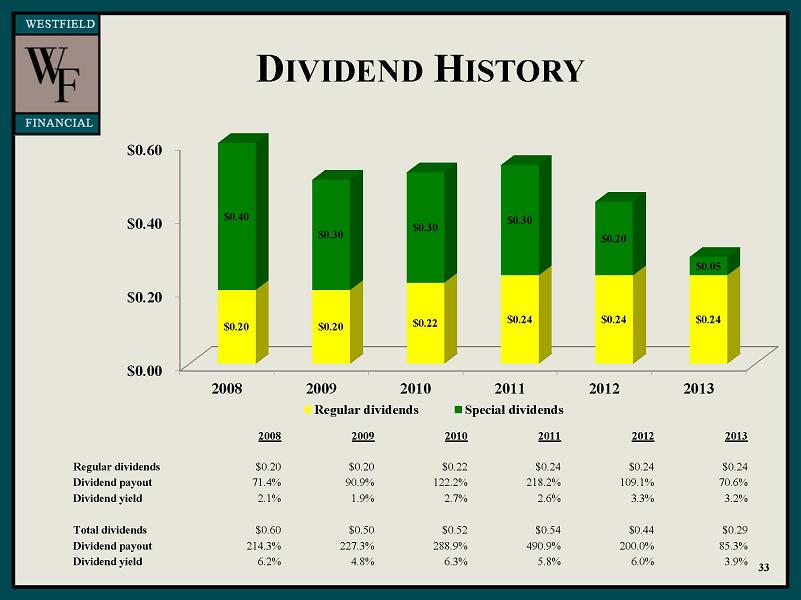
EFFECTIVE PRICE EXECUTION OF REPURCHASES SHARES REPURCHASED BY QUARTER AND P/TBV OF REPURCHASES The lower the price, the more active WFD has been in its repurchase activity. By repurchasing significant numbers of shares below TBV, WFD has BOTH right-sized its capital level while ALSO increasing tangible book value. Shares Repurch (000) P/TBV of repurch 32 70% 80% 90% 100% 110% 120% 0 500 1,000 1,500 2,000 2,500 1Q 10 2Q 10 3Q 10 4Q 10 1Q 11 2Q 11 3Q 11 4Q 11 1Q 12 2Q 12 3Q 12 4Q 12 1Q 13 2Q 13 3Q 13 4Q 13 Shares Repurchased (000) Repurch Price / Last Quarter TBV DIVIDEND HISTORY 33 $0.00 $0.20 $0.40 $0.60 2008 2009 2010 2011 2012 2013 $0.20 $0.20 $0.22 $0.24 $0.24 $0.24 $0.40 $0.30 $0.30 $0.30 $0.20 $0.05 Regular dividends Special dividends 2008 2009 2010 2011 2012 2013 Regular dividends $0.20 $0.20 $0.22 $0.24 $0.24 $0.24 Dividend payout 71.4% 90.9% 122.2% 218.2% 109.1% 70.6% Dividend yield 2.1% 1.9% 2.7% 2.6% 3.3% 3.2% Total dividends $0.60 $0.50 $0.52 $0.54 $0.44 $0.29 Dividend payout 214.3% 227.3% 288.9% 490.9% 200.0% 85.3% Dividend yield 6.2% 4.8% 6.3% 5.8% 6.0% 3.9%
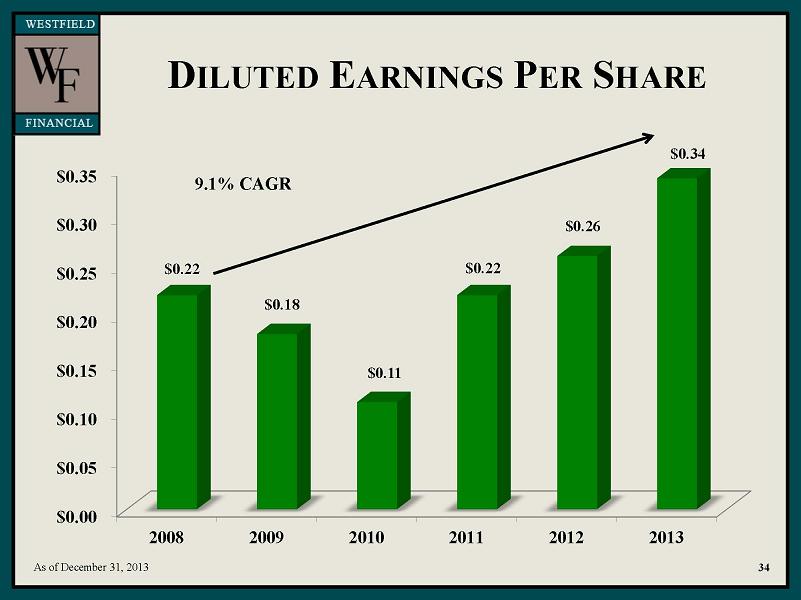
DILUTED EARNINGS PER SHARE 34 As of December 31, 2013 $0.00 $0.05 $0.10 $0.15 $0.20 $0.25 $0.30 $0.35 2008 2009 2010 2011 2012 2013 $0.22 $0.18 $0.11 $0.22 $0.26 $0.34 9.1% CAGR
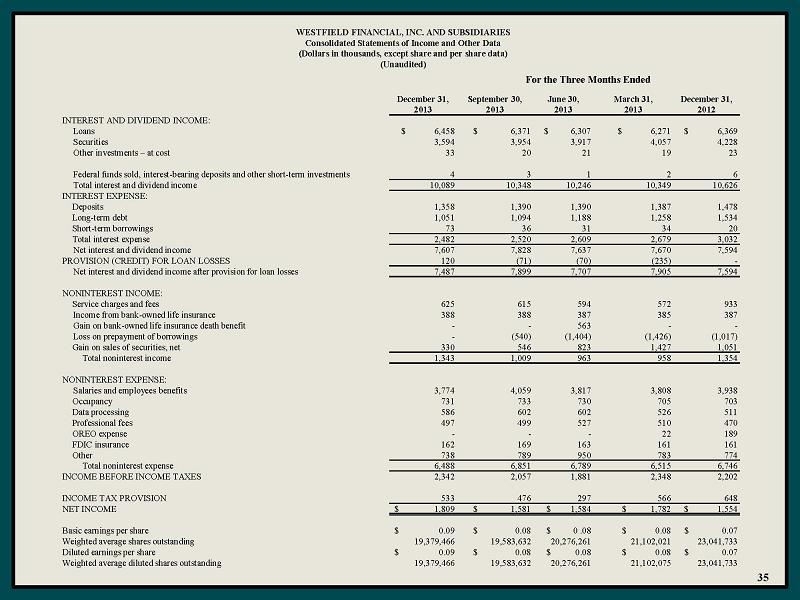
For the Three Months Ended December 31, September 30, June 30, March 31, December 31, 2013 2013 2013 2013 2012 INTEREST AND DIVIDEND INCOME: Loans $ 6,458 $ 6,371 $ 6,307 $ 6,271 $ 6,369 Securities 3,594 3,954 3,917 4,057 4,228 Other investments – at cost 33 20 21 19 23 Federal funds sold, interest-bearing deposits and other short-term investments 4 3 1 2 6 Total interest and dividend income 10,089 10,348 10,246 10,349 10,626 INTEREST EXPENSE: Deposits 1,358 1,390 1,390 1,387 1,478 Long-term debt 1,051 1,094 1,188 1,258 1,534 Short-term borrowings 73 36 31 34 20 Total interest expense 2,482 2,520 2,609 2,679 3,032 Net interest and dividend income 7,607 7,828 7,637 7,670 7,594 PROVISION (CREDIT) FOR LOAN LOSSES 120 (71) (70) (235) - Net interest and dividend income after provision for loan losses 7,487 7,899 7,707 7,905 7,594 NONINTEREST INCOME: Service charges and fees 625 615 594 572 933 Income from bank-owned life insurance 388 388 387 385 387 Gain on bank-owned life insurance death benefit - - 563 - - Loss on prepayment of borrowings - (540) (1,404) (1,426) (1,017) Gain on sales of securities, net 330 546 823 1,427 1,051 Total noninterest income 1,343 1,009 963 958 1,354 NONINTEREST EXPENSE: Salaries and employees benefits 3,774 4,059 3,817 3,808 3,938 Occupancy 731 733 730 705 703 Data processing 586 602 602 526 511 Professional fees 497 499 527 510 470 OREO expense - - - 22 189 FDIC insurance 162 169 163 161 161 Other 738 789 950 783 774 Total noninterest expense 6,488 6,851 6,789 6,515 6,746 INCOME BEFORE INCOME TAXES 2,342 2,057 1,881 2,348 2,202 INCOME TAX PROVISION 533 476 297 566 648 NET INCOME $ 1,809 $ 1,581 $ 1,584 $ 1,782 $ 1,554 Basic earnings per share $ 0.09 $ 0.08 $ 0 .08 $ 0.08 $ 0.07 Weighted average shares outstanding 19,379,466 19,583,632 20,276,261 21,102,021 23,041,733 Diluted earnings per share $ 0.09 $ 0.08 $ 0.08 $ 0.08 $ 0.07 Weighted average diluted shares outstanding 19,379,466 19,583,632 20,276,261 21,102,075 23,041,733 WESTFIELD FINANCIAL, INC. AND SUBSIDIARIES Consolidated Statements of Income and Other Data (Dollars in thousands, except share and per share data) (Unaudited)
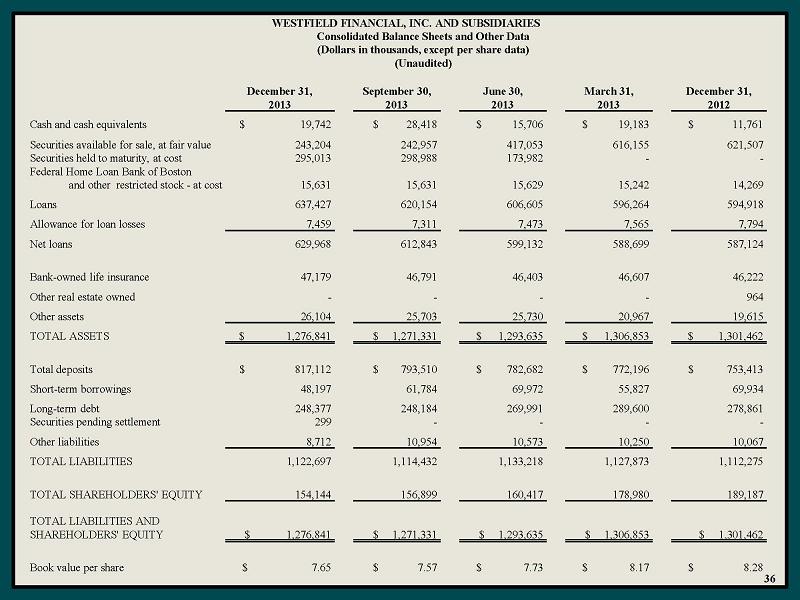
WESTFIELD FINANCIAL, INC. AND SUBSIDIARIES Consolidated Balance Sheets and Other Data (Dollars in thousands, except per share data) (Unaudited) December 31, September 30, June 30, March 31, December 31, 2013 2013 2013 2013 2012 Cash and cash equivalents $ 19,742 $ 28,418 $ 15,706 $ 19,183 $ 11,761 Securities available for sale, at fair value 243,204 242,957 417,053 616,155 621,507 Securities held to maturity, at cost 295,013 298,988 173,982 - - Federal Home Loan Bank of Boston and other restricted stock - at cost 15,631 15,631 15,629 15,242 14,269 Loans 637,427 620,154 606,605 596,264 594,918 Allowance for loan losses 7,459 7,311 7,473 7,565 7,794 Net loans 629,968 612,843 599,132 588,699 587,124 Bank-owned life insurance 47,179 46,791 46,403 46,607 46,222 Other real estate owned - - - - 964 Other assets 26,104 25,703 25,730 20,967 19,615 TOTAL ASSETS $ 1,276,841 $ 1,271,331 $ 1,293,635 $ 1,306,853 $ 1,301,462 Total deposits $ 817,112 $ 793,510 $ 782,682 $ 772,196 $ 753,413 Short-term borrowings 48,197 61,784 69,972 55,827 69,934 Long-term debt 248,377 248,184 269,991 289,600 278,861 Securities pending settlement 299 - - - - Other liabilities 8,712 10,954 10,573 10,250 10,067 TOTAL LIABILITIES 1,122,697 1,114,432 1,133,218 1,127,873 1,112,275 TOTAL SHAREHOLDERS' EQUITY 154,144 156,899 160,417 178,980 189,187 TOTAL LIABILITIES AND SHAREHOLDERS' EQUITY $ 1,276,841 $ 1,271,331 $ 1,293,635 $ 1,306,853 $ 1,301,462 Book value per share $ 7.65 $ 7.57 $ 7.73 $ 8.17 $ 8.28
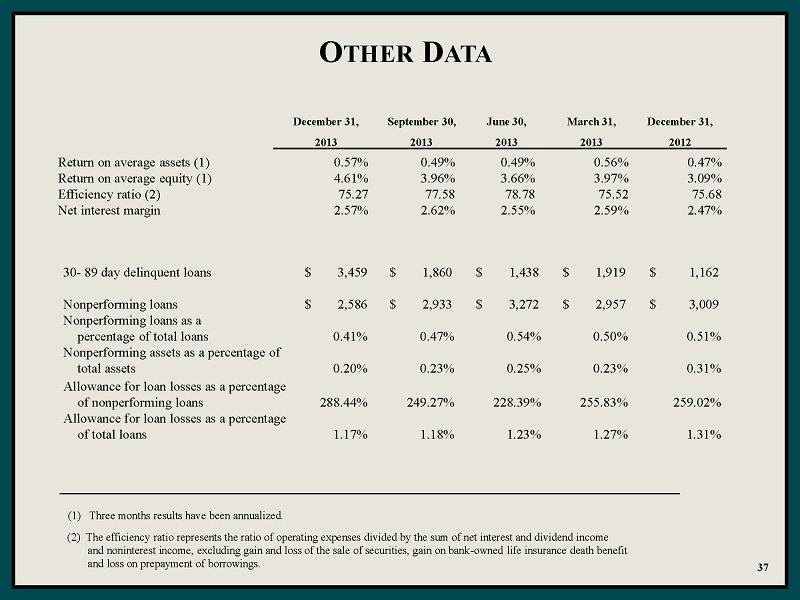
OTHER DATA Return on average assets (1) 0.57% 0.49% 0.49% 0.56% 0.47% Return on average equity (1) 4.61% 3.96% 3.66% 3.97% 3.09% Efficiency ratio (2) 75.27 77.58 78.78 75.52 75.68 Net interest margin 2.57% 2.62% 2.55% 2.59% 2.47% 30- 89 day delinquent loans $ 3,459 $ 1,860 $ 1,438 $ 1,919 $ 1,162 Nonperforming loans $ 2,586 $ 2,933 $ 3,272 $ 2,957 $ 3,009 Nonperforming loans as a percentage of total loans 0.41% 0.47% 0.54% 0.50% 0.51% Nonperforming assets as a percentage of total assets 0.20% 0.23% 0.25% 0.23% 0.31% Allowance for loan losses as a percentage of nonperforming loans 288.44% 249.27% 228.39% 255.83% 259.02% Allowance for loan losses as a percentage of total loans 1.17% 1.18% 1.23% 1.27% 1.31% December 31, September 30, June 30, March 31, December 31, 2013 2013 2013 2013 2012 (1) Three months results have been annualized. (2) The efficiency ratio represents the ratio of operating expenses divided by the sum of net interest and dividend income and noninterest income, excluding gain and loss of the sale of securities, gain on bank-owned life insurance death benefit and loss on prepayment of borrowings.
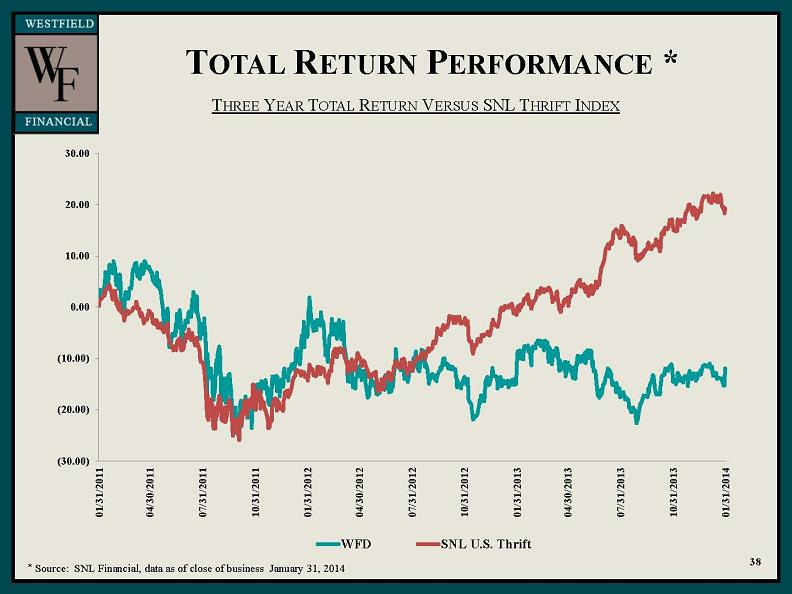
TOTAL RETURN PERFORMANCE * THREE YEAR TOTAL RETURN VERSUS SNL THRIFT INDEX * Source: SNL Financial, data as of close of business January 31, 2014. 38 (30.00) (20.00) (10.00) 0.00 10.00 20.00 30.00 01/31/2011 04/30/2011 07/31/2011 10/31/2011 01/31/2012 04/30/2012 07/31/2012 10/31/2012 01/31/2013 04/30/2013 07/31/2013 10/31/2013 01/31/2014 WFD SNL U.S. Thrift