Attached files
| file | filename |
|---|---|
| 8-K - FORM 8-K - MID AMERICA APARTMENT COMMUNITIES INC. | v367887_8k.htm |

Capital Markets Update February 2014

Merger Integration Update Announcement June 3, 2013 Closed October 1, 2013 Dec 2014 Dec 2013 Identified $25M of synergies Numerous due - diligence site visits Exchange of non - public financial information; extensive due diligence and valuation analysis Pre - announcement review with Rating Agencies; day of announcement up - grade by S&P and reaffirmation of ratings by Moody’s and Fitch Lender consents on $2.6 billion in debt Numerous joint management site visits Final management structure in place Formally launch new corporate identity Estimate 40 - 50% of synergies realized on a run rate basis Consolidated financial reporting, forecasting and resident service capabilities fully in place Completed consolidation of all payroll, HR, general ledger, and accounts payable systems Captured approximately 67% of synergy opportunity Marketing for sale operating CLP commercial properties and other land parcels Realize 100% of stated synergy opportunity on a run rate basis Full systems integration complete Exit $300M of commercial and multifamily assets Construction complete on existing development pipeline, 70% average occupancy Initial redevelopment underway on legacy CLP portfolio 2 June 2014 Complete migration to one property management system Capture approximately 75% of synergy opportunity Exit significant portion of operating commercial assets Fund 90% of existing development pipeline; 30 - 35% average occupancy Lease - up properties fully stabilized 2015 Begin to capture accretion from development pipeline and asset recycling Full impact of operating efficiencies realized Redevelopment of legacy CLP portfolio ongoing Exit remainder of non core assets Development pipeline fully stabilized by end of year

Merger Opportunities 3 • We believe there is approximately $25 million ($0.32 per share) of combined expense synergies across the platform, to be captured on a run rate basis by the end of 2014 ● NOI operating synergies: economies of scale in combined insurance program and national accounts; R&M and property personnel efficiencies; fee opportunities ● Stabilization of $200 million development pipeline ● Recycle $65 - $70 million of non - earning land / non - core assets ● Roll out MAA redevelopment program to legacy CLP properties – 30% - 50% of portfolio ($75 million redevelopment program) ● These combined opportunities represent an additional $0.30 - $0.50 per share of opportunity (on top of $25 million of expense synergy above), of which we expect to realize $0.06 - $0.08 in 2014 (with balance over 2015/16) Colonial Grand at Double Creek - Austin, TX Additional Areas of Opportunity (beyond $25M of synergies) FFO/Share Opportunity NOI Operating Synergies $0.05 - $0.11 Stabilize Development Pipeline $0.10 - $0.14 Recycle Non - earning Assets $0.05 - $0.08 Redevelopment of CLP Assets $0.10 - $0.17 Total $0.30 - $0.50 Value Premium Paid 1 ($226.5 million) Deal Costs ($60.0 million) Total Cost ($286.5 million) Value of Synergy & Redevelopment ($42M)* $579.6 million Net Value $293.1 million * Using Pre - Merger announcement FFO multiple of 13.8 and midpoint of synergy opportunity; at current sector multiple of 16, Net V alue increases to $385.5M (1) Implied price paid based on day of announcement at .360x exchange rate

2014 Guidance and Earnings Summary 4 2014 Guidance Range Core FFO/Share $4.80 - $5.00 Core AFFO/Share $4.00 - $4.20 SS Revenue Growth 3.5% - 4.5% SS Expense Growth 3% - 4% SS NOI Growth 4% - 5% Multifamily Acquisition Volume $200 - $300 Million Multifamily Disposition Volume $125 - $175 Million Commercial / Land Disposition Volume $125 - $175 Million Development Investment $65 - $70 Million G&A and Property Management Expenses $55 - $57 Million Merger and Integration Expenses $9 - $10 Million Average Interest Rate 4.3% - 4.5% Leverage (Net Debt/Total Gross Assets) 42% - 45% Unencumbered Asset Pool (% of Total Gross Assets 60% - 65% 2014 Impact of Merger and Strategic Initiatives Estimated FFO/Share Comments Dilution of Merger Transaction (net of $25 million of stated expense synergies) ($0.23) Initial Impact of acquiring less productive balance sheet Marginal Dilution from Development Pipeline ($0.05) Current development pipeline at most dilutive stage Marginal Dilution from Asset Recycling ($0.02) Recycling out of commercial assets and recycling MF assets Accretion from NOI/Redevelopment Opportunities $0.07 2014 gains from synergy opportunities that will further expand in 2015 and beyond Net Impact to 2014 ($0.23)

Leasing Outlook 5 New Jobs Per Multifamily Completion • Over the last up cycle (2004 - 2007), the ratio of new jobs to multifamily completions in our markets averaged 7 to 1; 2014 projections around 8 to 1 in our large markets and over 10 to 1 in our secondary markets. • The projected ratio for large markets continues to look favorable, while the expectations for the secondary markets are even more favorable as job growth is expected to accelerate while relative supply is lower. Projected Employment Growth (MAA growth weighted by portfolio concentration) • MAA’s markets expected to significantly exceed the national average in job growth • This job growth should enable positive absorption of forecasted new supply and support continued above long - term average rent growth Source: U.S. Census Bureau; Moody’s Economy.com 1.9% 2.4% 1.9% 2.6% 3.0% 2.6% 0.0% 0.5% 1.0% 1.5% 2.0% 2.5% 3.0% 3.5% 2014 2015 2016 National MSA Average MAA Markets - 2 4 6 8 10 12 14 2012 2013 2014F Large MAA Markets Secondary MAA Markets
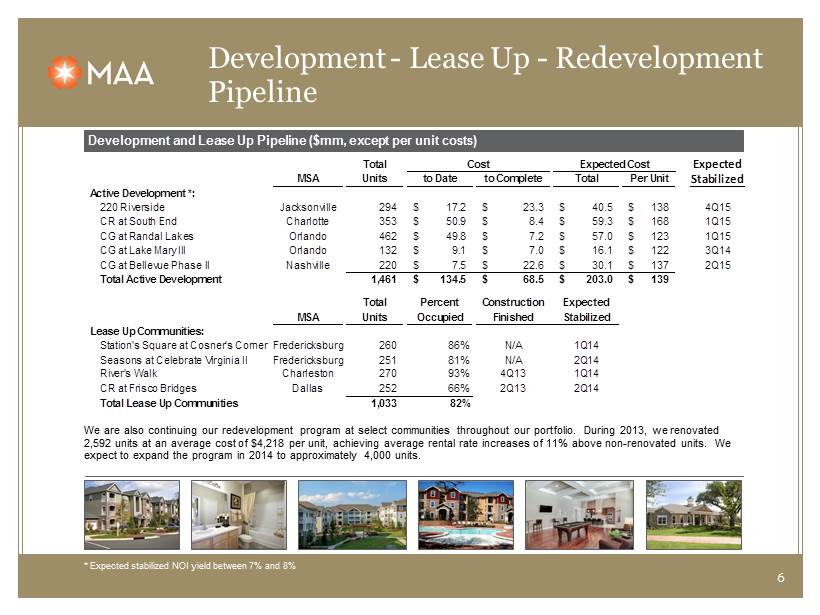
Development - Lease Up - Redevelopment Pipeline * Expected stabilized NOI yield between 7% and 8% Development and Lease Up Pipeline ($mm, except per unit costs) $242.8 Total Expected MSA Units to Date to Complete Total Per Unit Stabilized Active Development *: 220 Riverside Jacksonville 294 17.2$ 23.3$ 40.5$ 138$ 4Q15 CR at South End Charlotte 353 50.9$ 8.4$ 59.3$ 168$ 1Q15 CG at Randal Lakes Orlando 462 49.8$ 7.2$ 57.0$ 123$ 1Q15 CG at Lake Mary III Orlando 132 9.1$ 7.0$ 16.1$ 122$ 3Q14 CG at Bellevue Phase II Nashville 220 7.5$ 22.6$ 30.1$ 137$ 2Q15 Total Active Development 1,461 134.5$ 68.5$ 203.0$ 139$ Total Percent Construction Expected MSA Units Occupied Finished Stabilized Lease Up Communities: Station's Square at Cosner's Corner Fredericksburg 260 86% N/A 1Q14 Seasons at Celebrate Virginia II Fredericksburg 251 81% N/A 2Q14 River's Walk Charleston 270 93% 4Q13 1Q14 CR at Frisco Bridges Dallas 252 66% 2Q13 2Q14 Total Lease Up Communities 1,033 82% Cost Expected Cost 6 We are also continuing our redevelopment program at select communities throughout our portfolio. During 2013, we renovated 2,592 units at an average cost of $4,218 per unit, achieving average rental rate increases of 11% above non - renovated units. We expect to expand the program in 2014 to approximately 4,000 units. yield between 7% and 8%

Continuous Portfolio Upgrade Through Capital Recycling 7 Active capital redeployment • We expect to dispose of approximately $150 million of multifamily assets and $150 million of commercial and land assets in 2014 • Targeted commercial sales include legacy CLP’s 4 major operating properties: • CC Brookwood Village – Office in Birmingham, AL • Brookwood Village – Retail in Birmingham, AL • CP Nord du Lac – Retail in Covington, LA • CP Craft Farms – Retail in Gulf Shores, AL • As a result of planned disposition activity, and forecasted acquisitions in a range of $200 - $300 million, we expect to be “net sellers” in 2014 Price Cap (000s) Units Rate Age Acquisitions by Year (wholly-owned): 2009 78,300$ 1,064 6.9% 4 2010 230,050$ 2,138 6.0% 1 2011 362,515$ 3,055 5.9% 3 2012 345,075$ 2,451 5.6% 6 2013 129,160$ * 1,137 5.8% 7 1,145,100$ 9,845 5.9% 4 2014F 250,000$ * Price represents purchase of 2/3 remaining ownership in Joint Venture Dispositions by Year (wholly-owned): 2009 29,800$ 840 7.0% 27 2010 -$ - 2011 23,950$ 534 6.5% 27 2012 113,200$ 2,254 6.8% 23 2013 131,300$ 2,108 7.2% 26 298,250$ 5,736 7.0% 25 2014F 300,000$

Strong Investment Grade Balance Sheet and Manageable Debt Maturity Profile Credit metrics New MAA LT Target Credit Ratings Total unencumbered assets to book value 62.2% 65% - 70% Fitch BBB Net Debt / Recurring EBITDA 1 6.3x 6.0x Moody’s Baa2 Net Debt / gross assets 2 42.4% 40% - 45% GAV S&P BBB Secured debt / gross assets 2 22.4% 15% - 20% Fixed charge coverage ratio 3 3.6x 3.8x - 4.0x Note: As of 12/31/13 1) Recurring EBITDA represents the three months ended December 31, 2013 on an annualized basis 2) Gross assets is defined as the total assets plus accumulated depreciation 3) Fixed charge coverage represents Recurring EBITDA divided by interest expense adjusted for mark - to - market debt adjustment Debt maturity profile ($mm) $443 $364 $184 $457 $431 $1,517 2014 2015 2016 2017 2018 2019+ 13.0% 10.7% 5.4% 13.5% 44.7% % maturing 12.7% Note: Debt maturity schedule excludes FMV adjustments 8 • 97% of debt either fixed or hedged • Approximately $500 million of capacity at 12/31/13

Summary 9 x Merger related opportunities and scale creates upside over the next 2 - 3 years x Pipeline of redevelopment, lease - up and new development to contribute to earnings x Actively continuing to create higher value through capital recycling x Solid balance sheet strength and well positioned relative to strategy x Good progress on merger integration x Outlook for continued solid leasing fundamentals

Certain matters in this presentation may constitute forward - looking statements within the meaning of Section 27 - A of the Securities Act of 1933 and Section 21 E of the Securities and Exchange Act of 1934 . Such statements include, but are not limited to, statements made about anticipated economic and market conditions, expectations for future demographics, the impact of competition, general changes in the apartment industry, expectations for acquisition and joint venture performance, ability to pay dividends and the ability to obtain financing at reasonable rates . Actual results and the timing of certain events could differ materially from those projected in or contemplated by the forward - looking statements due to a number of factors, including a downturn in general economic conditions or the capital markets, competitive factors including overbuilding or other supply/demand imbalances in some or all of our markets, changes in interest rates and other items that are difficult to control such as the impact of legislation, as well as the other general risks inherent in the apartment and real estate businesses . Reference is hereby made to the filings of Mid - America Apartment Communities, Inc . , with the Securities and Exchange Commission, including quarterly reports on Form 10 - Q, reports on Form 8 - K, and its annual report on Form 10 - K, particularly including the risk factors contained in the latter filing . Eric Bolton CEO 901 - 248 - 4127 eric.bolton@maac.com Al Campbell CFO 901 - 248 - 4169 al.campbell@maac.com 10 Tim Argo SVP, Finance 901 - 248 - 4149 tim.argo@maac.com Jennifer Patrick Investor Relations 901 - 435 - 5371 j ennifer.patrick@maac.com