Attached files
| file | filename |
|---|---|
| 8-K - FORM 8-K - Federal Home Loan Bank of New York | d674414d8k.htm |
| EX-99.1 - EX-99.1 - Federal Home Loan Bank of New York | d674414dex991.htm |
 FHLBNY: Strong Performance for
Customers and Shareholders
February 11, 2014
©
2014
FEDERAL
HOME
LOAN
BANK
OF
NEW
YORK
•
101
PARK
AVENUE
•
NEW
YORK,
NY
10178
•
WWW.FHLBNY.COM
Exhibit 99.2 |
 Key
Messages FEDERAL HOME LOAN BANK OF NEW YORK
1
»
“Advances Bank”
strategy
»
Strong performance record for customers and shareholders
»
Conservatively positioned balance sheet
»
HLBank System’s financial results have improved since the
financial crisis |
 FEDERAL HOME LOAN BANK OF NEW YORK
HLBNY is the Largest Bank in the Home Loan Bank System
as Measured by Advances Balances and Total Assets
Total Advances
Change in Advances: 2Q07 vs 3Q13
Note: As of September 30, 2013
SEA
CHI
DAL
IND
TOP
BOS
PIT
SFR
DSM
CIN
ATL
NYK
$0
$20
$40
$60
$80
$100
102%
39%
46%
-100%
-50%
0%
50%
100%
150%
SEA
CHI
DAL
IND
TOP
BOS
PIT
SFR
DSM
CIN
ATL
NYK
25%
-
-74%
-29%
-42%
-34%
-14%
-54%
-38%
-62%
2
($ Billions) |
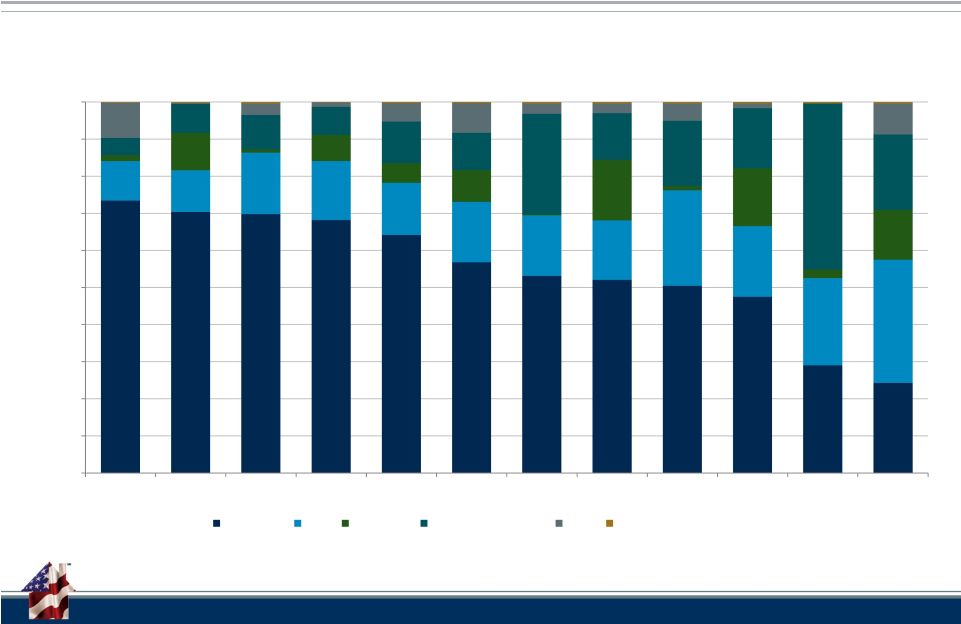 HLBNY
Has Consistently Maintained a High Percentage of Advances Relative to
Assets Balance Sheet by Type of Assets
3
Note: As of September 30, 2013
0%
10%
20%
30%
40%
50%
60%
70%
80%
90%
100%
NYK
DSM
ATL
CIN
PIT
BOS
DAL
TOP
SFR
IND
SEA
CHI
Advances
MBS
MPF/MPP
Other Investments
Cash
Other
FEDERAL HOME LOAN BANK OF NEW YORK
3 |
 FHLBNY’s Borrower Base is Diverse
Note: Par value of advances.
Top 5 Borrowers
December 31, 2013
Top 5 Borrowers
($ billions)
Citibank, N.A.
$ 22.2
Metropolitan Life Insurance
Company
$ 12.8
New York Community Bank
$ 10.1
Hudson City Savings Bank, FSB
$ 6.0
First Niagara Bank, National
Association
$ 4.3
All Other
Borrowers
$21.1
Next 5
Borrowers
$12.2
Top 5
Borrowers
$55.4
4
FEDERAL HOME LOAN BANK OF NEW YORK |
 The
Bank’s Financial Performance Has Been Strong FHLBNY -
Financial Results Highlights
Notes: All $ millions. *95% of the bank’s MBS investments are GSE
securities. 2013
2012
2011
Year End Balances
Advances
$90,765
$75,888
$70,864
MBS Investments*
12,954
12,620
12,477
Total Assets
128,333
102,989
97,662
Consolidated Obligations
119,146
94,564
89,564
Retained Earnings
999
894
746
Capital Stock
6,489
5,492
5,046
Annual Results
Net Interest Income
$421
$467
$509
Operating Expenses
83
83
109
Net Income
305
361
244
FEDERAL HOME LOAN BANK OF NEW YORK
5 |
 FHLBNY Dividends Have Been Reliable and Exceeded
Market Reference Rates
6
FHLBNY Dividend
1 Month Libor
3 Month Libor
Fed Funds (Effective Rate)
4.0
5.0
6.0
7.0
8.0
9.0
0.0
1.0
2.0
3.0
FEDERAL HOME LOAN BANK OF NEW YORK |
 FHLBNY Has Been Profitable With a Conservative Approach
Return on Equity
FEDERAL HOME LOAN BANK OF NEW YORK
7
0.00%
2.00%
4.00%
6.00%
8.00%
10.00%
12.00%
14.00%
CHI
SFR
IND
NYK
TOP
CIN
BOS
SEA
DAL
ATL
DSM
PIT
Q3 2013
2012 |
 HLBank Balance Sheets Are Scalable to Meet Member
Liquidity Needs
0
200,000
400,000
600,000
800,000
1,000,000
1,200,000
FHLB System Advances
($ Millions)
FEDERAL HOME LOAN BANK OF NEW YORK
8 |
 HLBNY Has Retained More of Our Advances From the Crisis
Than the HLBank System
0
20
40
60
80
100
120
140
160
180
200
System and HLBNY Advances: Indexed
1Q2006 = 100
HLBNY
FEDERAL HOME LOAN BANK OF NEW YORK
9
System |
 System Advances Have Grown in Recent Quarters
System Quarterly Change in Advances
-8.21%
-11.98%
-9.62%
-8.25%
-6.89%
-9.37%
-5.55%
-7.53%
-4.21%
-7.00%
-3.74%
-3.05%
0.67%
-5.79%
6.20%
-1.46%
3.27%
-1.75%
9.60%
1.45%
-
15%
-
10%
-
5%
0%
5%
10%
15%
Q408
Q109
Q209
Q309
Q409
Q110
Q210
Q310
Q410
Q111
Q211
Q311
Q411
Q112
Q212
Q312
Q412
Q113
Q213
Q313
FEDERAL HOME LOAN BANK OF NEW YORK
10 |
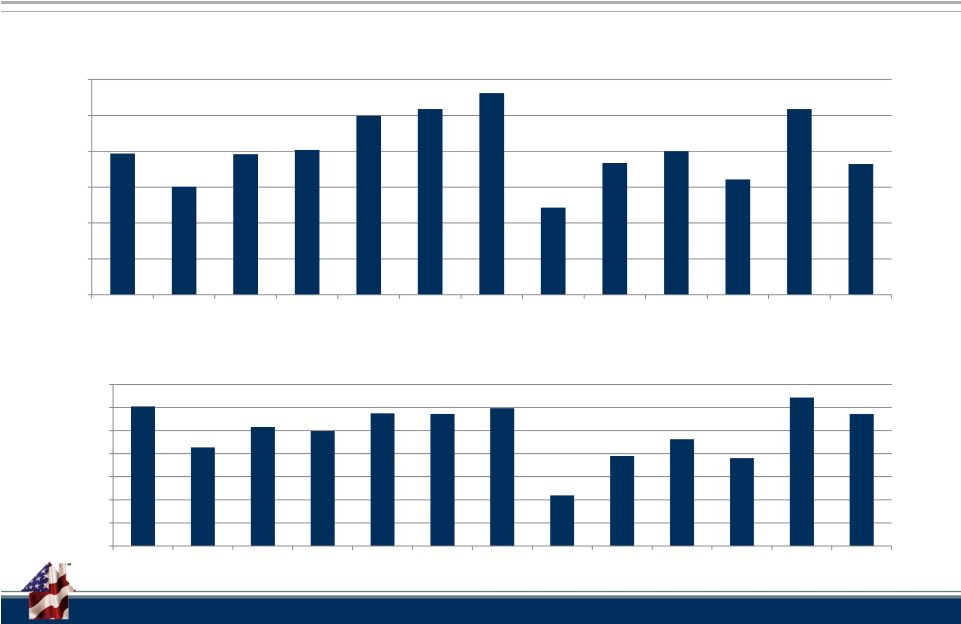 System Financial Performance Has Improved Considerably
Since the Financial Crisis
11
HLBank System Net Income: 2001-3Q2013
HLBank System ROE: 2001-3Q2013
-
500
1,000
1,500
2,000
2,500
3,000
2001
2002
2003
2004
2005
2006
2007
2008
2009
2010
2011
2012
YTD Q3
2013
0.00%
1.00%
2.00%
3.00%
4.00%
5.00%
6.00%
7.00%
2001
2002
2003
2004
2005
2006
2007
2008
2009
2010
2011
2012
YTD Q3
2013
FEDERAL HOME LOAN BANK OF NEW YORK
11
($Millions) |
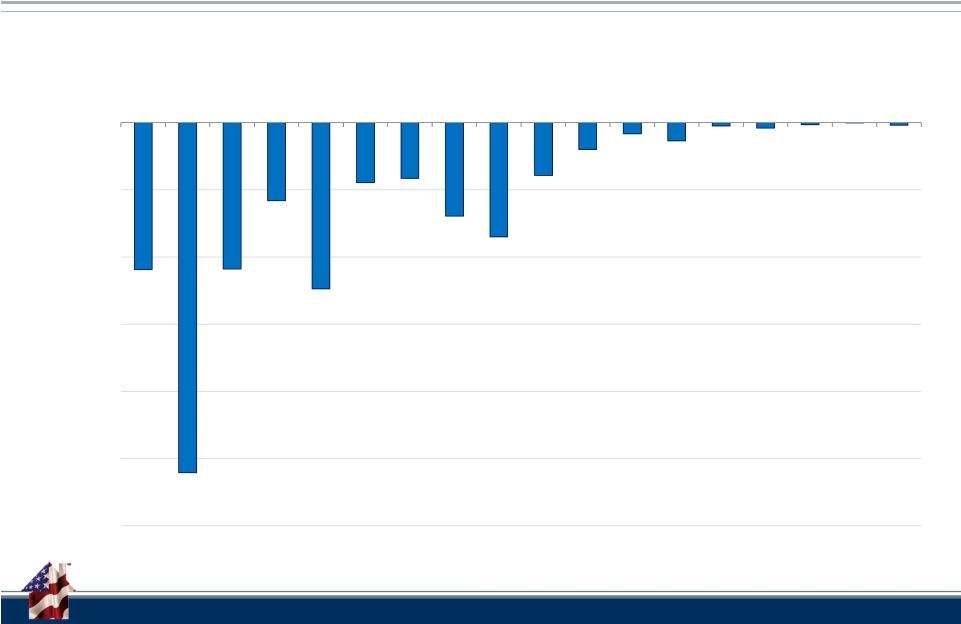 System OTTI Credit Losses Have Fallen Dramatically in
Recent Years
12
($1,200.0)
($1,000.0)
($800.0)
($600.0)
($400.0)
($200.0)
$0.0
Q209
Q309
Q409
Q110
Q210
Q310
Q410
Q111
Q211
Q311
Q411
Q112
Q212
Q312
Q412
Q113
Q213
Q313
System Credit OTTI by Quarter
($ Millions)
FEDERAL HOME LOAN BANK OF NEW YORK
12 |
 Restricted Retained Earnings Balances
The HLBanks Continue to Build Restricted Retained
Earnings to Protect Debt Investors and Members’
Investment
13
= actual $ amount of RRE on balance sheet (LHS)
= RRE as % of CO’s outstanding (RHS)
Note: As of September 30, 2013
$90
$140
$51
$119
$98
$69
$167
$43
$36
$44
$174
$48
0.00%
0.20%
0.40%
0.60%
0.80%
1.00%
$0
$20
$40
$60
$80
$100
$120
$140
$160
$180
$200
FEDERAL HOME LOAN BANK OF NEW YORK
13 |
 All
FHLBanks Exceed Minimum Regulatory Capital Requirements
Capital-to-Assets Ratio
14
Note: As of September 30, 2013
0.00%
2.00%
4.00%
6.00%
8.00%
10.00%
12.00%
BOS
SFR
SEA
IND
CHI
DAL
CIN
NYK
ATL
DSM
PIT
TOP
GAAP
Regulatory
FEDERAL HOME LOAN BANK OF NEW YORK
14 |
 Questions?
101
PARK
AVENUE
•
NEW
YORK,
NY
10178
•
WWW.FHLBNY.COM
Advancing Housing and Community Growth
The information provided by the Federal Home Loan Bank of New York (HLB) in this
communications is set forth for informational purposes only. The information
should not be construed as an opinion, recommendation or solicitation regarding the use of any financial strategy and/or the purchase or sale of
any financial instrument. All customers are advised to conduct their own
independent due diligence before making any financial decisions. Please note that the
past performance of any HLB service or product should not be viewed as a guarantee
of future results. Also, the information presented here and/or the services
or products provided by the HLB may change at any time without notice. |