Attached files
| file | filename |
|---|---|
| 8-K - 8-K - EP Energy Corp | a14-5341_18k.htm |
| EX-99.1 - EX-99.1 - EP Energy Corp | a14-5341_1ex99d1.htm |
Exhibit 99.2
|
|
Credit Suisse Energy Summit Brent Smolik President and Chief Executive Officer EP Energy Corporation February 11, 2014 |
|
|
Forward Looking Statements This February 11, 2014 presentation includes certain forward-looking statements and projections of EP Energy. We have made every reasonable effort to ensure that the information and assumptions on which these statements and projections are based are current, reasonable, and complete. However, a variety of factors could cause actual results to differ materially from the projections, anticipated results or other expectations expressed, including, without limitation, the supply and demand for oil, natural gas and NGLs; the company’s ability to meet production volume targets; the uncertainty of estimating proved reserves and unproved resources; the future level of service and capital costs; the availability and cost of financing to fund future exploration and production operations; the success of drilling programs with regard to proved undeveloped reserves and unproved resources; the company’s ability to comply with the covenants in various financing documents; the company’s ability to obtain necessary governmental approvals for proposed E&P projects and to successfully construct and operate such projects; actions by the credit rating agencies; credit and performance risk of our lenders, trading counterparties, customers, vendors and suppliers; changes in commodity prices and basis differentials for oil and natural gas; general economic and weather conditions in geographic regions or markets served by the company, or where operations of the company are located, including the risk of a global recession and negative impact on natural gas demand; the uncertainties associated with governmental regulation, including any potential changes in federal and state tax laws and regulations; political and currency risks associated with international operations of the company; competition; and other factors described in the company’s Securities and Exchange Commission filings. While the company makes these statements and projections in good faith, neither the company nor its management can guarantee that anticipated future results will be achieved. Reference must be made to those filings for additional important factors that may affect actual results. EP Energy assumes no obligation to publicly update or revise any forward-looking statements made herein or any other forward-looking statements made by EP Energy, whether as a result of new information, future events, or otherwise. This presentation has been prepared by EP Energy and includes market data and other statistical information from sources believed by it to be reliable, including independent industry publications, government publications or other published independent sources. Some data are also based on EP Energy’s good faith estimates, which are derived from its review of internal sources as well as the independent sources described above. Although the company believes these sources are reliable, it has not independently verified the information and cannot guarantee its accuracy and completeness. Disclosure of Non-GAAP Measures The Securities and Exchange Commission's Regulation G applies to any public disclosure or release of material information that includes a non-GAAP financial measure. In the event of such a disclosure or release, Regulation G requires (i) the presentation of the most directly comparable financial measure calculated and presented in accordance with GAAP and (ii) a reconciliation of the differences between the non-GAAP financial measure presented and the most directly comparable financial measure calculated and presented in accordance with GAAP. See the appendix for required reconciliations. |
|
|
Cautionary Note Regarding Hydrocarbon Quantities EP Energy has provided internally generated estimates for proved reserves in this February 11, 2014 presentation in accordance with SEC guidelines and definitions. Unless otherwise noted, reserve estimates are as of December 31, 2013, assuming SEC pricing. In this presentation: “EUR,” or “Estimated Ultimate Recovery,” refers to EP Energy’s internal estimates of per well hydrocarbon quantities that may be potentially recovered from a future well completed as a producer. These recoverable quantities do not always constitute or represent proven reserves. |
|
|
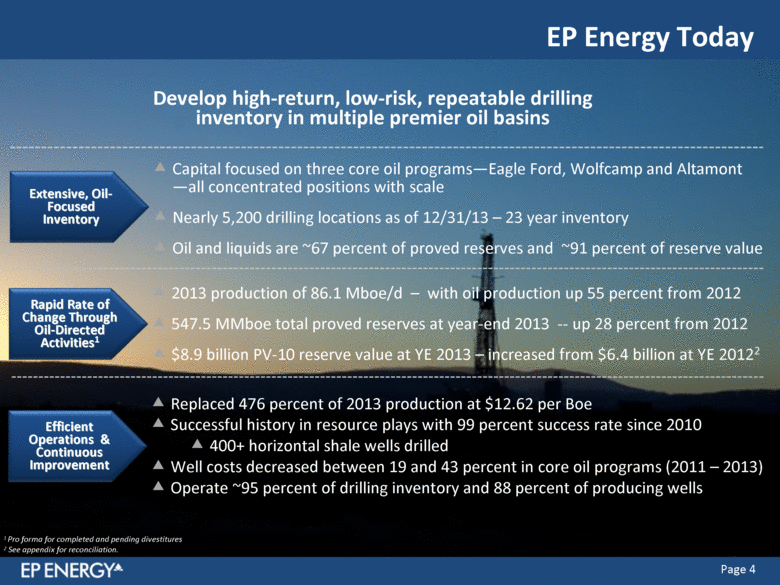
Replaced 476 percent of 2013 production at $12.62 per Boe Successful history in resource plays with 99 percent success rate since 2010 400+ horizontal shale wells drilled Well costs decreased between 19 and 43 percent in core oil programs (2011 – 2013) Operate ~95 percent of drilling inventory and 88 percent of producing wells Efficient Operations & Continuous Improvement Develop high-return, low-risk, repeatable drilling inventory in multiple premier oil basins 1 Pro forma for completed and pending divestitures 2 See appendix for reconciliation. Capital focused on three core oil programs—Eagle Ford, Wolfcamp and Altamont —all concentrated positions with scale Nearly 5,200 drilling locations as of 12/31/13 – 23 year inventory Oil and liquids are ~67 percent of proved reserves and ~91 percent of reserve value 2013 production of 86.1 Mboe/d – with oil production up 55 percent from 2012 547.5 MMboe total proved reserves at year-end 2013 — up 28 percent from 2012 $8.9 billion PV-10 reserve value at YE 2013 – increased from $6.4 billion at YE 20122 Rapid Rate of Change Through Oil-Directed Activities1 EP Energy Today 4 |
|
|
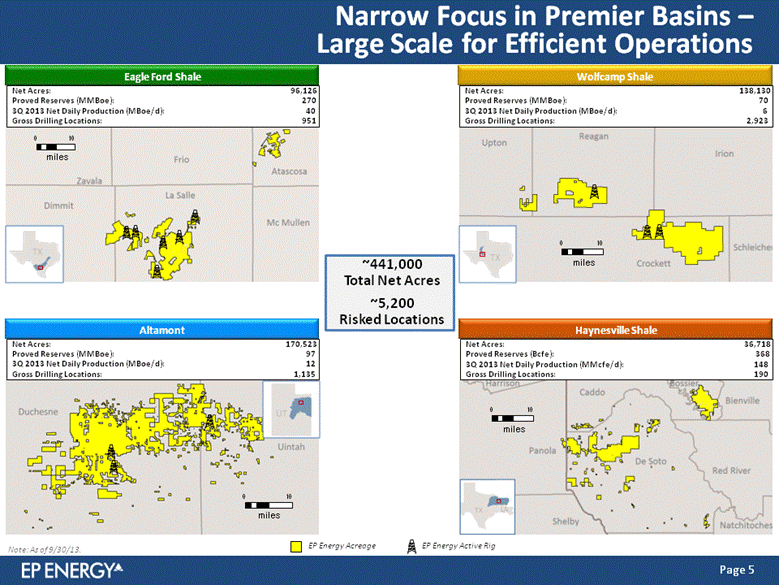
Narrow Focus in Premier Basins – Large Scale for Efficient Operations EP Energy Acreage EP Energy Active Rig Note: As of 9/30/13. ~441,000 Total Net Acres ~5,200 Risked Locations TX Eagle Ford Shale Net Acres: 96,126 Proved Reserves (MMBoe): 270 3Q 2013 Net Daily Production (MBoe/d): 40 Gross Drilling Locations: 951 0 10 miles TX Wolfcamp Shale Net Acres: 138,130 Proved Reserves (MMBoe): 70 3Q 2013 Net Daily Production (MBoe/d): 6 Gross Drilling Locations: 2,923 0 10 miles UT Altamont Net Acres: 170,523 Proved Reserves (MMBoe): 97 3Q 2013 Net Daily Production (MBoe/d): 12 Gross Drilling Locations: 1,135 0 10 miles Haynesville Shale Net Acres: 36,718 Proved Reserves (Bcfe): 368 3Q 2013 Net Daily Production (MMcfe/d): 148 Gross Drilling Locations: 190 0 10 miles |
|
|
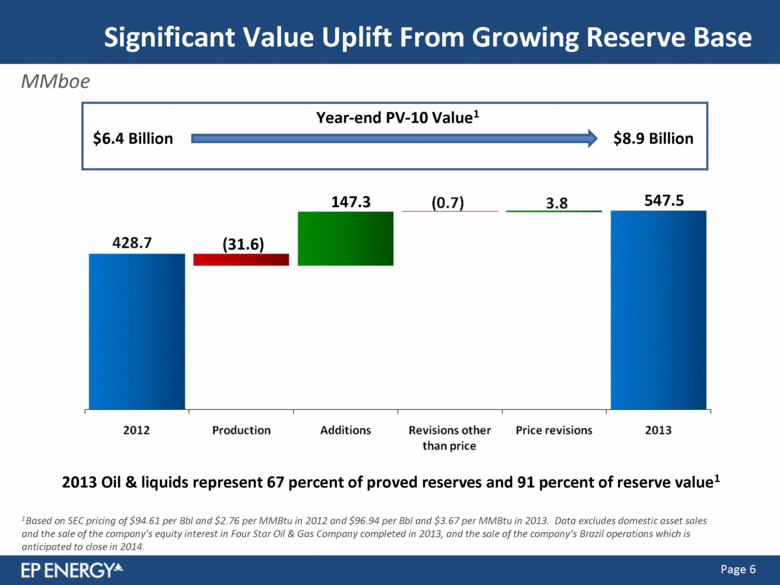
Significant Value Uplift From Growing Reserve Base 1Based on SEC pricing of $94.61 per Bbl and $2.76 per MMBtu in 2012 and $96.94 per Bbl and $3.67 per MMBtu in 2013. Data excludes domestic asset sales and the sale of the company’s equity interest in Four Star Oil & Gas Company completed in 2013, and the sale of the company’s Brazil operations which is anticipated to close in 2014. MMboe (31.6) 147.3 547.5 Year-end PV-10 Value1 $6.4 Billion $8.9 Billion 2013 Oil & liquids represent 67 percent of proved reserves and 91 percent of reserve value1 |
|
|
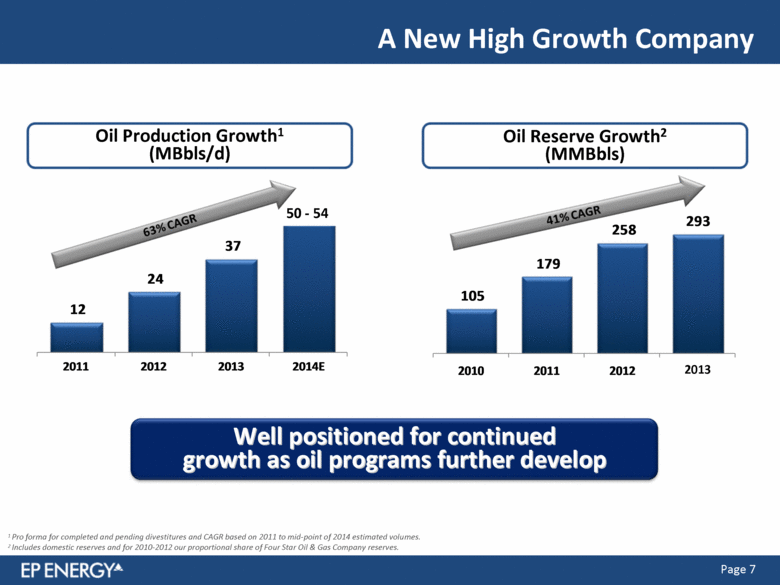
A New High Growth Company 1 Pro forma for completed and pending divestitures and CAGR based on 2011 to mid-point of 2014 estimated volumes. 2 Includes domestic reserves and for 2010-2012 our proportional share of Four Star Oil & Gas Company reserves. Oil Production Growth1 (MBbls/d) Oil Reserve Growth2 (MMBbls) 2013 Well positioned for continued growth as oil programs further develop 50 - 54 12 24 37 2011 2012 2013 2014E 105 179 258 293 2010 2011 2012 3Q13 |
|
|
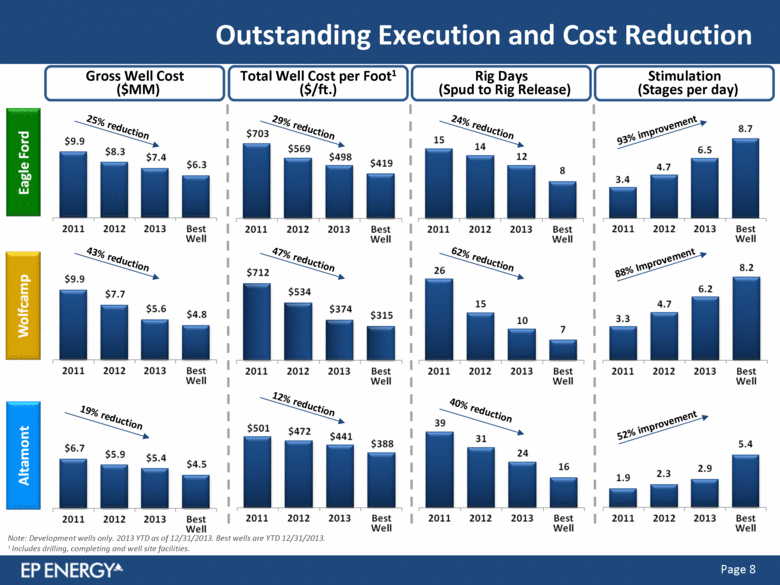
Outstanding Execution and Cost Reduction Note: Development wells only. 2013 YTD as of 12/31/2013. Best wells are YTD 12/31/2013. 1 Includes drilling, completing and well site facilities. Gross Well Cost ($MM) 19% reduction Rig Days (Spud to Rig Release) 62% reduction 40% reduction 24% reduction Stimulation (Stages per day) Total Well Cost per Foot1 ($/ft.) 12% reduction |
|
|
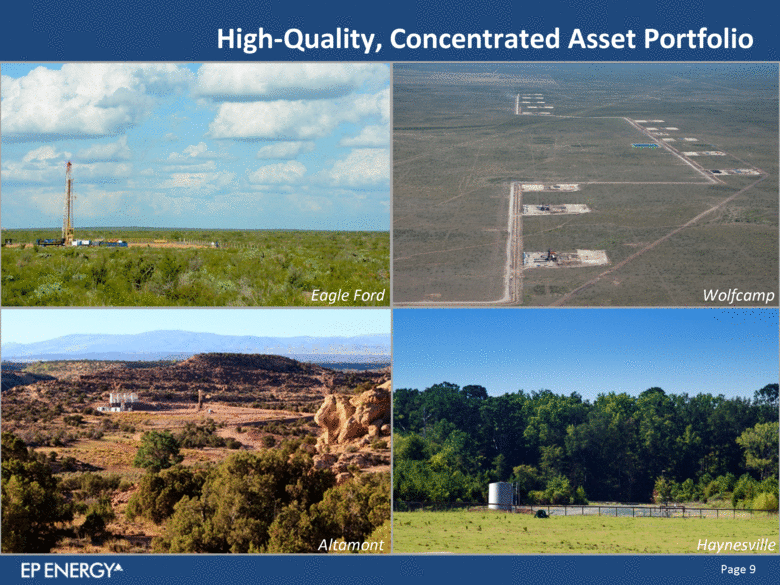
High-Quality, Concentrated Asset Portfolio Wolfcamp Altamont Eagle Ford Haynesville |
|
|
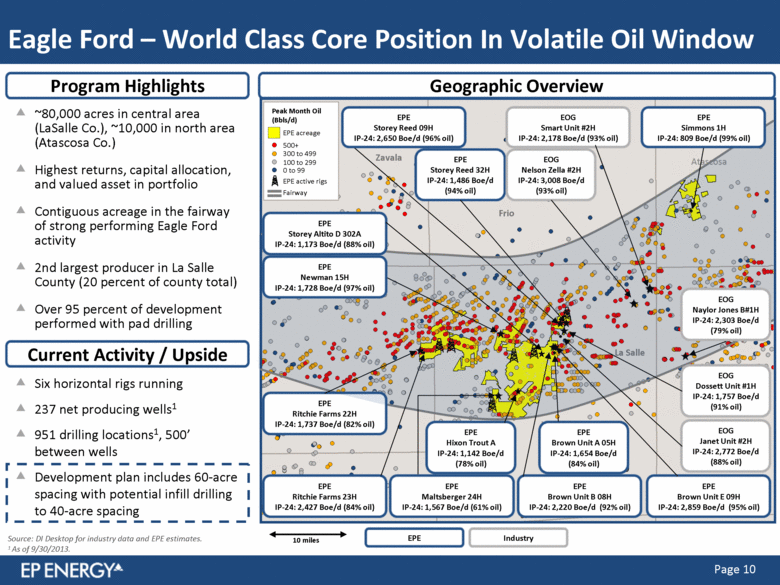
Program Highlights Eagle Ford – World Class Core Position In Volatile Oil Window ~80,000 acres in central area (LaSalle Co.), ~10,000 in north area (Atascosa Co.) Highest returns, capital allocation, and valued asset in portfolio Contiguous acreage in the fairway of strong performing Eagle Ford activity 2nd largest producer in La Salle County (20 percent of county total) Over 95 percent of development performed with pad drilling Current Activity / Upside Six horizontal rigs running 237 net producing wells1 951 drilling locations1, 500’ between wells Development plan includes 60-acre spacing with potential infill drilling to 40-acre spacing Source: DI Desktop for industry data and EPE estimates. 1 As of 9/30/2013. Geographic Overview Peak Month Oil (Bbls/d) 500+ 300 to 499 100 to 299 0 to 99 EOG Janet Unit #2H IP-24: 2,772 Boe/d (88% oil) EPE Ritchie Farms 22H IP-24: 1,737 Boe/d (82% oil) EPE Brown Unit E 09H IP-24: 2,859 Boe/d (95% oil) EOG Smart Unit #2H IP-24: 2,178 Boe/d (93% oil) EPE Maltsberger 24H IP-24: 1,567 Boe/d (61% oil) EPE Brown Unit B 08H IP-24: 2,220 Boe/d (92% oil) EPE acreage EPE Ritchie Farms 23H IP-24: 2,427 Boe/d (84% oil) EPE Storey Reed 32H IP-24: 1,486 Boe/d (94% oil) EPE Brown Unit A 05H IP-24: 1,654 Boe/d (84% oil) EOG Dossett Unit #1H IP-24: 1,757 Boe/d (91% oil) EOG Nelson Zella #2H IP-24: 3,008 Boe/d (93% oil) 10 miles Industry EPE EPE active rigs Frio Zavala La Salle Fairway EOG Naylor Jones B#1H IP-24: 2,303 Boe/d (79% oil) EPE Simmons 1H IP-24: 809 Boe/d (99% oil) EPE Newman 15H IP-24: 1,728 Boe/d (97% oil) EPE Storey Reed 09H IP-24: 2,650 Boe/d (96% oil) EPE Storey Altito D 302A IP-24: 1,173 Boe/d (88% oil) EPE Hixon Trout A IP-24: 1,142 Boe/d (78% oil) |
|
|
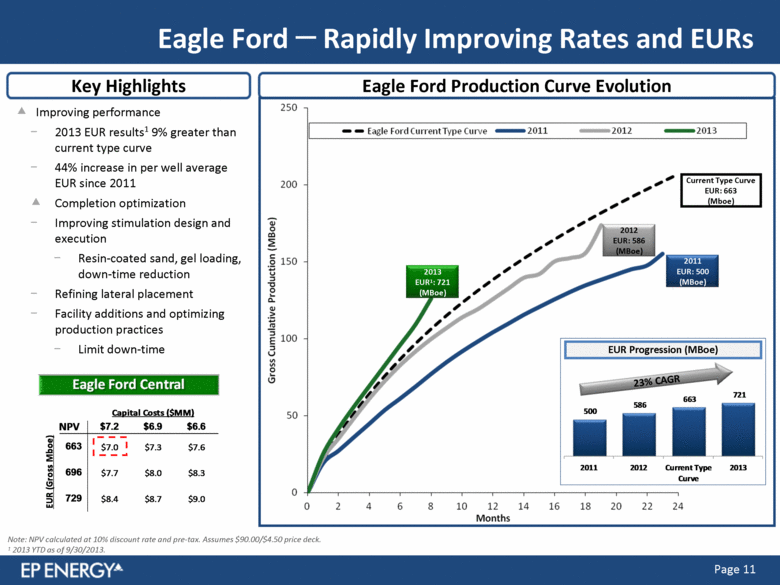
Key Highlights Eagle Ford Production Curve Evolution Eagle Ford - Rapidly Improving Rates and EURs Improving performance 2013 EUR results1 9% greater than current type curve 44% increase in per well average EUR since 2011 Completion optimization Improving stimulation design and execution Resin-coated sand, gel loading, down-time reduction Refining lateral placement Facility additions and optimizing production practices Limit down-time 2011 EUR: 500 (MBoe) 2012 EUR: 586 (MBoe) 2013 EUR1: 721 (MBoe) Note: NPV calculated at 10% discount rate and pre-tax. Assumes $90.00/$4.50 price deck. 1 2013 YTD as of 9/30/2013. Current Type Curve EUR: 663 (Mboe) 23% CAGR EUR Progression (MBoe) NPV $7.2 $6.9 $6.6 663 $7.0 $7.3 $7.6 696 $7.7 $8.0 $8.3 729 $8.4 $8.7 $9.0 Capital Costs ($MM) EUR (Gross Mboe) 500 586 663 721 2011 2012 Current Type Curve 2013 |
|
|
Program Highlights ~138,000 net acres Largest oil inventory in portfolio Multiple prospective intervals Large contiguous land position on favorable terms with a single land owner Derisked by EPE activity and industry Wolfcamp – Derisked Oil Position Current Activity / Upside Three horizontal rigs running 82 net producing wells1 2,923 drilling locations1, 770’ between wells Ongoing well optimization Infill potential being tested by industry Cline Shale and Spraberry upside Source: DI Desktop for industry data and EPE estimates. 1 As of 9/30/2013. Geographic Overview FANG Jaycee A Unit 1H IP-24: 1,085 Boe/d PXD University 2-20 #15 IP-24: 1,864 Boe/d (79% oil) FANG Neal B Unit 8 2H IP-24: 1,134 Boe/d EPE University E 43-22-FH IP-24: 1,047 Boe/d (82% oil) PXD University 2-20 #12 IP-24: 3,176 Boe/d (83% oil) AREX Baker B 256H IP-24: 1,334 Boe/d (76% oil) EOG Mayer SL #5013LH IP-24: 1,475 Boe/d (87% oil) EOG Munson #1007H IP-24: 1,512 Boe/d (85% oil) PXD Rocker B #15 IP-24: 1,153 Boe/d Industry EPE 20 miles EOG 40-B #1602H IP-24: 1,164 Boe/d (79% oil) EPE University E 41-08CH IP-24: 1,071 Boe/d (75% oil) PXD University 10-1 #2H IP-24: 1,396 Boe/d PXD University 2-20 #14 IP-24: 1,852 Boe/d (77% oil) EPE University E 43-22-CH IP-24: 1,192 Boe/d (90% oil) Enduring University 09 1804H IP-24: 1,802 Boe/d (91% oil) EPE University Central 8-12-2H IP-24: 805 Boe/d (92% oil) EPE acreage EPE active rigs Fairway Wolfcamp wells ~8 miles from EPE acreage EPE University E 43-24-CH IP-24: 1,165 Boe/d (97% oil) EPE University E 43-17-AH IP-24: 1,560 Boe/d (88% oil) EPE University E 43-25-AH IP-24: 1,307 Boe/d (91% oil) |
|
|
Wolfcamp – Bullseye of the Southern Midland Basin Premier acreage in Southern Midland Basin - Thickest part of the basin - Highest organic content - Highest oil in place Wolfcamp A, B, C Thickness Represents distribution of porosity and organic content 1,000’ of stacked pay Source: EPE. |
|
|
Up to 4,500’ of gross stacked pay interval Thickest, highest pressure in the source rock portion of the Uinta Basin Higher initial production rates and higher EURs Vertical well development with potential emerging horizontal upside Altamont – EPE in Unique Geology Cross Section1 Key Highlights Altamont/Bluebell/Cedar Rim Monument Butte West Tavaputs A A’ A’ A 1 Source: EPE. Oil reservoir Thicker Higher pressure Source rock EPE Acreage |
|
|
~171,000 net acres in unique northern portion of Uinta Basin Consistent oil production growth over last five years (2008 - 3Q13): Program Highlights Altamont – Advantaged Position in Basin Current Activity / Upside Three vertical rigs running 327 net producing wells1 1,135 drilling locations1 Additional vertical infill and horizontal drilling opportunities Source: DI Desktop for industry data and EPE estimates. 1 As of 9/30/2013. 17% Oil Production CAGR (MBbl/d) Geographic Overview Peak Month Oil (Bbls/d) 300+ 200 to 299 100 to 199 0 to 99 10 miles EPE acreage EPE Wilson 1-18C4 IP-24: 1,068 Boe/d (85% oil) EPE Penfield 2-10C4 IP-24: 1,205 Boe/d (91% oil) EPE Moore 1-23C4 IP-24: 1,093 Boe/d (88% oil) EPE Ute 2-13A3 IP-24: 1,272 Boe/d (90% oil) EPE Ute 2-14A3 IP-24: 962 Boe/d (86% oil) EPE Kendall 2-15B2 IP-24: 876 Boe/d (84% oil) EPE EP Energy 1-19C4 IP-24: 1,477 Boe/d (85% oil) EPE active rigs |
|
|
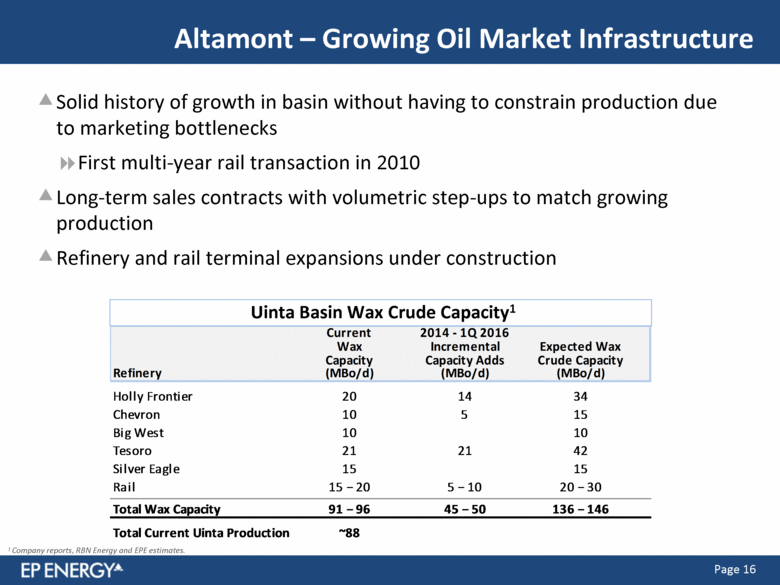
Solid history of growth in basin without having to constrain production due to marketing bottlenecks First multi-year rail transaction in 2010 Long-term sales contracts with volumetric step-ups to match growing production Refinery and rail terminal expansions under construction Altamont – Growing Oil Market Infrastructure Uinta Basin Wax Crude Capacity1 1 Company reports, RBN Energy and EPE estimates. Current 2014 - 1Q 2016 Wax Incremental Expected Wax Capacity Capacity Adds Crude Capacity Refinery (MBo/d) (MBo/d) (MBo/d) Holly Frontier 20 14 34 Chevron 10 5 15 Big West 10 10 Tesoro 21 21 42 Silver Eagle 15 15 Rail 15-20 5-10 20-30 Total Wax Capacity 91-96 45-50 136-146 Total Current Uinta Production ~88 |
|
|
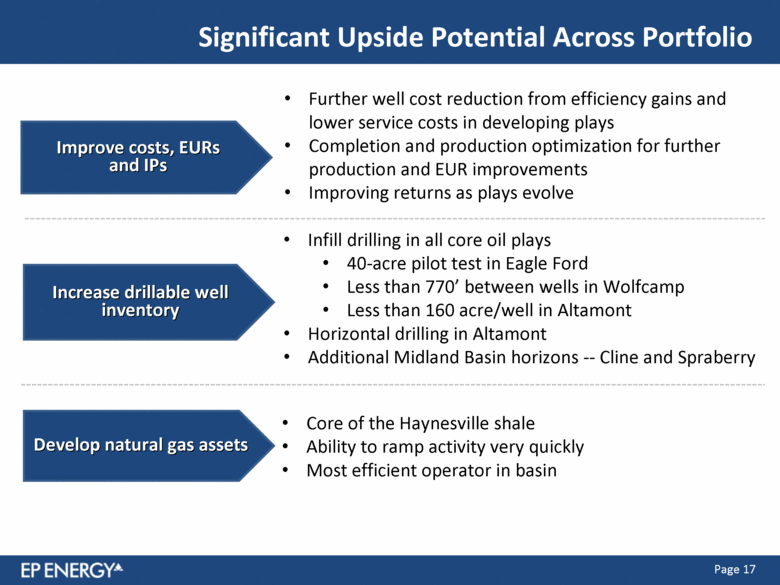
Significant Upside Potential Across Portfolio Further well cost reduction from efficiency gains and lower service costs in developing plays Completion and production optimization for further production and EUR improvements Improving returns as plays evolve Infill drilling in all core oil plays 40-acre pilot test in Eagle Ford Less than 770’ between wells in Wolfcamp Less than 160 acre/well in Altamont Horizontal drilling in Altamont Additional Midland Basin horizons — Cline and Spraberry Core of the Haynesville shale Ability to ramp activity very quickly Most efficient operator in basin Improve costs, EURs and IPs Increase drillable well inventory Develop natural gas assets |
|
|
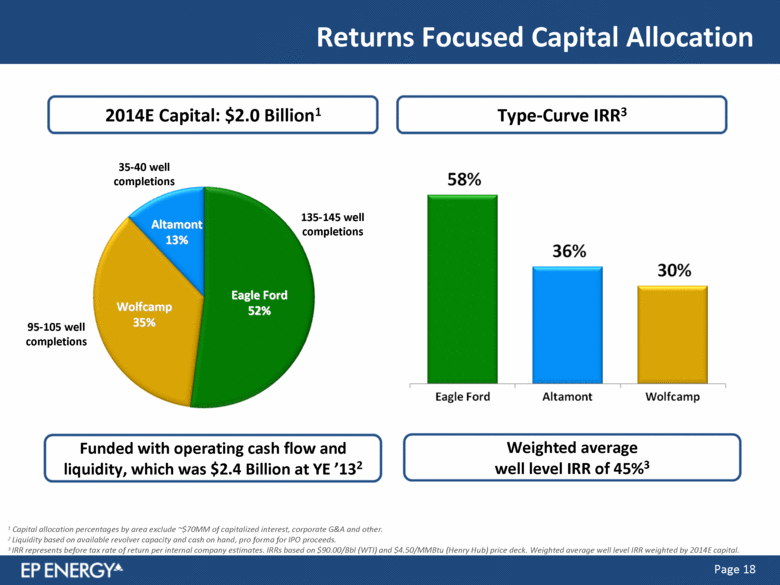
Returns Focused Capital Allocation 1 Capital allocation percentages by area exclude ~$70MM of capitalized interest, corporate G&A and other. 2 Liquidity based on available revolver capacity and cash on hand, pro forma for IPO proceeds. 3 IRR represents before tax rate of return per internal company estimates. IRRs based on $90.00/Bbl (WTI) and $4.50/MMBtu (Henry Hub) price deck. Weighted average well level IRR weighted by 2014E capital. Wolfcamp 35% Altamont 13% Eagle Ford 52% 2014E Capital: $2.0 Billion1 Type-Curve IRR3 Weighted average well level IRR of 45%3 135-145 well completions 35-40 well completions 95-105 well completions Funded with operating cash flow and liquidity, which was $2.4 Billion at YE ’132 |
|
|
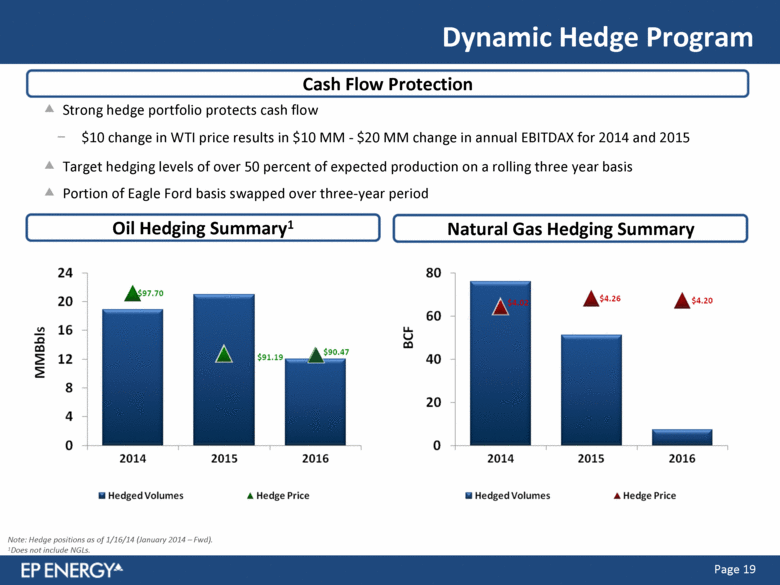
Dynamic Hedge Program Natural Gas Hedging Summary Cash Flow Protection Oil Hedging Summary1 Strong hedge portfolio protects cash flow $10 change in WTI price results in $10 MM - $20 MM change in annual EBITDAX for 2014 and 2015 Target hedging levels of over 50 percent of expected production on a rolling three year basis Portion of Eagle Ford basis swapped over three-year period Note: Hedge positions as of 1/16/14 (January 2014 – Fwd). 1Does not include NGLs. |
|
|
Focused on execution and operational improvements Improving LOE per barrel in core oil programs Significant EBITDAX margin expansion Improve operational efficiency Budget up 4 percent, with a 20 percent increase in well completions $1.73 billion drilling and completion capital – 87 percent drill-bit focused Directed entirely to Eagle Ford, Wolfcamp and Altamont 11 to 14 drilling rigs in 2014 (averaged 11 in 2013) 265 to 290 well completions (231 in 2013) 45 percent weighted average returns Activity focused on high-return oil plays Exciting Growth in 2014 Programs well positioned for growth 40 percent increase in oil volumes 15 percent increase in total equivalent production Continued production growth1 Eagle Ford down spacing Wolfcamp A program initiated Altamont horizontal wells Enhancing drilling inventory 1 Pro forma for completed and pending divestitures |
|
|
Credit Suisse Energy Summit Brent Smolik President and Chief Executive Officer EP Energy Corporation February 2014 |
|
|
Appendix |
|
|
Non-GAAP Disclosures Disclosure of Non-GAAP Financial Measures The Securities and Exchange Commission’s Regulation G applies to any public disclosure or release of material information that includes a non-GAAP financial measure. In the event of such a disclosure or release, Regulation G requires (i) the presentation of the most directly comparable financial measure calculated and presented in accordance with GAAP and (ii) a reconciliation of the differences between the non-GAAP financial measure presented and the most directly comparable financial measure calculated and presented in accordance with GAAP. The company uses the terms EBITDAX margin per unit and adjusted cash operating costs. EBITDAX margin per unit is defined as income (loss) from continuing operations plus interest and debt expense, income taxes, depreciation, depletion and amortization and exploration expense divided by total production and is a valuable measurement of a company's operating profitability. The company believes that the presentation of EBITDAX margin per unit is important to provide management and investors with (i) additional information to evaluate our ability to service debt, adjusting for items required or permitted in calculating covenant compliance under our debt agreements, (ii) an important supplemental indicator of the operational performance of our business, (iii) an additional criterion for evaluating our performance relative to our peers, (iv) additional information to measure our liquidity (before cash capital requirements and working capital needs) (v) and supplemental information to investors about certain material non-cash and/or other items that may not continue at the same level in the future. EBITDAX margin per unit has a limitation as analytical tool and should not be considered in isolation or as a substitute for analysis of our results as reported under U.S. GAAP or as an alternative to net income, income (loss) from continuing operations, operating income, net cash provided by operating activities or any other measure of financial performance or liquidity presented in accordance with GAAP. For example, our presentation of EBITDAX may not be comparable to similarly titled measures used by other companies in our industry. Adjusted cash operating costs is a non-GAAP measure calculated on a per Boe produced basis and includes total operating expenses less depreciation, depletion and amortization expense, natural gas purchases, transportation costs, exploration expense, impairment and ceiling charges, transition and restructuring costs and non-cash compensation expense. The company believes adjusted cash operating costs per unit is a valuable measures to provide management and investors and reflects operating performance and efficiency; however, this measures may not be comparable to similarly titled measures used by other companies is subject to several of the same limitations as analytical tools as noted in the paragraphs above. |
|
|
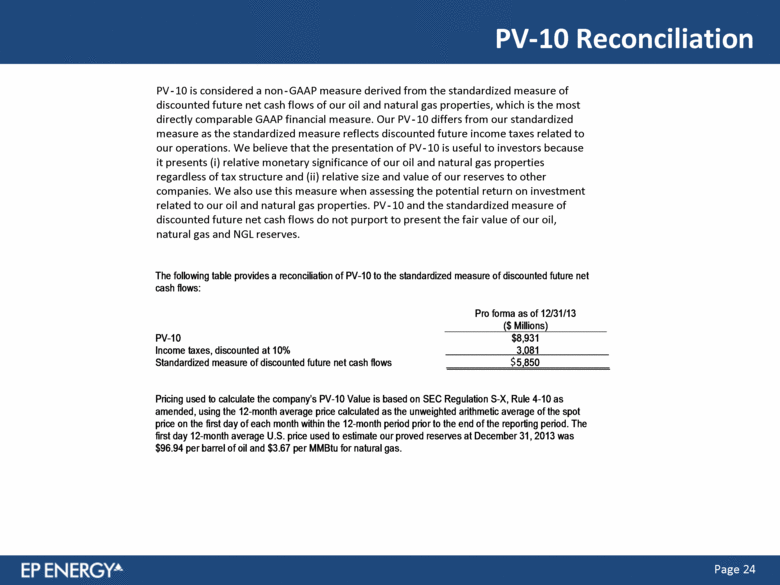
PV-10 Reconciliation PV-10 is considered a non-GAAP measure derived from the standardized measure of discounted future net cash flows of our oil and natural gas properties, which is the most directly comparable GAAP financial measure. Our PV-10 differs from our standardized measure as the standardized measure reflects discounted future income taxes related to our operations. We believe that the presentation of PV-10 is useful to investors because it presents (i) relative monetary significance of our oil and natural gas properties regardless of tax structure and (ii) relative size and value of our reserves to other companies. We also use this measure when assessing the potential return on investment related to our oil and natural gas properties. PV-10 and the standardized measure of discounted future net cash flows do not purport to present the fair value of our oil, natural gas and NGL reserves. $ The following table provides a reconciliation of PV-10 to the standardized measure of discounted future net cash flows: Pro forma as of 12/31/13 ($ Millions) PV-10 $8,931 Income taxes, discounted at 10% 3,081 Standardized measure of discounted future net cash flows 5,850 Pricing used to calculate the company’s PV-10 Value is based on SEC Regulation S-X, Rule 4-10 as amended, using the 12-month average price calculated as the unweighted arithmetic average of the spot price on the first day of each month within the 12-month period prior to the end of the reporting period. The first day 12-month average U.S. price used to estimate our proved reserves at December 31, 2013 was $96.94 per barrel of oil and $3.67 per MMBtu for natural gas. |
|
|
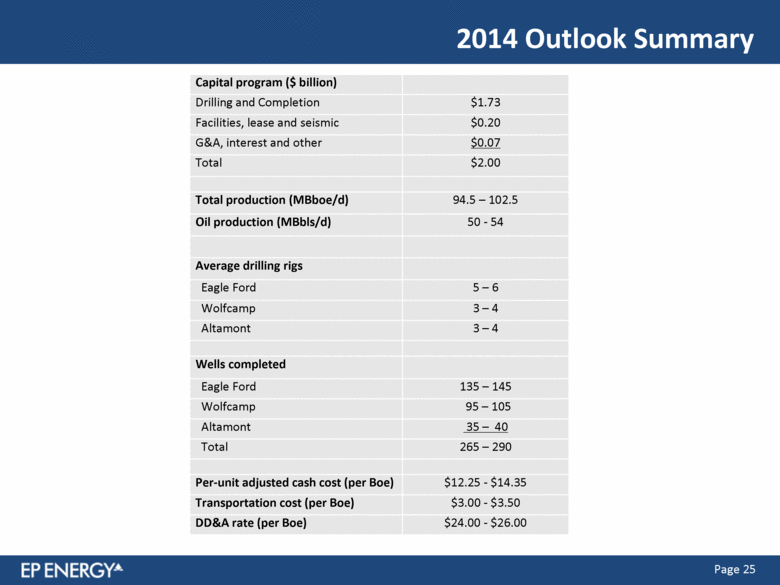
2014 Outlook Summary Capital program ($ billion) Drilling and Completion $1.73 Facilities, lease and seismic $0.20 G&A, interest and other $0.07 Total $2.00 Total production (MBboe/d) 94.5 – 102.5 Oil production (MBbls/d) 50 - 54 Average drilling rigs Eagle Ford 5 – 6 Wolfcamp 3 – 4 Altamont 3 – 4 Wells completed Eagle Ford 135 – 145 Wolfcamp 95 – 105 Altamont 35 – 40 Total 265 – 290 Per-unit adjusted cash cost (per Boe) $12.25 - $14.35 Transportation cost (per Boe) $3.00 - $3.50 DD&A rate (per Boe) $24.00 - $26.00 |
|
|
Favorable Well Economics Note: IRR and NPV metrics per internal EPE estimates and assume $90.00/$4.50 price deck. NPV calculated at 10% discount rate, before income tax. 1 13,320’ total vertical depth. 2 Break-even oil price is price required to generate a 10% pre-tax IRR. Break-even prices on Eagle Ford, Wolfcamp and Altamont assume $4.50/MMBtu (Henry Hub). 3 The gross EUR estimates are more speculative than estimates of proved reserves and are thus subject to substantially greater risk of being recovered by EP Energy. In addition, lower gross EUR estimates and/or higher gross well costs will result in lower NPV estimates than those presented. Please see "Single-Well Sensitivities" in the Appendix for an expanded presentation of NPV estimates for our Eagle Ford Central, Wolfcamp Long, Altamont Vertical and Haynesville Holly wells. Single-Well Sensitivities3 2 1 Eagle Ford Wolfcamp Altamont Haynesville Central North Long Short Vertical Horizontal Holly Non-Holly Lateral Length (ft) 5,600 5,600 7,500 4,500 NA 3,960 4,500 4,500 IP30 (Boe/d) 692 223 373 253 525 613 1,980 1,750 Gross EUR (MBoe) 663 311 400 241 455 310 967 694 % Liquids 77% 96% 75% 82% 73% 68% 0% 0% Gross Well Cost ($MM) $7.2 $6.7 $5.8 $4.5 $6.3 $7.1 $7.9 $7.9 Net F&D Costs ($/Boe) $14.59 $28.78 $19.19 $24.91 $18.90 $27.97 $10.02 $14.83 Average WI % 89% 93% 95% 99% 73% 71% 81% 76% Average NRI % 67% 70% 71% 74% 61% 58% 66% 58% NRI Pre-Tax NPV-10% ($MM) $7.0 $2.7 $2.8 $1.3 $3.6 $1.4 $3.8 $1.0 Break-Even Oil Price ($/Bbl or $/Mcf) $37.50 $65.00 $56.30 $69.80 $52.85 $71.68 $2.95 $3.88 Pre-Tax IRR 58% 26% 30% 21% 36% 24% 47% 21% Gross Undrilled Locations (9/30/13) 828 123 2,328 595 781 354 97 93 NPV $7.2 $6.9 $6.6 663 $7.0 $7.3 $7.6 696 $7.7 $8.0 $8.3 729 $8.4 $8.7 $9.0 Gross Well Cost ($MM) Gross EUR (Mboe) NPV $5.8 $5.3 $4.8 400 $2.8 $3.2 $3.7 425 $3.3 $3.8 $4.2 450 $3.8 $4.3 $4.8 Gross Well Cost ($MM) Gross EUR (Mboe) NPV $6.3 $5.7 $5.1 455 $3.6 $4.0 $4.5 478 $4.0 $4.4 $4.9 501 $4.5 $4.9 $5.3 Gross Well Cost ($MM) Gross EUR (Mboe) |

