Attached files
| file | filename |
|---|---|
| 8-K - 8-K - CARPENTER TECHNOLOGY CORP | a14-4706_28k.htm |
Exhibit 99.1
|
|
Fiscal Year 2014 2nd Quarter Earnings Call January 30, 2014 |

|
|
2 Forward-Looking Statements This presentation contains forward-looking statements within the meaning of the Private Securities Litigation Act of 1995. These forward-looking statements are subject to risks and uncertainties that could cause actual results to differ from those projected, anticipated or implied. The most significant of these uncertainties are described in Carpenter’s filings with the Securities and Exchange Commission including its annual report on Form 10-K for the year ended June 30, 2013, 10Q for the quarter ended September 30, 2013 and the exhibits attached to those filings. They include but are not limited to: (1) the cyclical nature of the specialty materials business and certain end-use markets, including aerospace, defense, industrial, transportation, consumer, medical, and energy, or other influences on Carpenter’s business such as new competitors, the consolidation of competitors, customers, and suppliers or the transfer of manufacturing capacity from the United States to foreign countries; (2) the ability of Carpenter to achieve cost savings, productivity improvements or process changes; (3) the ability to recoup increases in the cost of energy, raw materials, freight or other factors; (4) domestic and foreign excess manufacturing capacity for certain metals; (5) fluctuations in currency exchange rates; (6) the degree of success of government trade actions; (7) the valuation of the assets and liabilities in Carpenter’s pension trusts and the accounting for pension plans; (8) possible labor disputes or work stoppages; (9) the potential that our customers may substitute alternate materials or adopt different manufacturing practices that replace or limit the suitability of our products; (10) the ability to successfully acquire and integrate acquisitions; (11) the availability of credit facilities to Carpenter, its customers or other members of the supply chain; (12) the ability to obtain energy or raw materials, especially from suppliers located in countries that may be subject to unstable political or economic conditions; (13) Carpenter’s manufacturing processes are dependent upon highly specialized equipment located primarily in facilities in Reading and Latrobe, Pennsylvania for which there may be limited alternatives if there are significant equipment failures or catastrophic event; and (14) Carpenter’s future success depends on the continued service and availability of key personnel, including members of the executive management team, management, metallurgists and other skilled personnel and the loss of these key personnel could affect Carpenter’s ability to perform until suitable replacements are found. Any of these factors could have an adverse and/or fluctuating effect on Carpenter’s results of operations. The forward-looking statements in this document are intended to be subject to the safe harbor protection provided by Section 27A of the Securities Act of 1933, as amended, and Section 21E of the Securities Exchange Act of 1934, as amended. Carpenter undertakes no obligation to update or revise any forward-looking statements. Non-GAAP Financial Measures Some of the information included in this presentation is derived from Carpenter’s consolidated financial information but is not presented in Carpenter’s financial statements prepared in accordance with U.S. Generally Accepted Accounting Principles (GAAP). Certain of these data are considered “non-GAAP financial measures” under SEC rules. These non-GAAP financial measures supplement our GAAP disclosures and should not be considered an alternative to the GAAP measure. Reconciliations to the most directly comparable GAAP financial measures and management’s rationale for the use of the non-GAAP financial measures can be found in the Appendix to this presentation. Cautionary Statement |
|
|
2nd Quarter FY14 Summary Bill Wulfsohn President and Chief Executive Officer 3 |
|
|
Q2 earnings in-line with our expectations Significant gains in Transportation and Consumer & Industrial Strong overhead cost control Continued reduction in production cost per ton Weak Aerospace cycle continues to dilute overall margins Momentum beginning to build Q2 Specialty Alloys Operations (SAO) orders up significantly versus PY’Q2 Performance Engineered Products (PEP) operational improvements on track to yield Q3/Q4 gains Well positioned for future growth Athens On budget Ahead of schedule Decision to change to straight line depreciation Expect positive free cash flow by Q4 Volume and margin improvement potential as fixed investment in place 2nd Quarter FY14 Summary 4 |

|
|
Aerospace & Defense 177.7 43% -9% -3% Boeing delivered 648 planes CY13, up +9% Y/Y; Airbus delivered 626 planes CY13, a 6% Y/Y increase Engine demand stabilizing with future growth expected Structural and fasteners down due to destocking in supply chain but order patterns indicate growth in 2H Energy 64.8 16% -6% +10% Directional rig count grew 4% vs. same quarter last year Demand for oil and gas materials has stabilized, expect 2H growth Power Generation gaining momentum; sales up vs. prior year Medical 22.4 5% -7% -10% Volume improving but industry cost containment efforts continue to impact sales growth Titanium prices remain low - negatively impacts demand as distributors continue de-stocking Transpor-tation 28.4 7% +17% +11% Strong automotive build growth in North America (up 5% in CY13) Carpenter continues to benefit from strong demand growth for materials used in newest engine platform fuel delivery systems designed to meet CAFE standards Industrial & Consumer 88.9 21% +4% +4% Strong demand for materials used in bridge infrastructure projects Demand strengthening for materials used in plant and equipment applications 5 End Market Highlights Q2’14 Net Sales ex. Sur ($M)* vs. Q2’13 Comments *Excludes sales through Carpenter’s Distribution businesses Share gains drove increase in tons; sales down due to Aerospace softness vs. Q1’14 |
|
|
Tony Thene Senior Vice President and Chief Financial Officer 6 2nd Quarter FY14 Financial Overview |

|
|
Q2 Net income of $29.5 million or $0.55 per share Sales, excluding surcharge, of $414.6 million Aerospace and Energy comprised 59% of sales Operating margins (ex pension EID) decreased sequentially by 260 basis points due to weaker mix Cash Flow from Operations of $7.0 million and Free Cash Flow of negative $99.9 million Capital expenditures of $97.6 million, largely related to Athens $598 million of total liquidity $106 million of cash $492 million of available revolving credit facility 7 2nd Quarter FY14 Financial Overview |

|
|
Income Statement Summary Volume up but EPS down due to weaker mix 8 * Detailed schedule included in Non-GAAP Schedules in Appendix $ Millions, except pounds and per-share amounts Q2-13 Q1-14 Q2-14 Sequential Change Pounds ('000) 62,582 64,892 67,378 2,486 Net Sales 533.5 498.6 503.5 4.9 Sales ex. Surcharge * 430.7 412.1 414.6 2.5 Gross Profit 102.6 103.3 95.4 (7.9) % of Sales ex. Surcharge 23.8% 25.1% 23.0% -2.1% pts. Selling, General and Administrative Expenses 49.9 47.5 47.9 0.4 % of Sales ex. Surcharge 11.6% 11.5% 11.6% 0.1% pts. Operating Income 52.7 55.8 47.5 (8.3) % of Sales ex. Surcharge 12.2% 13.5% 11.5% -2.0% pts. Operating Income ex. Pension EID * 60.7 61.8 51.3 (10.5) % of Sales ex. Surcharge 14.1% 15.0% 12.4% -2.6% pts. Effective Tax Rate 33.1% 32.8% 33.6% 0.8% Net Income 33.2 34.6 29.5 (5.1) Diluted Earnings Per Share $0.62 $0.65 $0.55 ($0.10) |
|
|
9 Free Cash Flow Summary Prior periods may be impacted due to rounding. At cash flow generation inflection point – moving to positive FCF by Q4 $ Millions Q1-13 Q2-13 Q2-13 YTD Q1-14 Q2-14 Q2-14 YTD Net Income + Non-cash Items 82 76 158 76 69 145 Inventory (79) (10) (89) (47) (12) (59) Other working capital 8 (17) (9) 36 (48) (12) Total Net Working Capital (71) (27) (98) (11) (60) (71) Pension Plan Contributions - Required (48) (10) (58) (1) (2) (3) Net Cash from Operating Activities (37) 39 2 64 7 71 Purchases of property, equipment and software (56) (81) (137) (114) (98) (212) Dividends paid (9) (10) (19) (9) (10) (19) Other (1) 1 0 Free Cash Flow (102) (52) (154) (60) (100) (160) |
|
|
SAO Business Update Andy Ziolkowski Senior Vice President Commercial, Specialty Alloys Operations 10 |
|
|
Q2 Operating Results Q2 Business Highlights Q3-14 Outlook Year-over-year volume increase driven mainly by Transportation and Industrial & Consumer Lower weighted average volume for Aerospace Lower operating cost per ton and SG&A costs compared to a year ago Order intake up significantly year-over-year Continued increase in order intake rate Strong sequential volume growth across all markets Continued cost management Additional capacity enabling CRS to target new markets – already receiving orders Anticipate $4m temporary energy surcharge due to severe cold weather SAO Segment Summary 11 SAO Segment Q2-14 Results and Q3-14 Outlook Q2-13 Q1-14 Q2-14 vs LY vs Q1 Pounds ('000) 60,730 63,414 66,734 6,004 3,320 Sales ex. Surcharge ($M) 324.4 307.6 316.6 (7.8) 9.0 Op Inc ex. EID ($M) 61.3 63.7 54.4 (6.9) (9.3) % of Sales ex. Surcharge 18.9% 20.7% 17.2% -1.7% -3.5% |
|
|
PEP Business Update Gary Heasley Senior Vice President Performance Engineered Products 12 |
|
|
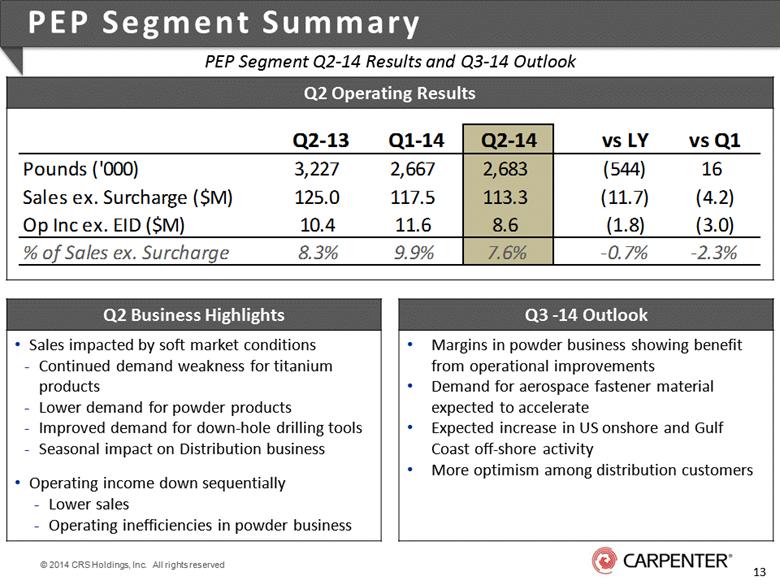
Q2 Operating Results Q2 Business Highlights Q3 -14 Outlook Sales impacted by soft market conditions Continued demand weakness for titanium products Lower demand for powder products Improved demand for down-hole drilling tools Seasonal impact on Distribution business Operating income down sequentially Lower sales Operating inefficiencies in powder business Margins in powder business showing benefit from operational improvements Demand for aerospace fastener material expected to accelerate Expected increase in US onshore and Gulf Coast off-shore activity More optimism among distribution customers PEP Segment Summary 13 PEP Segment Q2-14 Results and Q3-14 Outlook Q2-13 Q1-14 Q2-14 vs LY vs Q1 Pounds ('000) 3,227 2,667 2,683 (544) 16 Sales ex. Surcharge ($M) 125.0 117.5 113.3 (11.7) (4.2) Op Inc ex. EID ($M) 10.4 11.6 8.6 (1.8) (3.0) % of Sales ex. Surcharge 8.3% 9.9% 7.6% -0.7% -2.3% |
|
|
Dave Strobel Senior Vice President, Global Operations 14 Athens Update |
|
|
15 Athens Facility Update Construction/Start-up Certification/Qualification Integrated Manufacturing 90% of construction completed Spend 80% complete Latest technology applied throughout facility Start-up now underway in key front-end operations Working through vendor acceptance of key equipment Met Lab and Chem Lab fully functional Accreditations: ISO17025 – certified Key NADCAP audits complete AS9100 – audit complete Beginning qualification work with key customers People and processes - well supported by other SAO sites Training for key positions very successful Strong focus on automation and process control Great leverage potential across the entire system to drive improvement |

|
|
Summary and Forward Outlook Bill Wulfsohn President and Chief Executive Officer 16 |
|
|
2nd Quarter FY14 Summary 17 Q2 Highlights Met our earnings expectations Significant gains in Transportation, Consumer & Industrial Strong overhead cost control Continued reduction in production cost per ton Weak Aerospace cycle continues to dilute overall margins Momentum beginning to build Q2 SAO orders up significantly vs. PY Focus on PEP operating model Athens now operational On budget Ahead of schedule Forward Outlook Clear signs of emerging demand recovery PEP operational improvements on track to yield Q3/Q4 gains Q3 EPS in-line with adjusted Q3 FY13 Volume and margin improvement opportunity as fixed investment in place Expect positive free cash flow by Q4 Strong balance sheet and flexibility to redeploy cash |

|
|
Appendix of Non-GAAP Schedules 18 |
|
|
19 Preliminary Non-GAAP Unaudited Schedules (in millions) OPERATING MARGIN EXCLUDING SURCHARGE AND Three Months Ended Six Months Ended PENSION EARNINGS, INTEREST AND DEFERRALS September 30, December 31, 2013 2012 2013 2013 2012 Net sales 503.5 $ 533.5 $ 498.6 $ 1,002.1 $ 1,078.5 $ Less: surcharge revenue 88.9 102.8 86.5 175.4 207.0 Consolidated net sales excluding surcharge 414.6 $ 430.7 $ 412.1 $ 826.7 $ 871.5 $ Operating income 47.5 $ 52.7 $ 55.8 $ 103.3 $ 114.3 $ Pension earnings, interest & deferrals 3.8 8.0 6.0 9.8 16.0 Operating income excluding pension earnings, interest and deferrals 51.3 $ 60.7 $ 61.8 $ 113.1 $ 130.3 $ Operating margin excluding surcharge and pension earnings, interest and deferrals 12.4% 14.1% 15.0% 13.7% 15.0% December 31, Management believes that removing the impacts of raw material surcharges from operating margin provides a more consistent basis for comparing results of operations from period to period. Management believes that excluding the impact of pension earnings, interest and deferrals, which may be volatile due to changes in the financial markets, is helpful in analyzing the true operating performance of the Company. |
|
|
20 Preliminary Non-GAAP Unaudited Schedules (in millions) Three Months Ended Six Months Ended December 31, FREE CASH FLOW 2013 2012 2013 2012 Net cash provided from operating activities 7.0 $ 38.9 $ 71.0 $ 2.2 $ Purchases of property, equipment and software (97.6) (80.5) (212.4) (136.9) Proceeds from disposals of property and equipment 0.3 0.1 0.3 0.1 Purchase of subsidiary shares from noncontrolling interest - (8.4) - (8.4) Proceeds from sale of equity method investment - 7.9 - 7.9 Dividends paid (9.6) (9.6) (19.2) (19.1) Free cash flow (99.9) $ (51.6) $ (160.3) $ (154.2) $ Management believes that the free cash flow measure provides useful information to investors regarding our financial condition because it is a measure of cash generated which management evaluates for alternative uses. December 31, |