Attached files
| file | filename |
|---|---|
| 8-K - 8-K - PANTRY INC | a12262013-form8xk.htm |
| EX-99.1 - EXHIBIT 99.1 - PRESS RELEASE - PANTRY INC | a12262014-pressrelease.htm |

The Pantry, Inc. Fiscal Year 2014 First Quarter Earnings Call Thursday, January 30, 2013 Exhibit 99.2

Slide 2 Safe Harbor Statement Some of the statements in this presentation constitute “forward-looking statements” within the meaning of the Private Securities Litigation Reform Act of 1995. All statements other than those of historical facts included herein, including those related to the company’s financial outlook, goals, business strategy, projected plans and objectives of management for future operations and liquidity, are forward-looking statements. These forward-looking statements are based on the company’s plans and expectations and involve a number of risks and uncertainties that could cause actual results to vary materially from the results and events anticipated or implied by such forward-looking statements. Please refer to the company’s Annual Report on Form 10-K and its other filings with the SEC for a discussion of significant risk factors applicable to the company. In addition, the forward-looking statements included in this presentation are based on the company’s estimates and plans as of the date of this presentation. While the company may elect to update these forward-looking statements at some point in the future, it specifically disclaims any obligation to do so. In this presentation, we will refer to certain non-GAAP financial measures that we believe are helpful in understanding our financial performance. A reconciliation of each non-GAAP financial measure to the most directly comparable GAAP measure is included in the appendix of this presentation.

First Quarter Business Overview and FY14 Outlook Performance summary Merchandise category review Merchandising and brand awareness Fuel Performance Cost management/profitability improvement Store upgrades/Quick Service Restaurants (“QSR’s”)/New stores FY14 Strategic focus and priorities Slide 3

FY2014 Q1 and Full Year Summary Loss per share of $0.23 versus loss per share of $0.14 in 2013 Adjusted EBITDA(1) of $42.4 million versus $48.9 million in Q1 FY2013 Comparable store merchandise revenue increased 3.5%; up 5.4% excluding cigarettes Merchandise sales per customer improved 4.1% on a comparable basis Comparable store retail fuel gallons sold declined 4.0% Retail fuel margins increased $0.004 per gallon to $0.118 (1) See Appendix for a description of each non-GAAP financial measure as well as a reconciliation of each non-GAAP financial measure to the most directly comparable GAAP measure. Slide 4

FY2013/FY2014 Merchandise Category Review Slide 5 FY14 Q1 Q2 Q3 Q4 Q1 Cigarettes -2.8% -6.4% -3.3% -2.0% -0.7% Other Packaged Goods 4.3% 0.2% 3.0% 3.8% 5.5% Packaged Goods 1.6% -2.3% 0.7% 1.8% 3.3% Proprietary Foodservice 8.6% 3.3% 6.9% 3.3% 6.5% QSR -1.9% -5.9% -2.4% -0.7% 4.1% Foodservice 4.2% -0.7% 3.0% 1.7% 5.6% Services 12.0% 0.7% 9.2% 9.7% 2.1% Total Comparable Store Merchandise Revenue 2.2% -2.0% 1.3% 2.0% 3.5% Total Excluding Cigarettes 4.6% 0.1% 3.3% 3.7% 5.4% FY13 Sales Comps

Merchandising and Brand Awareness Successful holiday merchandising programs Beverage merchandising improvements – Single-serve alcoholic beverage presentation – “Alternative” beverage offerings – Single-serve refrigerated beverages at sales counter (maximize impulse sales) Proprietary Foods – Continued growth in the grill category driven by new product introduction – Launched second RooMug Continuing implementation of store specific planograms Slide 6

Q1 Fuel Performance Slide 7 Continue managing through rapidly changing fuel markets with focus on maintaining a consistent value proposition Our goal is to optimize fuel gross profit by balancing margin and volumes on a market-by-market basis FY13= 11.5 cpg Historical CPG Results Historical Fuel Gallon Comp Results FY13= -4.8%

Focus On Managing Costs And Improving Productivity Slide 8 Store level productivity initiatives continue – Labor and medical costs • Restructured workforce as a result of the Affordable Care Act • 800 new part time employees and shifting of some part time employees to full time roles drove additional training • Medical expense impacted by claims experience – Improved employee training and development • Customer service • Sales growth (foodservice, in-stock performance, etc.) • Productivity – Systems/technology – Other store costs Continue optimizing remodel investments (capital and expenses)

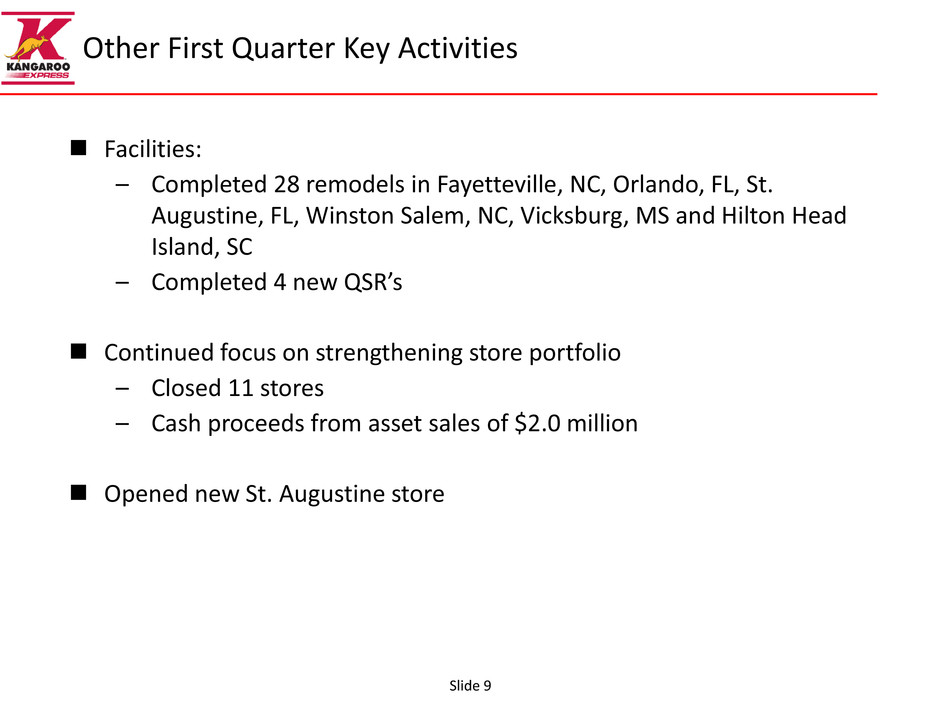
Other First Quarter Key Activities Facilities: – Completed 28 remodels in Fayetteville, NC, Orlando, FL, St. Augustine, FL, Winston Salem, NC, Vicksburg, MS and Hilton Head Island, SC – Completed 4 new QSR’s Continued focus on strengthening store portfolio – Closed 11 stores – Cash proceeds from asset sales of $2.0 million Opened new St. Augustine store Slide 9

St. Augustine Location Opened In Q1 FY14 Slide 10 Focusing investments on market by market basis Fourth new construction store opened in calendar 2013 Features our newest QSR offering, Little Caesars 4,910 square feet 8 Multi-Product Dispensers

FY14 Strategic Focus and Priorities Slide 11 Maintain momentum in our remodel and QSR programs Continue implementation of our merchandising programs throughout our store portfolio Balance fuel profitability and volumes Strengthen our position in top priority markets – opening new stores – continuing to remodel stores – disciplined acquisitions (extension of our real estate plan)

First Quarter Financial Review Slide 12 Financial Summary Financial Details Capital Expenditures Store Count Capital Structure And Liquidity Fiscal 2014 Outlook

First Quarter Financial Summary ($ millions except per share data) Slide 13 (1) Includes impairment charges of $2.3 million and $0.8 million in 2013 and 2014, respectively. (2) See Appendix for a description of each non-GAAP financial measure as well as a reconciliation of each non-GAAP financial measure to the most directly comparable GAAP measure. (1) (2) 2013 2014 Percent Change Total revenues $ 1,915.2 $ 1,804.1 -5.8% Total costs and operating expenses (1) 1,897.2 1,791.2 -5.6% Income from operations $ 18.0 $ 12.9 -28.3% Interest expense 23.1 21.4 -7.4% Loss before income taxes $ (5.1) $ (8.5) -66.7% Income tax benefit (2.0) (3.4) -70.0% Net Loss $ (3.1) $ (5.1) -64.5% Loss per share $ (0.14) $ (0.23) -64.3% Adjusted EBITDA $ 48.9 42.4$ -13.3% First Quarter

First Quarter Financial Details ($ millions) Slide 14 2013 2014 Percent Change Merchandise revenue $ 428.8 $ 440.8 2.8% Fuel revenue 1,486.4 1,363.3 -8.3% Total revenues $ 1,915.2 $ 1,804.1 -5.8% Merchandise cost of goods sold $ 281.9 $ 293.0 3.9% Fuel cost of goods sold 1,437.2 1,314.6 -8.5% Store operating 123.3 128.1 3.9% General and administrative 23.9 26.0 8.7% Impairment charges 2.3 0.8 -64.0% Depreciation and amortization 28.6 28.7 0.3% Income from operations $ 18.0 $ 12.9 -28.1% Selected financial data: Comparable store merchandise sales % 2.2% 3.5% Weighted-average store count 1,574 1,544 Merchandise margin 34.3% 33.5% Comparable store retail fuel gallons % -4.8% -4.0% Retail fuel margin per gallon $ 0.114 $ 0.118 First Quarter

FY2014 Capital Expenditures ($ millions) Slide 15 Q1 Q1 Q1 Capital expenditures 20.5$ 31.7$ 11.2$ Proceeds from asset dispositions (2.1) (2.0) 0.1$ Capital expenditures, net 18.4$ 29.7$ 11.3$ 2013 2014 Change

Ending Stores - FY2013 1,548 New 1 Closed (11) Ending Stores - Q1 FY2014 1,538 Store Count Summary Slide 16

Capital Structure And Liquidity ($ millions) Slide 17 (1) Cash and cash equivalents plus revolver availability. (1) 12/27/2012 12/26/2013 Cash 24.4$ 32.5$ Debt: Revolver - - Term loan 255.0 252.5 Notes 250.0 250.0 Lease finance obligations 451.1 441.7 Total debt 956.1$ 944.2$ Shareholder's equity 322.1 318.6 Total capitalization 1,278.2$ 1,262.8$ Net debt 931.7$ 911.7$ Total liquidity as of 12/26/13: 173.9$

Fiscal 2014 Outlook Slide 18 (1) Guidance for the second quarter and for Fiscal 2014 excludes expenses relating to the contested election of directors resulting from the nominations submitted by a shareholder group. Fiscal 2014 guidance assumes closure of approximately 40 stores. Q2 FY13 Q2 FY14 Guidance(1) FY13 FY14 Guidance(1) Actual Low High Actual Low High Merchandise sales ($B) $0.419 $0.426 $0.434 $1.80 $1.83 $1.86 Merchandise gross margin 33.7% 33.7% 34.2% 34.0% 33.7% 34.1% Retail fuel gallons (B) 0.408 0.390 0.398 1.71 1.61 1.64 Retail fuel margin per gallon $0.117 $0.105 $0.125 $0.115 $0.110 $0.130 Store operating and general and administrative expenses ($M) $150 $153 $156 $609 $615 $625 Depreciation & amortization ($M) $30 $28 $29 $118 $110 $115 Effective Corporate Tax Rate 49.0% 35.0% 38.0% 65.8% 38.0% 39.0% Interest expense ($M) $22 $21 $22 $89 $84 $87 Capital expenditures, net ($M) $17 $25 $28 $85 $95 $110

Slide 19

Appendix Slide 20 Selected financial data Use of Non-GAAP measures

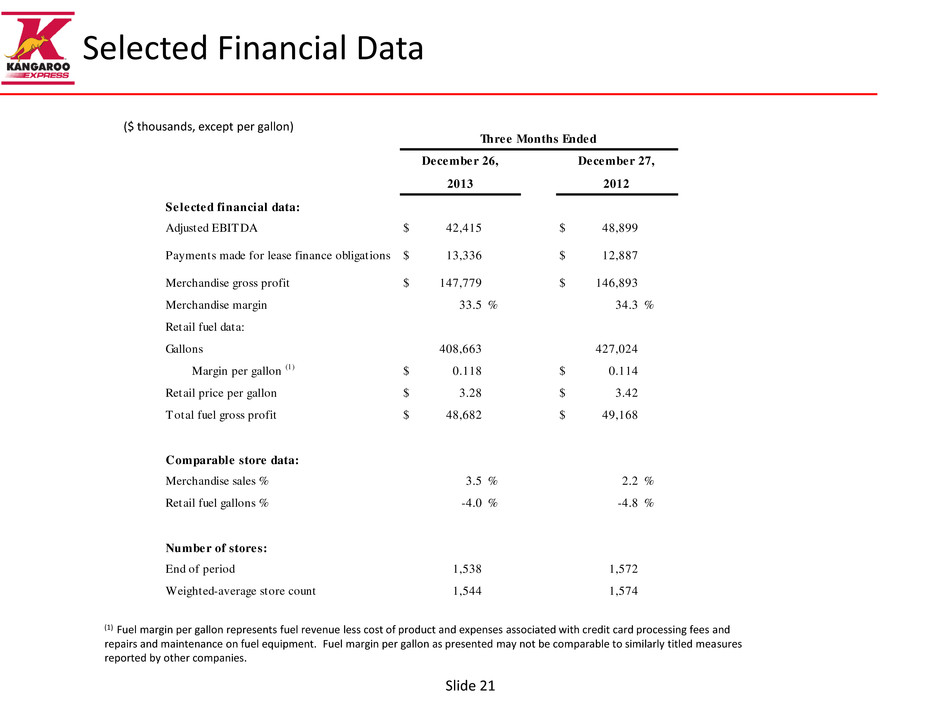
Selected financial data: Adjusted EBITDA $ 42,415 $ 48,899 Payments made for lease finance obligations $ 13,336 $ 12,887 Merchandise gross profit $ 147,779 $ 146,893 Merchandise margin % % Retail fuel data: Gallons Margin per gallon (1) $ 0.118 $ 0.114 Retail price per gallon $ 3.28 $ 3.42 Total fuel gross profit $ 48,682 $ 49,168 Comparable store data: Merchandise sales % % % Retail fuel gallons % % % Number of stores: End of period Weighted-average store count 1,538 1,572 1,544 1,574 3.5 2.2 -4.0 -4.8 408,663 427,024 33.5 34.3 Three Months Ended December 26, 2013 December 27, 2012 Selected Financial Data Slide 21 (1) Fuel margin per gallon represents fuel revenue less cost of product and expenses associated with credit card processing fees and repairs and maintenance on fuel equipment. Fuel margin per gallon as presented may not be comparable to similarly titled measures reported by other companies. ($ thousands, except per gallon)

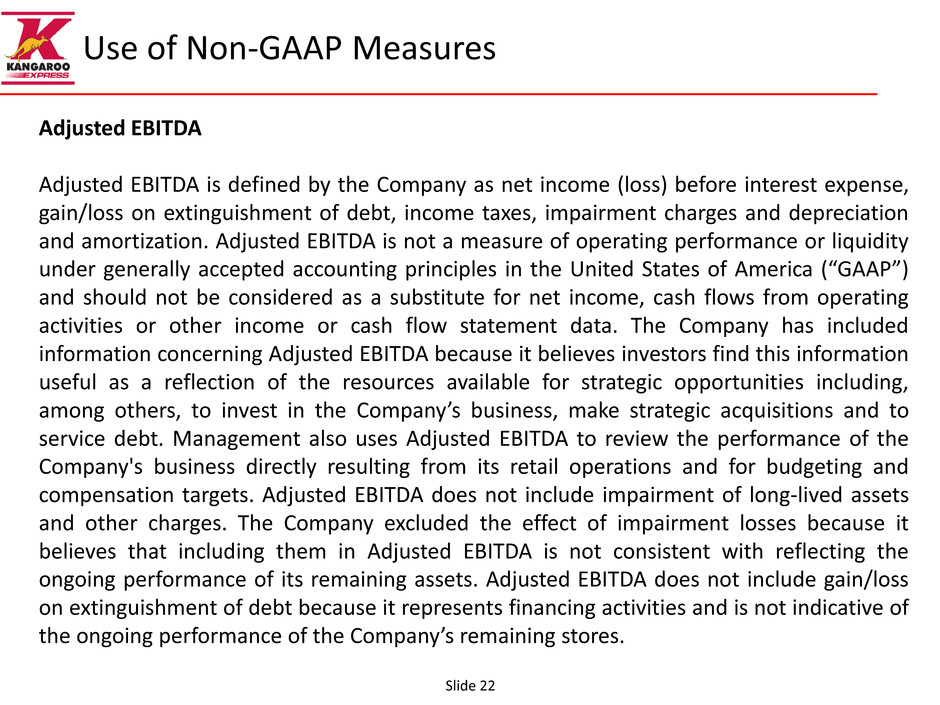
Use of Non-GAAP Measures Adjusted EBITDA Adjusted EBITDA is defined by the Company as net income (loss) before interest expense, gain/loss on extinguishment of debt, income taxes, impairment charges and depreciation and amortization. Adjusted EBITDA is not a measure of operating performance or liquidity under generally accepted accounting principles in the United States of America (“GAAP”) and should not be considered as a substitute for net income, cash flows from operating activities or other income or cash flow statement data. The Company has included information concerning Adjusted EBITDA because it believes investors find this information useful as a reflection of the resources available for strategic opportunities including, among others, to invest in the Company’s business, make strategic acquisitions and to service debt. Management also uses Adjusted EBITDA to review the performance of the Company's business directly resulting from its retail operations and for budgeting and compensation targets. Adjusted EBITDA does not include impairment of long-lived assets and other charges. The Company excluded the effect of impairment losses because it believes that including them in Adjusted EBITDA is not consistent with reflecting the ongoing performance of its remaining assets. Adjusted EBITDA does not include gain/loss on extinguishment of debt because it represents financing activities and is not indicative of the ongoing performance of the Company’s remaining stores. Slide 22

Additional Information Regarding Non-GAAP Measures Any measure that excludes interest expense, gain/loss on extinguishment of debt, depreciation and amortization, impairment charges, or income taxes has material limitations because the Company uses debt and lease financing in order to finance its operations and acquisitions, uses capital and intangible assets in its business and must pay income taxes as a necessary element of its operations. Due to these limitations, the Company uses non-GAAP measures in addition to and in conjunction with results and cash flows presented in accordance with GAAP. The Company strongly encourages investors to review its consolidated financial statements and publicly filed reports in their entirety and not to rely on any single financial measure. Because non-GAAP financial measures are not standardized, the measures referenced above, each as defined by the Company, may not be comparable to similarly titled measures reported by other companies. It therefore may not be possible to compare the Company's use of these measures with non-GAAP financial measures having the same or similar names used by other companies. Slide 23

Adjusted EBITDA Slide 24 ($ thousands) Adjusted EBITDA $ 42,415 $ 48,899 Impairment charges ) ) Interest expense ) ) Depreciation and amortization ) ) Income tax benefit Net loss $ (5,144 ) $ (3,057 ) Adjusted EBITDA $ 42,415 $ 48,899 Interest expense ) ) Income tax benefit Stock-based compensation expense Changes in operating assets and liabilities ) ) Benefit for deferred income taxes ) ) Other Net cash provided by operating activities $ 10,633 $ 17,019 Additions to property and equipment, net $ (29,745 ) $ (18,511 ) Acquisitions of businesses, net Net cash used in investing activities $ (29,745 ) $ (18,370 ) Net cash used in financing activities $ (5,550 ) $ (63,459 ) Net decrease in cash $ (24,662 ) $ (64,810 ) — 141 (2,983 (2,002 1,404 1,349 3,321 2,030 924 852 (13,076 (11,008 (21,372 (23,101 (21,372 (23,101 (28,679 (28,586 3,321 2,030 (829 (2,299 Three Months Ended December 26, 2013 December 27, 2012
