Attached files
| file | filename |
|---|---|
| EX-99.1 - EX-99.1 - Blackstone Group Inc | d665290dex991.htm |
| 8-K - FORM 8-K - Blackstone Group Inc | d665290d8k.htm |
 Blackstone’s Full Year and Fourth Quarter
2013 Earnings
January 30, 2014
Exhibit 99.2 |
 Blackstone
1
“Our
record
results
in
2013
illustrate
how
our
long-
term
fund
structures
benefit
our
investors,
and
how
our
patient
approach
toward
improving
assets
can
ultimately
drive
better
earnings
growth
and
fund
performance.”
Stephen A. Schwarzman
Chairman and Founder |
 Blackstone
2
Blackstone’s Record Full Year and Fourth Quarter 2013 Earnings
Blackstone’s
record
$3.5
billion
of
Economic
Net
Income
(“ENI”)
was
driven
by
its
best
year
of
overall
investment performance.
•
ENI
was
$1.5
billion
($1.35/unit)
for
the
quarter
and
$3.5
billion
($3.07/unit)
for
the
full
year.
Full
year
Distributable
Earnings
(“DE”)
continued
to
accelerate
to
$1.9
billion
($1.56/unit),
up
66%.
•
Distributable
Earnings
were
$0.68/unit
for
the
fourth
quarter,
driven
by
Realized
Performance
Fees
and
Realized
Investment
Income
totaling
$694
million.
•
Fund
activity
generated
$1.4
billion
of
Realized
Performance
Fees,
up
126%
for
the
year.
•
Fee
Related
Earnings
rose
to
$745
million
driven
by
18%
growth
in
Fee-Earning
Assets
Under
Management.
GAAP
Net
Income
was
$621
million
for
the
quarter
and
$1.2
billion
for
the
year,
net
of
certain
non-cash
IPO
and
transaction
related
expenses
and
non-controlling
interests,
mainly
inside
ownership.
Total
Assets
Under
Management
(“AUM”)
reached
$266
billion,
up
26%
year-over-year
with
double-digit
increases
across
all
investing
businesses,
through
a
combination
of
strong
inflows
and
appreciation.
•
Gross
asset
inflows
totaled
$17
billion
in
the
fourth
quarter
and
$60
billion
for
the
year.
•
Blackstone’s
funds
returned
$38
billion
(a)
of
capital
to
investors
during
2013.
(a)
See
Total
Assets
Under
Management
–
FY’13
Total
AUM
Rollforward,
notes
(b)
and
(c) (see page 13). |
 Blackstone
3
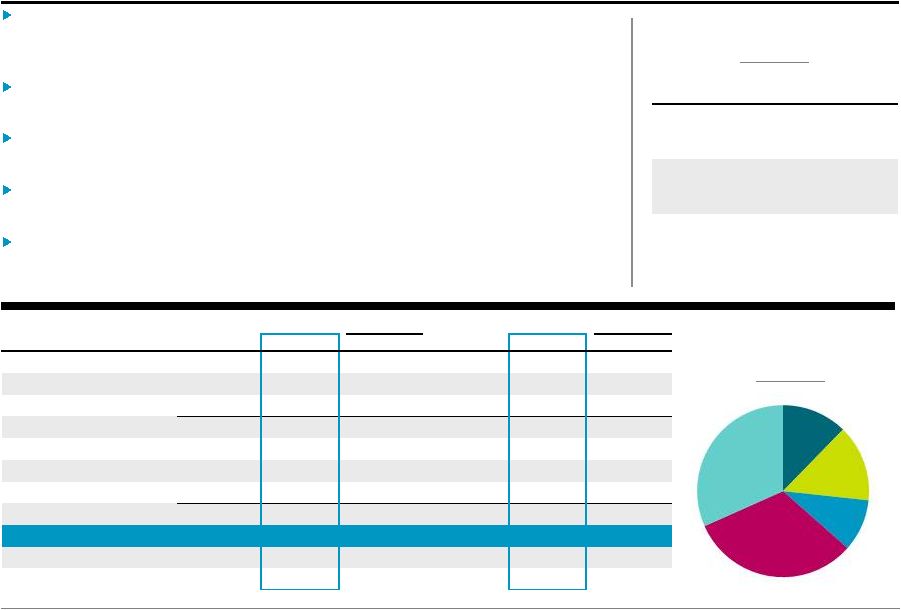
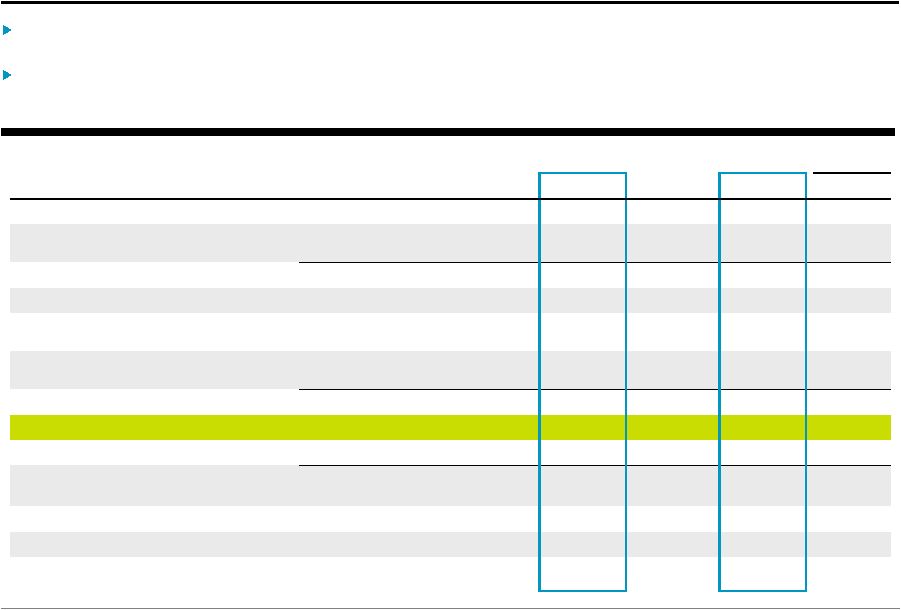
Blackstone’s Record Full Year and Fourth Quarter 2013 Earnings
(a)
ENI per Unit is based on the Weighted-Average ENI Adjusted Units.
(b)
DE per Common Unit equals DE Attributable to Common Unitholders divided by Total Common Units
Outstanding. % Change
% Change
(Dollars in Thousands, Except per Unit Data)
4Q'12
4Q'13
vs. 4Q'12
FY'12
FY'13
vs. FY'12
Fee Revenues
646,903
$
648,246
$
0%
2,186,765
$
2,367,322
$
8%
Performance Fees
470,173
1,688,219
259%
1,593,765
3,556,373
123%
Investment Income
111,670
356,743
219%
286,244
687,805
140%
Total Revenues
1,228,746
$
2,693,208
$
119%
4,066,774
$
6,611,500
$
63%
Total Expenses
542,733
1,109,921
105%
2,025,767
3,015,461
49%
Taxes
16,032
41,189
157%
45,708
82,164
80%
Economic Net Income (“ENI”)
669,981
$
1,542,098
$
130%
1,995,299
$
3,513,875
$
76%
ENI per Unit
(a)
0.59
$
1.35
$
129%
1.77
$
3.07
$
73%
GAAP Net Income
106,413
$
621,255
$
484%
218,598
$
1,171,202
$
436%
Fee Related Earnings (“FRE”)
272,604
$
260,706
$
(4)%
700,313
$
745,469
$
6%
Distributable Earnings (“DE”)
562,337
$
820,629
$
46%
1,123,965
$
1,862,699
$
66%
DE per Common Unit
(b)
0.45
$
0.68
$
51%
0.93
$
1.56
$
68%
Distribution per Common Unit
0.42
$
0.58
$
38%
0.72
$
1.34
$
86%
Total Assets Under Management
210,219,960
$
265,757,630
$
26%
210,219,960
$
265,757,630
$
26%
Fee-Earning Assets Under Management
167,880,440
$
197,981,739
$
18%
167,880,440
$
197,981,739
$
18% |
 4
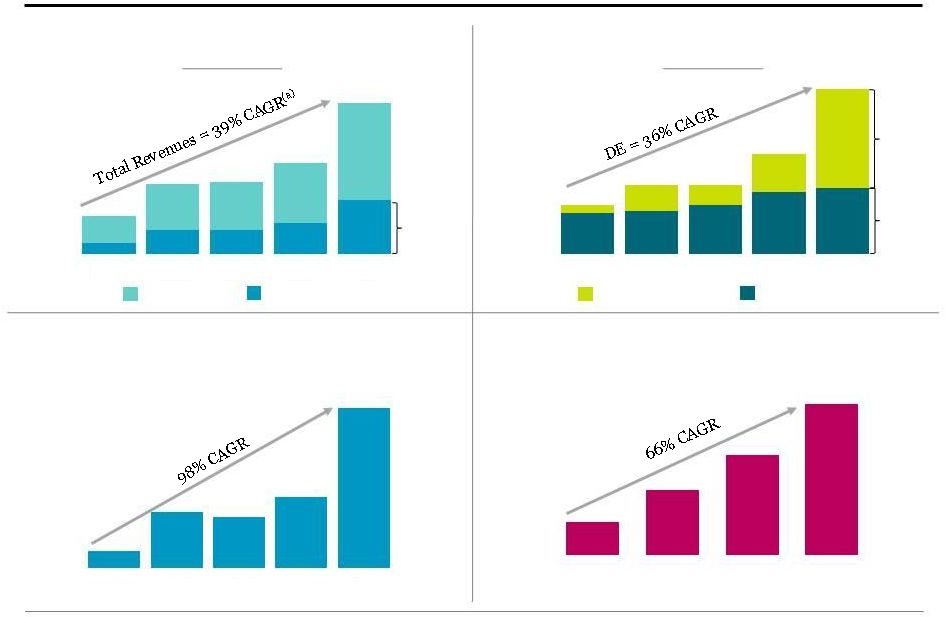
Patience Drives Sustainable Outperformance: “Compounding Effect”
Total Revenues and Economic Income
(Dollars in Millions)
Distributable Earnings: “DE”
(Dollars in Millions)
49%
CAGR
53%
Margin
Total Revenues
Economic Income
13%
CAGR
91%
CAGR
Net Realization Activity
Fee Related Earnings
$1,863
Gross Performance Fees and Investment Income
(Dollars in Millions)
Net Performance Fee Receivable
(Dollars in Millions)
(a)
CAGR = Compound Annual Growth Rate.
$724
$1,581
$1,585
$2,041
$3,596
$1,792
$3,141
$3,284
$6,612
2009
2010
2011
2012
2013
$1,863
$1,124
$781
$771
$546
$461
$478
$546
$700
$745
$84
$293
$235
$424
$1,117
2009
2010
2012
2013
2011
$274
$1,475
$1,360
$1,880
$4,244
2009
2010
2011
2012
2013
$749
$1,468
$2,238
$3,400
2010
2011
2012
2013
Blackstone
4
$4,067 |
 Blackstone
5
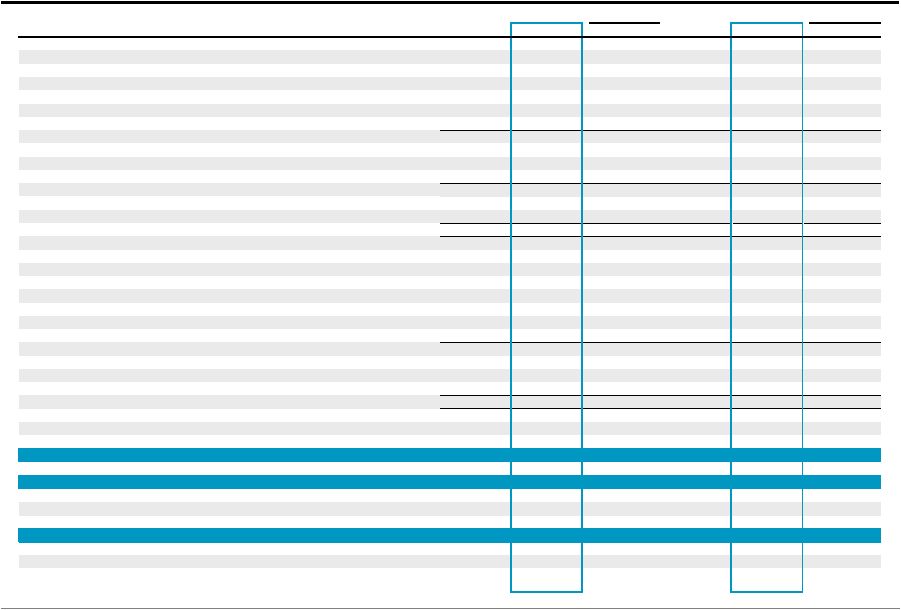
Walkdown of Financial Metrics
(Dollars in Thousands, Except per Unit Data)
4Q'13
FY'13
Results
Per Unit
(a)
Results
Per Unit
(a)
Base Management Fees
469,092
$
1,740,807
$
Advisory Fees
139,158
410,514
Transaction and Other Fees, Net
59,733
206,977
Management Fee Offsets
(43,752)
(72,220)
Interest Income and Other Revenue
28,334
61,670
Compensation
(262,688)
(1,115,640)
Other Operating Expenses
(129,171)
(486,639)
Fee Related Earnings
260,706
$
0.23
$
745,469
$
0.66
$
Net Realized Incentive Fees
202,707
273,418
Net Realized Carried Interest
252,361
686,757
Net Realized Investment Income
75,156
183,665
Taxes and Related Payables
(68,610)
(156,734)
Equity-Based Compensation
98,309
130,124
Distributable Earnings
820,629
$
0.68
$
1,862,699
$
1.56
$
Net Unrealized Incentive Fees
(102,736)
(8,277)
Net Unrealized Carried Interest
617,825
1,191,293
Net Unrealized Investment Income
277,268
523,714
Add Back: Related Payables
27,421
74,570
Less: Equity-Based Compensation
(98,309)
(130,124)
Economic Net Income
1,542,098
$
1.35
$
3,513,875
$
3.07
$
See Appendix – Walkdown of Financial Metrics – Calculation of Certain
Non-GAAP Financial Metric Components for the calculation of the amounts presented herein that
are not the respective captions from the Total Segment information (see page 31).
(a)
Fee Related Earnings per Unit is based on DE Units Outstanding; DE per Unit equals DE per
Common Unit; and ENI per Unit is based on Weighted-Average ENI Adjusted Units (See
Appendix – Unit Rollforward (see page 32)). FY’13 Fee Related Earnings per Unit and DE per Unit amounts equal the sum of the respective per unit quarterly amounts for 2013.
|
 Blackstone
6
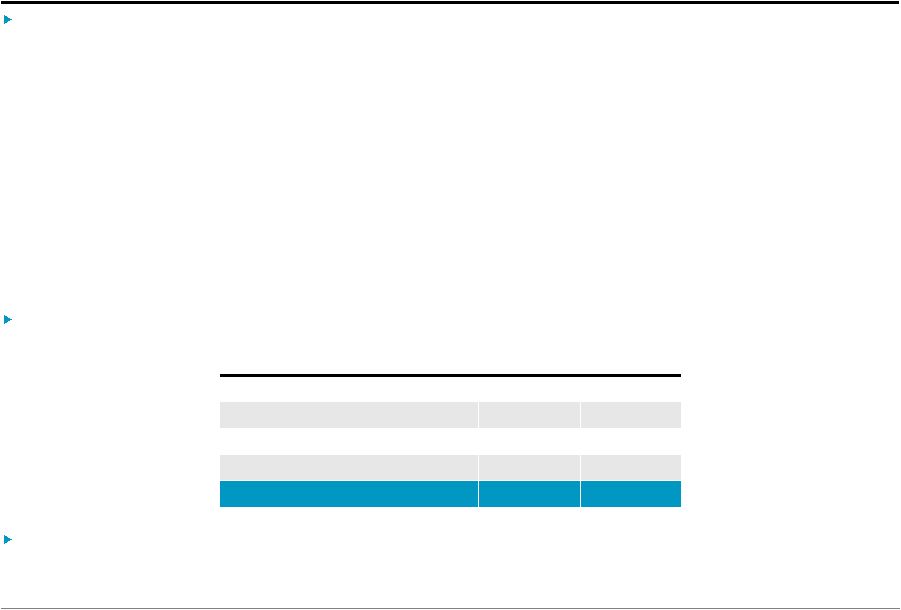
Summary Walkdown of GAAP to Non-GAAP Financial Metrics
GAAP
Economic Income
“EI”
Fee Related Earnings
“FRE”
Distributable Earnings
“DE”
Income Before Provision for Taxes
+
IPO and Acquisition-Related Charges
–
Impact of Consolidated Funds
–
Net Performance Fees
–
Fund Investment Income
+
Net Realized Performance Fees
+
Realized Investment Income
–
Taxes and Related Payables
+ Equity-Based Compensation
=
Distributable Earnings
(Dollars in Millions)
4Q’13
FY’13
$821
=
Economic Income
$1,583
$3,596
=
Fee Related Earnings
$261
$745
$1,863
$1,585
$3,149
See Appendix – Reconciliation of GAAP to Non-GAAP Measures for details (see pages
29-30). |
 Blackstone
7
Private Equity
28.5%
FY’13
increase
in
fund
carrying
value
(b)
$330 million
FY’13 Realized Performance Fees
(a)
Corporate
Private
Equity
portfolio
includes BCP,
BCOM
and
BEP. Excludes
Tactical
Opportunities,
Other
Funds
(including
fee-paying
co-investment
funds) and
Strategic
Partners.
(b)
Corporate Private Equity portfolio, Tactical Opportunities and Other Funds
(including fee-paying co-investment funds). Excludes returns for Strategic Partners.
(c)
MOIC = Multiple of Invested Capital.
(d)
See Additional Disclosures (see page 18).
(e)
“IRR”
is the Internal Rate of Return and refers to Total Net IRR. On a gross basis, BCP
IV’s IRR was 50%. Blackstone
took
advantage
of
improving
equity
markets
to
harvest
gains
driving
Total
Revenues
to
$1.5
billion
and
Economic
Income
to
$715
million,
with
$3.5
billion
of
realizations
during
the
quarter
and
$9.6
billion
for
the year.
•
Completed
the
successful
IPOs
of
Merlin
and
Hilton
during
the
quarter,
creating
a
combined
$5.4
billion
of
public
market
capitalization
for
Blackstone’s
private
equity
investors,
bringing the total market capitalization
across all funds to $17.0
billion.
•
Announced
sales
of
Mivisa,
Apria
and
GeoSouthern
which
will
generate
$2.7
billion
of
proceeds
at
closing.
Strong
performance
by
the
Corporate
Private
Equity
(a)
funds
in 2013 drove Total Revenues up 76% on increased
Performance
Fees
and
Investment
Income.
•
Overall
carrying
value
of
portfolio
assets
(b)
appreciated
11.5%
during
the
quarter
and
28.5%
for
the
full
year.
•
BCP
V
appreciated
34.5%
during
2013
and
is
now
held
at
a
MOIC
(c)
of 1.5x with 46% of fund assets public
(d)
.
•
BCP
IV
appreciated
20.5%
during
2013
and
generated
a
37% net
IRR
(e)
and
a
MOIC
of
2.8x
since
inception.
Invested
and/or
committed
$3.4
billion
of
total
capital
for
the
quarter
and
$5.0
billion
for
the
year.
Fourth
quarter
commitments:
tactical
opportunities
$1.5
billion
($5.1
billion
total);
initial
close
on
latest
Strategic
Partners
secondary
fund
of
funds
with
$688
million
total; Total AUM for Private Equity increased to $65.7 billion.
$632 million
Net Accrued Performance Fees at 4Q’13
% Change
% Change
(Dollars in Thousands)
4Q'12
4Q'13
vs. 4Q'12
FY'12
FY'13
vs. FY'12
Fee Revenues
134,857
$
123,044
$
(9)%
458,721
$
479,312
$
4%
Performance Fees
118,968
486,641
309%
258,178
728,225
182%
Investment Income
64,856
116,112
79%
111,160
249,775
125%
Total Revenues
318,681
725,797
128%
828,059
1,457,312
76%
Compensation
53,963
56,370
4%
222,709
236,120
6%
Performance Fee Compensation
26,145
276,207
956%
62,234
381,686
513%
Other Operating Expenses
40,499
32,767
(19)%
130,845
124,137
(5)%
Total Expenses
120,607
365,344
203%
415,788
741,943
78%
Economic Income
198,074
$
360,453
$
82%
412,271
$
715,369
$
74%
Total AUM
51,002,973
$
65,675,031
$
29%
51,002,973
$
65,675,031
$
29%
Fee-Earning AUM
37,050,167
$
42,600,515
$
15%
37,050,167
$
42,600,515
$
15% |
 Blackstone
8
Real Estate
31.3%
FY’13
increase
in
fund
carrying
value
(a)
$533 million
FY’13 Realized Performance Fees
Revenues
were
up
96%
to
$3.2
billion
for
2013
generating
a
107%
increase
in
Economic
Income
to
$2.1
billion.
Overall
carrying
value
of
Real
Estate
Funds
(a)
appreciated
13.1%
for
the
quarter
and
31.3%
for
the
year.
•
Completed
the
successful
IPOs
of
Hilton,
Extended
Stay
and
Brixmor
during
the
fourth
quarter.
These
investments
represent
$18.7
billion
of
unrealized
equity
value
in
funds
and
fee-paying co-investments.
•
Attractive
pricing
resulted
in
opportunities
to
exit
assets
across
the
portfolio,
generating
record
Realized
Performance
Fees
of
$533
million,
driven
by
private sales
of
stabilized
office
buildings
in
the
U.S.
and
U.K.
Closed
on
a
record
$15.8
billion
of
new
capital
across
the Real
Estate
segment
during
the
year.
•
Fourth
quarter
commitments:
first
Asian
real
estate
fund
$1.5
billion
($3.2
billion
total);
fourth
European
fund
$3.9
billion
($5.6
billion
total)
as
both
approach
their
caps
of
$5.0
billion
and
$6.9
billion
(b)
, respectively.
•
BXMT,
the
commercial
mortgage
REIT,
has
continued
its
strong
growth
since
the
May
re-IPO,
completing
three
offerings
with
a
current
market
capitalization
of
over
$1
billion, up from $61 million at the end of 2012.
Invested
$10.2
billion
of
total
capital
with
an
additional
$1.4
billion
committed
at
year
end,
bringing
the
total
capital
invested
plus
committed
to
a record $11.6
billion
for
2013
as
the
investment
environment
remained
attractive
and
we
were
able
to
capitalize
on
our
unique
global
footprint.
$2.3 billion
Net Accrued Performance Fees at 4Q’13
% Change
% Change
(Dollars in Thousands)
4Q'12
4Q'13
vs. 4Q'12
FY'12
FY'13
vs. FY'12
Fee Revenues
167,924
$
187,081
$
11%
623,736
$
646,983
$
4%
Performance Fees
201,527
958,463
376%
874,415
2,155,582
147%
Investment Income
34,442
224,926
553%
136,177
402,560
196%
Total Revenues
403,893
1,370,470
239%
1,634,328
3,205,125
96%
Compensation
54,201
75,625
40%
271,122
294,222
9%
Performance Fee Compensation
66,727
333,047
399%
240,377
724,537
201%
Other Operating Expenses
36,946
29,698
(20)%
123,714
116,391
(6)%
Total Expenses
157,874
438,370
178%
635,213
1,135,150
79%
Economic Income
246,019
$
932,100
$
279%
999,115
$
2,069,975
$
107%
Total AUM
56,695,645
$
79,410,788
$
40%
56,695,645
$
79,410,788
$
40%
Fee-Earning AUM
41,931,339
$
50,792,803
$
21%
41,931,339
$
50,792,803
$
21%
$533 million
FY’13 Realized Performance Fees
$2.3 billion
Net Accrued Performance Fees at 4Q’13
(a)
Blackstone Real Estate Partners (“BREP”) portfolio (including fee-paying
co-investment funds).
(b)
The fourth European fund has a commitment cap of €5 billion ($6.9 billion at December 31,
2013). |
 Blackstone
9
Hedge Fund Solutions
(a)
BAAM’s Principal Solutions Composite, formerly known as BAAM’s Core Funds Composite,
does not include BAAM’s long-only equity, long-biased commodities, seed,
strategic opportunities (external investments) and advisory platforms. On a net of fees basis,
the BAAM Principal Solutions Composite was up 3.4% for the quarter and 11.4% for the full
year, with a Sharpe ratio of 4.3. On a net of fees basis, the equity long/short strategies
were up between 16% and 21%. Compelling
risk-adjusted
performance
and
new
product
innovation
drove
continued
strong
growth
and
market
share
gains
for
the
world’s
largest
discretionary
allocator
to
hedge
funds.
Record
Total
Revenues
of
$649
million
resulted
in
a
46%
increase
in
Economic
Income
to
$377
million
as strong
investment performance contributed to record assets,
Management
and
Performance
Fees.
BAAM’s
Principal
Solutions
Composite
(a)
was
up
gross
3.8%
for
the
quarter
and
12.8%
for
the
full
year,
with
a
low
volatility
portfolio
leading
to
a
Sharpe
ratio
of
4.7.
The
equity
long/short
strategies
(a)
were
up
between
19%
and
23% gross.
Fee-Earning
AUM
grew
22%
year-over-year
to
$52.9
billion;
January
1
subscriptions
of
$698
million
are
not
included
in
year
end
Fee-Earning
AUM.
$27.8
billion,
or
97%,
of
Incentive
Fee-Earning
AUM,
were
above
their
high
water
mark
and/or
hurdle,
up
from
$18.6
billion
and
78%
a
year
ago,
generating
$215
million
of
Performance
Fees
for
the
full
year.
BAAM’s
Strategic
Opportunities
platform
invested
approximately
$3.4
billion
in
new
special
situation
exposures.
Fourth
quarter
commitments:
BAAM’s
permanent
capital
vehicle
acquiring
general
partner
interests
in
hedge
funds
held
its
initial
close
of
$1.1
billion.
% Change
% Change
(Dollars in Thousands)
4Q'12
4Q'13
vs. 4Q'12
FY'12
FY'13
vs. FY'12
Fee Revenues
96,801
$
114,389
$
18%
350,939
$
414,850
$
18%
Performance Fees
36,524
76,881
110%
92,475
215,453
133%
Investment Income
3,784
6,087
61%
15,787
18,307
16%
Total Revenues
137,109
197,357
44%
459,201
648,610
41%
Compensation
28,113
28,147
0%
119,731
136,470
14%
Performance Fee Compensation
9,766
18,878
93%
24,397
68,649
181%
Other Operating Expenses
16,491
15,697
(5)%
57,809
66,966
16%
Total Expenses
54,370
62,722
15%
201,937
272,085
35%
Economic Income
82,739
$
134,635
$
63%
257,264
$
376,525
$
46%
Total AUM
46,092,505
$
55,657,463
$
21%
46,092,505
$
55,657,463
$
21%
Fee-Earning AUM
43,478,791
$
52,865,837
$
22%
43,478,791
$
52,865,837
$
22%
12.8%
FY’13 Composite Return
$27.8 billion
Incentive Fee-Earning AUM at 4Q’13
(97% of Total Eligible Incentive Fees)
$5.1 billion
FY’13 Fee-Earning Net Inflows |
 Blackstone
10
Credit
Totals may not add due to rounding.
(a)
Represents
weighted-average
performance
of
the
assets
of
the
respective
flagship
funds
within
each
strategy.
Hedge
Fund
Strategies
net
returns
were
6.8%
for
4Q’13
and
18.2%
for
FY’13, Mezzanine Funds net returns were 2.8% for 4Q’13 and
17.9%
for
FY’13
and Rescue Lending Funds net returns were 9.8% for 4Q’13 and 24.3% for FY’13.
(b)
Includes business development companies (“BDCs”), closed-end funds, commingled
funds, the exchange traded fund and separately managed accounts. $65
billion 4Q’13 Total AUM
GSO’s
diversified
platform
drove
double-digit
annual
returns across its various
strategies against a challenging environment despite sustained low interest
rates and record level high yield issuance.
A
substantial
increase
in
Performance
Fees,
up
24%,
drove
Total
Revenues
to
$880
million
and
Economic
Income
to
a
record
$358
million
for
the
year.
Despite
realized
proceeds
in
carry
funds
of
$655
million
for
the
quarter
and
$3.2
billion
for
the
year,
Fee-Earning
AUM
grew
14%.
Total
AUM
grew
15%
year-over-year
to
$65.0
billion
due
to
robust
net inflows
throughout the year.
Closed
on
$1.8
billion
during
the
quarter
for
new
product
launches,
reflecting
the
continued
focus
on
growing
organically
by
leveraging
core credit
expertise.
Investment
Performance
(a)
Gross Returns
% Change
% Change
(Dollars in Thousands)
4Q'12
4Q'13
vs. 4Q'12
FY'12
FY'13
vs. FY'12
Fee Revenues
117,081
$
80,873
$
(31)%
389,304
$
405,088
$
4%
Performance Fees
113,154
166,234
47%
368,697
457,113
24%
Investment Income
8,043
8,892
11%
20,380
18,049
(11)%
Total Revenues
238,278
255,999
7%
778,381
880,250
13%
Compensation
51,853
31,802
(39)%
182,077
186,514
2%
Performance Fee Compensation
61,106
89,930
47%
186,538
238,310
28%
Other Operating Expenses
18,116
29,566
63%
84,488
96,940
15%
Total Expenses
131,075
151,298
15%
453,103
521,764
15%
Economic Income
107,203
$
104,701
$
(2)%
325,278
$
358,486
$
10%
Total AUM
56,428,837
$
65,014,348
$
15%
56,428,837
$
65,014,348
$
15%
Fee-Earning AUM
45,420,143
$
51,722,584
$
14%
45,420,143
$
51,722,584
$
14%
4Q'13
FY'13
Hedge Fund
Strategies
8.5%
24.1%
Mezzanine
Funds
3.9%
25.6%
Rescue
Lending Funds
11.8%
33.1%
CLOs
Customized Credit
Strategies
(b)
Mezzanine
Funds
Rescue
Lending
Funds
Hedge Fund
Strategies
$20.6
$8.0
$9.4
$6.4
$20.7 |
 Blackstone
11
Financial Advisory
% Change
% Change
(Dollars in Thousands)
4Q'12
4Q'13
vs. 4Q'12
FY'12
FY'13
vs. FY'12
Fee Revenues
130,240
$
142,859
$
10%
364,065
$
421,089
$
16%
Investment Income (Loss)
545
726
33%
2,740
(886)
n/m
Total Revenues
130,785
143,585
10%
366,805
420,203
15%
Compensation
59,429
70,744
19%
235,137
262,314
12%
Other Operating Expenses
19,378
21,443
11%
84,589
82,205
(3)%
Total Expenses
78,807
92,187
17%
319,726
344,519
8%
Economic Income
51,978
$
51,398
$
(1)%
47,079
$
75,684
$
61%
Full
year
revenues
were
up
15%
in
2013,
the
second
best
year
for
that
segment,
primarily
from
increased
activity
in
Restructuring, the Park Hill fund placement business and the impact of the first
full year of earnings from Blackstone Capital Markets, which was an active
participant in increased public market activity for both equity and debt
issuances.
Blackstone
Capital
Markets
had
a
successful
first
year
as
it
acted
as
an
underwriter
or
arranger
on
26
deals,
including
the
IPOs
for
Brixmor,
Extended
Stay
and
Pinnacle
Foods,
the
IPO
and
secondary
offering
for
SeaWorld, and the IPO
and debt refinancing for Hilton.
Restructuring
had
its
second
best
year
of
revenue
despite
the
improving
economy
and
historically
low
default
rates,
as
the
business
diversified
its
client
base
and
advisory
roles
through
a
number
of
high profile
assignments and continued focus
on non-bankruptcy related assignments.
Park
Hill’s
double-digit
growth
in
placement
fee
revenue
is
a
key
indicator
of
the
value
to
alternative
managers
to
raise
capital
but
is
also
a
reflection
of
continued
positive
trends
in
institutional
commitments
to
alternatives.
Blackstone Advisory Partners revenue was down year-over-year, consistent
with the 2013 industry trend of the lowest announced merger and
acquisition dollar volume since 2009, although a meaningful backlog of assignments existed at
year end.
|
 Blackstone
12
Private
Equity
Real
Estate
Hedge
Fund
Solutions
Credit
Totals may not add due to rounding.
(a)
Inflows: include contributions, capital raised, other increases in available capital, purchases
and acquisitions. (b)
Outflows: represent redemptions, client withdrawals and other decreases in available
capital. (c)
Realizations: represent realizations from the disposition of assets.
(d)
Market Activity: gains (losses) on portfolio investments and impact of foreign exchange rate
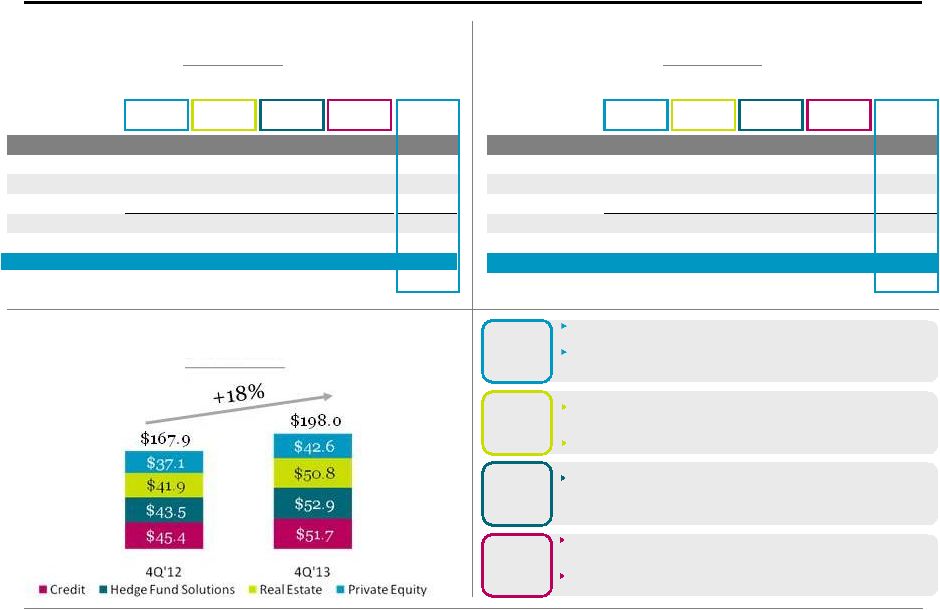
fluctuations. Fee-Earning AUM by Segment
(Dollars in Billions)
4Q’13 Fee-Earning AUM Rollforward
(Dollars in Millions)
FY’13 Fee-Earning AUM Rollforward
(Dollars in Millions)
Inflows: Strategic Partners (“SP”) acquisition $7.0B; Tactical
Opportunities $2.7B.
Inflows: CLO launches raised $3.7B in long term funds; capital deployed
in Mezzanine and Rescue Lending funds ($1.4B); capital raised in
Hedge Fund Strategies ($1.6B), BDCs ($4.8B) and other vehicles
($3.9B). Realizations: BCP V $2.6B (including Nielsen ($309M), SeaWorld
($196M), Pinnacle ($157M)); BCP IV $744M including Vanguard ($286M), TDC
($135M) and TRW ($119M).
Inflows: first Asian fund $3.2B; fourth European fund $5.5B;
co-investment across funds $1.6B, BXMT $715M and second debt
strategies fund $1.3B.
Realizations: $6.9B returned to CLO investors; $1.9B returned
across Mezzanine and Rescue Lending funds.
Net Inflows: $3.3B in customized funds; $1.1B in launch of
1940 Act mutual fund; January 1, 2014 subscriptions of
$698M.
Realizations: BREDS $2.1B; BREP VI $603M; BREP V $460M.
Fee-Earning Assets Under Management
Private
Real
Hedge Fund
Equity
Estate
Solutions
3Q'13
43,645
$
44,716
$
50,830
$
49,459
$
188,650
$
Inflows
(a)
803
7,623
2,165
3,438
14,029
Outflows
(b)
(238)
(233)
(1,541)
(528)
(2,540)
Realizations
(c)
(1,695)
(1,445)
(185)
(1,425)
(4,750)
Net Inflows (Outflows)
(1,130)
5,945
440
1,485
6,739
Market Activity
(d)
86
132
1,596
778
2,592
4Q'13
42,601
$
50,793
$
52,866
$
51,723
$
197,982
$
QoQ Increase (Decrease)
(2)%
14%
4%
5%
5%
Credit
Total
Private
Real
Hedge Fund
Equity
Estate
Solutions
4Q'12
37,050
$
41,931
$
43,479
$
45,420
$
167,880
$
Inflows
(a)
9,884
13,836
9,098
15,382
48,200
Outflows
(b)
(393)
(1,330)
(3,627)
(2,085)
(7,434)
Realizations
(c)
(4,025)
(3,649)
(348)
(8,872)
(16,894)
Net Inflows
5,466
8,856
5,123
4,426
23,872
Market Activity
(d)
84
5
4,264
1,877
6,230
4Q'13
42,601
$
50,793
$
52,866
$
51,723
$
197,982
$
YoY Increase
15%
21%
22%
14%
18%
Credit
Total |
 Blackstone
13
Private
Equity
Real
Estate
Hedge
Fund
Solutions
Credit
Totals may not add due to rounding.
(a)
Inflows: include contributions, capital raised, other increases in available capital, purchases
and acquisitions. (b)
Outflows: represent redemptions, client withdrawals and other decreases in available
capital. (c)
Realizations: represent realizations from the disposition of assets and the effect of changes
in the definition of Total Assets Under Management. (d)
Market Activity: gains (losses) on portfolio investments and impact of foreign exchange rate
fluctuations. Total AUM by Segment
(Dollars in Billions)
Total Assets Under Management
4Q’13 Total AUM Rollforward
(Dollars in Millions)
FY’13 Total AUM Rollforward
(Dollars in Millions)
Private
Real
Hedge Fund
Equity
Estate
Solutions
4Q'12
51,003
$
56,696
$
46,093
$
56,429
$
210,220
$
Inflows
(a)
14,420
17,687
9,338
18,834
60,279
Outflows
(b)
(653)
(1,050)
(3,855)
(2,811)
(8,368)
Realizations
(c)
(9,584)
(8,298)
(448)
(11,196)
(29,526)
Net Inflows
4,183
8,339
5,035
4,828
22,384
Market Activity
(d)
10,489
14,376
4,530
3,758
33,153
4Q'13
65,675
$
79,411
$
55,657
$
65,014
$
265,758
$
YoY Increase
29%
40%
21%
15%
26%
Credit
Total
Private
Real
Hedge Fund
Equity
Estate
Solutions
3Q'13
62,620
$
68,964
$
53,162
$
63,318
$
248,065
$
Inflows
(a)
2,462
7,634
2,698
4,193
16,987
Outflows
(b)
(67)
(374)
(1,661)
(1,081)
(3,182)
Realizations
(c)
(3,490)
(3,376)
(237)
(2,843)
(9,946)
Net Inflows (Outflows)
(1,095)
3,884
801
269
3,859
Market Activity
(d)
4,150
6,562
1,695
1,427
13,834
4Q'13
65,675
$
79,411
$
55,657
$
65,014
$
265,758
$
QoQ Increase
5%
15%
5%
3%
7%
Credit
Total
Market Activity: driven by successful IPOs of Hilton ($5.5B), Extended
Stay ($697M) and Brixmor ($600M), as well as improving fundamentals of
Equity Office Properties ($1.0B) and Invitation Homes ($912M). Market Activity: $4.1B of appreciation in customized and commingled
funds; BAAM’s Principal Solutions Composite up 12.8% gross.
Market Activity: $1.5B of gains in Hedge Fund Strategies and business
development companies; $1.5B appreciation in carry funds. Inflows: SP fund acquisition $9.4B, Tactical Opportunites $3.5B;
first close of next SP fund $688M.
Market Activity: successful IPOs in BCP V of $3.7B (Hilton ($2.0B),
Pinnacle
($1.1B), SeaWorld($536M)) and BCP IV of $1.0B (Merlin); in
total, public
portfolio appreciation of 49.5% created $6.6B of value. Inflows in excess of Fee-Earning inflows: largely driven by
commitments to Rescue Lending funds ($2.1B) and Mezzanine funds
($729M). Inflows in excess of Fee-Earning inflows: $1.1B initial close of first
permanent capital vehicle acquiring general partner interests in hedge
funds.
|
 Blackstone
14
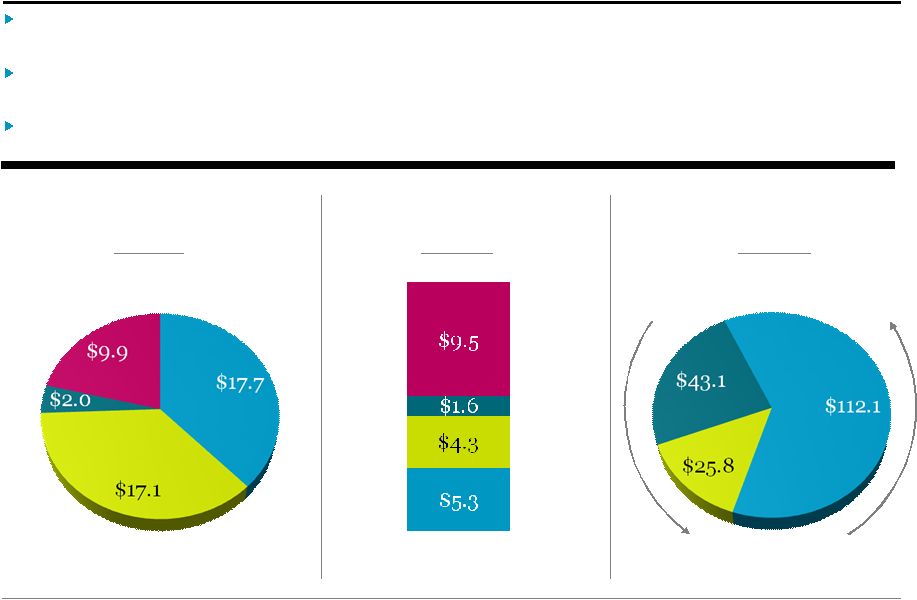
4Q’13 Available Capital Summary
Committed
undrawn
capital
(“dry
powder”)
reached
its
highest
level
of
$46.8
billion
at
year
end
on
strong
inflows that easily outpaced $15.3 billion of total capital deployed.
$20.8
billion
of
Total
AUM
was
not
yet
earning
Base
Management
Fees
at
year
end
due
largely
to
fund
structures
where
the
payment
of
Management
Fees
is
triggered
by
investment
of
capital
rather
than
commitment.
Performance
Fee
Eligible
AUM
(a)
was
$181.0
billion
at
year
end,
including
$112.1
billion
currently
earning
Performance Fees.
(a)
Represents invested and to be invested capital at fair value, including closed commitments for
funds whose investment period has not yet commenced, on which performance fees could be
earned if certain hurdles are met.
(b)
Represents (i) committed uninvested capital of the Private Equity and Real Estate drawdown
funds, and (ii) committed uninvested capital for the Real Estate debt strategies drawdown funds, the Credit Mezzanine and Rescue Lending funds and
the Hedge Fund Solutions Strategic Alliance Fund and other separately managed accounts.
(c)
Represents illiquid drawdown funds only; excludes marketable vehicles; includes both
Fee-Earning (third party) capital and general partner/employee commitments that do not earn fees. Amounts reduced by outstanding
commitments to invest, but for which capital has not been called.
$47 billion Dry Powder
(b)
Credit
Hedge
Fund
Solutions
Private
Equity
Real
Estate
$21 billion Not Yet Earning
Base Management Fees
(c)
$181 billion Performance
Fee Eligible AUM
(a)
Currently Earning
Performance Fees
Invested/Committed Not Yet
Earning Performance Fees
To Be Invested
Credit
Hedge Fund
Solutions
Real
Estate
Private
Equity
Totals may not add due to rounding. |
 Blackstone
15
On
December
11,
2013,
S&P
upgraded
Blackstone
to
A+,
matching
Fitch’s
rating,
making
Blackstone
the
highest
rated alternative asset manager and one of the highest rated global financial
services firms. At
December
31,
2013,
Blackstone
had
$2.1
billion
in
total
cash,
corporate
treasury
and
liquid
investments
and
$8.3 billion of total net value, or $7.29 per DE unit, up 23% from $5.95 a year
ago. Blackstone’s
Net
Performance
Fees
were
$3.4
billion
at
the
end
of
2013,
up
52%
from
2012,
and
over
two
times
the
amount
from
2011,
reflecting
the
consistent
high
returns
of
a
diverse
set
of
funds
generating
Performance
Fees.
Long-term debt of $1.6
billion from the 2009, 2010 and 2012 bond issuances.
There
are
currently
no
borrowings
outstanding
against
the
$1.1
billion
revolving
credit
facility
expiring
in
2017.
Balance Sheet Highlights
(a)
(a)
Preliminary, excludes the consolidated Blackstone funds. Totals may not add due to
rounding. (b)
Primarily Blackstone investments in Hedge Fund Solutions and non-drawdown Credit.
(c)
Illiquids include Blackstone investments in all drawdown funds in Private Equity, Real Estate
and Credit. (d)
Senior notes of $600 million issued August 2009 maturing on August 15, 2019 (6.625% coupon),
$400 million issued September 2010 maturing on March 15, 2021 (5.875% coupon), $400 million issued August 2012 maturing on February 15,
2023 (4.750% coupon) and $250 million issued August 2012 maturing on August 15, 2042 (6.250%
coupon), net of $15 million held by Blackstone.
(Dollars in Millions)
3Q’13
4Q’13
Cash and Cash Equivalents
$
889
$
832
Treasury Cash Management
Strategies
1,137
1,187
Liquid Investments
(b)
151
114
Illiquid Investments
(c)
2,447
2,741
Net Performance Fees
2,769
3,400
Total Net Value
$
7,393
$
8,274
Outstanding Bonds (at par)
(d)
$
1,635
$
1,635
A+/A+
rated by S&P and Fitch
$1.1 billion
undrawn credit revolver with
July 2017 maturity
$2.1 billion
total cash, corporate treasury
and liquid investments
$7.29
Cash and Investments per DE unit
Net Performance
Fees
Total Cash and
Treasury Investments
Illiquids
$8.3 billion
Total Net Value |
 Blackstone
16
Unitholder Distribution
(a)
Generated $1.56 of Distributable Earnings per common unit during
2013, up 68% year-over-year.
Declared a quarterly distribution of $0.58
per common unit to record holders as of February 10, 2014; payable on
February 18, 2014, bringing the full fiscal year distribution to
$1.34 per common unit, up 86% from 2012.
(a)
A
detailed
description
of
Blackstone’s
distribution
policy
and
the
revised
definition
of
Distributable
Earnings
can
be
found
in
Appendix
–
Definitions
and
Distribution
Policy
(see
page
33).
(b)
DE
before
Certain
Payables
represents
Distributable
Earnings
before
the
deduction
for
the
Payable
Under
Tax
Receivable
Agreement
and
tax
expense
(benefit)
of
wholly-owned
subsidiaries.
(c)
Per
Unit
calculations
are
based
on
Total
Common
Units
Outstanding
(see
Appendix
–
Unit
Rollforward
(see
page
32));
actual
distributions
are
paid
to
applicable
unitholders
as
of
the
record
date.
(d)
Retained
capital
is
withheld
pro-rata
from
common
and
Blackstone
Holdings
Partnership
unitholders.
Common
unitholders’
share
was
$58.8
million
for
4Q’13
and
$125.7
million
for
FY’13.
% Change
(Dollars in Thousands, Except per Unit Data)
1Q'13
2Q'13
3Q'13
4Q'13
FY'12
FY'13
vs. FY'12
Distributable Earnings (“DE”)
390,912
$
338,485
$
312,673
$
820,629
$
1,123,965
$
1,862,699
$
66%
Add: Other Payables Attributable to
Common Unitholders
2,204
28,498
17,694
58,103
91,633
106,499
16%
DE before Certain Payables
(b)
393,116
366,983
330,367
878,732
1,215,598
1,969,198
62%
Percent to Common Unitholders
51%
51%
52%
52%
49%
51%
DE before Certain Payables Attributable to
Common Unitholders
199,812
187,652
170,216
455,291
595,204
1,012,971
70%
Less: Other Payables Attributable to
Common Unitholders
(2,204)
(28,498)
(17,694)
(58,103)
(91,633)
(106,499)
(16)%
DE Attributable to Common Unitholders
197,608
159,154
152,522
397,188
503,571
906,472
80%
DE per Common Unit
(c)
0.34
$
0.28
$
0.26
$
0.68
$
0.93
$
1.56
$
68%
Less: Retained Capital per Unit
(d)
(0.04)
$
(0.05)
$
(0.03)
$
(0.10)
$
(0.21)
$
(0.22)
$
(5)%
Net Cash Available for Distribution per
Common Unit
(c)
0.30
$
0.23
$
0.23
$
0.58
$
0.72
$
1.34
$
86%
Actual Distribution per Common Unit
(c)
0.30
$
0.23
$
0.23
$
0.58
$
0.72
$
1.34
$
86%
Record Date
Feb 10, 2014
Payable Date
Feb 18, 2014 |
 Blackstone
17
GAAP Statement of Operations
% Change
% Change
(Dollars in Thousands, Except per Unit Data) (Unaudited)
4Q'12
4Q'13
vs. 4Q'12
FY'12
FY'13
vs. FY'12
Revenues
Management and Advisory Fees, Net
601,860
$
602,034
$
0%
2,030,693
$
2,193,985
$
8%
Performance Fees
Realized Carried Interest
174,168
283,846
63%
327,422
943,958
188%
Realized Incentive Fees
273,304
334,109
22%
301,801
464,838
54%
Unrealized Carried Interest
207,639
1,233,905
494%
994,190
2,158,010
117%
Unrealized Incentive Fees
(185,372)
(167,198)
10%
(30,361)
(22,749)
25%
Total Performance Fees
469,739
1,684,662
259%
1,593,052
3,544,057
122%
Investment Income
Realized
53,311
51,294
(4)%
93,963
188,644
101%
Unrealized
74,325
348,523
369%
256,231
611,664
139%
Total Investment Income
127,636
399,817
213%
350,194
800,308
129%
Interest and Dividend Revenue
13,173
18,248
39%
40,354
64,511
60%
Other
4,705
4,619
(2)%
5,148
10,307
100%
Total Revenues
1,217,113
2,709,380
123%
4,019,441
6,613,168
65%
Expenses
Compensation and Benefits
Compensation
559,781
448,443
(20)%
2,091,698
1,844,485
(12)%
Performance Fee Compensation
Realized Carried Interest
58,573
31,485
(46)%
96,433
257,201
167%
Realized Incentive Fees
125,758
140,794
12%
140,042
200,915
43%
Unrealized Carried Interest
71,378
616,080
763%
321,599
966,717
201%
Unrealized Incentive Fees
(91,965)
(70,297)
24%
(44,528)
(11,651)
74%
Total Compensation and Benefits
723,525
1,166,505
61%
2,605,244
3,257,667
25%
General, Administrative and Other
131,063
128,336
(2)%
548,738
474,442
(14)%
Interest Expense
25,505
27,687
9%
72,870
107,973
48%
Fund Expenses
5,586
7,944
42%
33,829
26,658
(21)%
Total Expenses
885,679
1,330,472
50%
3,260,681
3,866,740
19%
Other Income (Loss)
Reversal of Tax Receivable Agreement Liability
-
20,469
n/m
-
20,469
n/m
Net Gains (Losses) from Fund Investment Activities
(144,267)
185,536
n/m
256,145
381,664
49%
Income Before Provision for Taxes
187,167
$
1,584,913
$
747%
1,014,905
$
3,148,561
$
210%
Provision for Taxes
65,696
91,090
39%
185,023
255,642
38%
Net Income
121,471
$
1,493,823
$
n/m
829,882
$
2,892,919
$
249%
Net Income Attributable to Redeemable Non-Controlling Interests in Consolidated
Entities 25,151
47,445
89%
103,598
183,315
77%
Net Income (Loss) Attributable to Non-Controlling Interests in Consolidated Entities
(180,011)
149,834
n/m
99,959
198,557
99%
Net Income Attributable to Non-Controlling Interests in Blackstone Holdings
169,918
675,289
297%
407,727
1,339,845
229%
Net Income Attributable to The Blackstone Group L.P. ("BX")
106,413
$
621,255
$
484%
218,598
$
1,171,202
$
436%
Net Income per Common Unit, Basic
0.19
$
1.05
$
453%
0.41
$
2.00
$
388%
Net Income per Common Unit, Diluted
0.19
$
1.04
$
447%
0.41
$
1.98
$
383% |
 Blackstone
18
Additional Disclosures
How much gain does BCP V need in order to cross its carry threshold, considering
it had significant appreciation in 2013? •
During 2013, BCP V appreciated 34.5% and returned $4.1 billion of capital to
investors, resulting in $13.5 billion of remaining invested capital
(a)
.
•
BCP V is comprised of two fund classes based on the timing of fund closings, BCP
V “main fund” ($12.3 billion remaining
invested capital; $18.0
billion fair value; 1.5x MOIC) and BCP V-AC ($1.3 billion remaining
invested; $2.2 billion fair value; 1.7x MOIC) (see page 26).
•
Within these fund classes, the General Partner (“GP”) is subject to
equalization such that (a) the GP accrues Performance Fees when the total
Performance Fees for the combined fund classes are positive, and (b) the GP realizes Performance
Fees so long as clawback obligations, if any, for the combined fund classes are
fully satisfied. –
BCP V-AC has crossed its hurdle. Since the Performance Fees for the
combined fund classes are positive, Blackstone accrued $26 million of net
Performance Fees in 4Q’13 (see page 26). –
On a combined basis, BCP V currently needs a 3% increase in Total Enterprise
Value (“TEV”), or $1.3 billion, to begin the
“catch-up” phase of the 80/20 accrual of carry in favor of
Blackstone as the GP. A year ago, BCP V needed a 12% increase in TEV
(or $5.6 billion) to begin the carry catch-up phase. What is the
breakdown of the Hilton investment across Blackstone’s funds? Why are
Credit’s Fee Revenues down 31% year-over-year in 4Q’13? •
During the quarter, Credit recorded a Management Fee Offset of $30 million
related to Placement Fees reimbursed to investors in certain drawdown
funds from 2Q’11 to 3Q’13 and is not recurring. (Dollars and Shares in
Millions) Shares Held
Cost Basis
(b)
BREP VI
346
$3,003
BCP V
202
1,755
BREP Co-Investment
161
1,382
BREP International II
43
371
Total Blackstone
752
$6,511
(a)
Remaining invested capital of $13.5 billion excludes Blackstone side-by-side
investments. Total capital including side-by-side is $14 billion.
(b)
Reflects original equity investment at cost. Includes Blackstone side-by-side
investments. |
 Appendix
*
*
*
*
*
*
*
* |
 Blackstone
20
Total Segments
(a)
Transaction and Other Fees, Net, are net of amounts, if any, shared with limited partners
including, for Private Equity, broken deal expenses. (b)
Primarily placement fees.
(Dollars in Thousands)
4Q'12
1Q'13
2Q'13
3Q'13
4Q'13
FY'12
FY'13
Revenues
Management and Advisory Fees, Net
Base Management Fees
416,465
$
408,747
$
425,674
$
437,294
$
469,092
$
1,591,403
$
1,740,807
$
Advisory Fees
128,248
67,020
120,734
83,602
139,158
357,417
410,514
Transaction and Other Fees, Net
(a)
94,069
37,974
66,464
42,806
59,733
227,119
206,977
Management Fee Offsets
(b)
(11,476)
(9,662)
(10,535)
(8,271)
(43,752)
(40,953)
(72,220)
Total Management and Advisory Fees, Net
627,306
504,079
602,337
555,431
624,231
2,134,986
2,286,078
Performance Fees
Realized Carried Interest
174,168
294,170
183,288
182,654
283,846
327,422
943,958
Realized Incentive Fees
272,873
24,727
74,867
31,238
343,501
301,464
474,333
Unrealized Carried Interest
207,639
177,347
456,706
290,052
1,233,905
994,190
2,158,010
Unrealized Incentive Fees
(184,507)
107,755
4,358
40,992
(173,033)
(29,311)
(19,928)
Total Performance Fees
470,173
603,999
719,219
544,936
1,688,219
1,593,765
3,556,373
Investment Income
Realized
37,448
38,110
54,586
11,492
66,283
95,398
170,471
Unrealized
74,222
96,661
42,533
87,680
290,460
190,846
517,334
Total Investment Income
111,670
134,771
97,119
99,172
356,743
286,244
687,805
Interest Income and Dividend Revenue
14,890
14,661
15,342
21,539
19,394
46,630
70,936
Other
4,707
2,143
(1,164)
4,708
4,621
5,149
10,308
Total Revenues
1,228,746
1,259,653
1,432,853
1,225,786
2,693,208
4,066,774
6,611,500
Expenses
Compensation
247,559
266,977
306,477
279,498
262,688
1,030,776
1,115,640
Performance Fee Compensation
Realized Carried Interest
58,573
89,437
75,910
60,369
31,485
96,433
257,201
Realized Incentive Fees
125,758
10,508
35,014
14,599
140,794
140,042
200,915
Unrealized Carried Interest
71,378
95,472
172,824
82,341
616,080
321,599
966,717
Unrealized Incentive Fees
(91,965)
44,478
3,084
11,084
(70,297)
(44,528)
(11,651)
Total Compensation and Benefits
411,303
506,872
593,309
447,891
980,750
1,544,322
2,528,822
Other Operating Expenses
131,430
114,444
120,152
122,872
129,171
481,445
486,639
Total Expenses
542,733
621,316
713,461
570,763
1,109,921
2,025,767
3,015,461
Economic Income
686,013
$
638,337
$
719,392
$
655,023
$
1,583,287
$
2,041,007
$
3,596,039
$
Economic Net Income
669,981
$
628,306
$
703,240
$
640,231
$
1,542,098
$
1,995,299
$
3,513,875
$
Fee Related Earnings
272,604
$
137,733
$
168,434
$
178,596
$
260,706
$
700,313
$
745,469
$
Distributable Earnings
562,337
$
390,912
$
338,485
$
312,673
$
820,629
$
1,123,965
$
1,862,699
$
Total Assets Under Management
210,219,960
$
218,210,672
$
229,571,741
$
248,064,888
$
265,757,630
$
210,219,960
$
265,757,630
$
Fee-Earning Assets Under Management
167,880,440
$
170,949,347
$
176,338,947
$
188,649,817
$
197,981,739
$
167,880,440
$
197,981,739
$
Weighted Average Fee-Earning AUM
168,328,454
$
169,551,186
$
173,706,678
$
185,628,676
$
196,309,547
$
160,130,294
$
186,133,604
$
LP Capital Invested
5,690,474
$
1,784,463
$
3,634,404
$
3,378,067
$
5,382,770
$
13,898,971
$
14,179,704
$
Total Capital Invested
6,200,755
$
1,840,474
$
3,757,591
$
3,536,365
$
6,115,856
$
15,614,849
$
15,250,286
$ |
 Blackstone
21
Private Equity
(a)
Transaction and Other Fees, Net, are net of amounts, if any, shared with limited partners
including broken deal expenses. (b)
Primarily placement fees.
(Dollars in Thousands)
4Q'12
1Q'13
2Q'13
3Q'13
4Q'13
FY'12
FY'13
Revenues
Management Fees, Net
Base Management Fees
89,194
$
86,246
$
86,621
$
95,281
$
99,998
$
348,594
$
368,146
$
Transaction and Other Fees, Net
(a)
41,339
24,453
38,348
16,052
18,135
100,080
96,988
Management Fee Offsets
(b)
(705)
(480)
(1,950)
(2,080)
(1,173)
(5,926)
(5,683)
Total Management Fees, Net
129,828
110,219
123,019
109,253
116,960
442,748
459,451
Performance Fees
Realized Carried Interest
45,491
139,892
3,899
85,121
101,081
109,797
329,993
Unrealized Carried Interest
73,477
(83,954)
182,926
(86,300)
385,560
148,381
398,232
Total Performance Fees
118,968
55,938
186,825
(1,179)
486,641
258,178
728,225
Investment Income
Realized
10,918
24,162
21,586
11,495
30,783
25,823
88,026
Unrealized
53,938
31,711
21,088
23,621
85,329
85,337
161,749
Total Investment Income
64,856
55,873
42,674
35,116
116,112
111,160
249,775
Interest Income and Dividend Revenue
4,609
2,984
3,251
5,231
4,136
13,556
15,602
Other
420
424
366
1,521
1,948
2,417
4,259
Total Revenues
318,681
225,438
356,135
149,942
725,797
828,059
1,457,312
Expenses
Compensation
53,963
60,203
63,747
55,800
56,370
222,709
236,120
Performance Fee Compensation
Realized Carried Interest
1,507
16,246
877
19,824
2,006
3,679
38,953
Unrealized Carried Interest
24,638
16,619
88,111
(36,198)
274,201
58,555
342,733
Total Compensation and Benefits
80,108
93,068
152,735
39,426
332,577
284,943
617,806
Other Operating Expenses
40,499
29,168
32,178
30,024
32,767
130,845
124,137
Total Expenses
120,607
122,236
184,913
69,450
365,344
415,788
741,943
Economic Income
198,074
$
103,202
$
171,222
$
80,492
$
360,453
$
412,271
$
715,369
$
Total Assets Under Management
51,002,973
$
52,491,811
$
53,287,294
$
62,619,813
$
65,675,031
$
51,002,973
$
65,675,031
$
Fee-Earning Assets Under Management
37,050,167
$
36,785,770
$
36,635,224
$
43,645,106
$
42,600,515
$
37,050,167
$
42,600,515
$
Weighted Average Fee-Earning AUM
38,507,697
$
36,907,936
$
36,675,636
$
43,886,763
$
43,290,792
$
38,126,640
$
43,977,145
$
LP Capital Invested
1,461,987
$
276,987
$
749,290
$
524,320
$
1,017,985
$
3,223,535
$
2,568,582
$
Total Capital Invested
1,860,738
$
291,011
$
780,339
$
548,173
$
1,330,606
$
4,077,621
$
2,950,129
$ |
 Blackstone
22
Real Estate
(a)
Transaction and Other Fees, Net, are net of amounts, if any, shared with limited
partners. (b)
Primarily placement fees.
(Dollars in Thousands)
4Q'12
1Q'13
2Q'13
3Q'13
4Q'13
FY'12
FY'13
Revenues
Management Fees, Net
Base Management Fees
140,044
$
138,346
$
137,000
$
136,721
$
153,115
$
551,322
$
565,182
$
Transaction and Other Fees, Net
(a)
31,181
9,140
19,013
19,205
32,317
85,681
79,675
Management Fee Offsets
(b)
(8,591)
(7,286)
(6,312)
(2,385)
(6,838)
(28,609)
(22,821)
Total Management Fees, Net
162,634
140,200
149,701
153,541
178,594
608,394
622,036
Performance Fees
Realized Carried Interest
91,113
68,773
143,481
93,878
180,641
165,114
486,773
Realized Incentive Fees
13,012
3,092
31,102
3,737
7,931
25,656
45,862
Unrealized Carried Interest
110,059
280,076
259,972
340,406
771,246
683,764
1,651,700
Unrealized Incentive Fees
(12,657)
2,400
(32,279)
2,481
(1,355)
(119)
(28,753)
Total Performance Fees
201,527
354,341
402,276
440,502
958,463
874,415
2,155,582
Investment Income
Realized
18,099
9,534
18,577
928
23,320
45,302
52,359
Unrealized
16,343
60,303
30,636
57,656
201,606
90,875
350,201
Total Investment Income
34,442
69,837
49,213
58,584
224,926
136,177
402,560
Interest Income and Dividend Revenue
5,038
4,298
4,396
6,060
6,809
14,448
21,563
Other
252
(133)
(274)
2,113
1,678
894
3,384
Total Revenues
403,893
568,543
605,312
660,800
1,370,470
1,634,328
3,205,125
Expenses
Compensation
54,201
69,459
73,792
75,346
75,625
271,122
294,222
Performance Fee Compensation
Realized Carried Interest
35,118
25,863
55,005
38,942
29,027
62,418
148,837
Realized Incentive Fees
6,617
1,724
15,733
1,919
4,502
13,060
23,878
Unrealized Carried Interest
31,590
89,057
78,604
99,323
299,853
165,482
566,837
Unrealized Incentive Fees
(6,598)
1,034
(16,329)
615
(335)
(583)
(15,015)
Total Compensation and Benefits
120,928
187,137
206,805
216,145
408,672
511,499
1,018,759
Other Operating Expenses
36,946
28,462
27,617
30,614
29,698
123,714
116,391
Total Expenses
157,874
215,599
234,422
246,759
438,370
635,213
1,135,150
Economic Income
246,019
$
352,944
$
370,890
$
414,041
$
932,100
$
999,115
$
2,069,975
$
Total Assets Under Management
56,695,645
$
59,475,215
$
63,919,906
$
68,964,455
$
79,410,788
$
56,695,645
$
79,410,788
$
Fee-Earning Assets Under Management
41,931,339
$
42,140,507
$
43,635,493
$
44,715,985
$
50,792,803
$
41,931,339
$
50,792,803
$
Weighted Average Fee-Earning AUM
40,164,238
$
41,682,661
$
42,523,604
$
44,163,396
$
50,568,609
$
37,730,563
$
45,326,937
$
LP Capital Invested
3,876,701
$
1,175,775
$
2,213,668
$
2,365,224
$
3,986,610
$
8,218,175
$
9,741,277
$
Total Capital Invested
3,990,620
$
1,202,736
$
2,274,853
$
2,438,725
$
4,333,419
$
8,515,483
$
10,249,733
$ |
 Blackstone
23
Hedge Fund Solutions
(a)
Transaction and Other Fees, Net, are net of amounts, if any, shared with limited
partners. (b)
Primarily placement fees.
(Dollars in Thousands)
4Q'12
1Q'13
2Q'13
3Q'13
4Q'13
FY'12
FY'13
Revenues
Management Fees, Net
Base Management Fees
92,777
$
92,791
$
100,113
$
103,392
$
113,025
$
346,210
$
409,321
$
Transaction and Other Fees, Net
(a)
27
4
61
295
263
188
623
Management Fee Offsets
(b)
(322)
(324)
(714)
(1,200)
(1,149)
(1,414)
(3,387)
Total Management Fees, Net
92,482
92,471
99,460
102,487
112,139
344,984
406,557
Performance Fees
Realized Incentive Fees
76,323
13,709
13,845
5,320
174,861
83,433
207,735
Unrealized Incentive Fees
(39,799)
55,501
20,989
29,208
(97,980)
9,042
7,718
Total Performance Fees
36,524
69,210
34,834
34,528
76,881
92,475
215,453
Investment Income (Loss)
Realized
5,201
852
13,668
(598)
13,691
7,270
27,613
Unrealized
(1,417)
3,913
(12,054)
6,439
(7,604)
8,517
(9,306)
Total Investment Income
3,784
4,765
1,614
5,841
6,087
15,787
18,307
Interest Income and Dividend Revenue
718
1,216
1,878
2,523
1,988
2,139
7,605
Other
3,601
85
(254)
595
262
3,816
688
Total Revenues
137,109
167,747
137,532
145,974
197,357
459,201
648,610
Expenses
Compensation
28,113
33,868
36,844
37,611
28,147
119,731
136,470
Performance Fee Compensation
Realized Incentive Fees
20,985
5,022
5,116
1,954
53,701
23,080
65,793
Unrealized Incentive Fees
(11,219)
19,836
7,666
10,177
(34,823)
1,317
2,856
Total Compensation and Benefits
37,879
58,726
49,626
49,742
47,025
144,128
205,119
Other Operating Expenses
16,491
15,159
16,535
19,575
15,697
57,809
66,966
Total Expenses
54,370
73,885
66,161
69,317
62,722
201,937
272,085
Economic Income
82,739
$
93,862
$
71,371
$
76,657
$
134,635
$
257,264
$
376,525
$
Total Assets Under Management
46,092,505
$
48,187,865
$
50,128,028
$
53,162,174
$
55,657,463
$
46,092,505
$
55,657,463
$
Fee-Earning Assets Under Management
43,478,791
$
45,585,454
$
47,572,465
$
50,829,734
$
52,865,837
$
43,478,791
$
52,865,837
$
Weighted Average Fee-Earning AUM
43,709,019
$
44,999,899
$
46,783,727
$
48,933,335
$
51,794,518
$
41,698,402
$
48,431,911
$
LP Capital Invested
-
$
55,849
$
118,323
$
248,422
$
8,681
$
200,841
$
431,275
$
Total Capital Invested
-
$
59,000
$
125,000
$
262,309
$
8,681
$
212,752
$
454,990
$ |
 Blackstone
24
Credit
(a)
Transaction and Other Fees, Net, are net of amounts, if any, shared with limited
partners. (b)
Primarily placement fees.
(Dollars in Thousands)
4Q'12
1Q'13
2Q'13
3Q'13
4Q'13
FY'12
FY'13
Revenues
Management Fees, Net
Base Management Fees
94,450
$
91,364
$
101,940
$
101,900
$
102,954
$
345,277
$
398,158
$
Transaction and Other Fees, Net
(a)
21,480
4,374
9,002
7,058
8,152
40,875
28,586
Management Fee Offsets
(b)
(1,858)
(1,572)
(1,559)
(2,606)
(34,592)
(5,004)
(40,329)
Total Management Fees, Net
114,072
94,166
109,383
106,352
76,514
381,148
386,415
Performance Fees
Realized Carried Interest
37,564
85,505
35,908
3,655
2,124
52,511
127,192
Realized Incentive Fees
183,538
7,926
29,920
22,181
160,709
192,375
220,736
Unrealized Carried Interest
24,103
(18,775)
13,808
35,946
77,099
162,045
108,078
Unrealized Incentive Fees
(132,051)
49,854
15,648
9,303
(73,698)
(38,234)
1,107
Total Performance Fees
113,154
124,510
95,284
71,085
166,234
368,697
457,113
Investment Income (Loss)
Realized
2,593
3,328
901
496
(627)
15,611
4,098
Unrealized
5,450
1,093
4,381
(1,042)
9,519
4,769
13,951
Total Investment Income (Loss)
8,043
4,421
5,282
(546)
8,892
20,380
18,049
Interest Income and Dividend Revenue
2,480
4,547
4,071
5,288
4,240
9,330
18,146
Other
529
1,828
(1,063)
(357)
119
(1,174)
527
Total Revenues
238,278
229,472
212,957
181,822
255,999
778,381
880,250
Expenses
Compensation
51,853
45,521
55,941
53,250
31,802
182,077
186,514
Performance Fee Compensation
Realized Carried Interest
21,948
47,328
20,028
1,603
452
30,336
69,411
Realized Incentive Fees
98,156
3,762
14,165
10,726
82,591
103,902
111,244
Unrealized Carried Interest
15,150
(10,204)
6,109
19,216
42,026
97,562
57,147
Unrealized Incentive Fees
(74,148)
23,608
11,747
292
(35,139)
(45,262)
508
Total Compensation and Benefits
112,959
110,015
107,990
85,087
121,732
368,615
424,824
Other Operating Expenses
18,116
20,962
22,961
23,451
29,566
84,488
96,940
Total Expenses
131,075
130,977
130,951
108,538
151,298
453,103
521,764
Economic Income
107,203
$
98,495
$
82,006
$
73,284
$
104,701
$
325,278
$
358,486
$
Total Assets Under Management
56,428,837
$
58,055,781
$
62,236,513
$
63,318,446
$
65,014,348
$
56,428,837
$
65,014,348
$
Fee-Earning Assets Under Management
45,420,143
$
46,437,616
$
48,495,765
$
49,458,992
$
51,722,584
$
45,420,143
$
51,722,584
$
Weighted Average Fee-Earning AUM
45,947,499
$
45,960,690
$
47,723,711
$
48,645,182
$
50,655,628
$
42,574,690
$
48,397,611
$
LP Capital Invested
351,786
$
275,852
$
553,123
$
240,101
$
369,494
$
2,256,420
$
1,438,570
$
Total Capital Invested
349,397
$
287,727
$
577,399
$
287,158
$
443,150
$
2,808,993
$
1,595,434
$ |
 Blackstone
25
Financial Advisory
(Dollars in Thousands)
4Q'12
1Q'13
2Q'13
3Q'13
4Q'13
FY'12
FY'13
Revenues
Advisory Fees
128,248
$
67,020
$
120,734
$
83,602
$
139,158
$
357,417
$
410,514
$
Transaction and Other Fees, Net
42
3
40
196
866
295
1,105
Total Advisory and Transaction Fees
128,290
67,023
120,774
83,798
140,024
357,712
411,619
Investment Income (Loss)
Realized
637
234
(146)
(829)
(884)
1,392
(1,625)
Unrealized
(92)
(359)
(1,518)
1,006
1,610
1,348
739
Total Investment Income (Loss)
545
(125)
(1,664)
177
726
2,740
(886)
Interest Income and Dividend Revenue
2,045
1,616
1,746
2,437
2,221
7,157
8,020
Other
(95)
(61)
61
836
614
(804)
1,450
Total Revenues
130,785
68,453
120,917
87,248
143,585
366,805
420,203
Expenses
Compensation
59,429
57,926
76,153
57,491
70,744
235,137
262,314
Total Compensation and Benefits
59,429
57,926
76,153
57,491
70,744
235,137
262,314
Other Operating Expenses
19,378
20,693
20,861
19,208
21,443
84,589
82,205
Total Expenses
78,807
78,619
97,014
76,699
92,187
319,726
344,519
Economic Income (Loss)
51,978
$
(10,166)
$
23,903
$
10,549
$
51,398
$
47,079
$
75,684
$ |
 Blackstone
26
Net
Accrued
Performance
Fees
and
Carried
Interest
Status
(a)
(a)
Preliminary. Totals may not add due to rounding.
(b)
Net Accrued Performance Fees are presented net of performance fee compensation and do not
include clawback amounts, if any, which are disclosed in the 10-K/Q. Net Realized Performance Fees are included in Distributable
Earnings. When these
fees are received, the receivable is reduced without further impacting Distributable
Earnings. (c)
Per Unit calculations are based on quarter end Distributable Earnings Units Outstanding (see
Appendix – Unit Rollforward (see page 32)).
(d)
Represents the required increase in equity at the fund level (excluding side-by-side
investments) for funds with expired investment periods that are currently not generating
performance fees. Blackstone
had
$3.4
billion
of
accrued
performance
fees,
net
of
performance
fee
compensation
and
distributed
Realized Performance Fees, at the end of 2013.
$3.4 billion
Net Accrued Performance Fees at 4Q’13
$3.00 per unit
(c)
Net Accrued Performance Fees at 4Q’13
52% increase
in Net Accrued Performance Fees since 4Q’12
Carried Interest Status (excl. SBS)
(d)
Net Accrued Performance Fees
(b)
Remaining Capital
Gain to Cross Carry Threshold
Change vs.
% Change in
% Change in
(Dollars in Millions, Except per Unit Data)
3Q'13
4Q'13
Per Unit
(c)
3Q'13
(Dollars / Euros In Millions)
Fair
Value
Cost
Amount
TEV
Equity Value
Private Equity
Private Equity
BCP IV Carried Interest
506
$
424
$
0.37
$
(82)
$
BCP V
17,968
$
12,277
$
1,596
$
4%
9%
BCP V Carried Interest
-
26
0.02
26
BCP V-AC
2,203
1,264
(344)
(9)%
(16)%
BCP VI Carried Interest
15
108
0.10
93
BEP Carried Interest
62
65
0.06
3
Real Estate
Tactical Opportunities Carried Interest
5
8
0.01
3
BREP Int'l II
1,347
€
1,127
€
880
€
20%
65%
SP V Carried Interest
1
1
0.00
-
Total Private Equity
589
632
0.56
43
Real Estate
BREP V Carried Interest
616
603
0.53
(13)
BREP VI Carried Interest
857
1,264
1.11
407
BREP VII Carried Interest
248
293
0.26
45
BREP Int'l I Carried Interest
2
2
0.00
-
BREP Europe III Carried Interest
128
155
0.14
27
BREP Asia Carried Interest
-
4
0.00
4
BREDS Carried Interest
21
12
0.01
(9)
BREDS Incentive Fees
2
4
0.00
2
Asia Platform Incentive Fees
16
10
0.01
(6)
Total Real Estate
1,890
2,347
2.07
457
Hedge Fund Solutions
Incentive Fees
75
144
0.13
69
Total Hedge Fund Solutions
75
144
0.13
69
Credit
Carried Interest
143
173
0.15
30
Incentive Fees
72
104
0.09
32
Total Credit
215
277
0.24
62
Total Blackstone
Carried Interest
2,604
3,138
2.76
534
Incentive Fees
165
262
0.23
97
Net Accrued Performance Fees
2,769
$
3,400
$
3.00
$
631
$
Memo: Net Realized Performance Fees
64
$
261
$
0.23
$
197
$
|
 Blackstone
27
Investment Records as of December 31, 2013
(a)
Notes on next page.
Committed
Available
Unrealized Investments
Realized Investments
Total Investments
Net IRRs (d)
(Dollars in Thousands, Except Where Noted)
Capital
Capital (b)
Value
MOIC (c)
% Public
Value
MOIC (c)
Value
MOIC (c)
Realized
Total
Private Equity
BCP I (Oct 1987 / Oct 1993)
859,081
$
-
$
-
$
n/a
-
1,741,738
$
2.6x
1,741,738
$
2.6x
19%
19%
BCP II (Oct 1993 / Aug 1997)
1,361,100
-
-
n/a
-
3,256,819
2.5x
3,256,819
2.5x
32%
32%
BCP III (Aug 1997 / Nov 2002)
3,967,422
-
-
n/a
-
9,184,688
2.3x
9,184,688
2.3x
14%
14%
BCOM (Jun 2000 / Jun 2006)
2,137,330
199,298
225,356
1.1x
-
2,619,040
1.4x
2,844,396
1.3x
7%
5%
BCP IV (Nov 2002 / Dec 2005)
6,773,138
234,535
4,122,422
2.1x
66%
17,167,004
3.1x
21,289,426
2.8x
46%
37%
BCP V (Dec 2005 / Jan 2011)
21,024,025
1,459,100
21,730,495
1.6x
46%
7,982,798
1.3x
29,713,293
1.5x
5%
7%
BCP VI (Jan 2011 / Jan 2017)
15,176,699
10,440,379
5,149,585
1.3x
25%
467,034
1.5x
5,616,619
1.4x
26%
11%
BEP (Aug 2011 / Aug 2017)
2,423,572
1,462,591
1,324,309
2.0x
59%
218,847
1.4x
1,543,156
1.9x
20%
55%
Total Corporate Private Equity
53,722,367
$
13,795,903
$
32,552,167
$
1.6x
45%
42,637,968
$
2.1x
75,190,135
$
1.8x
20%
16%
Tactical Opportunities
4,906,599
3,623,819
1,419,729
1.1x
8%
112,200
1.1x
1,531,929
1.1x
18%
14%
Strategic Partners
13,078,843
3,328,622
5,964,811
1.6x
n/a
9,280,114
1.3x
15,244,925
1.4x
n/a
14%
Other Funds and Co-Invest (e)
1,210,951
150,858
518,118
0.6x
50%
20,890
1.0x
539,008
0.6x
n/m
n/m
Total Private Equity
72,918,760
$
20,899,202
$
40,454,825
$
1.5x
42%
52,051,172
$
1.9x
92,505,997
$
1.7x
20%
15%
Real Estate
Dollar
Pre-BREP
140,714
$
-
$
-
$
n/a
-
345,190
$
2.5x
345,190
$
2.5x
33%
33%
BREP I (Sep 1994 / Oct 1996)
380,708
-
-
n/a
-
1,327,708
2.8x
1,327,708
2.8x
40%
40%
BREP II (Oct 1996 / Mar 1999)
1,198,339
-
-
n/a
-
2,531,613
2.1x
2,531,613
2.1x
19%
19%
BREP III (Apr 1999 / Apr 2003)
1,522,708
-
2,161
0.1x
-
3,325,133
2.4x
3,327,294
2.4x
22%
21%
BREP IV (Apr 2003 / Dec 2005)
2,198,694
-
1,394,262
1.0x
-
3,091,303
2.4x
4,485,565
1.6x
66%
14%
BREP V (Dec 2005 / Feb 2007)
5,538,579
243,946
7,144,648
1.8x
-
3,496,273
2.0x
10,640,921
1.8x
29%
10%
BREP VI (Feb 2007 / Aug 2011)
11,057,280
656,849
18,726,900
2.1x
62%
3,562,643
2.1x
22,289,543
2.1x
24%
14%
BREP VII (Aug 2011 / Feb 2017)
14,512,884
5,771,958
10,775,482
1.4x
3%
1,467,953
1.6x
12,243,435
1.4x
43%
30%
Total Global Real Estate Funds
36,549,906
$
6,672,753
$
38,043,453
$
1.7x
31%
19,147,816
$
2.1x
57,191,269
$
1.8x
27%
17%
Euro
BREP Int'l (Jan 2001 / Sep 2005)
824,172
€
-
€
104,405
€
1.2x
-
1,235,480
€
2.2x
1,339,885
€
2.0x
25%
23%
BREP Int'l II (Sep 2005 / Jun 2008)
1,627,954
80,188
1,464,376
1.2x
45%
198,004
1.2x
1,662,380
1.2x
3%
2%
BREP Europe III (Jun 2008 / Dec 2013)
3,203,848
633,457
3,590,801
1.5x
-
491,882
1.8x
4,082,683
1.5x
26%
17%
BREP Europe IV (Sep 2013 / Mar 2019)
4,138,214
3,699,039
482,005
1.0x
-
-
n/a
482,005
1.0x
n/a
4%
Total Euro Real Estate Funds
9,794,188
€
4,412,684
€
5,641,587
€
1.3x
12%
1,925,366
€
1.9x
7,566,953
€
1.4x
24%
10%
BREP Co-Investment (f)
5,160,385
$
-
$
8,424,422
$
1.8x
69%
700,979
$
1.5x
9,125,401
$
1.8x
18%
17%
BREP Asia (Jun 2013 / Dec 2017)
3,247,727
2,695,256
669,067
1.1x
-
-
n/a
669,067
1.1x
n/a
56%
Total Real Estate
57,682,409
$
15,432,082
$
54,719,266
$
1.6x
34%
22,319,606
$
2.1x
77,038,872
$
1.8x
26%
16%
BREDS I
2,840,704
$
452,965
$
1,759,288
$
1.2x
-
2,346,502
$
1.3x
4,105,790
$
1.2x
15%
12%
BREDS II
3,334,676
2,247,733
1,132,398
1.0x
-
-
n/a
1,132,398
1.0x
n/a
11%
Total BREDS (g)
6,175,380
$
2,700,698
$
2,891,686
$
1.1x
-
2,346,502
$
1.3x
5,238,188
$
1.2x
15%
12%
Credit (h)
Mezzanine
6,120,000
$
3,047,070
$
3,061,806
$
1.3x
-
3,959,095
$
1.6x
7,020,901
$
1.5x
n/a
19%
Rescue Lending
8,378,143
5,313,337
4,249,064
1.5x
-
1,687,866
1.2x
5,936,930
1.4x
n/a
18%
Total Credit
14,498,143
$
8,360,407
$
7,310,870
$
1.4x
-
5,646,961
$
1.4x
12,957,831
$
1.4x |
 Blackstone
28
Investment
Records
as
of
December
31,
2013
–
Notes
The returns presented herein represent those of the applicable Blackstone Funds and not those of
The Blackstone Group L.P. n/m
Not meaningful.
n/a
Not applicable.
(a)
Preliminary.
(b)
Available Capital represents total investable capital commitments, including
side-by-side, adjusted for certain expenses and expired or recallable capital,
less invested capital. This amount is not reduced by outstanding commitments to investments.
(c)
Multiple of Invested Capital (“MOIC”) represents carrying value, before management
fees, expenses and Carried Interest, divided by invested capital.
(d)
Net Internal Rate of Return (“IRR”) represents the annualized inception to December
31, 2013 IRR on total invested capital based on realized proceeds and unrealized value,
as applicable, after management fees, expenses and Carried Interest. Net IRRs for BREP
Europe IV, BREP Asia and BREDS II are calculated from commencement of their respective investment periods
which, being less than one year, are not annualized.
(e)
Returns for Other Funds and Co-Invest are not meaningful as these funds have no or little
realizations. (f)
BREP Co-Investment represents co-investment capital raised for various BREP
investments. The Net IRR reflected is calculated by aggregating each
co-investment’s realized proceeds and unrealized value, as applicable, after management fees, expenses
and Carried Interest.
(g)
Excludes Capital Trust drawdown funds.
(h)
The Total Investments MOIC for Mezzanine and Rescue Lending Funds, excluding recycled capital
during the investment period, was 1.9x and 1.5x, respectively.
|
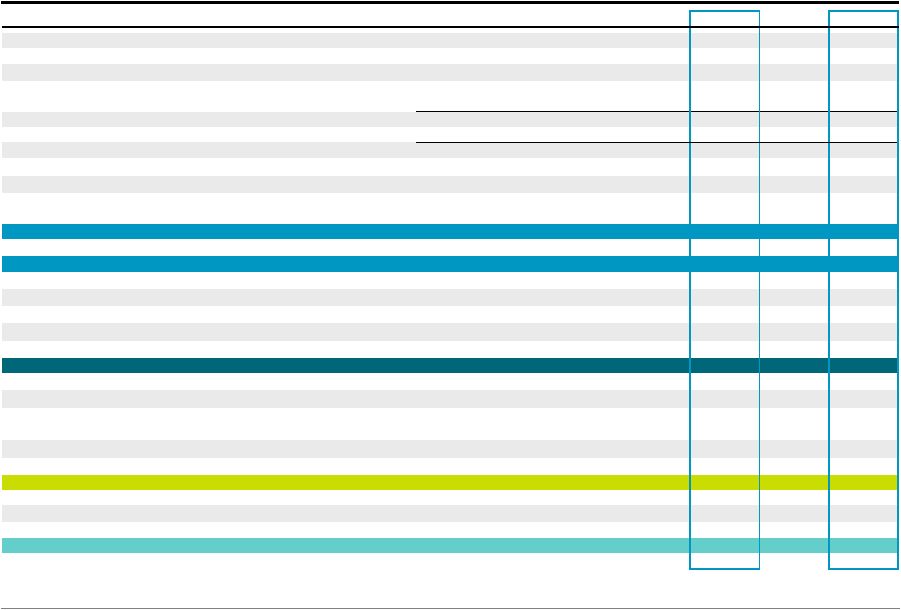 Blackstone
29
Reconciliation of GAAP to Non-GAAP Measures
Notes on next page.
(Dollars in Thousands)
Net Income Attributable to The Blackstone Group L.P.
Net Income Attributable to Non-Controlling Interests in Blackstone Holdings
Net Income (Loss) Attributable to Non-Controlling Interests in Consolidated Entities
Net Income Attributable to Redeemable Non-Controlling
Interests in Consolidated Entities
Net Income
Provision for Taxes
Income Before Provision for Taxes
IPO
and
Acquisition-Related
Charges
(a)
Amortization
of
Intangibles
(b)
(Income)
Loss
Associated
with
Non-Controlling
Interests
in
(Income)
Loss
of
Economic Income
Taxes
(d)
Economic Net Income
Taxes
(d)
Performance
Fee
Adjustment
(e)
Investment
Income
(Loss)
Adjustment
(f)
Performance
Fee
Compensation
and
Benefits
Adjustment
(h)
Fee Related Earnings
Realized
Performance
Fees
(i)
Realized
Investment
Income
(j)
Adjustment
Related
to
Realized
Investment
Income
(Loss) -
Blackstone's
Treasury
Cash
Management
Strategies
(k)
Taxes
and
Related
Payables
Including
Payable
Under
Tax
Receivable
Agreement
(l)
Equity-Based
Compensation
(m)
Distributable Earnings
Interest Expense
Taxes
and
Related
Payables
Including
Payable
Under
Tax
Receivable
Agreement
(l)
Depreciation and Amortization
Adjusted EBITDA
4Q'12
1Q'13
2Q'13
3Q'13
4Q'13
FY'12
FY'13
106,413
$
167,635
$
211,148
$
171,164
$
621,255
$
218,598
$
1,171,202
$
169,918
207,090
249,134
208,332
675,289
407,727
1,339,845
(180,011)
(9,452)
27,944
30,231
149,834
99,959
198,557
25,151
62,316
22,366
51,188
47,445
103,598
183,315
121,471
$
427,589
$
510,592
$
460,915
$
1,493,823
$
829,882
$
2,892,919
$
65,696
50,993
56,082
57,477
91,090
185,023
255,642
187,167
$
478,582
$
566,674
$
518,392
$
1,584,913
$
1,014,905
$
3,148,561
$
317,499
186,962
178,706
190,525
166,514
1,079,511
722,707
26,487
25,657
24,322
27,525
29,139
150,148
106,643
154,860
(52,864)
(50,310)
(81,419)
(197,279)
(203,557)
(381,872)
686,013
$
638,337
$
719,392
$
655,023
$
1,583,287
$
2,041,007
$
3,596,039
$
(16,032)
(10,031)
(16,152)
(14,792)
(41,189)
(45,708)
(82,164)
669,981
$
628,306
$
703,240
$
640,231
$
1,542,098
$
1,995,299
$
3,513,875
$
16,032
10,031
16,152
14,792
41,189
45,708
82,164
(470,173)
(603,999)
(719,219)
(544,936)
(1,688,219)
(1,593,765)
(3,556,373)
(111,670)
(134,771)
(97,119)
(99,172)
(356,743)
(286,244)
(687,805)
4,690
(1,729)
(21,452)
(712)
4,319
25,769
(19,574)
163,744
239,895
286,832
168,393
718,062
513,546
1,413,182
272,604
$
137,733
$
168,434
$
178,596
$
260,706
$
700,313
$
745,469
$
262,710
218,952
147,231
138,924
455,068
392,411
960,175
37,448
38,110
54,586
11,492
66,283
95,398
170,471
(6,444)
(3,820)
1,469
6,672
8,873
(21,872)
13,194
(72,553)
(12,148)
(44,220)
(31,756)
(68,610)
(132,325)
(156,734)
68,572
12,085
10,985
8,745
98,309
90,040
130,124
562,337
$
390,912
$
338,485
$
312,673
$
820,629
$
1,123,965
$
1,862,699
$
24,585
26,069
25,960
25,268
26,607
69,152
103,904
72,553
12,148
44,220
31,756
68,610
132,325
156,734
12,681
8,643
9,116
8,956
8,726
42,235
35,441
672,156
$
437,772
$
417,781
$
378,653
$
924,572
$
1,367,677
$
2,158,778
$
Consolidated
Entities
(c)
Investment
Income
(Loss)
-
Blackstone’s
Treasury
Cash
Management
Strategies
(g) |
 Blackstone
30
Reconciliation
of
GAAP
to
Non-GAAP
Measures
–
Notes
Note:
See Appendix –
Definitions and Distribution Policy (see page 33).
(a)
This adjustment adds back to Income (Loss) Before Provision (Benefit) for Taxes amounts for
Transaction-Related Charges which include principally equity-based compensation
charges associated with Blackstone’s initial public offering and long-term retention
programs outside of annual deferred compensation and other corporate actions.
(b)
This adjustment adds back to Income (Loss) Before Provision (Benefit) for Taxes amounts for
the Amortization of Intangibles which are associated with Blackstone’s initial
public offering and other corporate actions. (c)
This adjustment adds back to Income (Loss) Before Provision (Benefit) for Taxes the amount of
(Income) Loss Associated with Non- Controlling Interests in (Income) Loss of
Consolidated Entities and includes the amount of Management Fee Revenues associated
with Consolidated CLO Entities.
(d)
Taxes represent the current tax provision (benefit) calculated on Income (Loss) Before
Provision (Benefit) for Taxes. (e)
This adjustment removes from EI the total segment amount of Performance Fees.
(f)
This adjustment removes from EI the total segment amount of Investment Income (Loss).
(g)
This adjustment represents the realized and unrealized gain on Blackstone’s Treasury Cash
Management Strategies which are a component of Investment Income (Loss) but included in
Fee Related Earnings. (h)
This adjustment removes from expenses the compensation and benefit amounts related to
Blackstone’s profit sharing plans related to Performance Fees.
(i)
Represents the adjustment for realized Performance Fees net of corresponding actual amounts
due under Blackstone’s profit sharing plans related thereto.
(j)
Represents the adjustment for Blackstone’s Investment Income (Loss) -
Realized.
(k)
Represents the elimination of Realized Investment Income attributable to Blackstone’s
Treasury Cash Management Strategies which is a component of both Fee Related Earnings
and Realized Investment Income (Loss). (l)
Taxes and Related Payables Including Payable Under Tax Receivable Agreement represent the
current tax provision (benefit) calculated on Income (Loss) Before Provision (Benefit)
for Taxes and the Payable Under Tax Receivable Agreement.
(m)
Represents equity-based award expense included in EI. |
 Blackstone
31
Walkdown of Financial Metrics –
Calculation of Certain Non-GAAP Financial Metric Components
Unless otherwise noted, all amounts are the respective captions from the Total Segment
information. (a)
See Appendix -
Reconciliation of GAAP to Non-GAAP Measures for this adjustment (see pages
29-30). (b)
Represents equity-based award expense included in Economic Income.
(c)
Represents tax-related payables including the Payable Under Tax Receivable
Agreement. (Dollars in Thousands)
4Q'13
FY'13
Interest Income and Dividend Revenue
19,394
$
70,936
$
Other Revenue
4,621
10,308
Investment
Income
(Loss)
-
Blackstone's
Treasury
Cash
Management
Strategies
(a)
4,319
(19,574)
Interest Income and Other Revenue
28,334
$
61,670
$
Realized Incentive Fees
343,501
474,333
Less: Realized Incentive Fee Compensation
(140,794)
(200,915)
Net Realized Incentive Fees
202,707
$
273,418
$
Realized Carried Interest
283,846
943,958
Less: Realized Carried Interest Compensation
(31,485)
(257,201)
Net Realized Carried Interest
252,361
$
686,757
$
Realized Investment Income
66,283
170,471
Adjustment
Related
to
Realized
Investment
Income
(Loss)
-
Blackstone's
Treasury
Cash
Management
Strategies
(a)
8,873
13,194
Net Realized Investment Income
75,156
$
183,665
$
Equity-Based Compensation
(b)
98,309
$
130,124
$
Unrealized Incentive Fees
(173,033)
(19,928)
Less: Unrealized Incentive Fee Compensation
70,297
11,651
Net Unrealized Incentive Fees
(102,736)
$
(8,277)
$
Unrealized Carried Interest
1,233,905
2,158,010
Less: Unrealized Carried Interest Compensation
(616,080)
(966,717)
Net Unrealized Carried Interest
617,825
$
1,191,293
$
Unrealized Investment Income
290,460
517,334
Less:
Investment
Income
(Loss)
-
Blackstone's
Treasury
Cash
Management
Strategies
(a)
(4,319)
19,574
Less:
Adjustment
Related
to
Realized
Investment
Income
(Loss)
-
Blackstone's
Treasury
Cash
Management
Strategies
(a)
(8,873)
(13,194)
Net Unrealized Investment Income
277,268
$
523,714
$
Related Payables
(c)
27,421
$
74,570
$ |
 Blackstone
32
Unit Rollforward
(a)
Common
Unitholders
receive
Tax
Benefits
from
deductions
taken
by
Blackstone’s
corporate
tax
paying
subsidiaries
and
bear
responsibility
for
the
deduction
from
Distributable
Earnings
of
thePayable
Under
Tax
Receivable
Agreement
and
certain
other
tax-related
payables.
(b)
Excludes units which are not entitled to distributions.
4Q'12
1Q'13
2Q'13
3Q'13
4Q'13
FY'12
FY'13
Total GAAP Weighted-Average Common Units Outstanding -
Basic
553,989,577
582,322,183
583,843,094
589,643,844
592,129,570
533,703,606
587,018,828
Adjustments:
Weighted-Average Unvested Deferred Restricted Common Units
2,430,014
3,377,716
2,919,959
3,276,951
4,536,624
4,965,464
3,527,812
Total GAAP Weighted-Average Common Units Outstanding -
Diluted
556,419,591
585,699,899
586,763,053
592,920,795
596,666,194
538,669,070
590,546,640
Adjustments:
Weighted-Average Blackstone Holdings Partnership Units
581,202,276
557,463,170
555,224,714
551,916,623
549,773,866
590,446,577
553,579,525
Weighted-Average Economic Net Income Adjusted Units
1,137,621,867
1,143,163,069
1,141,987,767
1,144,837,418
1,146,440,060
1,129,115,647
1,144,126,165
Economic Net Income Adjusted Units, End of Period
1,143,019,281
1,143,893,134
1,142,576,555
1,145,675,305
1,150,867,868
1,143,019,281
1,150,867,868
Total Common Units Outstanding
(a)
568,600,922
573,275,746
576,466,264
584,860,157
588,165,949
568,600,922
588,165,949
Adjustments:
Blackstone Holdings Partnership Units
553,614,040
554,603,708
550,902,208
550,274,903
547,021,277
553,614,040
547,021,277
Distributable Earnings Units Outstanding
(b)
1,122,214,962
1,127,879,454
1,127,368,472
1,135,135,060
1,135,187,226
1,122,214,962
1,135,187,226 |
 Blackstone
33
Definitions and Distribution Policy
Blackstone
discloses
the
following
financial
measures
that
are
calculated
and
presented
on
the
basis
of
methodologies
other
than
in
accordance
with
generally
accepted accounting principles in the United States of America (“non-GAAP”) in
this presentation: •
Blackstone uses Economic Income, or “EI”, as a key measure of value creation, a
benchmark of its performance and in making resource deployment and compensation
decisions across its five segments. EI represents segment net income before taxes excluding transaction-related charges. Transaction-related charges
arise from Blackstone’s initial public offering (“IPO”) and long-term
retention programs outside of annual deferred compensation and other corporate actions,
including acquisitions. Transaction-related charges include equity-based compensation
charges, the amortization of intangible assets and contingent consideration associated
with acquisitions. EI presents revenues and expenses on a basis that deconsolidates the investment funds Blackstone manages.
•
Economic Net Income, or “ENI”, represents EI adjusted to include current period
taxes. Taxes represent the current tax provision (benefit) calculated on Income (Loss)
Before Provision for Taxes. •
Blackstone uses Fee Related Earnings, or “FRE”, as a key measure to highlight
earnings from operations excluding: (a) the income related to performance fees and
related carry plan costs, (b) income earned from Blackstone’s investments in the
Blackstone Funds, and (c) realized and unrealized gains (losses) from other investments
except for such gains (losses) from Blackstone’s Treasury cash management strategies. Blackstone uses FRE as a measure to assess whether recurring
revenue from its businesses is sufficient to adequately cover all of its operating expenses
and generate profits. FRE equals contractual fee revenues, investment income from
Blackstone’s Treasury cash management strategies and interest income, less (a) compensation expenses (which includes amortization of non-IPO and
non-acquisition-related equity-based awards, but excludes amortization of IPO and
acquisition-related equity-based awards, carried interest and incentive fee
compensation), and (b) other operating expenses.
•
Distributable Earnings, or “DE”, which is derived from Blackstone’s segment
reported results, is a supplemental measure to assess performance and amounts
available
for
distributions
to
Blackstone
unitholders,
including
Blackstone
personnel
and
others
who
are
limited
partners
of
the
Blackstone
Holdings
partnerships.
DE
is intended to show the amount of net realized earnings without the effects of the
consolidation of the Blackstone Funds. DE, which is a component of ENI, is the sum
across all segments of: (a) Total Management and Advisory Fees, (b) Interest and Dividend Revenue, (c)
Other Revenue, (d) Realized Performance Fees, and
(e)
Realized Investment Income (Loss); less (a) Compensation, excluding the expense of
equity-based awards, (b) Realized Performance Fee Compensation, (c) Other
Operating
Expenses,
and
(d)
Taxes
and
Related
Payables
Including
the
Payable
Under
Tax
Receivable
Agreement.
DE
is
reconciled
to
Blackstone’s
Consolidated
Statement of Operations.
•
Blackstone uses Adjusted Earnings Before Interest, Taxes and Depreciation and Amortization, or
“Adjusted EBITDA”, as a measure of segment performance and an indicator of
its ability to cover recurring operating expenses. Adjusted EBITDA equals DE before segment interest expense, segment depreciation and amortization,
and the taxes and related payables including the Payable Under Tax Receivable Agreement.
•
Net Cash Available for Distribution to Common Unitholders is The
Blackstone Group L.P.’s share of Distributable Earnings, less realized investment gains
and returns of capital from investments and acquisitions, in excess of amounts
determined by Blackstone’s general partner to be necessary or appropriate to provide for the
conduct of its business, to make appropriate investments in its business and funds, to comply
with applicable law, any of its debt instruments or other agreements, or to provide for
future cash requirements such as tax-related payments, clawback obligations and distributions to unitholders for any ensuing quarter.
Distribution Policy. Blackstone’s intention is to distribute to common unitholders each
quarter substantially all of its Net Cash Available for Distribution to Common
Unitholders, subject to a minimum base quarterly distribution of
$0.12 per unit. In circumstances in which the Net Cash Available for Distribution to Common
Unitholders for a quarter falls short of the amount necessary to
support such per unit distribution, Blackstone intends to correspondingly reduce subsequent
quarterly distributions below the amounts supported by the Net Cash Available for
Distribution to Common Unitholders by the amount of the shortfall, but not below $0.12 per
unit.
All
of
the
foregoing
is
subject
to
the
qualification
that
the
declaration
and
payment
of
any
distributions
are
at
the
sole
discretion
of
Blackstone’s
general
partner
and
may
change
at
any
time,
including,
without
limitation,
to
reduce
the
quarterly
distribution
payable
to
common
unitholders
to
less
than
$0.12
per
unit
or
even
to
eliminate such distributions entirely. |
 Blackstone
34
Forward-Looking Statements
This presentation may contain forward-looking statements within the meaning of Section 27A
of the Securities Act of 1933 and Section 21E of the Securities Exchange Act of 1934
which reflect Blackstone’s current views with respect to, among other things,
Blackstone’s operations and financial performance. You can identify these
forward-looking statements by the use of words such as “outlook,”
“believes,”
“expects,”
“potential,”
“continues,”
“may,”
“will,”
“should,”
“seeks,”
“approximately,”
“predicts,”
“intends,”
“plans,”
“estimates,”
“anticipates”
or the negative version of these words or other comparable words. Such forward-looking
statements are subject to various risks and uncertainties. Accordingly, there are or
will be important factors that could cause actual outcomes or results to differ
materially from those indicated in these statements. Blackstone believes these factors
include but are
not limited to those described under the section entitled “Risk Factors”
in its Annual Report on Form 10-K for the fiscal year ended
December 31, 2012, as such factors may be updated from time to time in its periodic filings
with the Securities and Exchange Commission, which are accessible on the SEC’s
website at www.sec.gov. These factors should not be construed as exhaustive and should
be read in conjunction with the other cautionary statements that are included in this presentation and in the filings.
Blackstone undertakes no obligation to publicly update or review
any forward-looking statement, whether as a result of new
information, future developments or otherwise.
This presentation does not constitute an offer of any Blackstone
Fund. |