Attached files
| file | filename |
|---|---|
| 8-K - FORM 8-K - Ancestry.com LLC | d663427d8k.htm |
| EX-99.1 - EX-99.1 - Ancestry.com LLC | d663427dex991.htm |
| EX-99.3 - EX-99.3 - Ancestry.com LLC | d663427dex993.htm |
| EX-99.4 - EX-99.4 - Ancestry.com LLC | d663427dex994.htm |
Exhibit 99.2
This summary provides a brief overview of certain information appearing elsewhere in this offering memorandum or that is incorporated by reference herein. Because it is abbreviated, this summary does not contain all of the information that you should consider before making an investment in the notes. We encourage you to read the entire offering memorandum and the information incorporated by reference carefully, including the “Risk Factors” section and the consolidated financial statements and the notes to those financial statements. We provide definitions of certain terms used in this offering memorandum under “Basis of Presentation” above.
OUR COMPANY
Ancestry.com is the world’s largest online family history resource, with approximately 2.1 million paying subscribers around the world to Ancestry.com branded websites as of September 30, 2013. Total subscribers across all websites, including Ancestry.com branded websites, Archives.com, Fold3.com and Newspapers.com, were approximately 2.7 million as of September 30, 2013. We are a pioneer and the leader in the online family history research market. We believe that most people have a fundamental desire to understand who they are and from where they came. Our mission is to help everyone discover, preserve and share their family history. We strive to make our services valuable to individuals ranging from the most committed family historians to those taking their first steps towards satisfying their curiosity about their family stories.
The foundation of our service is an extensive collection of over 12 billion historical records that we have digitized, indexed and added to our websites over the past 18 years. We have developed and acquired efficient and proprietary systems for digitizing handwritten historical documents, and we have established relationships with national, state and local government archives, historical societies, religious institutions and private collectors of historical content around the world. Our subscribers use our web-based platform, proprietary technology and content collection to research their family histories, build their family trees, collaborate with other subscribers, upload their own records and publish and share their stories. Ancestry.com users have uploaded over 192 million items, such as photographs, scanned documents and written stories. This growing pool of user-generated content adds color and context to the family histories assembled from the institutional content available through our web-based services.
We operate websites accessible worldwide, including dedicated sites in the United States, the United Kingdom, Australia, Canada and Sweden. We charge each subscriber for their subscription at the commencement of their subscription period and at each renewal date. Subscriptions automatically renew into the existing package and duration selected, unless canceled. As of September 30, 2013, approximately 66% of our subscribers had subscription durations of six months or greater.
As a company, we strive to deliver family history discoveries to subscribers through our extensive content collection. Increasingly, subscriber discoveries are driven by our proprietary technology that provides “hints” of possible record matches to our subscribers. In 2012, over 1.3 billion hints were accepted by our subscribers compared to the approximately 700 million hints accepted in 2011. The increase in hints accepted is a product of subscriber growth, new content, enhanced hinting technologies and changes to how hints are served to subscribers. We also continue to deploy tools and technologies to provide our registered users with an expanding family history collaborative network. Users can invite family and friends to help build their family trees, add personal memories and upload photographs and stories of their own. As of September 30, 2013, our users had created more than 54 million family trees containing over 5 billion profiles. Trees that are shared with others offer many subscribers a substantial head start in their family history research by allowing them to review information collected by users with common ancestry.
We believe we provide ongoing value to our subscribers by regularly adding new historical content and enhancing our web-based service and platforms with new tools, features and services that enable greater collaboration among our users through the growth of our global community.
1
INDUSTRY OVERVIEW
Societies around the world have historically documented the names, dates and places associated with important events of their citizenry. However, due to the vast, dispersed and disorganized nature of these data collections, the process of researching family history generally has been time consuming, painstaking and expensive. Our web-based technologies greatly enhance opportunities to make family history research easier.
THE ANCESTRY.COM SOLUTION
We continue to improve how people discover, preserve and share their family history through the design and development of differentiated Internet and mobile applications, proprietary technologies, substantial investment in content and the aggregation of user contributed and organized content.
RECENT DEVELOPMENTS
Preliminary Results for the Year Ended December 31, 2013
Opco expects to report the following results for total revenues, non-GAAP revenues, net loss, adjusted EBITDA, further adjusted EBITDA, cash and cash equivalents and long-term debt for the year ended December 31, 2013:
| • | Total revenues: We expect to report total revenues of approximately $539.4 million to $541.4 million. |
| • | Non-GAAP revenues: We expect to report non-GAAP revenues of approximately $560.5 million to $562.5 million. |
| • | Net loss: We expect to report a net loss of approximately $78.1 million to $81.6 million. |
| • | Adjusted EBITDA: We expect to report adjusted EBITDA of approximately $210.5 million to $212.5 million, which includes approximately $5.5 million of non-recurring transaction and litigation expenses. |
| • | Further adjusted EBITDA: We expect to report further adjusted EBITDA of approximately $219.5 million to $223.0 million. |
| • | Cash and cash equivalents: We expect to report cash and cash equivalents of approximately $86.5 million as of December 31, 2013. |
| • | Obligations under long-term debt: We expect to report long-term debt of approximately $922.1 million as of December 31, 2013, which excludes the $300.0 million aggregate principal amount of existing notes issued on September 17, 2013. |
| • | Capital expenditures are expected to be approximately $48 million. |
| • | Ancestry.com subscribers: Total subscribers of Ancestry.com branded websites totaled approximately 2,140,000 as of December 31, 2013. |
The preliminary financial and operating results for the year ended December 31, 2013 are forward-looking statements based on preliminary estimates and reflect the best judgment of our management but involve a number of risks and uncertainties, which could cause actual results to differ materially from those set forth in our estimates and from past results, performance or achievements. During the course of the preparation of our consolidated year end financial statements and related notes, we may identify items that would require us to make material adjustments to the preliminary financial information presented above, and such preliminary financial information should not be viewed as a substitute for full financial statements prepared in accordance with U.S. GAAP and audited by our auditors. Consequently, there can be no assurances that the actual financial and operating results for the year ended December 31, 2013 will be identical to the preliminary estimates set forth above, and any variation between our actual results and the estimates set forth above may be material. Accordingly, investors should not place undue reliance upon the preliminary estimates. The estimates are subject
2
to risks and uncertainties, many of which are not within our control. In addition, such results do not purport to indicate our results of operations for any future period beyond the year ended December 31, 2013. Ernst & Young LLP has not audited, reviewed, compiled or performed any procedures with respect to the accompanying preliminary financial data. Accordingly, Ernst & Young LLP does not express an opinion or any other form of assurance with respect thereto. We do not expect to disclose publicly whether or not our preliminary financial and operating results have changed, or to update such results, other than through the release of actual results in the ordinary course of business. Our consolidated financial statements for the year ended December 31, 2013 are not expected to be filed with the SEC until after this offering is completed. For a discussion of other risks and uncertainties affecting our business, see “Risk Factors” following this summary.
The following table shows the reconciliation of Opco’s net loss, the most directly comparable U.S. GAAP measure, to adjusted EBITDA and further adjusted EBITDA, in each case, for the year ended December 31, 2013:
| Estimated Range for the Year Ended December 31, 2013 |
||||||||
| 2013 (Estimated Low) |
2013 (Estimated High) |
|||||||
| (unaudited) | ||||||||
| (in thousands) | ||||||||
| Reconciliation of adjusted EBITDA and further adjusted EBITDA to net loss: |
||||||||
| Net loss |
$ | (78,100 | ) | $ | (81,600 | ) | ||
| Non-cash revenue adjustment(1) |
21,100 | 21,100 | ||||||
| Interest expense, net |
96,000 | 100,000 | ||||||
| Other expense, net |
500 | 1,000 | ||||||
| Income tax benefit |
(64,000 | ) | (67,000 | ) | ||||
| Depreciation |
16,500 | 17,500 | ||||||
| Amortization |
210,500 | 213,000 | ||||||
| Stock-based compensation expense |
8,000 | 8,500 | ||||||
|
|
|
|
|
|||||
| Adjusted EBITDA(2) |
$ | 210,500 | $ | 212,500 | ||||
|
|
|
|
|
|||||
| Non-recurring expenses |
7,000 | 8,000 | ||||||
| Payment to Sponsors |
1,500 | 1,500 | ||||||
| Other costs |
500 | 1,000 | ||||||
|
|
|
|
|
|||||
| Further adjusted EBITDA(3) |
$ | 219,500 | $ | 223,000 | ||||
|
|
|
|
|
|||||
| (1) | Represents non-cash adjustments to revenue or the revenues that would have been recognized, except for the write-down of deferred revenue to fair value as a result of the application of purchase accounting for the Transaction. |
| (2) | Adjusted EBITDA. We define adjusted EBITDA as net income (loss) plus non-cash adjustments to revenue from purchase accounting, interest expense, net; and other (income) expense, net; income tax expense (benefit); non-cash charges including depreciation, amortization and stock-based compensation expense; and expenses associated with the Transaction. |
| (3) | Further adjusted EBITDA. We define further adjusted EBITDA as adjusted EBITDA plus certain items that are non-recurring or are not related to the core operations of the Company. |
For the year ended December 31, 2013, non-recurring expenses are expected to consist of approximately $5.5 million of professional services related to litigation, establishing our new corporate structure, registering the existing senior notes with the SEC and the dividend declared in September 2013 by our Parent and costs related to the settlement of litigation and approximately $2.0 million of one-time business consulting services and other non-recurring costs.
Payment to Sponsors represents estimated payments to our Sponsors made during the year ended December 31, 2013, pursuant to our management agreement with certain of the Sponsors.
3
Other costs consists of employee severance costs, impairment of content, costs related to acquisitions, estimated public to private cost savings, estimated integration cost savings with respect to our acquisition of Archives.com in August 2012 and other costs partially offset by a non-cash gain on a reversal of sales tax accruals expensed in prior periods.
| Estimated Range For The Year Ended December 31, 2013 |
||||||||
| 2013 (Estimated Low) |
2013 (Estimated High) |
|||||||
| (unaudited) | ||||||||
| (in thousands) | ||||||||
| Reconciliation of non-GAAP revenues to total revenues: |
||||||||
| Total revenues |
$ | 539,400 | $ | 541,400 | ||||
| Non-cash revenue adjustment(1) |
21,100 | 21,100 | ||||||
|
|
|
|
|
|||||
| Non-GAAP revenues |
$ | 560,500 | $ | 562,500 | ||||
|
|
|
|
|
|||||
| (1) | Represents non-cash adjustments to revenue or the revenues that would have been recognized, except for the write-down of deferred revenue to fair value as a result of the application of purchase accounting for the Transaction. |
Subscribers
As of December 31, 2013, we had approximately 2.1 million subscribers to Ancestry.com branded websites and approximately 2.7 million subscribers across all websites, including Ancestry.com branded websites, Archives.com, Fold3.com and Newspapers.com.
Refinancing of Our Senior Secured Credit Facilities
On December 30, 2013, Opco and certain of its subsidiaries entered into Amendment No. 2 to the senior secured credit facilities, pursuant to which the borrower under the senior secured credit facilities, Ancestry.com Inc., refinanced a portion of its outstanding term loans under the senior secured credit facilities and made certain other amendments to the credit agreement governing the senior secured credit facilities, including to reduce the applicable interest rates as well as reallocate certain term loan tranches which should result in cost savings for the borrower. See “Description of Certain Indebtedness—Senior Secured Credit Facilities.”
RISKS ASSOCIATED WITH OUR BUSINESS
Our business is subject to numerous risks and uncertainties, as discussed more fully in the section entitled “Risk Factors” following this summary. We generate substantially all of our revenue from subscriptions to our services. We must continue to retain existing and to attract new subscribers. If our efforts to satisfy our existing subscribers are not successful, we may not be able to retain them, and as a result, our revenues could be adversely affected. We face competition from a number of sources, some of which provide genealogical records free of charge. Because we depend upon our online family history services for substantially all of our revenue, factors such as changes in consumer preferences for these products may have a disproportionately greater impact on us than if we offered multiple services. Our efforts to grow internationally may prove difficult due to, among other things, different and conflicting legal and regulatory regimes, cultural differences and technical difficulties and costs associated with the localization of our service offerings. Additionally, our recent performance may not be sustainable. See “Risk Factors.”
TERMINOLOGY
In this offering memorandum we use the terms subscriber, registered user, Ancestry.com websites, record and database.
4
A subscriber is an individual who pays for renewable access or redeems a gift subscription to one of our Ancestry.com branded websites, and a registered user is a person who has registered on one of our Ancestry.com branded websites or mobile apps, and includes subscribers. Our operations consist primarily of our flagship website Ancestry.com, which is part of a global family of websites that includes Ancestry.co.uk, Ancestry.com.au, Ancestry.ca, Ancestry.se, Ancestry.de, Ancestry.fr and Ancestry.it. We refer to these websites collectively as the Ancestry.com websites.
We use the term “record” in different ways depending on the content source. When referring to a number of records in certain of our company-acquired content collections, such as a census record, we mean information about each specific person. For example, a draft card will typically be counted as one record, as will each line in a census, because each contains information about a specific individual. When referring to unstructured data, such as a newspaper, we define each page in those data sources as a record. When referring to a number of databases, we mean groups of records we have distinguished as unique sets based on one or more common characteristics shared by the records in each set, such as a common time period, place or subject matter.
FORMATION OF ISSUER
The Issuer was formed in August 2013 in order to facilitate the recapitalization transaction of which the offering of the existing notes constituted a part. The Issuer is now the sole member of Opco. The Issuer intends to use the net proceeds from this offering to pay fees and expenses relating to the offering and to pay cash dividends on, and/or make other payments in respect of, the Issuer’s or its subsidiaries’ equity interests in the aggregate amount of approximately $ million. See “Use of Proceeds.”
5
CORPORATE STRUCTURE
The diagram below summarizes our corporate structure and indebtedness. This chart is provided for illustrative purposes only and does not represent all of our legal entities or obligations:
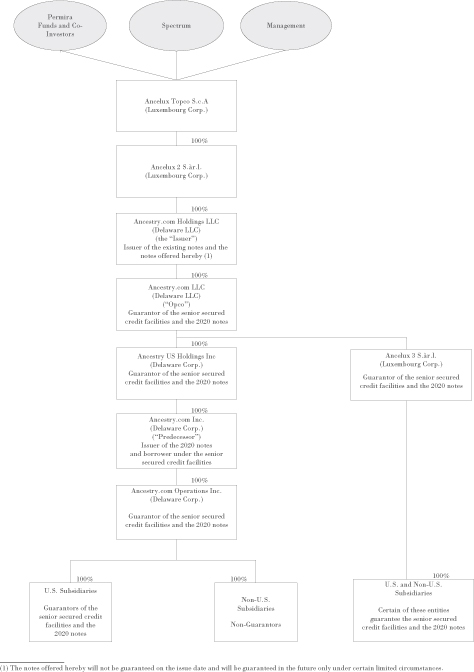
6
PERMIRA AND SPECTRUM EQUITY
Founded in 1985, Permira Advisers is a leading European private equity firm with global reach. The firm has 28 years of private equity investing experience, with €22 billion of committed capital across a number of buyout funds. It has made over 200 private equity investments, with a focus on driving transformation to create strategically desirable assets. Over the last decade, the firm has built and continued to invest in its global network. Today the firm has a fully integrated team in 12 offices across Europe, the United States and Asia. Permira’s investment strategy is focused on market leaders that demonstrate strong and resilient profit growth, and which offer clear business transformation potential. Its current portfolio of 27 companies has aggregate sales of greater than €25 billion, aggregate value of approximately €50 billion and employs more than 130,000 people.
Founded in 1994, Spectrum Equity has raised six private equity funds totaling $4.7 billion of capital exclusively focused on the information economy. Spectrum is a group of partners that have worked together for an average of 15 years, leading a team operating out of offices in Boston, MA and Menlo Park, CA. Spectrum invests in companies that are category leaders across North America, Western Europe and Australia.
CORPORATE INFORMATION
Ancestry.com Holdings LLC, the Issuer of the notes offered hereby, was formed and incorporated in Delaware in August 2013. The historical financial statements and other financial information presented in this offering memorandum are those of Ancestry.com LLC for periods after the consummation of the Transaction and of its Predecessor, Ancestry.com Inc., for periods prior to the consummation of the Transaction. Our principal executive offices are located at 360 West 4800 North, Provo, UT 84604, and our telephone number at that address is (801) 705-7000. Our corporate website address is http://corporate.ancestry.com. The contents of our websites are not incorporated in, or otherwise to be regarded as part of, this offering memorandum.
7
SUMMARY HISTORICAL CONSOLIDATED FINANCIAL AND OTHER DATA
This offering memorandum includes historical consolidated financial and operating data of Ancestry.com LLC, the wholly owned subsidiary of the Issuer, in lieu of consolidated financial data of the Issuer. The Issuer does not have any material operating, investing or financing activities other than the issuance of the existing notes and the related interest and being the holding company of Ancestry.com LLC. Accordingly, the consolidated balance sheets and results of operations of Ancestry.com LLC and the Issuer are identical for the periods for which financial information is presented in this offering memorandum, except for balances related to the issuance of the existing notes in September 2013.
We operated as Ancestry.com Inc. (the “Predecessor”) until December 28, 2012, when a company controlled by the Sponsors acquired the Predecessor. See Note 2 to our consolidated financial statements incorporated by reference in this offering memorandum for further information regarding the Transaction. As a result, our fiscal year 2012 is divided into a Successor period from December 29, 2012 to December 31, 2012 and a Predecessor period from January 1, 2012 to December 28, 2012. The following tables summarize selected consolidated historical financial and operating data for the periods indicated. The summarized Consolidated Balance Sheet data is presented for the Successor period as of December 31, 2012 and the Predecessor periods as of December 31, 2011 and 2010 and the unaudited period as of September 30, 2013 (Successor). The summarized Consolidated Statements of Operations data presented below for the Successor period from December 29, 2012 to December 31, 2012, the Predecessor period from January 1, 2012 to December 28, 2012 and the Predecessor periods for the years ended December 31, 2011 and 2010 have been derived from our Consolidated Financial Statements incorporated by reference herein, which have been audited by Ernst & Young LLP, an independent registered public accounting firm. Due to the Transaction, the results of the Successor are not comparable with the results of the Predecessor. Our combined results for the year ended December 31, 2012 represent the addition of the Predecessor period from January 1, 2012 to December 28, 2012 and the Successor period from December 29, 2012 to December 31, 2012. This combination does not comply with U.S. GAAP or with the rules for pro forma presentation, but is presented as we believe the presentation is useful to the reader for comparison with the prior periods. Our summarized Consolidated Balance Sheet data as of September 30, 2013 (Successor) and the summarized Consolidated Statements of Operations data for the nine months ended September 30, 2013 (Successor) and 2012 (Predecessor) are derived from our unaudited Condensed Consolidated Financial Statements incorporated by reference herein and include all adjustments, consisting of normal and recurring adjustments that we consider necessary for a fair presentation of the financial position and results of operations as of and for such periods. Operating results for the nine months ended September 30, 2013 (Successor) are not necessarily indicative of the results that may be expected for the full 2013 fiscal year. The summary unaudited consolidated statement of operations data for the twelve month period ended September 30, 2013 has been derived by adding the financial data from our audited statement of operations for the Predecessor period from January 1, 2012 to December 28, 2012 to the financial data from our audited statement of operations for the Successor period from December 29, 2012 to December 31, 2012 to the financial data from our unaudited condensed consolidated statement of operations for the nine months ended September 30, 2013 and subtracting the financial data from our unaudited condensed consolidated statement of operations data for the nine months ended September 30, 2012. See “Risk Factors” included in this offering memorandum and the notes to our consolidated financial statements incorporated by reference in this offering memorandum.
8
The data below should be read in conjunction with “Explanation of Certain Financial Matters,” “Risk Factors,” “Use of Proceeds” and “Capitalization” included elsewhere in this offering memorandum and “Management’s Discussion and Analysis of Financial Condition and Results of Operations” and our consolidated financial statements and the notes thereto incorporated by reference herein.
| Predecessor | Successor | Non-GAAP Combined |
Predecessor | Successor | Twelve Months Ended September 30, 2013 |
|||||||||||||||||||||||||||||||
| Year Ended December 31, 2010 |
Year Ended December 31, 2011 |
Period from Jan. 1, 2012 to Dec. 28, 2012 |
Period from Dec. 29, 2012 to Dec. 31, 2012 |
Period from Jan. 1, 2012 to Dec. 31, 2012 |
Nine Months Ended September 30, 2012 |
Nine Months Ended September 30, 2013 |
||||||||||||||||||||||||||||||
| (unaudited) | (unaudited) | (unaudited) | (unaudited) | |||||||||||||||||||||||||||||||||
| (in thousands, other than ratios and Other Data) | ||||||||||||||||||||||||||||||||||||
| Consolidated Statements of Operations Data: |
||||||||||||||||||||||||||||||||||||
| Total revenues |
$ | 300,931 | $ | 399,661 | $ | 483,627 | $ | 3,458 | $ | 487,085 | $ | 355,969 | $ | 395,405 | $ | 526,521 | ||||||||||||||||||||
| Total cost of revenues |
52,107 | 66,508 | 85,903 | 823 | 86,726 | 62,161 | 83,804 | 108,369 | ||||||||||||||||||||||||||||
|
|
|
|
|
|
|
|
|
|
|
|
|
|
|
|
|
|||||||||||||||||||||
| Gross profit |
248,824 | 333,153 | 397,724 | 2,635 | 400,359 | 293,808 | 311,601 | 418,152 | ||||||||||||||||||||||||||||
| Operating expenses: |
||||||||||||||||||||||||||||||||||||
| Technology and development |
42,296 | 58,245 | 77,512 | 642 | 78,154 | 55,292 | 63,898 | 86,760 | ||||||||||||||||||||||||||||
| Marketing and advertising |
94,573 | 122,997 | 138,073 | 1,145 | 139,218 | 105,303 | 107,872 | 141,787 | ||||||||||||||||||||||||||||
| General and administrative |
35,390 | 39,734 | 45,995 | 381 | 46,376 | 34,605 | 39,509 | 51,280 | ||||||||||||||||||||||||||||
| Amortization of acquired intangible assets |
15,959 | 16,711 | 16,551 | 1,472 | 18,023 | 10,362 | 139,032 | 146,693 | ||||||||||||||||||||||||||||
| Transaction-related expenses |
— | — | 7,104 | 102,264 | 109,368 | 2,878 | — | 106,490 | ||||||||||||||||||||||||||||
|
|
|
|
|
|
|
|
|
|
|
|
|
|
|
|
|
|||||||||||||||||||||
| Total operating expenses |
$ | 188,218 | 237,687 | $ | 285,235 | $ | 105,904 | $ | 391,139 | $ | 208,440 | $ | 350,311 | $ | 533,010 | |||||||||||||||||||||
|
|
|
|
|
|
|
|
|
|
|
|
|
|
|
|
|
|||||||||||||||||||||
| Income (loss) from operations |
60,606 | 95,466 | 112,489 | (103,269 | ) | 9,220 | 85,368 | (38,710 | ) | (114,858 | ) | |||||||||||||||||||||||||
| Interest expense, net |
(4.697 | ) | (589 | ) | (1,065 | ) | (730 | ) | (1,795 | ) | (674 | ) | (70,569 | ) | (71,690 | ) | ||||||||||||||||||||
| Other income (expense), net |
439 | (637 | ) | 742 | — | 742 | 761 | (434 | ) | (453 | ) | |||||||||||||||||||||||||
|
|
|
|
|
|
|
|
|
|
|
|
|
|
|
|
|
|||||||||||||||||||||
| Income (loss) before income taxes |
56,348 | 94,240 | 112,166 | (103,999 | ) | 8,167 | 85,455 | (109,713 | ) | (187,001 | ) | |||||||||||||||||||||||||
| Income tax benefit (expense) |
(19,503 | ) | (31,345 | ) | (41,377 | ) | 31,324 | (10,053 | ) | (27,031 | ) | 53,360 | 70,338 | |||||||||||||||||||||||
|
|
|
|
|
|
|
|
|
|
|
|
|
|
|
|
|
|||||||||||||||||||||
| Net income (loss) |
$ | 36,845 | $ | 62,895 | $ | 70,789 | $ | (72,675 | ) | $ | (1,886 | ) | $ | 58,424 | $ | (56,353 | ) | (116,663 | ) | |||||||||||||||||
|
|
|
|
|
|
|
|
|
|
|
|
|
|
|
|
|
|||||||||||||||||||||
| Cash Flow Data: |
||||||||||||||||||||||||||||||||||||
| Cash flows provided by (used in): |
||||||||||||||||||||||||||||||||||||
| Operating activities |
$ | 105,941 | $ | 131,032 | $ | 153,501 | $ | (85,335 | ) | $ | 68,166 | $ | 126,633 | $ | 130,001 | $ | 71,534 | |||||||||||||||||||
| Investing activities |
(8,101 | ) | (34,303 | ) | (158,820 | ) | (1,352,744 | ) | (1,511,564 | ) | (150,915 | ) | (40,980 | ) | (1,401,629 | ) | ||||||||||||||||||||
| Financing activities |
(99,306 | ) | (113,300 | ) | (3,657 | ) | 1,473,730 | 1,470,073 | 39,880 | (53,317 | ) | 1,376,876 | ||||||||||||||||||||||||
9
| Predecessor | Successor | Non-GAAP Combined |
Predecessor | Successor | Twelve Months Ended September 30, 2013 |
|||||||||||||||||||||||||||||||
| Year Ended December 31, 2010 |
Year Ended December 31, 2011 |
Period from Jan. 1, 2012 to Dec. 28, 2012 |
Period from Dec. 29, 2012 to Dec. 31, 2012 |
Period from Jan. 1, 2012 to Dec. 31, 2012 |
Nine Months Ended September 30, 2012 |
Nine Months Ended September 30, 2013 |
||||||||||||||||||||||||||||||
| (unaudited) | (unaudited) | (unaudited) | (unaudited) | |||||||||||||||||||||||||||||||||
| (in thousands, other than ratios and Other Data) | ||||||||||||||||||||||||||||||||||||
| Balance Sheet Data (as of period end): |
||||||||||||||||||||||||||||||||||||
| Working capital (deficiency) |
$ | (39,535 | ) | $ | (90,366 | ) | $ | (100,603 | ) | $ | (127,693 | ) | ||||||||||||||||||||||||
| Cash and cash equivalents |
65,519 | 48,998 | 35,651 | 71,355 | ||||||||||||||||||||||||||||||||
| Total assets |
522,186 | 493,849 | 2,077,454 | 1,932,418 | ||||||||||||||||||||||||||||||||
| Deferred revenues |
89,301 | 108,654 | 116,953 | 141,107 | ||||||||||||||||||||||||||||||||
| Long-term obligations(1) |
— | 10,000 | 943,229 | 902,223 | ||||||||||||||||||||||||||||||||
| Total liabilities |
158,319 | 183,340 | 1,468,108 | 1,371,546 | ||||||||||||||||||||||||||||||||
| Total member’s interests/ stockholders’ equity |
363,867 | 310,509 | 609,346 | 560,872 | ||||||||||||||||||||||||||||||||
| Other Financial Data: |
||||||||||||||||||||||||||||||||||||
| Non-GAAP revenues(2) |
$ | 300,931 | $ | 399,661 | $ | 483,627 | $ | 4,008 | $ | 487,635 | $ | 355,969 | $ | 415,567 | 547,233 | |||||||||||||||||||||
| Capital expenditures |
26,842 | 34,303 | 44,314 | — | 44,314 | 36,409 | 31,980 | 39,885 | ||||||||||||||||||||||||||||
| Adjusted EBITDA(3) |
100,974 | 144,807 | 177,592 | 1,233 | 178,825 | 128,715 | 158,016 | 208,126 | ||||||||||||||||||||||||||||
| Further adjusted EBITDA(4) |
214,744 | |||||||||||||||||||||||||||||||||||
| Free cash flow(5) |
60,359 | 106,355 | 104,754 | 1,233 | 105,987 | 64,708 | 117,310 | 158,589 | ||||||||||||||||||||||||||||
| Cash paid for interest |
2,645 | 466 | 1,368 | — | 1,368 | 537 | 45,645 | 46,476 | ||||||||||||||||||||||||||||
| Other Data: |
||||||||||||||||||||||||||||||||||||
| Total subscribers at end of period |
1,395 | 1,703 | 2,016 | 2,020 | 2,175 | 2,175 | ||||||||||||||||||||||||||||||
| Net subscriber additions |
329 | 308 | 313 | 317 | 159 | 155 | ||||||||||||||||||||||||||||||
| Issuer Pro Forma Twelve Months Ended September 30, 2013 |
||||
| Pro Forma Credit Statistics |
||||
| Pro forma net debt(6) |
$ | 1,250,749 | ||
| Pro forma cash interest expense(7) |
98,463 | |||
| Ratio of net debt to further adjusted EBITDA(4)(6) |
5.8 | x | ||
| Ratio of further adjusted EBITDA to pro forma cash interest expense(4)(7) |
2.2 | x | ||
| Ratio of senior secured debt to further adjusted EBITDA(4) |
2.9 | x | ||
| (1) | Long-term obligations represent the current and long-term portions of debt outstanding in the periods presented, net of original issue discount. |
| (2) | Non-GAAP revenues. We define non-GAAP revenues as the revenues that would have been recognized, except for the write-down of deferred revenue to fair value as a result of the application of purchase accounting for the Transaction. Non-GAAP revenues are calculated as total revenues plus the effects of non-cash adjustments to revenue from purchase accounting. |
10
| (3) | Adjusted EBITDA. We define adjusted EBITDA as net income (loss) plus non-cash adjustments to revenue from purchase accounting, interest expense, net; other (income) expense, net; income tax expense (benefit); non-cash charges including depreciation, amortization and stock-based compensation expense; and expenses associated with the Transaction. |
| (4) | Further adjusted EBITDA. We define further adjusted EBITDA as adjusted EBITDA plus certain items that are non-recurring or are not related to the core operations of the Company. |
| (5) | Free cash flow. We define free cash flow as net income (loss) plus non-cash adjustments to revenue from purchase accounting, interest expense, net; other (income) expense, net; income tax expense (benefit); non-cash charges including depreciation, amortization and stock-based compensation expense; and expenses associated with the Transaction; and minus capitalization of content databases, purchases of property and equipment and cash received (paid) for income taxes and interest. |
| Free cash flow for the twelve months ended September 30, 2013 does not reflect twelve months of cash interest costs for the pro forma indebtedness as if it has been outstanding for twelve months. |
| (6) | Pro forma net debt of the Issuer reflects indebtedness of Opco and its subsidiaries plus the indebtedness of the Issuer represented by the existing notes and the notes offered hereby less actual cash and cash equivalents as of September 30, 2013. |
| (7) | Pro forma cash interest expense is (i) total cash interest expense of Opco and its subsidiaries on a pro forma basis, including the effects of the refinancing of the senior secured credit facilities in December 2013, plus (ii) cash interest expense related to the existing notes and the notes offered hereby. Reflects twelve months of interest as if such debt had been outstanding on the first day of such twelve-month period. |
The following table presents a reconciliation of non-GAAP revenues to total revenues, the most comparable GAAP measure, for each of the periods identified.
| Predecessor | Successor | Non-GAAP Combined |
Predecessor | Successor | ||||||||||||||||||||||||||||||||
| Year Ended December 31, 2010 |
Year Ended December 31, 2011 |
Period from Jan. 1, 2012 to Dec. 28, 2012 |
Period from Dec. 29, 2012 to Dec. 31, 2012 |
Period from Jan. 1, 2012 to Dec. 31, 2012 |
Nine Months Ended September 30, 2012 |
Nine Months Ended September 30, 2013 |
Twelve Months Ended September 30, 2013 |
|||||||||||||||||||||||||||||
| (unaudited) | (unaudited) | (unaudited) | (unaudited) | |||||||||||||||||||||||||||||||||
| (in thousands) | ||||||||||||||||||||||||||||||||||||
| Reconciliation of non-GAAP revenues to total revenues: |
||||||||||||||||||||||||||||||||||||
| Total revenues |
$ | 300,931 | $ | 399,661 | $ | 483,627 | $ | 3,458 | $ | 487,085 | $ | 355,969 | $ | 395,405 | $ | 526,521 | ||||||||||||||||||||
| Non-cash revenue adjustment(1) |
— | — | — | 550 | 550 | — | 20,162 | 20,712 | ||||||||||||||||||||||||||||
|
|
|
|
|
|
|
|
|
|
|
|
|
|
|
|
|
|||||||||||||||||||||
| Non-GAAP revenues |
$ | 300,931 | $ | 399,661 | $ | 483,627 | $ | 4,008 | $ | 487,635 | $ | 355,969 | $ | 415,567 | $ | 547,233 | ||||||||||||||||||||
|
|
|
|
|
|
|
|
|
|
|
|
|
|
|
|
|
|||||||||||||||||||||
| (1) | Represents non-cash adjustments to revenue or the revenues that would have been recognized, except for the write-down of deferred revenue to fair value as a result of the application of purchase accounting for the Transaction. |
11
The following table presents a reconciliation of our adjusted EBITDA and free cash flow to net income (loss), the most comparable U.S. GAAP measure, for each of the periods identified.
| Predecessor | Successor | Non-GAAP Combined |
Predecessor |
|
Successor | Twelve Months Ended September 30, 2013 |
||||||||||||||||||||||||||||||
| Year Ended December 31, 2010 |
Year Ended December 31, 2011 |
Period from Jan. 1, 2012 to Dec. 28, 2012 |
Period from Dec. 29, 2012 to Dec. 31, 2012 |
Period from Jan. 1, 2012 to Dec. 31, 2012 |
Nine Months Ended September 30, 2012 |
|
Nine Months Ended September 30, 2013 |
|||||||||||||||||||||||||||||
| (unaudited) | (unaudited) | (unaudited) | (unaudited) | |||||||||||||||||||||||||||||||||
| (in thousands) | ||||||||||||||||||||||||||||||||||||
| Reconciliation of adjusted EBITDA and free cash flow to net income (loss): |
||||||||||||||||||||||||||||||||||||
| Net income (loss) |
$ | 36,845 | $ | 62,895 | $ | 70,789 | $ | (72,675 | ) | $ | (1,886 | ) | $ | 58,424 | $ | (56,353 | ) | $ | (116,663 | ) | ||||||||||||||||
| Non-cash revenue adjustment(1) |
— | — | — | 550 | 550 | — | 20,162 | 20,712 | ||||||||||||||||||||||||||||
| Interest expense, net |
4,697 | 589 | 1,065 | 730 | 1,795 | 674 | 70,569 | 71,690 | ||||||||||||||||||||||||||||
| Other (income) expense, net |
(439 | ) | 637 | (742 | ) | — | (742 | ) | (761 | ) | 434 | 453 | ||||||||||||||||||||||||
| Income tax expense (benefit) |
19,503 | 31,345 | 41,377 | (31,324 | ) | 10,053 | 27,031 | (53,360 | ) | (70,338 | ) | |||||||||||||||||||||||||
| Depreciation |
11,773 | 13,450 | 14,699 | — | 14,699 | 10,907 | 12,256 | 16,048 | ||||||||||||||||||||||||||||
| Amortization |
23,526 | 25,916 | 27,879 | 1,688 | 29,567 | 18,476 | 158,833 | 169,924 | ||||||||||||||||||||||||||||
| Stock-based compensation expense |
5,069 | 9,975 | 15,421 | — | 15,421 | 11,086 | 5,475 | 9,810 | ||||||||||||||||||||||||||||
| Transaction-related expenses(2) |
— | — | 7,104 | 102,264 | 109,368 | 2,878 | — | 106,490 | ||||||||||||||||||||||||||||
|
|
|
|
|
|
|
|
|
|
|
|
|
|
|
|
|
|||||||||||||||||||||
| Adjusted EBITDA |
$ | 100,974 | $ | 144,807 | $ | 177,592 | $ | 1,233 | $ | 178,825 | $ | 128,715 | $ | 158,016 | $ | 208,126 | ||||||||||||||||||||
|
|
|
|
|
|
|
|
|
|
|
|
|
|
|
|
|
|||||||||||||||||||||
| Capitalization of content databases |
(13,874 | ) | (20,408 | ) | (23,538 | ) | — | (23,538 | ) | (18,966 | ) | (14,732 | ) | (19,304 | ) | |||||||||||||||||||||
| Purchases of property and equipment |
(12,968 | ) | (13,895 | ) | (20,776 | ) | — | (20,776 | ) | (17,443 | ) | (17,248 | ) | (20,581 | ) | |||||||||||||||||||||
| Cash paid for interest |
(2,645 | ) | (466 | ) | (1,368 | ) | — | (1,368 | ) | (537 | ) | (45,645 | ) | (46,476 | ) | |||||||||||||||||||||
| Cash received (paid) for income taxes |
(11,128 | ) | (3,683 | ) | (27,156 | ) | — | (27,156 | ) | (27,061 | ) | 36,919 | 36,824 | |||||||||||||||||||||||
|
|
|
|
|
|
|
|
|
|
|
|
|
|
|
|
|
|||||||||||||||||||||
| Free cash flow(3) |
$ | 60,359 | $ | 106,355 | $ | 104,754 | $ | 1,233 | $ | 105,987 | $ | 64,708 | $ | 117,310 | $ | 158,589 | ||||||||||||||||||||
|
|
|
|
|
|
|
|
|
|
|
|
|
|
|
|
|
|||||||||||||||||||||
| (1) | Represents non-cash adjustments to revenue or the revenues that would have been recognized, except for the write-down of deferred revenue to fair value as a result of the application of purchase accounting for the Transaction. |
| (2) | Transaction-related expenses for the period from December 29, 2012 to December 31, 2012 include $53.1 million of stock-based compensation expense due to the acceleration of vesting for outstanding Predecessor stock-based awards upon closing of the Transaction. See Note 10 in Opco’s audited Consolidated Financial Statements incorporated by reference herein for further detail. |
| (3) | Free cash flow for the twelve months ended September 30, 2013 does not reflect twelve months of cash interest costs for the pro forma indebtedness as if it had been outstanding for twelve months. Pro forma cash interest expense was calculated to be $98.5 million. |
12
| Twelve Months Ended September 30, 2013 |
||||
| (unaudited) (in thousands) |
||||
| Reconciliation of further adjusted EBITDA to adjusted EBITDA: |
||||
| Adjusted EBITDA |
$ | 208,126 | ||
| Non-recurring expenses(1) |
5,321 | |||
| Payment to Sponsors(2) |
1,125 | |||
| Other costs(3) |
172 | |||
|
|
|
|||
| Total adjustments |
$ | 6,618 | ||
|
|
|
|||
| Further adjusted EBITDA |
$ | 214,744 | ||
|
|
|
|||
| (1) | Non-recurring expenses consist of professional services related to litigation, establishing our new corporate structure, registering the 2020 notes with the SEC and the dividend declared in September 2013 by the Issuer, costs related to the settlement of litigation, one-time business consulting services and other non-recurring costs. |
| (2) | Payment to Sponsors represents estimated payments to our Sponsors made during the twelve months ended September 30, 2013, pursuant to our management agreement with certain of the Sponsors. |
| (3) | Other costs consists of employee severance costs, impairment of content, costs related to acquisitions, estimated public to private cost savings, estimated integration cost savings with respect to our acquisition of Archives.com in August 2012 and other costs partially offset by a non-cash gain on a reversal of sales tax accruals expensed in prior periods. |
13