Attached files
| file | filename |
|---|---|
| EX-10.23 - EX-10.23 - Inogen Inc | d597508dex1023.htm |
| EX-10.24 - EX-10.24 - Inogen Inc | d597508dex1024.htm |
| EX-10.25 - EX-10.25 - Inogen Inc | d597508dex1025.htm |
| EX-10.26 - EX-10.26 - Inogen Inc | d597508dex1026.htm |
| EX-10.27 - EX-10.27 - Inogen Inc | d597508dex1027.htm |
| EX-10.6 - EX-10.6 - Inogen Inc | d597508dex106.htm |
| EX-10.7 - EX-10.7 - Inogen Inc | d597508dex107.htm |
| EX-10.8 - EX-10.8 - Inogen Inc | d597508dex108.htm |
| EX-23.1 - EX-23.1 - Inogen Inc | d597508dex231.htm |
| EX-23.2 - EX-23.2 - Inogen Inc | d597508dex232.htm |
Table of Contents
Registration No. 333-192605
As filed with the Securities and Exchange Commission on January 28, 2014.
UNITED STATES
SECURITIES AND EXCHANGE COMMISSION
Washington, D.C. 20549
AMENDMENT NO. 3
TO
FORM S-1
REGISTRATION STATEMENT
Under
The Securities Act of 1933
INOGEN, INC.
(Exact name of registrant as specified in its charter)
| Delaware | 5960 | 33-0989359 | ||
| (State or other jurisdiction of incorporation or organization) |
(Primary Standard Industrial Classification Code Number) |
(I.R.S. Employer Identification Number) |
326 Bollay Drive
Goleta, California 93117
(805) 562-0500
(Address, including ZIP code, and telephone number, including area code, of registrant’s principal executive offices)
Raymond Huggenberger
326 Bollay Drive
Goleta, California 93117
(805) 562-0500
(Name, address, including zip code, and telephone number, including area code, of agent for service)
Copies to:
| Martin J. Waters Robert F. Kornegay Wilson Sonsini Goodrich & Rosati, Professional Corporation 633 West Fifth Street, 15th Floor Los Angeles, CA 90071 Telephone: (323) 210-2900 Facsimile: (866) 974-7329 |
Charles K. Ruck B. Shayne Kennedy Latham & Watkins LLP 650 Town Center Drive, 20th Floor Costa Mesa, CA 92626-1925 Telephone: (714) 540-1235 Facsimile: (714) 755-8290 |
Approximate date of commencement of proposed sale to the public: As soon as practicable after the effective date of this Registration Statement.
If any of the securities being registered on this Form are to be offered on a delayed or continuous basis pursuant to Rule 415 under the Securities Act, as amended, check the following box. ¨
If this Form is filed to register additional securities for an offering pursuant to Rule 462(b) under the Securities Act, please check the following box and list the Securities Act registration statement number of the earlier effective registration statement for the same offering. ¨
If this Form is a post-effective amendment filed pursuant to Rule 462(c) under the Securities Act, check the following box and list the Securities Act registration statement number of the earlier effective registration statement for the same offering. ¨
If this Form is a post-effective amendment filed pursuant to Rule 462(d) under the Securities Act, check the following box and list the Securities Act registration statement number of the earlier effective registration statement for the same offering. ¨
Indicate by check mark whether the registrant is a large accelerated filer, an accelerated filer, a non-accelerated filer, or a smaller reporting company. See the definitions of “large accelerated filer,” “accelerated filer” and “smaller reporting company” in Rule 12b-2 of the Exchange Act. (Check one):
| Large accelerated filer ¨ |
Accelerated filer ¨ | Non-accelerated filer x | Smaller reporting company ¨ | |||
| (Do not check if a smaller reporting company) |
The registrant hereby amends this Registration Statement on such date or dates as may be necessary to delay its effective date until the registrant shall file a further amendment that specifically states that this Registration Statement shall thereafter become effective in accordance with Section 8(a) of the Securities Act of 1933, as amended, or until the Registration Statement shall become effective on such date as the Securities and Exchange Commission, acting pursuant to such Section 8(a), may determine.
Table of Contents
The information in this prospectus is not complete and may be changed. We may not sell these securities until the registration statement filed with the Securities and Exchange Commission is effective. This prospectus is not an offer to sell these securities and is it is not soliciting an offer to buy these securities in any jurisdiction where the offer or sale is not permitted.
Subject to completion, dated January 28, 2014
Prospectus
shares

Common stock
This is an initial public offering of common stock of Inogen, Inc. We are selling shares of common stock, and the selling stockholders are selling shares of common stock. We will not receive any proceeds from the sale of shares by the selling stockholders. The estimated initial public offering price is expected to be between $ and $ per share.
Prior to this offering, there has been no public market for our common stock. We intend to apply to list our common stock on the NASDAQ Global Market under the symbol “INGN.”
We are an “emerging growth company” under applicable Securities and Exchange Commission rules and will be subject to reduced public company reporting requirements.
| Per share | Total | |||||||
| Initial public offering price |
$ | $ | ||||||
| Underwriting discounts and commissions(1) |
$ | $ | ||||||
| Proceeds to Inogen, Inc., before expenses |
$ | $ | ||||||
| Proceeds to selling stockholders |
$ | $ | ||||||
| (1) | See “Underwriting” for additional disclosure regarding underwriting discounts, commissions and estimated offering expenses. |
The selling stockholders have granted the underwriters a 30-day option to purchase up to an additional shares of common stock.
Investing in our common stock involves a high degree of risk. See “Risk factors” beginning on page 14.
Neither the Securities and Exchange Commission nor any state securities commission has approved or disapproved of these securities or determined if this prospectus is truthful or complete. Any representation to the contrary is a criminal offense.
The underwriters expect to deliver the shares to purchasers on or about , 2014.
J.P. Morgan
Leerink Partners
| William Blair | Stifel | |
| , 2014 | ||
Table of Contents

Table of Contents
| Page | ||||
| 1 | ||||
| 14 | ||||
| 47 | ||||
| 48 | ||||
| 49 | ||||
| 50 | ||||
| 52 | ||||
| 55 | ||||
| Management’s discussion and analysis of financial condition and results of operations |
59 | |||
| 98 | ||||
| 124 | ||||
| 136 | ||||
| 151 | ||||
| 154 | ||||
| 158 | ||||
| 165 | ||||
| Material U.S. federal income tax consequences to non-U.S. holders of common stock |
168 | |||
| 172 | ||||
| 180 | ||||
| 180 | ||||
| 180 | ||||
| 181 | ||||
| Index to financial statements, as of and for the years ended December 31, 2012 and 2011 |
F-1 | |||
| Index to financial statements, as of and for the nine months ended September 30, 2013 and 2012 |
F-42 | |||
Neither we, the selling stockholders nor the underwriters have authorized anyone to provide any information other than that contained in this prospectus or in any free writing prospectus prepared by or on behalf of us or to which we have referred you. We take no responsibility for, and can provide no assurance as to the reliability of, any other information that others may give you. We, the selling stockholders and the underwriters are not making an offer to sell these securities in any jurisdiction where the offer or sale is not permitted. You should assume that the information appearing in this prospectus is accurate only as of the date on the front cover of this prospectus, regardless of the time of delivery of this prospectus or any sale of our common stock. Our business, financial condition, results of operations and prospects may have changed since that date.
Until , 2014 (25 days after the commencement of this offering), all dealers that effect transactions in these securities, whether or not participating in this offering, may be required to
-i-
Table of Contents
deliver a prospectus. This is in addition to the dealers’ obligation to deliver a prospectus when acting as underwriters and with respect to their unsold allotments or subscriptions.
For investors outside of the United States: Neither we, the selling stockholders nor the underwriters have done anything that would permit this offering or possession or distribution of this prospectus in any jurisdiction where action for that purpose is required, other than the United States. Persons outside of the United States who come into possession of this prospectus must inform themselves about, and observe any restrictions relating to, the offering of the shares of common stock and the distribution of this prospectus outside of the United States.
-ii-
Table of Contents
The items in the following summary are described in more detail later in this prospectus. This summary provides an overview of selected information and does not contain all of the information you should consider before buying our common stock. Therefore, you should read the entire prospectus carefully, especially the “Risk factors” section beginning on page 12 and our financial statements and the related notes appearing at the end of this prospectus, before deciding to invest in our common stock. In this prospectus, unless the context otherwise requires, references to “we,” “us,” “our” or “Inogen” refer to Inogen, Inc.
Overview
We are a medical technology company that develops, manufactures and markets innovative portable oxygen concentrators used to deliver supplemental long-term oxygen therapy to patients suffering from chronic respiratory conditions. Traditionally, these patients have relied on stationary oxygen concentrator systems for use in the home and oxygen tanks or cylinders for mobile use, which we call the delivery model. The delivery model limits lifestyle flexibility by requiring patients to plan their activities around a finite oxygen supply outside the home and to be tethered to a stationary concentrator in the home. Our proprietary Inogen One systems concentrate the air around the patient to offer a single source of supplemental oxygen anytime, anywhere with a portable device weighing approximately 4.8 or 7.0 pounds. Our systems reduce the patient’s reliance on stationary concentrators and scheduled deliveries of tanks with a finite supply of oxygen, thereby improving patient quality of life and fostering mobility.
Although portable oxygen concentrators represent the fastest-growing segment of the Medicare oxygen therapy market, we estimate based on Medicare data from 2012 that patients using portable oxygen concentrators represent approximately 4% to 5% of the total addressable oxygen market in the United States. Based on 2012 industry data, we were the leading worldwide manufacturer of portable oxygen concentrators, as well as the largest provider of portable oxygen concentrators to Medicare patients, as measured by dollar volume. We believe we are the only manufacturer of portable oxygen concentrators that employs a direct-to-consumer strategy in the United States, meaning we market our products to patients, process their physician paperwork, provide clinical support as needed and bill Medicare or private payors on their behalf.
We believe our direct-to-consumer strategy has been critical to driving patient adoption of our technology. Other portable oxygen concentrator manufacturers access patients by selling through home medical equipment providers, which we believe are disincentivized to encourage adoption of portable oxygen concentrators due to their investments in the physical infrastructure and personnel required for the delivery model. Because portable oxygen concentrators eliminate the need for a physical distribution infrastructure, but have higher initial equipment costs than the delivery model, we believe converting to a portable oxygen concentrator model would require significant restructuring and capital investment for home medical equipment providers. Our direct-to-consumer marketing strategy allows us to sidestep the home medical equipment channel, appeal to patients directly and capture both the manufacturing and provider margin associated with long-term oxygen therapy. We believe our ability to capture this top-to-bottom margin, combined with our technology that eliminates most of the delivery model’s infrastructure and service requirements, gives us a cost structure advantage over our competitors.
-1-
Table of Contents
Since adopting our direct-to-consumer strategy in 2009, we have directly sold or rented our Inogen One systems to more than 40,000 patients, growing our revenue from $10.7 million in 2009 to $48.6 million in 2012. In 2012, approximately 60% of our total revenue came from our direct-to-consumer business and approximately 40% came from our business-to-business sales. Of our direct-to-consumer revenue of $29.0 million in 2012, $19.9 million came from our domestic rental business and $9.1 million came from domestic sales of our systems. Of our business-to-business revenue of $19.6 million in 2012, $13.0 million came from international markets, and $6.7 million came from domestic distributors. We have increased our proportion of both recurring revenue and international revenue in 2012 compared to 2011. In 2012, 26.8% of our revenue came from international markets (versus 25.9% in 2011) and 40.9% from oxygen rentals (versus 35.8% in 2011). Additionally, we have increased our gross margin from 48.0% in 2011 to 49.3% in 2012 by increasing rental mix, improving system reliability, reducing material cost per system and lowering overhead cost per system. Our net loss was $2.6 million in 2009 transitioning to net income of $0.6 million in 2012.
Our market
Overview of oxygen therapy market
We believe the current total addressable oxygen therapy market in the United States is approximately $3 billion to $4 billion, based on 2012 Medicare data and our estimate of the ratio of the Medicare market to the total market. We estimate that more than 2.5 million patients in the United States and more than 4.5 million patients worldwide use oxygen therapy, and more than 60% of oxygen therapy patients in the United States are covered by Medicare. The number of oxygen therapy patients in the United States is projected to grow by approximately 7% to 10% per year between 2013 and 2019, which we believe is the result of earlier diagnosis of chronic respiratory conditions, demographic trends and longer durations of long-term oxygen therapy.
Long-term oxygen therapy has been shown to be a cost-efficient and clinically effective means to treat hypoxemia, a condition in which patients have insufficient oxygen in the blood. Hypoxemic patients are unable to convert oxygen found in the air into the bloodstream in an efficient manner, causing organ damage and poor health. Chronic obstructive pulmonary disease, or COPD, is a leading cause of hypoxemia. Approximately 70% of our patient population has been diagnosed with COPD, which we believe is reflective of the long-term oxygen therapy market in general. Industry sources estimate that 24 million people in the United States suffer from COPD, of which one-half are undiagnosed.
According to our analysis of 2011 and 2012 Medicare data, approximately two-thirds of U.S. oxygen users require ambulatory oxygen and the remaining one-third require only stationary or nocturnal oxygen. Clinical data has shown that ambulatory patients that use oxygen twenty-four hours a day, seven days a week, or 24/7, regardless of whether such patients rely on portable oxygen concentrators or the delivery model, have approximately two times the survival rate and spend at least 60% fewer days annually in the hospital than non-ambulatory 24/7 patients. Of the ambulatory patients, we estimate that approximately 85% rely upon the delivery model that has the following disadvantages:
| • | limited flexibility outside the home, dictated by the finite oxygen supply provided by tanks and cylinders and dependence on delivery schedules; |
-2-
Table of Contents
| • | restricted mobility and inconvenience within the home, as patients must attach long, cumbersome tubing to a noisy stationary concentrator to move within their homes; |
| • | products are not cleared for use on commercial aircraft and cannot plug into a vehicle outlet for extended use; and |
| • | high costs driven by the infrastructure necessary to establish a geographically diverse distribution network to serve patients locally, as well as personnel, fuel and other costs, which have limited economies of scale and generally increase over time. |
Portable oxygen concentrators were developed in response to many of the limitations associated with traditional oxygen therapy. Portable oxygen concentrators are designed to offer a self-replenishing, unlimited supply of oxygen that is concentrated from the surrounding air and to operate without the need for oxygen tanks or regular oxygen deliveries, allowing patients to enhance their independence and mobility. Additionally, because portable oxygen concentrators do not require the physical infrastructure and service intensity of the delivery model, we believe portable oxygen concentrators can provide long-term oxygen therapy with a lower cost structure. Despite the ability of portable oxygen concentrators to address many of the shortcomings of traditional oxygen therapy, we estimate based on 2012 Medicare data that the amount spent by patients with portable oxygen concentrators represents approximately 5% to 6% of total oxygen therapy spend. We believe the following has hindered the market acceptance of portable oxygen concentrators:
| • | to obtain portable oxygen concentrators, patients are dependent on home medical equipment providers, which have made significant investments in the physical distribution infrastructure to support the delivery model; |
| • | constrained manufacturing costs of conventional portable oxygen concentrators, driven by home medical equipment provider preference for products that have lower upfront equipment cost; and |
| • | limitations of conventional portable oxygen concentrators, including bulkiness, poor reliability and lack of suitability beyond intermittent or travel use. |
Our solution
Our Inogen One systems provide patients who require long-term oxygen therapy with a reliable, lightweight, single solution product that improves quality-of-life, fosters mobility and eliminates dependence on both oxygen tanks and cylinders as well as stationary concentrators. We believe our direct-to-consumer strategy increases our ability to effectively develop, design and market our Inogen One solutions, as it allows us to:
| • | drive patient awareness of our portable oxygen concentrators through direct marketing, sidestepping the home medical equipment channel that other manufacturers rely upon and that is incentivized to continue to service oxygen patients through the delivery model; |
| • | capture the manufacturer and home medical equipment provider margins, allowing us to focus on the total cost of the solution and to invest in the development of product features that improve patient satisfaction, product reliability, durability and longevity; and |
-3-
Table of Contents
| • | access and utilize direct patient feedback in our research and development efforts, allowing us to stay at the forefront of patient preference. |
Our two product offerings, the Inogen One G3 and Inogen One G2, at approximately 4.8 and 7.0 pounds, respectively, offer portability without compromising or constraining other patient-friendly features. We believe our Inogen One solutions offer the following benefits:
| • | single solution for home, ambulatory, travel and nocturnal treatment, meaning our portable oxygen concentrators do not need to be used with another oxygen solution in the home; |
| • | patented air-dryer and patent-pending user-replaceable sieve beds, both of which are critical to patient satisfaction, product performance, and our cost management; |
| • | clinical validation for nocturnal use, demonstrating the efficacy of our Intelligent Delivery Technology in providing consistent levels of oxygen during sleep despite decreased patient respiratory rates; |
| • | our 4.8 pound Inogen One G3 has at least 50% more flow capacity than other sub-5 pound portable oxygen concentrators, and our 7.0 pound Inogen One G2 has at least 15% more flow capacity than other sub-10 pound portable oxygen concentrators; and |
| • | our systems are designed with multiple user friendly features, including long battery life and low noise-levels in their respective weight categories. |
Our strengths
We believe our products and business model position us well to compete not only against other oxygen device manufacturers, but also to increase our share of the overall oxygen therapy market. We believe we have the following advantages relative to both traditional oxygen therapy providers and other oxygen device manufacturers:
| • | Attractive economic model. Our non-delivery model allows us to receive a premium monthly Medicare reimbursement for deployment of our devices to oxygen patients versus the delivery model. Standard Medicare reimbursement for ambulatory patients using the delivery model is $208.21 per month versus $229.87 per month for our portable oxygen concentrator model, representing a premium of $21.66 per month. A similar premium was maintained in the round one recompete ($19.09 per month) and in the round two ($23.30 per month) competitive bidding areas. In addition, we believe our portable oxygen concentrator technology and direct-to-consumer strategy allow us to provide our solutions through a more efficient cost structure. The delivery model requires ongoing gaseous or liquid oxygen container refills and regular home deliveries with accompanying costs, while our portable oxygen concentrator non-delivery model eliminates oxygen container refills and regular deliveries of oxygen containers and their associated costs. Following the first two rounds of competitive bidding and the round one recompete, we retained access to approximately 90% of the U.S. long-term oxygen therapy market, with the majority of contracts through mid-2016, while many providers were priced out of this market. |
| • | Direct-to-consumer capabilities. We believe our direct-to-consumer strategy enables patient access and retention as well as innovation and investment in our product portfolio. Pursuing a direct-to-consumer strategy requires national accreditation, state-by-state licensing and |
-4-
Table of Contents
| Medicare billing privileges. Given that we are unaware of any manufacturing competitor that currently markets on a direct-to-consumer basis, we do not believe any of these manufacturers possesses the necessary qualification to do so. If any of our manufacturing competitors were to pursue a direct-to-consumer strategy, they would risk negative reaction from the home medical equipment providers that sell their other homecare products, which generally represent significantly larger portions of their businesses than oxygen therapy products. |
| • | Commitment to customer service. We are focused on providing our patients with the highest quality of customer service. We guide them through the reimbursement and physician paperwork process, perform clinical titration and offer 24/7 telephone support, which includes clinical support as required. We have a sustained patient satisfaction rating of approximately 95%, as measured by our customer satisfaction surveys. |
| • | Patient-friendly, single-solution, sub-5 and sub-10 pound portable oxygen concentrators. Our Inogen One G3 and Inogen One G2 portable oxygen concentrators are sub-5 and sub-10 pound portable oxygen concentrators that can operate reliably and cost-effectively to service long-term oxygen therapy patients on a 24/7 basis, similar to a stationary oxygen concentrator or replacement portable oxygen concentrators. The technology in our Inogen One portable oxygen concentrators has been clinically validated for nocturnal use, allowing patients to receive oxygen therapy around the clock from a single device. |
| • | Commitment to research and development and developing intellectual property portfolio. We have a broad patent portfolio covering the design and construction of our oxygen concentrators and system optimization. Additionally, we have made significant investments in research and development and have a robust product pipeline of next-generation oxygen concentrators. |
| • | Management team with proven track record and cost focus. Our management team has built our direct-to-consumer capabilities and launched our two current primary product offerings, Inogen One G2 and Inogen One G3. We continue to realize meaningful product manufacturing cost savings of approximately 36% from our Inogen One G1 to our Inogen One G3 as a result of management’s improvements in design, sourcing and reliability, as well as higher production volumes. |
| • | Revenue growth, profitability and recurring revenue. We have grown our revenue from $10.7 million in 2009 to $48.6 million in 2012, representing a year-over-year growth rate of 58.8%. In 2012, our recurring rental revenue represented 40.9% of sales. Our net loss was $2.6 million in 2009 transitioning to net income of $0.6 million in 2012. |
Our strategy
Our goal is to design, build and market oxygen solutions that redefine how oxygen therapy is delivered. To accomplish this goal, we will continue to invest in our product offerings and our commercial infrastructure to:
| • | expand our sales and marketing channels, including more internal and physician-based salespeople, increased direct-to-consumer advertising and greater international distribution; |
| • | develop innovative products, including next-generation oxygen concentrators and other innovations that improve quality of life; |
-5-
Table of Contents
| • | secure contracts with private payors and Medicaid in order to become in-network with non-Medicare payors, which represent at least 30% of our home oxygen therapy patients, and we believe represent a younger and more active patient population; and |
| • | continue to focus on cost reduction through scalable manufacturing, reliability improvements, asset utilization and service cost reduction. |
Risks associated with our business
Our ability to implement our business strategy is subject to numerous risks that you should be aware of before making an investment decision. These risks are described more fully in the section entitled “Risk factors” immediately following this prospectus summary. These risks include, among others:
| • | A significant majority of our customers have health coverage under the Medicare program, and recently enacted and future changes in the reimbursement rates or payment methodologies under Medicare and other government programs have and could continue to materially and adversely affect our business and operating results; |
| • | The implementation of the competitive bidding process under Medicare could negatively affect our business and financial condition; |
| • | We face intense national, regional and local competition and if we are unable to compete successfully, it could have an adverse effect on our revenue, revenue growth rate, if any, and market share; |
| • | If we are unable to continue to enhance our existing products, develop and market new products that respond to customer needs and preferences and achieve market acceptance, we may experience a decrease in demand for our products and our business could suffer; |
| • | If we fail to expand and maintain an effective sales force or successfully develop our international distribution network, our business, financial condition and operating results may be adversely affected; and |
| • | If we are unable to secure and maintain patent or other intellectual property protection for the intellectual property used in our products, we will lose a significant competitive advantage. |
Corporate history and information
We were incorporated in Delaware in November 2001. Our principal executive offices are located at 326 Bollay Drive, Goleta, California 93117. Our telephone number is (805) 562-0500. Our website address is www.inogen.com. Information contained on the website is not incorporated by reference into this prospectus, and should not be considered to be part of this prospectus.
We use “Inogen,” “Inogen One,” “Inogen One G2,” “Inogen One G3,” “oxygen.anytime.anywhere” and other marks as trademarks in the United States and other countries. This prospectus contains references to our trademarks and service marks and to those belonging to other entities. Solely for convenience, trademarks and trade names referred to in this prospectus, including logos, artwork and other visual displays, may appear without the ® or ™ symbols, but such references are not intended to indicate in any way that we will not assert, to
-6-
Table of Contents
the fullest extent under applicable law, our rights or the rights of the applicable licensor to these trademarks and trade names. We do not intend our use or display of other entities’ trade names, trademarks or service marks to imply a relationship with, or endorsement or sponsorship of us by, any other entity.
-7-
Table of Contents
The offering
| Common stock offered by us |
shares |
| Common stock offered by the selling stockholders |
shares (or shares if the underwriters exercise their option to purchase additional shares from the selling stockholders in full) |
| Common stock to be outstanding after this offering |
shares |
| Use of proceeds |
We intend to use the net proceeds from this offering for investments in rental assets; sales and marketing activities; research and product development activities; for facilities improvements or expansions and the purchase of manufacturing and other equipment; and for working capital and other general corporate purposes. We may also use a portion of our net proceeds to acquire and invest in complementary products, technologies or businesses; however, we currently have no agreements or commitments to complete any such transaction. We will not receive any of the net proceeds from the sale of shares of common stock by the selling stockholders. See “Use of proceeds.” |
| Risk factors |
You should read the “Risk factors” section of this prospectus for a discussion of factors to consider carefully before deciding to invest in shares of our common stock. |
| Proposed NASDAQ Global Market symbol |
“INGN” |
The number of shares of common stock to be outstanding following this offering is based on 14,519,525 shares of common stock outstanding as of September 30, 2013 and excludes:
| • | 2,079,338 shares of common stock issuable upon exercise of options outstanding, 1,466,789 of which were vested and then exercisable, at a weighted average exercise price of $1.0876 per share; |
| • | 276,334 shares of common stock issuable upon the exercise of options to purchase common stock granted after September 30, 2013, at a weighted average exercise price of $8.37 per share; |
| • | 1,074,415 shares of common stock reserved for future grants under our stock-based compensation plans as of the date of this prospectus, consisting of: |
| • | 895,346 shares of common stock reserved for future grants under our 2014 Equity Incentive Plan, which will become effective immediately prior to the date of this prospectus, and any shares subject to stock options under our 2012 Equity Incentive Plan or our 2002 Amended Stock Incentive Plan that expire or otherwise terminate without having been exercised in |
-8-
Table of Contents
| full and any shares issued pursuant to awards granted under such plans that are forfeited to or repurchased by us, with the maximum number of shares to be added to the 2014 Equity Incentive Plan equal to 2,328,659 shares; |
| • | 179,069 shares of common stock reserved for future issuance under of 2014 Employee Stock Purchase Plan, which will become effective immediately prior to the date of this prospectus; and |
| • | Any shares of common stock that become available subsequent to this offering under our 2014 Equity Incentive Plan and 2014 Employee Stock Purchase Plan pursuant to the provisions thereof that automatically increase the shares reserved for issuance under such plans each year, as more fully described in “Executive compensation — Employee benefit and stock plans;” and |
| • | 268,200 shares of common stock issuable upon the exercise of warrants outstanding as of September 30, 2013, at a weighted average exercise price of $1.4216 per share, after conversion of the convertible preferred stock. |
Unless otherwise indicated, this prospectus reflects and assumes the following:
| • | the conversion of all outstanding shares of our convertible preferred stock into an aggregate of 14,218,319 shares of common stock upon the closing of this offering; |
| • | the cash exercise of warrants to purchase an aggregate of 24,588 shares of common stock at a weighted average exercise price of $10.1635 per share, which we expect will occur prior to the closing of this offering as the warrants will otherwise expire at that time; |
| • | the filing of our amended and restated certificate of incorporation immediately upon the closing of this offering; and |
| • | no exercise by the underwriters of their over-allotment option. |
On November 12, 2013, we effected a three-for-one reverse stock split of our outstanding common and preferred stock. This prospectus gives retroactive effect to the split for all periods presented.
-9-
Table of Contents
Summary financial data
We have derived the following summary of statements of operations data for the years ended December 31, 2011 and 2012 from audited financial statements appearing elsewhere in this prospectus. We derived the following statements of operations data for the nine months ended September 30, 2012 and 2013 and the balance sheet data as of September 30, 2013 from unaudited interim financial statements included elsewhere in this prospectus. In the opinion of management, the unaudited financial statements reflect all adjustments, which include only normal recurring adjustments necessary for a fair statement of results of operations and financial position. Historical results are not necessarily indicative of the results that may be expected in the future and the results for the nine months ended September 30, 2013 are not necessarily indicative of the results that may be expected for the full year. The summary financial data set forth below should be read together with the financial statements and the related notes to those statements, as well as the sections of this prospectus captioned “Management’s discussion and analysis of financial condition and results of operations.”
| (amounts in thousands, except
share |
Year
ended December 31, |
Nine
months ended September 30, |
||||||||||||||
| 2011 | 2012 | 2012 | 2013 | |||||||||||||
|
|
||||||||||||||||
| (as restated) | (unaudited) | |||||||||||||||
| Statements of operations: |
||||||||||||||||
| Total revenue |
$ | 30,634 | $ | 48,576 | $ | 34,735 | $ | 55,681 | ||||||||
| Total cost of revenue |
15,930 | 24,627 | 17,821 | 26,865 | ||||||||||||
|
|
|
|||||||||||||||
| Gross profit |
14,704 | 23,949 | 16,914 | 28,816 | ||||||||||||
| Operating expenses |
||||||||||||||||
| Research and development |
1,789 | 2,262 | 1,731 | 1,817 | ||||||||||||
| Selling, general and administrative |
14,637 | 20,858 | 14,558 | 23,088 | ||||||||||||
|
|
|
|||||||||||||||
| Total operating expenses |
16,426 | 23,120 | 16,289 | 24,905 | ||||||||||||
|
|
|
|||||||||||||||
| Income (loss) from operations |
(1,722 | ) | 829 | 625 | 3,911 | |||||||||||
|
|
|
|||||||||||||||
| Total other income (expense), net |
(267 | ) | (247 | ) | (149 | ) | (296 | ) | ||||||||
| Provision for income taxes |
13 | 18 | 20 | 151 | ||||||||||||
|
|
|
|||||||||||||||
| Net (loss) income |
$ | (2,002 | ) | $ | 564 | $ | 456 | $ | 3,464 | |||||||
| Less deemed dividend on redeemable convertible preferred stock |
$ | (3,027 | ) | $ | (5,781 | ) | $ | (4,119 | ) | $ | (5,359 | ) | ||||
|
|
|
|||||||||||||||
| Net loss attributable to common stockholders |
$ | (5,029 | ) | $ | (5,217 | ) | $ | (3,663 | ) | $ | (1,895 | ) | ||||
|
|
|
|||||||||||||||
| Net loss per share attributable to common stockholders—basic and diluted(1) |
$ | (20.15 | ) | $ | (19.97 | ) | $ | (14.02 | ) | $ | (6.91 | ) | ||||
| Weighted average shares used in computing basic and diluted net loss per share(1) |
249,519 | 261,268 | 261,216 | 274,357 | ||||||||||||
| Unaudited pro forma net income per share attributable to common stockholders(1): |
||||||||||||||||
| Basic: |
$ | 0.04 | $ | 0.24 | ||||||||||||
| Diluted: |
$ | 0.04 | $ | 0.22 | ||||||||||||
| Unaudited weighted average shares used in computing pro forma net income per share(1): |
||||||||||||||||
| Basic: |
14,601,861 | 14,516,523 | ||||||||||||||
| Diluted: |
15,486,487 | 15,733,279 | ||||||||||||||
|
|
|
|
|
|||||||||||||
| Other financial data: |
||||||||||||||||
| EBITDA(2) |
$ | 1,357 | $ | 5,971 | $ | 4,224 | $ | 9,913 | ||||||||
| Adjusted EBITDA(2) |
$ | 1,620 | $ | 5,883 | $ | 4,124 | $ | 10,231 | ||||||||
|
|
||||||||||||||||
-10-
Table of Contents
| (1) | See note 2 to each of our audited and unaudited financial statements included elsewhere in this prospectus for an explanation of the calculations of our basic and diluted net loss per share attributable to common stockholders and pro forma net loss per share attributable to common stockholders. |
| (2) | For a discussion of our use of EBITDA and Adjusted EBITDA and their calculations, please see “— Non GAAP financial measures” below. |
| As of September 30, 2013 | ||||||||||||
| (in thousands) | Actual | Pro forma(1) | Pro forma as adjusted(2)(3) |
|||||||||
|
|
||||||||||||
| (unaudited) | ||||||||||||
| Balance sheet data: |
||||||||||||
| Cash and cash equivalents |
$ | 17,059 | $ | 17,309 | $ | |||||||
| Working capital |
12,352 | 12,602 | ||||||||||
| Total assets |
60,862 | 61,112 | ||||||||||
| Preferred stock warrant liability |
201 | 173 | ||||||||||
| Total liabilities |
26,667 | 26,639 | ||||||||||
| Redeemable convertible preferred stock |
116,744 | — | ||||||||||
| Preferred Stock |
247 | — | ||||||||||
| Common Stock |
1 | 15 | ||||||||||
| Additional paid in capital |
— | 117,255 | ||||||||||
| Total stockholders’ (deficit) equity |
(82,549 | ) | 34,473 | |||||||||
|
|
||||||||||||
| (1) | Gives effect to (i) the conversion of all outstanding shares of convertible preferred stock into an aggregate of 14,218,319 shares of common stock upon the closing of this offering, (ii) the cash exercise of warrants to purchase an aggregate of 24,588 shares of common stock, which we expect will occur prior to the closing of this offering as the warrants will otherwise expire at that time, and (iii) the reclassification of our preferred stock warrant liability to additional paid-in-capital upon the closing of this offering. |
| (2) | Gives further effect to our sale of shares of common stock in this offering at an assumed initial public offering price of $ per share, the midpoint of the range reflected on the cover page of this prospectus, after deducting the estimated underwriting discounts and commissions and estimated offering expenses payable by us. |
| (3) | A $1.00 increase (decrease) in the assumed initial public offering price of $ per share, the midpoint of the price range reflected on the cover page of this prospectus, would increase (decrease) each of pro forma as adjusted cash and cash equivalents, working capital, total assets and total stockholders’ equity by approximately $ million, assuming that the number of shares offered by us, as set forth on the cover of this prospectus, remains the same and after deducting estimated underwriting discounts and commissions and estimated offering expenses payable by us. A 1,000,000 share increase (decrease) in the number of shares offered by us would increase (decrease) each of pro forma as adjusted cash and cash equivalents, working capital, total assets and total stockholders’ equity by approximately $ million after deducting estimated underwriting discounts and commissions and any estimated offering expenses payable by us. |
Non-GAAP financial measures
EBITDA and Adjusted EBITDA are financial measures that are not calculated in accordance with generally accepted accounting principles in the United States, or GAAP. We define EBITDA as net income or loss excluding interest income, interest expense, taxes and depreciation and amortization. Adjusted EBITDA also excludes the change in the fair value of our preferred stock warrant liability and stock-based compensation. Below, we have provided a reconciliation of EBITDA and Adjusted EBITDA to our net income or loss, the most directly comparable financial measure calculated and presented in accordance with GAAP. EBITDA and Adjusted EBITDA should not be considered as alternatives to net income or loss or any other measure of financial performance calculated and presented in accordance with GAAP. Our EBITDA and Adjusted EBITDA may not be comparable to similarly titled measures of other organizations because other organizations may not calculate EBITDA and Adjusted EBITDA in the same manner as we calculate these measures.
-11-
Table of Contents
We include EBITDA and Adjusted EBITDA in this prospectus because they are important measures upon which our management assesses our operating performance. We use EBITDA and Adjusted EBITDA as key performance measures because we believe they facilitate operating performance comparisons from period to period by excluding potential differences primarily caused by variations in capital structures, tax positions, the impact of depreciation and amortization expense on our fixed assets, changes related to the fair value remeasurements of our preferred stock warrant, and the impact of stock-based compensation expense. Because EBITDA and Adjusted EBITDA facilitate internal comparisons of our historical operating performance on a more consistent basis, we also use EBITDA and Adjusted EBITDA for business planning purposes, to incentivize and compensate our management personnel, and in evaluating acquisition opportunities. In addition, we believe EBITDA and Adjusted EBITDA and similar measures are widely used by investors, securities analysts, ratings agencies, and other parties in evaluating companies in our industry as a measure of financial performance and debt-service capabilities.
Our use of EBITDA and Adjusted EBITDA have limitations as analytical tools, and you should not consider them in isolation or as a substitute for analysis of our results as reported under GAAP. Some of these limitations are:
| • | EBITDA and Adjusted EBITDA do not reflect our cash expenditures for capital equipment or other contractual commitments; |
| • | Although depreciation and amortization are non-cash charges, the assets being depreciated and amortized may have to be replaced in the future, and EBITDA and Adjusted EBITDA do not reflect capital expenditure requirements for such replacements; |
| • | EBITDA and Adjusted EBITDA do not reflect changes in, or cash requirements for, our working capital needs; |
| • | EBITDA and Adjusted EBITDA do not reflect the interest expense or the cash requirements necessary to service interest or principal payments on our indebtedness; and |
| • | Other companies, including companies in our industry, may calculate EBITDA and Adjusted EBITDA measures differently, which reduces their usefulness as a comparative measure. |
In evaluating EBITDA and Adjusted EBITDA, you should be aware that in the future we will incur expenses similar to the adjustments in this presentation. Our presentation of EBITDA and Adjusted EBITDA should not be construed as an inference that our future results will be unaffected by these expenses or any unusual or non-recurring items. When evaluating our performance, you should consider EBITDA and Adjusted EBITDA alongside other financial performance measures, including our net loss and other GAAP results.
-12-
Table of Contents
The following table presents a reconciliation of EBITDA and Adjusted EBITDA to our net income or loss, the most comparable GAAP measure, for each of the periods indicated:
| EBITDA and adjusted EBITDA | Year ended December 31, |
Nine months ended September 30, |
||||||||||||||
| (in thousands) | 2011 | 2012 | 2012 | 2013 | ||||||||||||
|
|
||||||||||||||||
| Net income (loss) |
$ | (2,002 | ) | $ | 564 | $ | 456 | $ | 3,464 | |||||||
| Non-GAAP adjustments: |
||||||||||||||||
| Interest income |
(113 | ) | (88 | ) | (84 | ) | (9 | ) | ||||||||
| Interest expense |
261 | 493 | 381 | 312 | ||||||||||||
| Provision for income taxes |
13 | 18 | 20 | 151 | ||||||||||||
| Depreciation and amortization |
3,198 | 4,984 | 3,451 | 5,995 | ||||||||||||
|
|
|
|||||||||||||||
| EBITDA |
1,357 | 5,971 | 4,224 | 9,913 | ||||||||||||
| Change in fair value of preferred stock warrant liability |
119 | (148 | ) | (148 | ) | 202 | ||||||||||
| Stock-based compensation |
144 | 60 | 48 | 116 | ||||||||||||
|
|
|
|||||||||||||||
| Adjusted EBITDA |
$ | 1,620 | $ | 5,883 | $ | 4,124 | $ | 10,231 | ||||||||
|
|
||||||||||||||||
-13-
Table of Contents
Investing in our common stock involves a high degree of risk. You should consider carefully the risks and uncertainties described below, together with all of the other information in this prospectus, including our financial statements and related notes, before deciding whether to purchase shares of our common stock. If any of the following risks are realized, our business, financial condition, results of operations and prospects could be materially and adversely affected. In that event, the price of our common stock could decline and you could lose part or all of your investment.
Risks related to our business and strategy
A significant majority of our customers have health coverage under the Medicare program, and recently enacted and future changes in the reimbursement rates or payment methodologies under Medicare and other government programs have affected and could continue to materially and adversely affect our business and operating results.
As a provider of oxygen product rentals, we have historically depended heavily on Medicare reimbursement as a result of the higher proportion of elderly persons suffering from chronic respiratory conditions. Medicare Part B, or Supplementary Medical Insurance Benefits, provides coverage to eligible beneficiaries that includes items of durable medical equipment for use in the home, such as oxygen equipment and other respiratory devices. We believe that more than 60% of oxygen therapy patients in the United States have primary coverage under Medicare Part B. In 2011 and 2012, we derived approximately 26% and 27%, respectively, of our revenue from Medicare. There are increasing pressures on Medicare to control health care costs and to reduce or limit reimbursement rates for home medical products.
Legislation, including the Medicare Prescription Drug, Improvement, and Modernization Act of 2003, the Deficit Reduction Act of 2005, the Medicare Improvements for Patients and Providers Act of 2008, and the Patient Protection and Affordable Care Act, contain provisions that directly impact reimbursement for the durable medical equipment products provided by us:
| • | The Medicare Prescription Drug, Improvement, and Modernization Act of 2003 significantly reduced reimbursement for inhalation drug therapies beginning in 2005, reduced payment amounts for certain durable medical equipment, including oxygen, beginning in 2005, froze payment amounts for other covered home medical equipment items through 2008, established a competitive bidding program for home medical equipment and implemented quality standards and accreditation requirements for durable medical equipment suppliers. |
| • | The Deficit Reduction Act of 2005 limited the total number of continuous rental months for which Medicare will pay for oxygen equipment to 36 months, after which time there is generally no additional reimbursement to the supplier (other than for periodic, in-home maintenance and servicing). The Deficit Reduction Act of 2005 also provided that title of the equipment would transfer to the beneficiary, which was later repealed by the Medicare Improvements for Patients and Providers Act of 2008. For purposes of the rental cap, the Deficit Reduction Act of 2005 provided for a new 36-month rental period that began January 1, 2006 for all oxygen equipment. After the 36th continuous month during which payment is made for the oxygen equipment, the supplier is generally required to continue to furnish the equipment during the period of medical need for the remainder of the useful lifetime of the equipment, provided there are no breaks in service due to medical necessity that exceed 60 days. The reasonable useful lifetime for portable oxygen equipment is 60 months. After 60 months, if the |
-14-
Table of Contents
| patient requests, the rental cycle starts over and a new 36-month capped rental period begins. There are no limits on the number of 60-month cycles over which a Medicare patient may receive benefits and an oxygen therapy provider may receive reimbursement, so long as such equipment continues to be medically necessary for the patient. We anticipate that the Deficit Reduction Act of 2005 oxygen payment rules will continue to negatively affect our net revenue on an ongoing basis, as each month additional customers reach the 36-month capped service period, resulting in potentially two or more years without rental income from these customers. We cannot state with certainty the number of patients in the capped rental period or the potential impact to revenue associated with patients in the capped rental period. |
| • | Medicare Improvements for Patients and Providers Act of 2008 retroactively delayed the implementation of competitive bidding for 18 months from previously established dates and decreased the 2009 fee schedule payment amounts by 9.5% for product categories included in competitive bidding. In addition to the 9.5% reduction under Medicare Improvements for Patients and Providers Act of 2008, the Centers for Medicare & Medicaid Services implemented a reduction to the monthly payment amount for stationary oxygen equipment by 2.3% in 2009 and 1.5% in 2010, which reduced the monthly payment rate to $175.79 and $173.17 in 2009 and 2010, respectively. The stationary oxygen payment rate for 2011 and 2012 was increased by 0.1%, 1.6%, and 0.7% in 2011, 2012, and 2013, respectively, thereby increasing the monthly payment rate to $173.31, $176.06, and $177.36 in 2011, 2012, and 2013, respectively. The monthly payment rate for non-delivery ambulatory oxygen in the relevant period was flat at $51.63. |
| • | The Patient Protection and Affordable Care Act includes, among other things, a deductible excise tax on any entity that manufactures or imports medical devices offered for sale in the United States, with limited exceptions including oxygen products such as ours, which began in 2013; new face-to-face physician encounter requirements for durable medical equipment and home health services; and a requirement that by 2016, the competitive bidding process must be nationalized or prices in non-competitive bidding areas must be adjusted to match competitive bidding prices. |
These legislative provisions, as currently in effect and when fully implemented, have had and will continue to have a material and adverse effect on our business, financial condition and operating results.
Due to budgetary shortfalls, many states are considering, or have enacted, cuts to their Medicaid programs. These cuts have included, or may include, elimination or reduction of coverage for our products, amounts eligible for payment under co-insurance arrangements, or payment rates for covered items. Continued state budgetary pressures could lead to further reductions in funding for the reimbursement for our products which, in turn, would adversely affect our business, financial conditions, and results of operations.
The implementation of the competitive bidding process under Medicare could negatively affect our business and financial condition.
The Medicare Prescription Drug, Improvement, and Modernization Act of 2003 required the Secretary of Health and Human Services to establish and implement programs under which competitive acquisition areas are established throughout the United States for purposes of awarding contracts for the furnishing of competitively priced items of durable medical equipment, including oxygen equipment.
-15-
Table of Contents
The Centers for Medicare & Medicaid Services, the agency responsible for administering the Medicare program, conducts a competition for each competitive acquisition area under which providers submit bids to supply certain covered items of durable medical equipment. Successful bidders must meet certain program quality standards in order to be awarded a contract and only successful bidders can supply the covered items to Medicare beneficiaries in the acquisition area. There are, however, regulations in place that allow non-contracted providers to continue to provide products and services to their existing customers at the new competitive bidding payment amounts. The contracts are expected to be re-bid every three years. The Centers for Medicare & Medicaid Services is required to award contracts to multiple entities submitting bids in each area for an item or service, but has the authority to limit the number of contractors in a competitive acquisition area to the number it determines to be necessary to meet projected demand.
Although the Centers for Medicare & Medicaid Services concluded the bidding process for the first round of Metropolitan Statistical Areas in September 2007, in July 2008, Congress enacted Medicare Improvements for Patients and Providers Act of 2008, which retroactively delayed the implementation of competitive bidding. Medicare Improvements for Patients and Providers Act of 2008 also reduced Medicare prices nationwide by 9.5% beginning in 2009 for the product categories, including oxygen, that were initially included in competitive bidding.
In 2009, the Centers for Medicare & Medicaid Services implemented a new bidding process in nine Metropolitan Statistical Areas, covering approximately 9% of the Medicare oxygen market. Reimbursement rates from the re-bidding process were publicly released by the Centers for Medicare & Medicaid Services on June 30, 2010. The Centers for Medicare & Medicaid Services announced average savings of approximately 35% off the current standard Medicare payment rates in effect for the product categories included in competitive bidding. As of January 1, 2011, these payment rates were in effect in the nine markets only. We were offered six three-year contracts to provide oxygen equipment in six of the nine markets, and we accepted and signed those contracts.
The Centers for Medicare & Medicaid Services implemented the second phase of competitive bidding in an additional 100 competitive bidding areas covering approximately 50% of the Medicare oxygen market, with three-year contracts effective July 1, 2013. The Centers for Medicare & Medicaid Services announced average savings of approximately 45% off the current standard Medicare payment rates in effect for the product categories included in competitive bidding. As of July 1, 2013, these payment rates were in effect in the 100 competitive bidding areas. We were offered 89 contracts to provide oxygen equipment in 89 of the 100 Competitive Bidding Areas, and we accepted and signed those contracts.
Round one re-competes are expected or planned to go into effect in January 2014; reimbursement rates from the re-bidding process were publicly released by the Centers for Medicare & Medicaid Services on October 1, 2013. The Centers for Medicare & Medicaid Services announced average savings of approximately 37% off the current standard Medicare payment rates in effect from the product categories included in competitive bidding. We were offered 3 contracts to provide respiratory equipment in 3 of the 9 competitive bidding areas, and we accepted and signed those contracts. We are required to be able to supply additional respiratory products such as sleep and aerosol therapy, which have lower margins than our existing products. This could have a negative impact on our financial conditions and results of operations.
-16-
Table of Contents
The Patient Protection and Affordable Care Act legislation requires the Centers for Medicare & Medicaid Services to expand competitive bidding further to additional geographic markets or to use competitive bid pricing information to adjust the payment amounts otherwise in effect for areas that are not competitive acquisition areas by January 1, 2016.
Although we continue to monitor developments regarding the implementation of the competitive bidding program, we cannot predict the outcome of the competitive bidding program on our business when fully implemented, nor the Medicare payment rates that will be in effect in future years for the items subjected to competitive bidding, including our products. We expect that the stationary oxygen and non-delivery ambulatory oxygen payment rates will continue to fluctuate, and a large negative payment adjustment could adversely affect our business, financial conditions and results of operations.
We face intense national, regional and local competition and if we are unable to compete successfully, it could have an adverse effect on our revenue, revenue growth rate, if any, and market share.
The oxygen therapy market is a highly competitive industry. We compete with a number of manufacturers and distributors of portable oxygen concentrators, as well as providers of other oxygen therapy solutions such as home delivery of oxygen tanks or cylinders.
Our significant manufacturing competitors are Invacare Corporation, Respironics (a subsidiary of Koninklijke Philips N.V.), AirSep Corporation and SeQual Technologies (subsidiaries of Chart Industries, Inc.), Inova Labs, Inc. and DeVilbiss Healthcare. Given the relatively straightforward regulatory path in the oxygen therapy device manufacturing market, we expect that the industry will become increasingly competitive in the future. Manufacturing companies compete for sales to providers primarily on the basis of product features, service and price.
Lincare Inc., Apria Healthcare, Inc. Rotech Healthcare, Inc. and American HomePatient, Inc. are among the market leaders in providing oxygen therapy for many years, while the remaining oxygen therapy market is serviced by local providers. Because many oxygen therapy providers were either excluded from contracts in the Medicare competitive bidding process, or will have difficulty providing service at the prevailing Medicate reimbursement rates, we expect more industry consolidation. Oxygen therapy providers compete primarily on the basis of product features and service, rather than price, since reimbursement levels are established by Medicare and Medicaid, or by the individual determinations of private payors.
Some of our competitors are large, well-capitalized companies with greater resources than we have. As a consequence, they are able to spend more aggressively on product development, marketing, sales and other product initiatives than we can. Some of these competitors have:
| • | significantly greater name recognition; |
| • | established relations with healthcare professionals, customers and third-party payors; |
| • | established distribution networks; |
| • | additional lines of products, and the ability to offer rebates or bundle products to offer higher discounts or other incentives to gain a competitive advantage; |
| • | greater history in conducting research and development, manufacturing, marketing and obtaining regulatory approval for oxygen device products; and |
-17-
Table of Contents
| • | greater financial and human resources for product development, sales and marketing, patent litigation and customer financing. |
As a result, our competitors may be able to respond more quickly and effectively than we can to new or changing opportunities, technologies, standard regulatory and reimbursement development and customer requirements. In light of these advantages that our competitors maintain, even if our technology and direct-to-consumer distribution strategy is more effective than the technology and distribution strategy of our competitors, current or potential customers might accept competitor products and services in lieu of purchasing our products. We anticipate that we will face increased competition in the future as existing companies and competitors develop new or improved products and distribution strategies and as new companies enter the market with new technologies and distribution strategies. We may not be able to compete effectively against these organizations. Our ability to compete successfully and to increase our market share is dependent upon our reputation for providing responsive, professional and high-quality products and services and achieving strong customer satisfaction. Increased competition in the future could adversely affect our revenue, revenue growth rate, margins and market share.
Healthcare reform measures may have a material adverse effect on our business and results of operations.
In the United States, the legislative landscape, particularly as it relates to healthcare regulation and reimbursement coverage, continues to evolve. In March 2010, the Patient Protection and Affordable Care Act was passed, which has the potential to substantially change health care financing by both governmental and private insurers, and significantly impact the U.S. medical device industry. As discussed above, the Patient Protection and Affordable Care Act, among other things, imposes a new excise tax, which began in 2013, on entities that manufacture, produce or import medical devices in an amount equal to 2.3% of the price for which such devices are sold in the United States, however oxygen products such as ours were exempt. In addition, as discussed above, the Patient Protection and Affordable Care Act also expands the round two of competitive bidding to a total of 91 competitive bidding areas, and by 2016, the process must be nationalized or prices in non-competitive bidding areas must be adjusted to match competitive bidding prices.
In addition, other legislative changes have been proposed and adopted in the United States since the Patient Protection and Affordable Care Act was enacted. On August 2, 2011, the Budget Control Act of 2011 among other things, created measures for spending reductions by Congress. A Joint Select Committee on Deficit Reduction, tasked with recommending a targeted deficit reduction of at least $1.2 trillion for the years 2013 through 2021, was unable to reach required goals, thereby triggering the legislation’s automatic reduction to several government programs. This includes aggregate reductions of Medicare payments to providers up to 2% per fiscal year, which went into effect on April 1, 2013. On January 2, 2013, President Obama signed into law the American Taxpayer Relief Act of 2012 which, among other things, further reduced Medicare payments to certain providers, including physicians, hospitals, imaging centers and cancer treatment centers, and increased the statute of limitations period for the government to recover overpayments to providers from three to five years. We expect that additional state and federal healthcare reform measures will be adopted in the future, any of which could limit the amounts that federal and state governments will pay for healthcare products and services, which could result in reduced demand for our products or additional pricing pressures.
-18-
Table of Contents
If we are unable to continue to enhance our existing products and develop and market new products that respond to customer needs and preferences and achieve market acceptance, we may experience a decrease in demand for our products and our business could suffer.
We may not be able to compete as effectively with our competitors, and ultimately satisfy the needs and preferences of our customers, unless we can continue to enhance existing products and develop new innovative products. Product development requires significant financial, technological, and other resources. While we expended $1.8 million and $2.3 million for research and development efforts in 2011 and 2012, respectively, we cannot assure you that this level of investment in research and development will be sufficient to maintain a competitive advantage in product innovation, which could cause our business to suffer. Product improvements and new product introductions also require significant planning, design, development, and testing at the technological, product, and manufacturing process levels and we may not be able to timely develop product improvements or new products. Our competitors’ new products may beat our products to market, be more effective with more features, obtain better market acceptance, or render our products obsolete. Any new products that we develop may not receive market acceptance or otherwise generate any meaningful sales or profits for us relative to our expectations based on, among other things, existing and anticipated investments in manufacturing capacity and commitments to fund advertising, marketing, promotional programs, and research and development.
We depend upon reimbursement from Medicare, private payors and Medicaid for a significant portion of our revenue, and if we fail to manage the complex and lengthy reimbursement process, our business and operating results could suffer.
A significant portion of our revenue is derived from reimbursement by third-party payors. We accept assignment of insurance benefits from customers and, in a majority of cases, invoice and collect payments directly from Medicare, private payors and Medicaid, as well as from customers under co-payment provisions. In 2012, approximately 41% of our revenue was derived from Medicare, private payors and Medicaid, and the balance directly from individual customers and commercial entities.
Our financial condition and results of operations may be affected by the health care industry’s reimbursement process, which is complex and can involve lengthy delays between the time that a product is delivered to the consumer and the time that the reimbursement amounts are settled. Depending on the payor, we may be required to obtain certain payor-specific documentation from physicians and other health care providers before submitting claims for reimbursement. Certain payors have filing deadlines and they will not pay claims submitted after such time. We are also subject to extensive pre-payment and post-payment audits by governmental and private payors that could result in material delays, refunds of monies received or denials of claims submitted for payment under such third-party payor programs and contracts. We cannot ensure that we will be able to continue to effectively manage the reimbursement process and collect payments for our products promptly. If we fail to manage the complex and lengthy reimbursement process, it would adversely affect our business, financial conditions, and results of operations.
-19-
Table of Contents
Failure to obtain private payor contracts and future reductions in reimbursement rates from private payors could have a material adverse effect on our financial condition and operating results.
A portion of our revenue is derived from private payors. Based on our patient population, we estimate at least 30% of potential customers have non-Medicare insurance coverage, and we believe these patients represent a younger and more active patient population that will be drawn to the quality-of-life benefits of our solution. Failing to maintain and obtain private payor contracts from private insurance companies and employers and secure in-network provider status could have a material adverse effect on our financial condition and operating results. In addition, private payors are under pressure to increase profitability and reduce costs. In response, certain private payors are limiting coverage or reducing reimbursement rates for the products we provide. We believe that private payor reimbursement levels will generally be reset in accordance with the Medicare payment amounts determined by competitive bidding. We cannot predict the extent to which reimbursement for our products will be affected by competitive bidding or by initiatives to reduce costs for private payors. Failure to obtain or maintain private payor contracts or the unavailability of third-party coverage or inadequacy of reimbursement for our products would adversely affect our business, financial conditions, and results of operations.
We obtain some of the components, subassemblies and completed products included in our Inogen One systems from a single source or a limited group of manufacturers or suppliers, and the partial or complete loss of one of these manufacturers or suppliers could cause significant production delays, an inability to meet customer demand and a substantial loss in revenue.
We utilize single source suppliers for some of the components and subassemblies we use in our Inogen One systems. We have qualified alternate sources of supply sufficient to support future needs and we have taken other mitigating steps to reduce the impact of a change in supplier; however, there may be delays in switching to these alternative suppliers if our primary source is terminated without notice. Our dependence on single source suppliers of components may expose us to several risks, including, among other things:
| • | Our suppliers may encounter financial hardships as a result of unfavorable economic and market conditions unrelated to our demand for components, which could inhibit their ability to fulfill our orders and meet our requirements; |
| • | Suppliers may fail to comply with regulatory requirements, be subject to lengthy compliance, validation or qualification periods, or make errors in manufacturing components that could negatively affect the efficacy or safety of our products or cause delays in supplying of our products to our customers; |
| • | Newly identified suppliers may not qualify under the stringent regulatory standards to which our business is subject; |
| • | We or our suppliers may not be able to respond to unanticipated changes in customer orders, and if orders do not match forecasts, we or our suppliers may have excess or inadequate inventory of materials and components; |
| • | We may be subject to price fluctuations due to a lack of long-term supply arrangements for key components; |
| • | We may experience delays in delivery by our suppliers due to changes in demand from us or their other customers; |
-20-
Table of Contents
| • | We or our suppliers may lose access to critical services and components, resulting in an interruption in the manufacture, assembly and shipment of our systems; |
| • | Our suppliers may be subject to allegations by other parties of misappropriation of proprietary information in connection with their supply of products to us, which could inhibit their ability to fulfill our orders and meet our requirements; |
| • | Fluctuations in demand for products that our suppliers manufacture for others may affect their ability or willingness to deliver components to us in a timely manner; |
| • | Our suppliers may wish to discontinue supplying components or services to us; and |
| • | We may not be able to find new or alternative components or reconfigure our system and manufacturing processes in a timely manner if the necessary components become unavailable. |
In addition, we may be deemed to manufacture or contract to manufacture products that contain certain minerals that have been designated as “conflict minerals” under the Dodd-Frank Wall Street Reform and Consumer Protection Act. As a result, in future periods, we may be required to diligence the origin of such minerals and disclose and report whether or not such minerals originated in the Democratic Republic of the Congo or adjoining countries. The implementation of these new requirements could adversely affect the sourcing, availability, and pricing of minerals used in the manufacture of our products. In addition, we may incur additional costs to comply with the disclosure requirements, including costs related to determining the source of any of the relevant minerals and metals used in our products.
If any of these risks materialize, costs could significantly increase and our ability to meet demand for our products could be impacted. If we are unable to satisfy commercial demand for our Inogen One systems in a timely manner, our ability to generate revenue would be impaired, market acceptance of our products could be adversely affected, and customers may instead purchase or use alternative products. In addition, we could be forced to secure new or alternative components and subassemblies through a replacement supplier. Finding alternative sources for these components and subassemblies could be difficult in certain cases and may entail a significant amount of time and disruption. In some cases, we would need to change the components or subassemblies if we sourced them from an alternative supplier. This, in turn, could require a redesign of our Inogen One systems and, potentially, require additional FDA clearance or approval before we could use any redesigned product with new components or subassemblies, thereby causing further costs and delays that could adversely affect our business, financial condition and operating results.
We do not have long-term supply contracts with many of our third-party suppliers.
We purchase components and subassemblies from third-party suppliers, including some of our single source suppliers, through purchase orders and do not have long-term supply contracts with many of these third-party suppliers. Many of our third-party suppliers, therefore, are not obligated to perform services or supply products to us for any specific period, in any specific quantity or at any specific price, except as may be provided in a particular purchase order. We do not maintain large volumes of inventory from most of these suppliers. If we inaccurately forecast demand for components or subassemblies, our ability to manufacture and commercialize our Inogen One systems could be delayed and our competitive position and reputation could be harmed. In addition, if we fail to effectively manage our relationships with these suppliers, we may be required to change suppliers which would be time consuming and disruptive and could adversely affect our business, financial condition and operating results.
-21-
Table of Contents
If we fail to comply with U.S. export control and economic sanctions or fail to expand and maintain an effective sales force or successfully develop our international distribution network, our business, financial condition and operating results may be adversely affected.
We currently derive the majority of our revenue from rentals or sales generated from our own direct sales force. Failure to maintain or expand our direct sales force could adversely impact our financial and operating performance. Additionally, we use international distributors to augment our sales efforts, certain of which are exclusive distributors in certain foreign countries. We cannot assure you that we will be able to successfully develop our relationships with third-party distributors internationally. In addition, we are subject to United States export control and economic sanctions laws relating to the sale of our products, the violation of which could result in substantial penalties being imposed against us. In particular, we have secured annual export licenses from the U.S. Treasury Department’s Office of Foreign Assets Control to sell our products to a distributor and hospital and clinic end-users in Iran. The use of this license requires us to observe strict conditions with respect to products sold, end-user limitations and payment requirements. Although we believe we have maintained compliance with license requirements, there can be no assurance that the license will not be revoked, be renewed in the future or that we will remain in compliance. More broadly, if we fail to comply with export control laws or successfully develop our relationship with international distributors, our sales could fail to grow or could decline, and our ability to grow our business could be adversely affected. Distributors that are in the business of selling other medical products may not devote a sufficient level of resources and support required to generate awareness of our products and grow or maintain product sales. If our distributors are unwilling or unable to market and sell our products, or if they do not perform to our expectations, we could experience delayed or reduced market acceptance and sales of our products.
We may be subject to substantial warranty or product liability claims or other litigation in the ordinary course of business that may adversely affect our business, financial condition and operating results.
As manufacturers of medical devices, we may be subject to substantial warranty or product liability claims or other litigation in the ordinary course of business that may require us to make significant expenditures to defend these claims or pay damage awards. For example, our Inogen One systems contain lithium ion batteries, which, under certain circumstances, can be a fire hazard. We, as well as our key suppliers, maintain product liability insurance, but this insurance is limited in amount and subject to significant deductibles. There is no guarantee that insurance will be available or adequate to protect against all claims. Our insurance policies are subject to annual renewal and we may not be able to obtain liability insurance in the future on acceptable terms or at all. In addition, our insurance premiums could be subject to increases in the future, which may be material. If the coverage limits are inadequate to cover our liabilities or our insurance costs continue to increase as a result of warranty or product liability claims or other litigation, then our business, financial condition and operating results may be adversely affected.
Increases in our operating costs could have a material adverse effect on our business, financial condition and operating results.
Reimbursement rates are established by fee schedules mandated by Medicare, private payors and Medicaid are likely to remain constant or decrease due, in part, to federal and state government budgetary constraints. As a result, with respect to Medicare and Medicaid related revenue, we
-22-
Table of Contents
are not able to offset the effects of general inflation on our operating costs through increases in prices for our products. In particular, labor and related costs account for a significant portion of our operating costs and we compete with other health care providers to attract and retain qualified or skilled personnel and with various industries for administrative and service employees. This competitive environment could result in increased labor costs. As such, we must control our operating costs, particularly labor and related costs, and failing to do so could adversely affect our financial conditions and results of operations.
We depend on the services of our senior executives and other key technical personnel, the loss of whom could negatively affect our business.
Our success depends upon the skills, experience and efforts of our senior executives and other key technical personnel, including certain members of our engineering staff, and our sales and marketing executives. Much of our corporate expertise is concentrated in relatively few employees, the loss of which for any reason could negatively affect our business. Competition for our highly skilled employees is intense and we cannot prevent the resignation of any employee. We do not maintain “key man” life insurance on any of our senior executives. None of our senior executive team is bound by written employment contracts to remain with us for a specified period. In addition, we have not entered into non-compete agreements with members of our senior management team. The loss of any member of our senior management team could harm our ability to implement our business strategy and respond to the market conditions in which we operate.
We have incurred losses since inception until fiscal year 2012, and we have only recently achieved profitability.
We have a limited operating history and have incurred significant net losses in each fiscal year until fiscal year 2012, when we achieved positive net income. As of September 30, 2013, we had an accumulated deficit of $82.5 million. These net losses have resulted principally from costs incurred in our research and development programs and from our selling, general and administrative expenses. We expect to incur increases in expenses for research and development and significant expansion of our sales and marketing capabilities. Additionally, following this offering, we expect that our selling, general and administrative expenses will increase due to the additional operational and reporting costs associated with being a public company. Because of the numerous risks and uncertainties associated with our commercialization efforts and future product development, we are unable to predict if we will maintain or increase our net income.
Our financial results may vary significantly from quarter-to-quarter due to a number of factors, which may lead to volatility in our stock price.
Our quarterly revenue and results of operations have varied in the past and may continue to vary significantly from quarter-to-quarter. This variability may lead to volatility in our stock price as research analysts and investors respond to these quarterly fluctuations. These fluctuations are due to numerous factors, including: fluctuations in consumer demand for our products; seasonal cycles in consumer spending; our ability to design, manufacture and deliver products to our consumers in a timely and cost-effective manner; quality control problems in our manufacturing operations; our ability to timely obtain adequate quantities of the components used in our products; new product introductions and enhancements by us and our competitors; unanticipated increases in costs or expenses; and fluctuations in foreign currency exchange rates.
-23-
Table of Contents
For example, we typically experience higher sales in the second quarter, as a result of consumers traveling and vacationing during the summer months. The foregoing factors are difficult to forecast, and these, as well as other factors, could materially and adversely affect our quarterly and annual results of operations. In addition, a significant amount of our operating expenses are relatively fixed due to our manufacturing, research and development, and sales and general administrative efforts. Any failure to adjust spending quickly enough to compensate for a revenue shortfall could magnify the adverse impact of such revenue shortfall on our results of operations. Our results of operations may not meet the expectations of research analysts or investors, in which case the price of our common stock could decrease significantly.
The terms of our revolving credit and term loan agreement may restrict our current and future operations, and could affect our ability to respond to changes in our business and to manage our operations.
We are parties to an amended and restated revolving credit and term loan agreement with Comerica Bank as administrative agent, which we refer to as our revolving credit and term loan agreement. The agreement provides for a previously existing term loan in the amount of $3.0 million, another previously existing term loan in the amount of $8.0 million and a new term loan facility in the amount of $12.0 million. As of September 30, 2013, we had term loan borrowings outstanding under the agreement of $11.1 million, which included $0.7 million and $4.4 million under the pre-existing term loans, and $6.0 million under the new term loan. The agreement also provides for a $1.0 million revolving line of credit, none of which was outstanding as of September 30, 2013. The revolver expired on October 13, 2013 and we have no plans to renew or replace it. The agreement is secured by all or substantially all of our assets.
Pursuant to the agreement, we are subject to certain financial covenants relating to liquidity, debt service, and leverage ratios. The liquidity ratio is the ratio of (i) liquidity (cash plus eligible accounts receivable) to (ii) the current portion of all indebtedness owed to the lenders. The debt service coverage ratio is the ratio on a basis of (a) Adjusted EBITDA, less (i) cash capital expenditures (including rental equipment) and (ii) taxes paid or payable, to (b) the sum of cash principal payments plus interest expense paid or payable, all such items in clauses (a) and (b) measured on an annualized trailing six (6) months basis; provided that cash capital expenditures shall not be subtracted from clause (a) hereof so long as we maintain at least $1.5 million in unrestricted cash during the entire relevant fiscal period. The senior leverage ratio is the ratio of (a) funded debt basis to (b) Adjusted EBITDA measured on an annualized trailing six (6) months basis.
The agreement contains events of default customary for transactions of this type, including nonpayment, misrepresentation, breach of covenants, material adverse effect and bankruptcy. As of September 30, 2013, we had no outstanding balance under the revolving line of credit and an outstanding balance of $11.1 million under the term loan. In the event we fail to satisfy our covenants, or otherwise go into default, Comerica Bank has a number of remedies, including sale of our assets and acceleration of all outstanding indebtedness. Certain of these remedies would likely have a material adverse effect on our business. As of September 30, 2013, in order to be in compliance with the liquidity requirements, debt service ratios, and leverage ratios of existing debt obligations, we were required to maintain $2.5 million in unaudited Adjusted EBITDA in the previous six months, and we had $6.6 million in actual unaudited Adjusted EBITDA, and $7.8 million of cash and qualified accounts receivable, and we had $17.1 million of actual cash.
-24-
Table of Contents
An adverse outcome of a sales and use tax audit could have a material adverse effect on our results of operations and financial condition.
The California State Board of Equalization conducted a sales and use tax audit of our operations in California in 2008. As a result of the audit, the California State Board of Equalization confirmed that our sales are not subject to California sales and use tax. We believe that our sales in other states should not be subject to sales and use tax. There can be no assurance, however, that other states may agree with our position and we may be subject to an audit that may not be resolved in our favor. Such an audit could be expensive and time-consuming and result in substantial management distraction. If the matter were to be resolved in a manner adverse to us, it could have a material adverse effect on our results of operations and financial position.
Our ability to use net operating losses to offset future taxable income may be subject to certain limitations.
As of December 31, 2012, we had federal net operating loss carryforwards, or NOLs, of approximately $62.0 million, which expire in various years beginning in 2022, if not utilized. In general, under Section 382 of the Internal Revenue Code of 1986, as amended, or the Code, a corporation that undergoes an “ownership change” is subject to limitations on its ability to utilize its pre-change NOLs to offset future taxable income. In general, an “ownership change” occurs if there is a cumulative change in our ownership by “5% shareholders” that exceeds 50 percentage points over a rolling three-year period. Our existing NOLs may be subject to limitations arising from previous ownership changes, and if we undergo one or more ownership changes in connection with this offering or future transactions in our stock, our ability to utilize NOLs could be further limited by Section 382 of the Code. As a result of these limitations, we may not be able to utilize a material portion of the NOLs reflected on our balance sheet and for this reason, we have fully reserved against the value of our NOLs on our balance sheet.
Risks related to the regulatory environment
We are subject to extensive federal and state regulation, and if we fail to comply with applicable regulations, we could suffer severe criminal or civil sanctions or be required to make significant changes to our operations that could adversely affect our business, financial condition and operating results.
The federal government and all states in which we currently operate regulate various aspects of our business. In particular, our sales and customer service centers are subject to federal laws that regulate interstate motor-carrier transportation. Our operations also are subject to state laws governing, among other things, distribution of medical equipment and certain types of home health activities, and we are required to obtain and maintain licenses in each state to act as a durable medical equipment supplier. Certain of our employees are subject to state laws and regulations governing the professional practices of respiratory therapy.
As a health care provider participating in governmental healthcare programs, we are subject to laws directed at preventing fraud and abuse, which subject our marketing, billing, documentation and other practices to government scrutiny. To ensure compliance with Medicare, Medicaid and other regulations, government agencies or their contractors often conduct routine audits and request customer records and other documents to support our claims submitted for payment of services rendered. Government agencies or their contractors also periodically open investigations and obtain information from health care providers. Violations of federal and state
-25-
Table of Contents
regulations can result in severe criminal, civil and administrative penalties and sanctions, including debarment, suspension or exclusion from Medicare, Medicaid and other government reimbursement programs, any of which would have a material adverse effect on our business.
Changes in healthcare laws and regulations and new interpretations of existing laws and regulations may affect permissible activities, the relative costs associated with doing business, and reimbursement amounts paid by federal, state and other third-party payors. There have been and will continue to be regulatory initiatives affecting our business and we cannot predict the extent to which future legislation and regulatory changes could have a material adverse effect on our business.
We are subject to burdensome and complex billing and record-keeping requirements in order to substantiate our claims for payment under Federal, state and commercial health care reimbursement programs, and our failure to comply with existing requirements, or changes in those requirements or interpretations thereof, could adversely affect our business, financial condition and operating results.
We are subject to burdensome and complex billing and record-keeping requirements in order to substantiate our claims for payment under federal, state and commercial health care reimbursement programs. Our records also are subject to routine and other reviews by third-party payors, which can result in delays in payments or refunds of paid claims. For example, we have also experienced a significant increase in pre-payment reviews of our claims by the Durable Medical Equipment Medicare Administrative Contractors, which has caused substantial delays in the collection of our Medicare accounts receivable as well as related amounts due under supplemental insurance plans.
Current law provides for a significant expansion of the government’s auditing and oversight of suppliers who care for patients covered by various government health care programs. Examples of this expansion include audit programs being implemented by the Durable Medical Equipment Medicare Administrative Contractors, the Zone Program Integrity Contractors, the Recovery Audit Contractors, and the Comprehensive Error Rate Testing contractors, operating under the direction of the Centers for Medicare & Medicaid Services.
We have been informed by these auditors that health care providers and suppliers of certain durable medical equipment product categories are expected to experience further increased scrutiny from these audit programs. When a government auditor ascribes a high billing error rate to one or more of our locations, it generally results in protracted pre-payment claims review, payment delays, refunds and other payments to the government and/or our need to request more documentation from providers than has historically been required. It may also result in additional audit activity in other company locations in that state or Durable Medical Equipment Medicare Administrative Contractors jurisdiction. We cannot currently predict the adverse impact that these audits, methodologies and interpretations might have on our business, financial condition or operating results, but such impact could be material.
-26-
Table of Contents
We are subject to significant regulation by numerous government agencies, including the U.S. Food and Drug Administration, or FDA. We cannot market or commercially distribute our products without obtaining and maintaining necessary regulatory clearances or approvals.
Our Inogen One systems are medical devices subject to extensive regulation in the United States and in the foreign markets where we distribute our products. The FDA and other U.S. and foreign governmental agencies regulate, among other things, with respect to medical devices:
| • | design, development and manufacturing; |
| • | testing, labeling, content and language of instructions for use and storage; |
| • | clinical trials; |
| • | product safety; |
| • | marketing, sales and distribution; |
| • | pre-market clearance and approval; |
| • | record keeping procedures; |
| • | advertising and promotion; |
| • | recalls and field safety corrective actions; |
| • | post-market surveillance, including reporting of deaths or serious injuries and malfunctions that, if they were to recur, could lead to death or serious injury; |
| • | post-market approval studies; and |
| • | product import and export. |
Before we can market or sell a medical device in the United States, we must obtain either clearance from the FDA under Section 510(k) of the Federal Food, Drug, and Cosmetic Act, or the FDCA, or approval of a pre-market approval, application from the FDA, unless an exemption from pre-market review applies. In the 510(k) clearance process, the FDA must determine that a proposed device is “substantially equivalent” to a device legally on the market, known as a “predicate” device, with respect to intended use, technology and safety and effectiveness, in order to clear the proposed device for marketing. Clinical data is sometimes required to support substantial equivalence. The pre-market approval pathway requires an applicant to demonstrate the safety and effectiveness of the device based, in part, on extensive data, including, but not limited to, technical, preclinical, clinical trial, manufacturing and labeling data. The pre-market approval process is typically required for devices that are deemed to pose the greatest risk, such as life-sustaining, life-supporting or implantable devices. Products that are approved through a pre-market approval application generally need FDA approval before they can be modified. Similarly, some modifications made to products cleared through a 510(k) may require a new 510(k). Both the 510(k) and pre-market approval processes can be expensive and lengthy and require the payment of significant fees, unless an exemption applies. The FDA’s 510(k) clearance process usually takes from three to 12 months, but may take longer. The process of obtaining a pre-market approval is much more costly and uncertain than the 510(k) clearance process and generally takes from one to three years, or longer, from the time the application is submitted to the FDA until an approval is obtained. The process of obtaining regulatory clearances or approvals to market a medical device can be costly and time consuming, and we may not be able to obtain these clearances or approvals on a timely basis, if at all.
-27-
Table of Contents
In the United States, our currently commercialized products are marketed pursuant to pre-market clearance under Section 510(k) of the FDCA. If the FDA requires us to go through a lengthier, more rigorous examination for future products or modifications to existing products than we had expected, our product introductions or modifications could be delayed or canceled, which could cause our sales to decline. In addition, the FDA may determine that future products will require the more costly, lengthy and uncertain pre-market approval process. Although we do not currently market any devices under a pre-market approval, the FDA may demand that we obtain a pre-market approval prior to marketing certain of our future products. In addition, if the FDA disagrees with our determination that a product we currently market is subject to an exemption from pre-market review, the FDA may require us to submit a 510(k) or pre-market approval application in order to continue marketing the product. Further, even with respect to those future products where a pre-market approval is not required, we cannot assure you that we will be able to obtain the 510(k) clearances with respect to those products.
The FDA can delay, limit or deny clearance or approval of a device for many reasons, including:
| • | we may not be able to demonstrate to the FDA’s satisfaction that our products are safe and effective for their intended users; |
| • | the data from our pre-clinical studies and clinical trials may be insufficient to support clearance or approval, where required; and |
| • | the manufacturing process or facilities we use may not meet applicable requirements. |
In addition, the FDA may change its clearance and approval policies, adopt additional regulations or revise existing regulations, or take other actions which may prevent or delay approval or clearance of our products under development or impact our ability to modify our currently approved or cleared products on a timely basis. For example, in response to industry and healthcare provider concerns regarding the predictability, consistency and rigor of the 510(k) regulatory pathway, the FDA initiated an evaluation of the program, and in January 2011, announced several proposed actions intended to reform the review process governing the clearance of medical devices. The FDA intends these reform actions to improve the efficiency and transparency of the clearance process, as well as bolster patient safety. Some of these proposals, if enacted, could impose additional regulatory requirements upon us which could delay our ability to obtain new 510(k) clearances, increase the costs of compliance or restrict our ability to maintain our current clearances. In addition, as part of the Food and Drug Administration Safety and Innovation Act, Congress reauthorized the Medical Device User Fee Amendments with various FDA performance goal commitments and enacted several “Medical Device Regulatory Improvements” and miscellaneous reforms which are further intended to clarify and improve medical device regulation bot pre- and post-market.
Medical devices may only be promoted and sold for the indications for which they are approved or cleared. In addition, even if the FDA has approved or cleared a product, it can take action affecting such product approvals or clearances if serious safety or other problems develop in the marketplace. Delays in obtaining clearances or approvals could adversely affect our ability to introduce new products or modifications to our existing products in a timely manner, which would delay or prevent commercial sales of our products. Additionally, the FDA and other regulatory authorities have broad enforcement powers. Regulatory enforcement or inquiries, or other increased scrutiny on us, could affect the perceived safety and efficacy of our products and dissuade our customers from using our products.
-28-
Table of Contents
If we modify our FDA cleared devices, we may need to seek additional clearances or approvals, which, if not granted, would prevent us from selling our modified products.
Our Inogen One systems have received pre-market clearance under Section 510(k) of the FDCA. The modifications made to our Inogen One G2 and Inogen One G3 systems represent non-significant modifications to the original Inogen One system, have the same indications for use, and are covered under our initial Inogen One 510(k) clearance. Any modifications to a 510(k)-cleared device that could significantly affect its safety or effectiveness, or would constitute a major change in its intended use, manufacture, design, components, or technology requires the submission and clearance of a new 510(k) pre-market notification or, possibly, pre-market approval. The FDA requires every manufacturer to make this determination in the first instance, but the FDA may review any manufacturer’s decision. The FDA may not agree with our decisions regarding whether new clearances or approvals are necessary. We have modified some of our 510(k) cleared products, and have determined based on our review of the applicable FDA guidance that in certain instances new 510(k) clearances or pre-market approval are not required. If the FDA disagrees with our determination and requires us to submit new 510(k) notifications or pre-market approval for modifications to our previously cleared products for which we have concluded that new clearances or approvals are unnecessary, we may be required to cease marketing or to recall the modified product until we obtain clearance or approval, and we may be subject to significant regulatory fines or penalties.
Furthermore, the FDA’s ongoing review of the 510(k) program may make it more difficult for us to make modifications to our previously cleared products, either by imposing more strict requirements on when a manufacturer must submit a new 510(k) for a modification to a previously cleared product, or by applying more onerous review criteria to such submissions. Specifically, pursuant to the Food and Drug Administration Safety and Innovation Act, which was signed into law in July 2012, the FDA is obligated to prepare a report for Congress on the FDA’s approach for determining when a new 510(k) will be required for modifications or changes to a previously cleared device. After submitting this report, the FDA is expected to issue revised guidance to assist device manufacturers in making this determination. Until then, manufacturers may continue to adhere to the FDA’s 1997 guidance on this topic when making a determination as to whether or not a new 510(k) is required for a change or modification to a device, but the practical impact of the FDA’s continuing scrutiny of these issues remains unclear.
If we fail to comply with FDA or state regulatory requirements, we can be subject to enforcement action.
The regulations to which we are subject are complex and have become more stringent over time. Regulatory changes could result in restrictions on our ability to continue or expand our operations, higher than anticipated costs or lower than anticipated sales. Even after we have obtained the proper regulatory clearance or approval to market a product, we have ongoing responsibilities under FDA regulations. The FDA and state authorities have broad enforcement powers. Our failure to comply with applicable regulatory requirements could result in enforcement action by the FDA or state agencies, which may include any of the following sanctions:
| • | warning letters, fines, injunctions, consent decrees and civil penalties; |
| • | recalls, termination of distribution, or seizure of our products; |
| • | operating restrictions or partial suspension or total shutdown of production; |
-29-
Table of Contents
| • | delays in the introduction of products into the market; |
| • | refusal to grant our requests for future 510(k) clearances or approvals of new products, new intended uses, or modifications to exiting products; |
| • | withdrawals or suspensions of current 510(k) clearances or approvals, resulting in prohibitions on sales of our products; and |
| • | criminal prosecution. |
Any of these sanctions could result in higher than anticipated costs or lower than anticipated sales and have a material adverse effect on our reputation, business, results of operations and financial condition.
A recall of our products, either voluntarily or at the direction of the FDA or another governmental authority, or the discovery of serious safety issues with our products that leads to corrective actions, could have a significant adverse impact on us.
Medical devices, such as our Inogen One systems, can experience performance problems in the field that require review and possible corrective action by us or the product manufacturer. We cannot provide assurance that component failures, manufacturing errors, design defects and/or labeling inadequacies, which could result in an unsafe condition or injury to the operator or the patient will not occur. The FDA and similar foreign governmental authorities have the authority to require the recall of commercialized products in the event of material deficiencies or defects in design or manufacture of a product or in the event that a product poses an unacceptable risk to health. Manufacturers may also, under their own initiative, recall a product if any material deficiency in a device is found or withdraw a product to improve device performance or for other reasons. A government-mandated or voluntary recall by us or one of our distributors could occur as a result of an unacceptable risk to health, component failures, manufacturing errors, design or labeling defects or other deficiencies and issues. Similar regulatory agencies in other countries have similar authority to recall devices because of material deficiencies or defects in design or manufacture that could endanger health. Any recall would divert management attention and financial resources, could cause the price of our stock to decline and expose us to product liability or other claims and harm our reputation with customers. A recall involving our Inogen One systems could be particularly harmful to our business, financial and operating results.
In addition, under the FDA’s medical device reporting regulations, we are required to report to the FDA any incident in which our product may have caused or contributed to a death or serious injury or in which our product malfunctioned and, if the malfunction were to recur, would likely cause or contribute to death or serious injury. Repeated product malfunctions may result in a voluntary or involuntary product recall. Depending on the corrective action we take to redress a product’s deficiencies or defects, the FDA may require, or we may decide, that we will need to obtain new approvals or clearances for the device before we may market or distribute the corrected device. Seeking such approvals or clearances may delay our ability to replace the recalled devices in a timely manner. Moreover, if we do not adequately address problems associated with our devices, we may face additional regulatory enforcement action, including FDA warning letters, product seizure, injunctions, administrative penalties, or civil or criminal fines. We may also be required to bear other costs or take other actions that may have a negative impact on our sales as well as face significant adverse publicity or regulatory consequences, which could harm our business, including our ability to market our products in the future.
-30-
Table of Contents
Any adverse event involving our products, whether in the United States or abroad, could result in future voluntary corrective actions, such as recalls or customer notifications, or agency action, such as inspection, mandatory recall or other enforcement action. Any corrective action, whether voluntary or involuntary, as well as defending ourselves in a lawsuit, will require the dedication of our time and capital, distract management from operating our business and may harm our reputation and financial results.
If we or our component manufacturers fail to comply with the FDA’s Quality System Regulation, our manufacturing operations could be interrupted, and our product sales and operating results could suffer.
We and our component manufacturers are required to comply with the FDA’s Quality System Regulation, or QSR, which covers the procedures and documentation of the design, testing, production, control, quality assurance, labeling, packaging, sterilization, storage and shipping of our devices. The FDA audits compliance with the QSR through periodic announced and unannounced inspections of manufacturing and other facilities. We and our component manufacturers have been, and anticipate in the future being, subject to such inspections. Although we believe our manufacturing facilities and those of our component manufacturers are in compliance with the QSR, we cannot provide assurance that any future inspection will not result in adverse findings. If our manufacturing facilities or those of any of our component manufacturers or suppliers are found to be in violation of applicable laws and regulations, or we or our manufacturers or suppliers fail to take satisfactory corrective action in response to an adverse inspection, the FDA could take enforcement action, including any of the following sanctions:
| • | untitled letters, warning letters, fines, injunctions, consent decrees and civil penalties; |
| • | customer notifications or repair, replacement, refunds, recall, detention or seizure of our products; |
| • | operating restrictions or partial suspension or total shutdown of production; |
| • | refusing or delaying our requests for 510(k) clearance or pre-market approval of new products or modified products; |
| • | withdrawing 510(k) clearances or pre-market approvals that have already been granted; |
| • | refusal to grant export approval for our products; or |
| • | criminal prosecution. |
Any of these sanctions could adversely affect our business, financial conditions and operating results.
Outside the United States, our products and operations are also often required to comply with standards set by industrial standards bodies, such as the International Organization for Standardization, or ISO. Foreign regulatory bodies may evaluate our products or the testing that our products undergo against these standards. The specific standards, types of evaluation and scope of review differ among foreign regulatory bodies. If we fail to adequately comply with any of these standards, a foreign regulatory body may take adverse actions similar to those within the power of the FDA. Any such action may harm our reputation and could have an adverse effect on our business, results of operations and financial condition.
-31-
Table of Contents
If we fail to obtain and maintain regulatory approval in foreign jurisdictions, our market opportunities will be limited.
Approximately 27% of our revenue was from sales outside of the United States in 2012. We sell our products in 41 countries outside of the United States through distributors or directly to large “house” accounts. In order to market our products in the European Union or other foreign jurisdictions, we must obtain and maintain separate regulatory approvals and comply with numerous and varying regulatory requirements. The approval procedure varies from country to country and can involve additional testing. The time required to obtain approval abroad may be longer than the time required to obtain FDA clearance. The foreign regulatory approval process includes many of the risks associated with obtaining FDA clearance and we may not obtain foreign regulatory approvals on a timely basis, if at all. FDA clearance does not ensure approval by regulatory authorities in other countries, and approval by one foreign regulatory authority does not ensure approval by regulatory authorities in other foreign countries. However, the failure to obtain clearance or approval in one jurisdiction may have a negative impact on our ability to obtain clearance or approval elsewhere. If we do not obtain or maintain necessary approvals to commercialize our products in markets outside the United States, it would negatively affect our overall market penetration.
We may be subject to fines, penalties or injunctions if we are determined to be promoting the use of our products for unapproved or “off-label” uses, resulting in damage to our reputation and business.
Our promotional materials and training methods must comply with FDA and other applicable laws and regulations, including the prohibition of the promotion of a medical device for a use that has not been cleared or approved by the FDA. Use of a device outside its cleared or approved indications is known as “off-label” use. Physicians may use our products off-label, as the FDA does not restrict or regulate a physician’s choice of treatment within the practice of medicine. If the FDA determines that our promotional materials or training constitutes promotion of an off-label use, it could request that we modify our training or promotional materials or subject us to regulatory or enforcement actions, which could have an adverse impact on our reputation and financial results.
Failure to comply with the Federal Health Insurance Portability and Accountability Act of 1996, or HIPAA, the Health Information Technology for Economic and Clinical Health Act, or HITECH Act, and implementing regulations (including the final omnibus rule published on January 25, 2013) affecting the transmission, security and privacy of health information could result in significant penalties.
Numerous federal and state laws and regulations, including HIPAA and the HITECH Act, govern the collection, dissemination, security, use and confidentiality of patient-identifiable health information. HIPAA and the HITECH Act require us to comply with standards for the use and disclosure of health information within our company and with third parties. The Privacy Standards and Security Standards under HIPAA establish a set of basic national privacy and security standards for the protection of individually identifiable health information by health plans, healthcare clearinghouses and certain healthcare providers, referred to as covered entities, and the business associates with whom such covered entities contract for services. Notably, whereas HIPAA previously directly regulated only these covered entities, the HITECH Act, which was signed into law as part of the stimulus package in February 2009, makes certain of HIPAA’s privacy and security standards also directly applicable to covered entities’ business associates. As a
-32-
Table of Contents
result, both covered entities and business associates are now subject to significant civil and criminal penalties for failure to comply with Privacy Standards and Security Standards.
HIPAA and the HITECH Act also include standards for common health care electronic transactions and code sets, such as claims information, plan eligibility, payment information and the use of electronic signatures, and privacy and electronic security of individually identifiable health information. Covered entities, such as health care providers, are required to conform to such transaction set standards pursuant to HIPAA.
HIPAA requires health care providers like us to develop and maintain policies and procedures with respect to protected health information that is used or disclosed, including the adoption of administrative, physical and technical safeguards to protect such information. The HITECH Act expands the notification requirement for breaches of patient-identifiable health information, restricts certain disclosures and sales of patient-identifiable health information and provides a tiered system for civil monetary penalties for HIPAA violations. The HITECH Act also increased the civil and criminal penalties that may be imposed against covered entities, business associates and possibly other persons and gave state attorneys general new authority to file civil actions for damages or injunctions in federal courts to enforce the federal HIPAA laws and seek attorney fees and costs associated with pursuing federal civil actions. Additionally, certain states have adopted comparable privacy and security laws and regulations, some of which may be more stringent than HIPAA.
If we do not comply with existing or new laws and regulations related to patient health information, we could be subject to criminal or civil sanctions. New health information standards, whether implemented pursuant to HIPAA, the HITECH Act, congressional action or otherwise, could have a significant effect on the manner in which we handle health care related data and communicate with payors, and the cost of complying with these standards could be significant.
The 2013 final HITECH omnibus rule modifies the breach reporting standard in a manner that will likely make more data security incidents qualify as reportable breaches. Any liability from a failure to comply with the requirements of HIPAA or the HITECH Act could adversely affect our financial condition. The costs of complying with privacy and security related legal and regulatory requirements are burdensome and could have a material adverse effect on our results of operations. These new provisions, as modified, will be subject to interpretation by various courts and other governmental authorities, thus creating potentially complex compliance issues for us, as well as our clients and strategic partners. In addition, we are unable to predict what changes to the HIPAA Privacy Standards and Security Standards might be made in the future or how those changes could affect our business. Any new legislation or regulation in the area of privacy and security of personal information, including personal health information, could also adversely affect our business operations.
Regulations requiring the use of “standard transactions” for healthcare services issued under HIPAA may negatively impact our profitability and cash flows.
Pursuant to HIPAA, final regulations have been implemented to improve the efficiency and effectiveness of the healthcare system by facilitating the electronic exchange of information in certain financial and administrative transactions while protecting the privacy and security of the information exchanged.
The HIPAA transaction standards are complex, and subject to differences in interpretation by third-party payors. For instance, some third-party payors may interpret the standards to require
-33-
Table of Contents
us to provide certain types of information, including demographic information not usually provided to us by physicians. As a result of inconsistent application of transaction standards by third-party payors or our inability to obtain certain billing information not usually provided to us by physicians, we could face increased costs and complexity, a temporary disruption in accounts receivable and ongoing reductions in reimbursements and net revenue. In addition, requirements for additional standard transactions, such as claims attachments or use of a national provider identifier, could prove technically difficult, time-consuming or expensive to implement, all of which could harm our business.
If we fail to comply with state and federal fraud and above laws, including anti-kickback, false claims and anti-inducement laws, we could face substantial penalties and our business, operations, and financial condition could be adversely affected.
The federal anti-kickback statute prohibits, among other things, knowingly and willfully offering, paying, soliciting or receiving remuneration to induce or in return for purchasing, leasing, ordering, or arranging for the purchase, lease or order of any healthcare item or service reimbursable under Medicare, Medicaid, or other federal financed healthcare programs. Although there are a number of statutory exceptions and regulatory safe harbors protecting certain common activities from prosecution, the exceptions and safe harbors are drawn narrowly, and any remuneration to or from a prescriber or purchaser of healthcare products or services may be subject to scrutiny if they do not qualify for an exception or safe harbor. Our practices may not in all cases meet all of the criteria for safe harbor protection from anti-kickback liability.
Federal false claims laws prohibit any person from knowingly presenting or causing to be presented a false claim for payment to the federal government, or knowingly making or causing to be made a false statement to get a false claim paid. The majority of states also have statutes or regulations similar to the federal anti-kickback law and false claims laws, which apply to items or services reimbursed under Medicaid and other state programs, or, in several states, apply regardless of payor. These false claims statutes allow any person to bring suit in the name of the government alleging false and fraudulent claims presented to or paid by the government (or other violations of the statutes) and to share in any amounts paid by the entity to the government in fines or settlement. Such suits, known as qui tam actions, have increased significantly in the healthcare industry in recent years. Sanctions under these federal and state laws may include civil monetary penalties, exclusion of a manufacturer’s products from reimbursement under government programs, criminal fines and imprisonment. In addition, the recently enacted Patient Protection and Affordable Care Act, among other things, amends the intent requirement of the federal anti-kickback and criminal healthcare fraud statutes. A person or entity no longer needs to have actual knowledge of this statute or specific intent to violate it. In addition, the Patient Protection and Affordable Care Act provides that the government may assert that a claim including items or services resulting from a violation of the federal anti-kickback statute constitutes a false or fraudulent claim for purposes of the false claims statutes. Because of the breadth of these laws and the narrowness of the safe harbors and exceptions, it is possible that some of our business activities could be subject to challenge under one or more of such laws. Such a challenge, regardless of the outcome, could have a material adverse effect on our business, business relationships, reputation, financial condition and results of operations.
The Patient Protection and Affordable Care Act also imposes new reporting and disclosure requirements on device and drug manufacturers for any “transfer of value” made or distributed to prescribers and other healthcare providers. Device and drug manufacturers will also be required to report and disclose any investment interests held by physicians and their immediate
-34-
Table of Contents
family members during the preceding calendar year. Failure to submit required information may result in civil monetary penalties of up to an aggregate of $150,000 per year (and up to an aggregate of $1 million per year for “knowing failures”), for all payments, transfers of value or ownership or investment interests not reported in an annual submission. As of August 1, 2013, manufacturers are required to collect data, and they will be required to submit their first data reports to the Centers for Medicare & Medicaid Services by March 31, 2014 and by the 90th day of each calendar year thereafter.
In addition, there has been a recent trend of increased federal and state regulation of payments made to physicians. Certain states, mandate implementation of compliance programs and/or the tracking and reporting of gifts, compensation and other remuneration to physicians. The shifting compliance environment and the need to build and maintain robust and expandable systems to comply with different compliance and/or reporting requirements in multiple jurisdictions increase the possibility that a healthcare company many violate one or more of the requirements.
The Federal Civil Monetary Penalties Law prohibits the offering or giving of remuneration to a Medicare or Medicaid beneficiary that the person knows or should know is likely to influence the beneficiary’s selection of a particular supplier of items or services reimbursable by a Federal or state governmental program. We sometimes offer customers various discounts and other financial incentives in connection with the sales of our products. While it is our intent to comply with all applicable laws, the government may find that our marketing activities violate the Civil Monetary Penalties Law. If we are found to be in noncompliance, we could be subject to civil money penalties of up to $10,000 for each wrongful act, assessment of three times the amount claimed for each item or service and exclusion from the Federal healthcare programs.
The scope and enforcement of each of these laws is uncertain and subject to rapid change in the current environment of healthcare reform, especially in light of the lack of applicable precedent and regulations. If our operations are found to be in violation of any of the laws described above or any other government regulations that apply to us, we may be subject to penalties, including civil and criminal penalties, damages, fines and the curtailment or restricting of our operations. Any penalties, damages, fines, curtailment or restructuring or our operations could harm our ability to operate our business and our financial results. Any action against us for violation of these laws, even if we successfully defend against it, could cause us to incur significant legal expenses and divert our management’s attention from operation of our business. Moreover, achieving and sustaining compliance with applicable federal and state fraud laws may prove costly.
Foreign governments tend to impose strict price controls, which may adversely affect our future profitability.
We sell our products in 41 countries outside the United States through distributors or directly to large “house” accounts. In some foreign countries, particularly in the European Union, the pricing of medical devices is subject to governmental control. In these countries, pricing negotiations with governmental authorities can take considerable time after the receipt of marketing approval for a product. To obtain reimbursement or pricing approval in some countries, we may be required to supply data that compares the cost-effectiveness of our Inogen One systems to other available oxygen therapies. If reimbursement of our products is unavailable or limited in scope or amount, or if pricing is set at unsatisfactory levels, it may not be profitable to sell our products in certain foreign countries, which would negatively affect the long-term growth of our business.
-35-
Table of Contents
Our business activities involve the use of hazardous materials, which require compliance with environmental and occupational safety laws regulating the use of such materials. If we violate these laws, we could be subject to significant fines, liabilities or other adverse consequences.
Our research and development programs as well as our manufacturing operations involve the controlled use of hazardous materials. Accordingly, we are subject to federal, state and local laws governing the use, handling and disposal of these materials. Although we believe that our safety procedures for handling and disposing of these materials comply in all material respects with the standards prescribed by state and federal regulations, we cannot completely eliminate the risk of accidental contamination or injury from these materials. In the event of an accident or failure to comply with environmental laws, we could be held liable for resulting damages, and any such liability could exceed our insurance coverage.
Risks related to our intellectual property
If we are unable to secure and maintain patent or other intellectual property protection for the intellectual property used in our products, we will lose a significant competitive advantage.
Our commercial success depends, in part, on obtaining and maintaining patent and other intellectual property protection for the technologies used in our products. The patent positions of medical device companies, including ours, can be highly uncertain and involve complex and evolving legal and factual questions. Furthermore, we might in the future opt to license intellectual property from other parties. If we, or the other parties from whom we would license intellectual property, fail to obtain and maintain adequate patent or other intellectual property protection for intellectual property used in our products, or if any protection is reduced or eliminated, others could use the intellectual property used in our products, resulting in harm to our competitive business position. In addition, patent and other intellectual property protection may not:
| • | prevent our competitors from duplicating our products; |
| • | prevent our competitors from gaining access to our proprietary information and technology; or |
| • | permit us to gain or maintain a competitive advantage. |
Any of our patents may be challenged, invalidated, circumvented or rendered unenforceable. We cannot provide assurance that we will be successful should one or more of our patents be challenged for any reason. If our patent claims are rendered invalid or unenforceable, or narrowed in scope, the patent coverage afforded our products could be impaired, which could make our products less competitive.
As of January 1, 2014, we had six pending U.S. patent applications, 24 issued U.S. patents and one issued Canadian patent relating to the design and construction of our oxygen concentrators and our intelligent delivery technology. We cannot specify which of these patents individually or as a group will permit us to gain or maintain a competitive advantage. U.S. patents and patent applications may be subject to interference proceedings, and U.S. patents may be subject to re-examination inter partes review, post-grant review, and derivation proceedings in the U.S. Patent and Trademark Office. Foreign patents may be subject to opposition or comparable proceedings in the corresponding foreign patent offices. Any of these proceedings could result in loss of the patent or denial of the patent application, or loss or reduction in the scope of one or more of the claims of the patent or patent application. Changes in either patent laws or in interpretations of patent laws may also diminish the value of our intellectual property or narrow the scope of our
-36-
Table of Contents
protection. Interference, re-examination and opposition proceedings may be costly and time consuming, and we, or the other parties from whom we might potentially license intellectual property, may be unsuccessful in defending against such proceedings. Thus, any patents that we own or might license may provide limited or no protection against competitors. In addition, our pending patent applications and those we may file in the future may have claims narrowed during prosecution or may not result in patents being issued. Even if any of our pending or future applications are issued, they may not provide us with adequate protection or any competitive advantages. Our patents and patent applications cover particular aspects of our products. Other parties may develop and obtain patent protection for more effective technologies, designs or methods for oxygen therapy. If these developments were to occur, it would likely have an adverse effect on our sales. Our ability to develop additional patentable technology is also uncertain.
Non-payment or delay in payment of patent fees or annuities, whether intentional or unintentional, may also result in the loss of patents or patent rights important to our business. Many countries, including certain countries in Europe, have compulsory licensing laws under which a patent owner may be compelled to grant licenses to other parties. In addition, many countries limit the enforceability of patents against other parties, including government agencies or government contractors. In these countries, the patent owner may have limited remedies, which could materially diminish the value of the patent. In addition, the laws of some foreign countries do not protect intellectual property rights to the same extent as do the laws of the United States, particularly in the field of medical products and procedures
Our products could infringe the intellectual property rights of others, which may lead to patent and other intellectual property litigation that could itself be costly, could result in the payment of substantial damages or royalties, prevent us from using technology that is essential to our products, and/or force us to discontinue selling our products.
The medical device industry in general has been characterized by extensive litigation and administrative proceedings regarding patent infringement and intellectual property rights. Our competitors hold a significant number of patents relating to oxygen therapy devices and products. From time to time, we have commenced litigation to enforce our intellectual property rights. For example, we have pursued litigation against Inova Labs for infringement of two of our patents seeking damages, injunctive relief, costs, and attorneys’ fees. An adverse decision in this action or in any other legal action could limit our ability to assert our intellectual property rights, limit the value of our technology or otherwise negatively impact our business, financial condition and results of operations.
Monitoring unauthorized use of our intellectual property is difficult and costly. Unauthorized use of our intellectual property may have occurred or may occur in the future. Although we have taken steps to minimize the risk of this occurring, any such failure to identify unauthorized use and otherwise adequately protect our intellectual property would adversely affect our business. Moreover, if we are required to commence litigation, whether as a plaintiff or defendant as has occurred with Inova Labs, not only will this be time-consuming, but we will also be forced to incur significant costs and divert our attention and efforts of our employees, which could, in turn, result in lower revenue and higher expenses.
We cannot provide assurance that our products or methods do not infringe the patents or other intellectual property rights of third parties and if our business is successful, the possibility may increase that others will assert infringement claims against us.
-37-
Table of Contents
Determining whether a product infringes a patent involves complex legal and factual issues, and the outcome of a patent litigation action is often uncertain. We have not conducted an extensive search of patents issued or assigned to other parties, including our competitors, and no assurance can be given that patents containing claims covering our products, parts of our products, technology or methods do not exist, have not been filed or could not be filed or issued. Because of the number of patents issued and patent applications filed in our technical areas, our competitors or other parties may assert that our products and the methods we employ in the use of our products are covered by U.S. or foreign patents held by them. In addition, because patent applications can take many years to issue and because publication schedules for pending applications vary by jurisdiction and some companies opt not to publish their patent applications, there may be applications now pending of which we are unaware and which may result in issued patents that our current or future products infringe. Also, because the claims of published patent applications can change between publication and patent grant, there may be published patent applications that may ultimately issue with claims that we infringe. There could also be existing patents that one or more of our products or parts may infringe and of which we are unaware. As the number of competitors in the market for oxygen products and as the number of patents issued in this area grows, the possibility of patent infringement claims against us increases. In certain situations, we may determine that it is in our best interests to voluntarily challenge a party’s products or patents in litigation or other proceedings, including patent interferences or re-examinations. As a result, we may become involved in unwanted litigation that could be costly, result in diversion of management’s attention, require us to pay damages and force us to discontinue selling our products.
Infringement and other intellectual property claims and proceedings brought against us, whether successful or not, could result in substantial costs and harm to our reputation. Such claims and proceedings can also distract and divert management and key personnel from other tasks important to the success of the business. We cannot be certain that we will successfully defend against allegations of infringement of patents and intellectual property rights of others. In the event that we become subject to a patent infringement or other intellectual property lawsuit and if the other party’s patents or other intellectual property were upheld as valid and enforceable and we were found to infringe the other party’s patents or violate the terms of a license to which we are a party, we could be required to do one or more of the following:
| • | cease selling or using any of our products that incorporate the asserted intellectual property, which would adversely affect our revenue; |
| • | pay damages for past use of the asserted intellectual property, which may be substantial; |
| • | obtain a license from the holder of the asserted intellectual property, which license may not be available on reasonable terms, if at all, and which could reduce profitability; and |
| • | redesign or rename, in the case of trademark claims, our products to avoid infringing the intellectual property rights of third parties, which may not be possible and could be costly and time-consuming if it is possible to do so. |
If we are unable to prevent unauthorized use or disclosure of trade secrets, unpatented know-how and other proprietary information, our ability to compete will be harmed.
We rely on a combination of trade secrets, copyrights, trademarks, confidentiality agreements and other contractual provisions and technical security measures to protect certain aspects of our technology, especially where we do not believe that patent protection is appropriate or
-38-
Table of Contents
obtainable. We require our employees and consultants to execute confidentiality agreements in connection with their employment or consulting relationships with us. We also require our employees and consultants to disclose and assign to us all inventions conceived during the term of their employment or engagement while using our property or that relate to our business. We also require our corporate partners, outside scientific collaborators and sponsored researchers, advisors and others with access to our confidential information to sign confidentiality agreements. We also have taken precautions to initiate reasonable safeguards to protect our information technology systems. However, these measures may not be adequate to safeguard our proprietary intellectual property and conflicts may, nonetheless, arise regarding ownership of inventions. Such conflicts may lead to the loss or impairment of our intellectual property or to expensive litigation to defend our rights against competitors who may be better funded and have superior resources. Our employees, consultants, contractors, outside clinical collaborators and other advisors may unintentionally or willfully disclose our confidential information to competitors. In addition, confidentiality agreements may be unenforceable or may not provide an adequate remedy in the event of unauthorized disclosure. Enforcing a claim that a third party illegally obtained and is using our trade secrets is expensive and time-consuming, and the outcome is unpredictable. Moreover, our competitors may independently develop equivalent knowledge, methods and know-how. Unauthorized parties may also attempt to copy or reverse engineer certain aspects of our products that we consider proprietary, and in such cases we could not assert any trade secret rights against such party. As a result, other parties may be able to use our proprietary technology or information, and our ability to compete in the market would be harmed.
We may be subject to damages resulting from claims that our employees or we have wrongfully used or disclosed alleged trade secrets of other companies.
Many of our employees were previously employed at other medical device companies focused on the development of oxygen therapy products, including our competitors. Although no claims against us are currently pending, we may be subject to claims that these employees or we have inadvertently or otherwise used or disclosed trade secrets or other proprietary information of their former employers. Litigation may be necessary to defend against these claims. If we fail in defending such claims, in addition to paying monetary damages, we may lose valuable intellectual property rights. Even if we are successful in defending against these claims, litigation could result in substantial costs, damage to our reputation and be a distraction to management.
Risks related to being a public company
We will incur increased costs as a result of operating as a public company and our management will be required to devote substantial time to new compliance initiatives and corporate governance practices.
As a public company, and increasingly after we are no longer an “emerging growth company,” we will incur significant legal, accounting and other expenses that we did not incur as a private company. In addition, the Sarbanes-Oxley Act and rules subsequently implemented by the SEC and the NASDAQ Global Market impose numerous requirements on public companies, including establishment and maintenance of effective disclosure and financial controls and corporate governance practices. Also, the Securities Exchange Act of 1934, as amended, or the Exchange Act, requires, among other things, that we file annual, quarterly and current reports with respect to our business and operating results. Our management and other personnel will need to devote a substantial amount of time to compliance with these laws and regulations. These requirements
-39-
Table of Contents
have increased and will continue to increase our legal, accounting, and financial compliance costs and have made and will continue to make some activities more time consuming and costly. For example, we expect these rules and regulations to make it more difficult and more expensive for us to obtain director and officer liability insurance, and we may be required to incur substantial costs to maintain the same or similar coverage. These rules and regulations could also make it more difficult for us to attract and retain qualified persons to serve on our board of directors or our board committees or as executive officers.
Overall, we estimate that our incremental costs resulting from operating as a public company, including compliance with these rules and regulations, may be between $1.5 million and $3.0 million per year. However, these rules and regulations are often subject to varying interpretations, in many cases due to their lack of specificity, and, as a result, their application in practice may evolve over time as new guidance is provided by regulatory and governing bodies. This could result in continuing uncertainty regarding compliance matters and higher costs necessitated by ongoing revisions to disclosure and governance practices.
The Sarbanes-Oxley Act requires, among other things, that we assess the effectiveness of our internal control over financial reporting annually and the effectiveness of our disclosure controls and procedures quarterly. In particular, Section 404(a) of the Sarbanes-Oxley Act, or Section 404(a), will require us to perform system and process evaluation and testing of our internal control over financial reporting to allow management to report on the effectiveness of our internal control over financial reporting. Section 404(b) of Sarbanes-Oxley Act also requires our independent registered public accounting firm to attest to the effectiveness of our internal control over financial reporting. As an “emerging growth company” we expect to avail ourselves of the exemption from the requirement that our independent registered public accounting firm attest to the effectiveness of our internal control over financial reporting under Section 404(b). However, we may no longer avail ourselves of this exemption when we are no longer an “emerging growth company.” When our independent registered public accounting firm is required to undertake an assessment of our internal control over financial reporting, the cost of our compliance with Section 404(b) will correspondingly increase. Our compliance with applicable provisions of Section 404 will require that we incur substantial accounting expense and expend significant management time on compliance-related issues as we implement additional corporate governance practices and comply with reporting requirements.
Furthermore, investor perceptions of our company may suffer if deficiencies are found, and this could cause a decline in the market price of our stock. Irrespective of compliance with Section 404, any failure of our internal control over financial reporting could have a material adverse effect on our stated operating results and harm our reputation. If we are unable to implement these requirements effectively or efficiently, it could harm our operations, financial reporting, or financial results and could result in an adverse opinion on our internal controls from our independent registered public accounting firm.
We have identified material weaknesses in our internal control over financial reporting. If we do not remediate the material weaknesses in our internal control over financial reporting, we may not be able to accurately report our financial results or file our periodic reports in a timely manner, which may cause investors to lose confidence in our reported financial information and may lead to a decline in the market price of our stock.
Effective internal control over financial reporting is necessary for us to provide reliable financial reports in a timely manner. In connection with the audits of our financial statements for the
-40-
Table of Contents
years ended December 31, 2011 and 2012, we concluded that there were material weaknesses in our internal control over financial reporting. A material weakness is a significant deficiency, or a combination of significant deficiencies, in internal control over financial reporting such that it is reasonably possible that a material misstatement of the annual or interim financial statements will not be prevented or detected on a timely basis. The material weaknesses that we identified related to (1) a lack of sufficient staff to deal with the various rules and regulations with respect to financial reporting, (2) accounting for revenue recognition as it relates to properly recording deferred revenue, estimated earned but unbilled revenue and billing adjustments and (3) accounting for warranty revenue and cost recognition with regard to lifetime warranties.
In an attempt to remediate our staff resource weakness, we have taken steps to hire additional finance and accounting personnel to augment our accounting staff and to provide more resources for complex GAAP accounting matters. In an attempt to remediate our revenue recognition weakness, we intend to review our revenue recognition policies and procedures, enhance training of our personnel with respect to such policies and procedures and devote additional resources to our revenue recognition, including adding additional accounting staff with technical experience in revenue recognition arrangements. However, we cannot assure you that these efforts will remediate our material weaknesses in a timely manner, or at all, or prevent restatements of our financial statements in the future. If we are unable to successfully remediate our material weaknesses, or identify any future significant deficiencies or material weaknesses, the accuracy and timing of our financial reporting may be adversely affected, we may be unable to maintain compliance with securities law requirements regarding timely filing of periodic reports, and the market price of our stock may decline as a result.
Our management and independent registered public accounting firm did not perform an evaluation of our internal control over financial reporting during any period in accordance with the provisions of the Sarbanes-Oxley Act. Had we and our independent registered public accounting firm performed an evaluation of our internal control over financial reporting in accordance with the provisions of the Sarbanes-Oxley Act, additional control deficiencies amounting to material weaknesses may have been identified. We cannot be certain as to when we will be able to implement the requirements of Section 404 of the Sarbanes-Oxley Act. If we fail to implement the requirements of Section 404 in a timely manner, we might be subject to sanctions or investigation by regulatory agencies such as the SEC. In addition, failure to comply with Section 404 or the report by us of a material weakness may cause investors to lose confidence in our financial statements, and the trading price of our common stock may decline. If we fail to remedy any material weakness, our financial statements may be inaccurate, our access to the capital markets may be restricted and the trading price of our ordinary shares may suffer.
We are an “emerging growth company,” and the reduced disclosure requirements applicable to emerging growth companies could make our common stock less attractive to investors.
We are an “emerging growth company,” as defined in the Jumpstart Our Business Startups, or JOBS, Act enacted in April 2012, and may remain an “emerging growth company” for up to five years following the completion of this offering, although, if we have more than $1.0 billion in annual revenue, if the market value of our common stock that is held by non-affiliates exceeds $700 million as of June 30 of any year, or we issue more than $1.0 billion of non-convertible debt over a three-year period before the end of that five-year period, we would cease to be an “emerging growth company” as of the following December 31. For as long as we remain an “emerging growth company,” we are permitted and intend to rely on exemptions from certain
-41-
Table of Contents
disclosure requirements that are applicable to other public companies that are not “emerging growth companies.” These exemptions include:
| • | being permitted to provide only two years of audited financial statements, in addition to any required unaudited interim financial statements, with correspondingly reduced “Management’s discussion and analysis of financial condition and results of operations” disclosure; |
| • | not being required to comply with the auditor attestation requirements in the assessment of our internal control over financial reporting; |
| • | not being required to comply with any requirement that may be adopted by the Public Company Accounting Oversight Board regarding mandatory audit firm rotation or a supplement to the auditor’s report providing additional information about the audit and the financial statements; |
| • | reduced disclosure obligations regarding executive compensation; and |
| • | exemptions from the requirements of holding a nonbinding advisory vote on executive compensation and shareholder approval of any golden parachute payments not previously approved. |
We have taken advantage of reduced reporting burdens in this prospectus. In particular, in this prospectus, we have provided only two years of audited financial statements and have not included all of the executive compensation related information that would be required if we were not an emerging growth company. In addition, the JOBS Act provides that an emerging growth company can take advantage of an extended transition period for complying with new or revised accounting standards, delaying the adoption of these accounting standards until they would apply to private companies. We have elected to avail ourselves of this exemption and, as a result, our financial statements may not be comparable to the financial statements of issuers who are required to comply with the effective dates for new or revised accounting standards that are applicable to public companies. We cannot predict whether investors will find our common stock less attractive if we rely on these exemptions. If some investors find our common stock less attractive as a result, there may be a less active trading market for our common stock and our stock price may be reduced or more volatile.
Risks related to our common stock and this offering
We expect that our stock price will fluctuate significantly, and you may not be able to resell your shares at or above the initial public offering price.
Prior to this offering, there has been no public market for shares of our common stock. We cannot predict the extent to which investor interest in our company will lead to the development of an active trading market on the NASDAQ Global Market or otherwise or how liquid that market might become. If an active trading market does not develop, you may have difficulty selling any of our shares of common stock that you buy. We and the underwriters will determine the initial public offering price of our common stock through negotiation. This price will not necessarily reflect the price at which investors in the market will be willing to buy and sell our shares following this offering. In addition, the trading price of our common stock following this offering may be highly volatile and could be subject to wide fluctuations in response to various factors, some of which are beyond our control. These factors include:
| • | actual or anticipated quarterly variation in our results of operations or the results of our competitors; |
-42-
Table of Contents
| • | announcements by us or our competitors of new commercial products, significant contracts, commercial relationships or capital commitments; |
| • | issuance of new or changed securities analysts’ reports or recommendations for our stock; |
| • | developments or disputes concerning our intellectual property or other proprietary rights; |
| • | commencement of, or our involvement in, litigation; |
| • | market conditions in the oxygen therapy market; |
| • | reimbursement or legislative changes in the oxygen therapy market; |
| • | failure to complete significant sales; |
| • | manufacturing disruptions that could occur if we were unable to successfully expand our production in our current or an alternative facility; |
| • | any future sales of our common stock or other securities; |
| • | any major change to the composition of our board of directors or management; and |
| • | general economic conditions and slow or negative growth of our markets. |
The stock market in general, and market prices for the securities of technology-based companies like ours in particular, have from time to time experienced volatility that often has been unrelated to the operating performance of the underlying companies. A certain degree of stock price volatility can be attributed to being a newly public company. These broad market and industry fluctuations may adversely affect the market price of our common stock, regardless of our operating performance. In several recent situations where the market price of a stock has been volatile, holders of that stock have instituted securities class action litigation against the company that issued the stock. If any of our stockholders were to bring a lawsuit against us, the defense and disposition of the lawsuit could be costly and divert the time and attention of our management and harm our operating results.
If securities or industry analysts do not publish research or publish unfavorable research about our business, our stock price and trading volume could decline.
The trading market for our common stock will rely in part on the research and reports that equity research analysts publish about us and our business. We do not currently have and may never obtain research coverage by equity research analysts. Equity research analysts may elect not to provide research coverage of our common stock after the completion of this offering, and such lack of research coverage may adversely affect the market price of our common stock. In the event we obtain equity research analyst coverage, we will not have any control of the analysts or the content and opinions included in their reports. The price of our stock could decline if one or more equity research analysts downgrade our stock or issue other unfavorable commentary or research. If one or more equity research analysts ceases coverage of our company or fails to publish reports on us regularly, demand for our stock could decrease, which in turn could cause our stock price or trading volume to decline.
Purchasers in this offering will experience immediate and substantial dilution in the book value of their investment.
The initial public offering price of our common stock is substantially higher than the net tangible book value per share of our common stock immediately prior to this offering. Therefore, if you
-43-
Table of Contents
purchase our common stock in this offering, you will incur an immediate dilution of $ in pro forma as adjusted net tangible book value per share as of September 30, 2013 from the price you paid, based on an assumed initial public offering price of $ per share, the midpoint of the range set forth on the cover page of this prospectus. In addition, new investors who purchase shares in this offering will contribute approximately % of the total amount of equity capital raised by us through the date of this offering, but will only own approximately % of the outstanding share capital and approximately % of the voting rights. In addition, we have issued options and warrants to acquire common stock at prices below the initial public offering price. To the extent outstanding options and warrants are ultimately exercised, there will be further dilution to investors who purchase shares in this offering. In addition, if we issue additional equity securities, investors purchasing shares in this offering will experience additional dilution.
Future sales of shares of our common stock by existing stockholders could cause our stock price to decline.
Based on shares outstanding as of September 30, 2013, upon completion of this offering, we will have outstanding a total of shares of common stock. Of these shares, only the shares of common stock sold in this offering by us and the selling stockholders, or shares if the underwriters exercise their option to purchase additional shares in full, will be freely tradable, without restriction, in the public market immediately after the offering. Each of our directors and officers, and certain of our stockholders, have entered into lock-up agreements with the underwriters that restrict their ability to sell or transfer their shares. The lock-up agreements pertaining to this offering will expire 180 days from the date of this prospectus. Our underwriters, however, may, in their sole discretion, permit our officers, directors and other current stockholders who are subject to the contractual lock-up to sell shares prior to the expiration of the lock-up agreements. After the lock-up agreements expire, based on shares outstanding as of September 30, 2013, up to an additional shares of common stock will be eligible for sale in the public market, of which are held by our directors and executive officers and will be subject to volume limitations under Rule 144 under the Securities Act and various vesting agreements. In addition, shares of our common stock that are subject to outstanding options as of September 30, 2013 will become eligible for sale in the public market to the extent permitted by the provisions of various vesting agreements, the lock-up agreements and Rules 144 and 701 under the Securities Act. We cannot predict what effect, if any, sales of our shares in the public market or the availability of shares for sale will have on the market price of our common stock. Future sales of substantial amounts of our common stock in the public market, including shares issued upon exercise of outstanding options, or the perception that such sales may occur, however, could adversely affect the market price of our common stock and also could adversely affect our future ability to raise capital through the sale of our common stock or other equity-related securities of ours at times and prices we believe appropriate.
Our directors, executive officers and principal stockholders will continue to have substantial control over us after this offering and could limit your ability to influence the outcome of key transactions, including changes of control.
Following the completion of this offering, our executive officers, directors and stockholders who owned more than 5% of our outstanding common stock before this offering and their respective affiliates will beneficially own or control approximately % of the outstanding shares of our common stock, assuming no exercise of the underwriters’ option to purchase additional shares.
-44-
Table of Contents
Accordingly, these executive officers, directors and stockholders who owned more than 5% of our outstanding common stock before this offering and their respective affiliates, acting as a group, will have substantial influence over the outcome of corporate actions requiring stockholder approval, including the election of directors, any merger, consolidation or sale of all or substantially all of our assets or any other significant corporate transactions. These stockholders may also delay or prevent a change of control of us, even if such a change of control would benefit our other stockholders. The significant concentration of stock ownership may adversely affect the trading price of our common stock due to investors’ perception that conflicts of interest may exist or arise.
Anti-takeover provisions in our charter documents and under Delaware law could make an acquisition of us, which may be beneficial to our stockholders, more difficult and may prevent attempts by our stockholders to replace or remove our current management and limit the market price of our common stock.
Provisions in our certificate of incorporation and bylaws, as amended and restated upon the closing of this offering, may have the effect of delaying or preventing a change of control or changes in our management. Our amended and restated certificate of incorporation and amended and restated bylaws to become effective upon completion of this offering include provisions that:
| • | authorize our board of directors to issue, without further action by the stockholders, up to 10,000,000 shares of undesignated preferred stock; |
| • | require that any action to be taken by our stockholders be effected at a duly called annual or special meeting and not by written consent; |
| • | specify that special meetings of our stockholders can be called only by our board of directors, the Chairman of the board of directors, or the Chief Executive Officer; |
| • | establish an advance notice procedure for stockholder approvals to be brought before an annual meeting of our stockholders, including proposed nominations of persons for election to our board of directors; |
| • | establish that our board of directors is divided into three classes, Class I, Class II and Class III, with each class serving staggered three year terms; |
| • | provide that our directors may be removed only for cause; |
| • | provide that vacancies on our board of directors may be filled only by a majority of directors then in office, even though less than a quorum; |
| • | specify that no stockholder is permitted to cumulate votes at any election of directors; and |
| • | require a super-majority of votes to amend certain of the above-mentioned provisions. |
These provisions may frustrate or prevent any attempts by our stockholders to replace or remove our current management by making it more difficult for stockholders to replace members of our board of directors, which is responsible for appointing the members of our management. In addition, because we are incorporated in Delaware, we are governed by the provisions of Section 203 of the Delaware General Corporation Law, which limits the ability of stockholders owning in excess of 15% of our outstanding voting stock to merge or combine with us.
-45-
Table of Contents
We have broad discretion in the use of the net proceeds from this offering and may not use them effectively.
We will have broad discretion in the application of the net proceeds from this offering and could spend the proceeds in ways that do not improve our results of operations or enhance the value of our common stock. We intend to use approximately $15 million of the net proceeds from this offering for investments in rental assets; approximately $5 million of the net proceeds for sales and marketing activities, including expansion of our sales force to support the ongoing commercialization of our products; approximately $3 million of the net proceeds for research and product development activities; approximately $11 million of the net proceeds for facilities improvements or expansions and the purchase of manufacturing and other equipment; and the remainder of the net proceeds for working capital and other general corporate purposes. We may also use a portion of our net proceeds to acquire and invest in complementary products, technologies or businesses; however, we currently have no agreements or commitments to complete any such transaction. We have not allocated these net proceeds for any specific purposes. We might not be able to yield a significant return, if any, on any investment of these net proceeds. You will not have the opportunity to influence our management’s decisions on how to use the net proceeds from this offering, and our failure to apply these funds effectively could have a material adverse effect on our business and cause the price of our common stock to decline.
We have never paid dividends on our capital stock, and we do not anticipate paying any cash dividends in the foreseeable future.
We have paid no cash dividends on any of our classes of capital stock to date, have contractual restrictions against paying cash dividends and currently intend to retain our future earnings to fund the development and growth of our business. As a result, capital appreciation, if any, of our common stock will be your sole source of gain for the foreseeable future.
-46-
Table of Contents
Special note regarding forward-looking statements
This prospectus contains forward-looking statements that are based on management’s beliefs and assumptions and on information currently available to management. Some of the statements under “Prospectus summary,” “Risk factors,” “Management’s discussion and analysis of financial condition and results of operations” and “Business” and elsewhere in this prospectus contain forward-looking statements. In some cases, you can identify forward-looking statements by the following words: “may,” “will,” “could,” “would,” “should,” “expect,” “intend,” “plan,” “anticipate,” “believe,” “estimate,” “predict,” “project,” “potential,” “continue,” “ongoing” or the negative of these terms or other comparable terminology, although not all forward-looking statements contain these words.
These statements involve risks, uncertainties and other factors that may cause actual results, levels of activity, performance or achievements to be materially different from the information expressed or implied by these forward-looking statements. Although we believe that we have a reasonable basis for each forward-looking statement contained in this prospectus, we caution you that these statements are based on a combination of facts and factors currently known by us and our projections of the future, about which we cannot be certain.
In addition, you should refer to the “Risk factors” section of this prospectus for a discussion of other important factors that may cause actual results to differ materially from those expressed or implied by the forward-looking statements. As a result of these factors, we cannot assure you that the forward-looking statements in this prospectus will prove to be accurate. Furthermore, if the forward-looking statements prove to be inaccurate, the inaccuracy may be material. In light of the significant uncertainties in these forward-looking statements, you should not regard these statements as a representation or warranty by us or any other person that we will achieve our objectives and plans in any specified time frame, or at all. We undertake no obligation to publicly update any forward-looking statements, whether as a result of new information, future events or otherwise, except as required by law. The Private Securities Litigation Reform Act of 1995 and Section 27A of the Securities Act of 1933 do not protect any forward-looking statements that we make in connection with this offering.
This prospectus contains market data and industry forecasts that were obtained from industry publications. These data involve a number of assumptions and limitations, and you are cautioned not to give undue weight to such estimates. We have not independently verified any third-party information. While we believe the market position, market opportunity and market size information included in this prospectus is generally reliable, such information is inherently imprecise.
-47-
Table of Contents
We estimate that the net proceeds to us from the sale of the shares of common stock in this offering will be approximately $ , based upon an assumed initial price to the public of $ per share, the mid-point of the range reflected on the cover page of this prospectus, and after deducting estimated underwriting discounts and commissions and estimated offering expenses. We will not receive any proceeds from the sale of common stock by the selling stockholders. Each $1.00 increase (decrease) in the assumed initial public offering price of $ per share would increase (decrease) the net proceeds to us from this offering by approximately $ , assuming the number of shares offered by us, as set forth on the cover page of this prospectus, remains the same. We may also increase or decrease the number of shares we are offering. Each increase (decrease) of 1,000,000 shares in the number of shares offered by us would increase (decrease) the net proceeds to us from this offering by approximately $ , assuming that the assumed initial public offering price remains the same, and after deducting the estimated underwriting discounts and commissions and estimated offering expenses payable by us.
The principal purposes of this offering are to create a public market for our common stock, obtain additional capital, facilitate our future access to the public equity markets, increase awareness of our company among potential customers and improve our competitive position. We intend to use approximately $15 million of the net proceeds from this offering for investments in rental assets; approximately $5 million of the net proceeds for sales and marketing activities, including expansion of our sales force to support the ongoing commercialization of our products; approximately $3 million of the net proceeds for research and product development activities; approximately $11 million of the net proceeds for facilities improvements or expansions and the purchase of manufacturing and other equipment; and the remainder of the net proceeds for working capital and other general corporate purposes. We may also use a portion of our net proceeds to acquire and invest in complementary products, technologies or businesses; however, we currently have no agreements or commitments to complete any such transaction. The amount and timing of these expenditures will vary depending on a number of factors, including competitive and technological developments and the rate of growth, if any, of our business. Accordingly, we will have broad discretion in using these proceeds.
Pending their use, we plan to invest our net proceeds from this offering in short-term, interest-bearing obligations, investment-grade instruments, certificates of deposit or direct or guaranteed obligations of the U.S. government. Our management will have broad discretion in the application of the net proceeds from this offering to us, and investors will be relying on the judgment of our management regarding the application of the proceeds.
-48-
Table of Contents
We have never declared or paid any cash dividends on our common stock or any other securities. We anticipate that we will retain all available funds and any future earnings, if any, for use in the operation of our business and do not anticipate paying cash dividends in the foreseeable future. In addition, our revolving credit and term loan agreement materially restricts, and future debt instruments we issue may materially restrict, our ability to pay dividends on our common stock. Payment of future cash dividends, if any, will be at the discretion of our board of directors after taking into account various factors, including our financial condition, operating results, current and anticipated cash needs, the requirements of current or then-existing debt instruments and other factors our board of directors deems relevant.
-49-
Table of Contents
The following table summarizes our capitalization as of September 30, 2013:
| • | on an actual basis; |
| • | on a pro forma basis, to reflect (i) the conversion of all outstanding shares of convertible preferred stock into an aggregate of 14,218,319 shares of common stock upon the closing of this offering, (ii) the cash exercise of warrants to purchase an aggregate of 24,588 shares of common stock, which we expect will occur prior to this offering as the warrants will otherwise expire at that time, (iii) the reclassification of our preferred stock warrant liability to additional-paid-in-capital upon the closing of this offering and (iv) the filing of our amended and restated certificate of incorporation; and |
| • | on a pro forma as adjusted basis, to further reflect the sale and issuance by us of shares of common stock in this offering at an assumed initial public offering price of $ per share, the midpoint of the range reflected on the cover page of this prospectus, after deducting estimated underwriting discounts and commissions and estimated offering expenses. |
You should read the information in this table together with the financial statements and related notes to those statements, as well as the sections of this prospectus captioned “Selected financial data” and “Management’s discussion and analysis of financial condition and results of operations.”
| As of September 30, 2013 | ||||||||||||
| Actual | Pro forma | Pro forma as adjusted(1) |
||||||||||
|
|
||||||||||||
| (in thousands, except per share and share amounts) |
||||||||||||
| Long-term debt, net of current portion |
$ | 6,648 | $ | 6,648 | $ | |||||||
| Redeemable convertible preferred stock, $0.001 par value per share; issuable in series, 9,606,450 authorized, 9,541,259 shares issued and outstanding, actual, and no shares issued and outstanding, pro forma; and no shares authorized, issued or outstanding, pro forma as adjusted |
116,744 | — | ||||||||||
| Stockholders’ equity (deficit): |
||||||||||||
| Preferred stock, $0.001 par value per share; 66,666 shares authorized, 66,666 shares issued and outstanding, actual; 10,000,000 authorized, no shares issued or outstanding, pro forma and pro forma as adjusted |
247 | — | ||||||||||
| Common stock, $0.001 par value per share, 18,333,333 shares authorized, 276,618 shares issued and outstanding, actual; 66,666,666 shares authorized, 14,519,524 shares issued and outstanding, pro forma and shares issued and outstanding pro forma as adjusted |
1 | 15 | ||||||||||
| Additional paid-in capital |
— | 117,255 | ||||||||||
| Accumulated deficit |
(82,797 | ) | (82,797 | ) | ||||||||
|
|
|
|||||||||||
| Total stockholders’ (deficit) equity |
(82,549 | ) | 34,473 | |||||||||
|
|
|
|||||||||||
| Total capitalization |
$ | 40,843 | $ | 41,121 | $ | |||||||
|
|
||||||||||||
-50-
Table of Contents
| (1) | Each $1.00 increase (decrease) in the assumed initial price to the public of $ per share, the midpoint of the range reflected on the cover page of this prospectus, would increase (decrease) each of additional paid-in capital, total stockholders’ equity and total capitalization by approximately $ , assuming that the number of shares offered by us, as set forth on the cover page of this prospectus, remains the same, and after deducting estimated underwriting discounts and commissions and estimated offering expenses. We may also increase or decrease the number of shares we are offering. Each increase (decrease) of 1,000,000 shares in the number of shares offered by us would increase (decrease) each of additional paid-in capital, total stockholders’ equity and total capitalization by approximately $ , assuming that the assumed initial price to the public remains the same, and after deducting the estimated underwriting discounts and commissions and estimated offering expenses. The pro forma as adjusted information discussed above is illustrative only and will adjust based on the actual initial price to the public and other terms of this offering determined at pricing. |
The outstanding share information in the table above excludes as of September 30, 2013:
| • | 2,079,338 shares of common stock issuable upon exercise of options outstanding, 1,466,789 of which were vested and then exercisable, at a weighted average exercise price of $1.0876 per share; |
| • | 276,334 shares of common stock issuable upon the exercise of options to purchase common stock granted after September 30, 2013, at a weighted average exercise price of $8.37 per share; |
| • | 1,074,415 shares of common stock reserved for future grants under our stock-based compensation plans as of the date of this prospectus, consisting of: |
| • | 895,346 shares of common stock reserved for future grants under our 2014 Equity Incentive Plan, which will become effective immediately prior to the date of this prospectus, and any shares subject to stock options under our 2012 Equity Incentive Plan or our 2002 Amended Stock Incentive Plan that expire or otherwise terminate without having been exercised in full and any shares issued pursuant to awards granted under such plans that are forfeited to or repurchased by us, with the maximum number of shares to be added to the 2014 Equity Incentive Plan equal to 2,328,659 shares; |
| • | 179,069 shares of common stock reserved for future issuance under of 2014 Employee Stock Purchase Plan, which will become effective immediately prior to the date of this prospectus; and |
| • | Any shares of common stock that become available subsequent to this offering under our 2014 Equity Incentive Plan and 2014 Employee Stock Purchase Plan pursuant to the provisions thereof that automatically increase the shares reserved for issuance under such plans each year, as more fully described in “Executive compensation — Employee benefit and stock plans;” and |
| • | 268,200 shares of common stock issuable upon the exercise of warrants outstanding as of September 30, 2013, at a weighted average exercise price of $1.4216 per share, after conversion of the convertible preferred stock. |
-51-
Table of Contents
If you invest in our common stock in this offering you will experience immediate and substantial dilution in the pro forma as adjusted net tangible book value of your shares of common stock. Dilution in pro forma as adjusted net tangible book value represents the difference between the assumed initial price to the public per share of our common stock and the pro forma as adjusted net tangible book value per share of our common stock immediately after the offering.
Net tangible book value (deficit) per share represents our total tangible assets (total assets less intangible assets) less total liabilities and less preferred stock divided by the number of shares of outstanding common stock. The historical net tangible book value (deficit) of our common stock as of September 30, 2013 was $(83.2) million, or $(300.6) per share. Our pro forma net tangible book value as of September 30, 2013 was $ million, or $ per share, based on the total number of shares of our common stock outstanding as of September 30, 2013. Pro forma net tangible book value, before the issuance and sale of shares in this offering, gives effect to: (1) the automatic conversion of the outstanding convertible preferred stock into an aggregate of 14,218,319 shares of common stock immediately prior to the completion of this offering, (2) the cash exercise of warrants to purchase an aggregate of 24,588 shares of common stock, which we expect will occur prior to the closing of this offering as the warrants will otherwise expire at that time and (3) the reclassification of our preferred stock warrant liability to additional paid-in-capital upon the closing of this offering.
After giving effect to our sale of shares of common stock in this offering at an assumed initial public offering price $ per share, the midpoint of the range reflected on the cover page of this prospectus, and after deducting the estimated underwriting discounts and commissions and estimated offering expenses payable by us, our pro forma as adjusted net tangible book value as of September 30, 2013 would have been approximately $ million, or $ per share. This represents an immediate increase in pro forma as adjusted net tangible book value of $ per share to existing stockholders and an immediate dilution of $ per share to investors participating in this offering.
The following table illustrates this dilution on a per share basis to new investors:
| Assumed initial public offering price per share |
$ | |||||||
| Historical net tangible book value (deficit) per share as of September 30, 2013, before giving effect to this offering |
$ | (300.6 | ) | |||||
| Increase per share attributable to conversion of redeemable convertible preferred stock |
||||||||
| Pro forma net tangible book value per share as of September 30, 2013, before giving effect to this offering |
$ | |||||||
| Increase per share attributable to this offering |
||||||||
| Pro forma net tangible book value, as adjusted to give effect to this offering |
||||||||
| Dilution in pro forma net tangible book value per share to new investors purchasing shares in this offering |
$ | |||||||
|
|
||||||||
Each $1.00 increase (decrease) in the assumed initial price to the public of $ per share, the midpoint of the range reflected on the cover page of this prospectus, would increase (decrease) the pro forma as adjusted net tangible book value by approximately $ , or approximately
-52-
Table of Contents
$ per share, and increase (decrease) the dilution per share to investors participating in this offering by approximately $ per share, assuming that the number of shares offered by us, as set forth on the cover page of this prospectus, remains the same and after deducting the estimated underwriting discounts and commissions and estimated offering expenses. We may also increase or decrease the number of shares we are offering. An increase of in the number of shares offered by us would increase the pro forma as adjusted net tangible book value by approximately $ , or $ per share, and the dilution per share to investors participating in this offering would be $ per share, assuming that the assumed initial price to the public remains the same, and after deducting the estimated underwriting discounts and commissions and estimated offering expenses. Similarly, a decrease of shares in the number of shares offered by us would decrease the pro forma as adjusted net tangible book value by approximately $ , or $ per share, and the dilution per share to investors participating in this offering would be $ per share, assuming that the assumed initial price to the public remains the same, and after deducting the estimated underwriting discounts and commissions and estimated offering expenses. The pro forma as adjusted information discussed above is illustrative only and will adjust based on the actual initial price to the public and other terms of this offering determined at pricing.
The following table summarizes, on the pro forma as adjusted basis as of September 30, 2013 described above, the differences between the number of shares of common stock purchased from us, the total consideration and the weighted-average price per share paid by existing stockholders and by investors participating in this offering. For purposes of this table, only shares sold by us are included in the shares held by investors participating in this offering.
| Shares purchased | Total consideration | Weighted average price |
||||||||||||||||
| Number | Percent | Amount | Percent | per share | ||||||||||||||
|
|
||||||||||||||||||
| Existing stockholders before this offering |
% | $ | % | $ | ||||||||||||||
| Investors participating in this offering |
||||||||||||||||||
|
|
||||||||||||||||||
| Total |
% | $ | % | |||||||||||||||
|
|
||||||||||||||||||
Each $1.00 increase (decrease) in the assumed initial public offering price of $ per share would increase (decrease) total consideration paid by new investors by approximately $ , assuming that the number of shares offered by us, as set forth on the cover page of this prospectus, remains the same and after deducting the estimated underwriting discounts and commissions and estimated offering expenses. We may also increase or decrease the number of shares we are offering. An increase (decrease) of 1,000,000 in the number of shares offered by us would increase (decrease) total consideration paid by new investors by $ , assuming that the assumed initial price to the public remains the same, and after deducting the estimated underwriting discounts and commissions and estimated offering expenses.
The outstanding share information in the tables above excludes as of September 30, 2013:
| • | 2,079,338 shares of common stock issuable upon exercise of options outstanding, 1,466,789 of which were vested and then exercisable, at a weighted average exercise price of $1.0876 per share; |
| • | 276,334 shares of common stock issuable upon the exercise of options to purchase common stock granted after September 30, 2013, at a weighted average exercise price of $8.37 per share; |
-53-
Table of Contents
| • | 1,074,415 shares of common stock reserved for future grants under our stock-based compensation plans as of the date of this prospectus, consisting of: |
| • | 895,346 shares of common stock reserved for future grants under our 2014 Equity Incentive Plan, which will become effective immediately prior to the date of this prospectus, and any shares subject to stock options under our 2012 Equity Incentive Plan or our 2002 Amended Stock Incentive Plan that expire or otherwise terminate without having been exercised in full and any shares issued pursuant to awards granted under such plans that are forfeited to or repurchased by us, with the maximum number of shares to be added to the 2014 Equity Incentive Plan equal to 2,328,659 shares; |
| • | 179,069 shares of common stock reserved for future issuance under of 2014 Employee Stock Purchase Plan, which will become effective immediately prior to the date of this prospectus; and |
| • | Any shares of common stock that become available subsequent to this offering under our 2014 Equity Incentive Plan and 2014 Employee Stock Purchase Plan pursuant to the provisions thereof that automatically increase the shares reserved for issuance under such plans each year, as more fully described in “Executive compensation — Employee benefit and stock plans;” and |
| • | 268,200 shares of common stock issuable upon the exercise of warrants outstanding as of September 30, 2013, at a weighted average exercise price of $1.4216 per share, after conversion of the convertible preferred stock. |
-54-
Table of Contents
You should read the following selected financial data below in conjunction with “Management’s discussion and analysis of financial condition and results of operations” and the financial statements, related notes and other financial information included elsewhere in this prospectus. The selected financial data in this section are not intended to replace the financial statements and are qualified in their entirety by the financial statements and related notes included elsewhere in this prospectus.
The statements of operations data for the years ended December 31, 2011 and 2012 and the balance sheet data as of December 31, 2011 and 2012 are derived from our audited financial statements included elsewhere in this prospectus. The statements of operations data for the nine months ended September 30, 2012 and 2013 and the balance sheet data as of September 30, 2013 are derived from our unaudited interim financial statements included elsewhere in this prospectus. Our unaudited interim financial statements were prepared on a basis consistent with our audited financial statements and include, in our opinion, all adjustments, consisting only of normal recurring adjustments that we consider necessary for a fair presentation of the financial information set forth in those statements included elsewhere in this prospectus. Our historical results are not necessarily indicative of the results that may be expected in any future period, and our interim results are not necessarily indicative of the results that may be expected for the full year or any other period.
|
(amounts in thousands, except share and per share amounts) |
Year ended December 31, | Nine months
ended September 30, |
||||||||||||||
| 2011 | 2012 | 2012 | 2013 | |||||||||||||
|
|
||||||||||||||||
| (as restated) | (unaudited) | |||||||||||||||
| Statements of operations data: |
||||||||||||||||
| Total revenue |
||||||||||||||||
| Sales revenue |
$ | 19,076 | $ | 28,077 | 20,375 | 33,043 | ||||||||||
| Rental revenue |
10,977 | 19,872 | 13,898 | 21,901 | ||||||||||||
| Sales of used rental revenue |
46 | 95 | 53 | 200 | ||||||||||||
| Other revenue |
535 | 532 | 409 | 537 | ||||||||||||
|
|
|
|||||||||||||||
| Total revenue |
30,634 | 48,576 | 34,735 | 55,681 | ||||||||||||
|
|
|
|||||||||||||||
| Cost of revenue |
||||||||||||||||
| Cost of sales revenue |
12,127 | 17,359 | 12,679 | 18,309 | ||||||||||||
| Cost of rental revenue |
3,783 | 7,243 | 5,122 | 8,459 | ||||||||||||
| Cost of used rental equipment sales |
20 | 25 | 20 | 97 | ||||||||||||
|
|
|
|||||||||||||||
| Total cost of revenue |
15,930 | 24,627 | 17,821 | 26,865 | ||||||||||||
|
|
|
|||||||||||||||
| Gross profit |
14,704 | 23,949 | 16,914 | 28,816 | ||||||||||||
|
|
|
|||||||||||||||
| Operating expenses: |
||||||||||||||||
| Research and development |
1,789 | 2,262 | 1,731 | 1,817 | ||||||||||||
| Sales and marketing |
9,014 | 12,569 | 8,753 | 13,292 | ||||||||||||
| General and administrative |
5,623 | 8,289 | 5,805 | 9,796 | ||||||||||||
|
|
|
|||||||||||||||
| Total operating expenses |
16,426 | 23,120 | 16,289 | 24,905 | ||||||||||||
|
|
|
|||||||||||||||
| Income (loss) from operations |
(1,722 | ) | 829 | 625 | 3,911 | |||||||||||
| Other expense, net |
(267 | ) | (247 | ) | (149 | ) | (296 | ) | ||||||||
|
|
|
|||||||||||||||
| Income (loss) before provision for income taxes |
(1,989 | ) | 582 | 476 | 3,615 | |||||||||||
| Provision for income taxes |
13 | 18 | 20 | 151 | ||||||||||||
|
|
|
|||||||||||||||
| Net income (loss) |
(2,002 | ) | 564 | 456 | 3,464 | |||||||||||
| Less deemed dividend on redeemable convertible preferred stock |
(3,027 | ) | (5,781 | ) | $ | (4,119 | ) | $ | (5,359 | ) | ||||||
|
|
|
|||||||||||||||
| Net loss attributable to common stockholders |
$ | (5,029 | ) | $ | (5,217 | ) | $ | (3,663 | ) | $ | (1,895 | ) | ||||
|
|
|
|
|
|
|
|
|
|
||||||||
-55-
Table of Contents
|
(amounts in thousands, except share and per share amounts) |
Year ended December 31, | Nine months
ended September 30, |
||||||||||||||
| 2011 | 2012 | 2012 | 2013 | |||||||||||||
|
|
||||||||||||||||
| (as restated) | (unaudited) | |||||||||||||||
| Net loss attributable to common stockholders:(1) |
||||||||||||||||
| Basic: |
$ | (20.15 | ) | $ | (19.97 | ) | $ | (14.02 | ) | $ | (6.91 | ) | ||||
| Diluted: |
$ | (20.15 | ) | $ | (19.97 | ) | $ | (14.02 | ) | $ | (6.91 | ) | ||||
| Weighted average shares used in computing net loss per share attributable to common stockholders:(1) |
||||||||||||||||
| Basic: |
249,519 | 261,268 | 261,216 | 274,357 | ||||||||||||
| Diluted: |
249,519 | 261,268 | 261,216 | 274,357 | ||||||||||||
| Unaudited pro forma net income (loss) per share attributable to common stockholders:(1) |
||||||||||||||||
| Basic: |
$ | 0.04 | $ | 0.24 | ||||||||||||
| Diluted: |
$ | 0.04 | $ | 0.22 | ||||||||||||
| Unaudited weighted average shares used in computing pro forma net income per share attributable to common stockholders: |
||||||||||||||||
| Basic: |
14,601,861 | 14,516,523 | ||||||||||||||
| Diluted: |
15,486,487 | 15,733,279 | ||||||||||||||
| Other financial data: |
||||||||||||||||
| EBITDA(2) |
$ | 1,357 | $ | 5,971 | $ | 4,224 | $ | 9,913 | ||||||||
| Adjusted EBITDA(2) |
$ | 1,620 | $ | 5,883 | $ | 4,124 | $ | 10,231 | ||||||||
|
|
||||||||||||||||
| (1) | See note 2 to each of our audited and unaudited financial statements included elsewhere in this prospectus for an explanation of the calculations of our basic and diluted net loss per share attributable to common stockholders and pro forma net loss per share attributable to common stockholders. |
| (2) | For a discussion of our use of EBITDA and Adjusted EBITDA and their calculations, please see “—Non GAAP financial measures.” |
| Year ended December 31, |
Nine months ended September 30, |
|||||||||||||||
| (amounts in thousands) | 2011 | 2012 | 2012 | 2013 | ||||||||||||
|
|
|
|
|
|
||||||||||||
| (as restated) | (unaudited) | |||||||||||||||
| Balance sheet data: |
||||||||||||||||
| Cash and cash equivalents |
$ | 3,906 | $ | 15,112 | $ | 17,098 | $ | 17,059 | ||||||||
| Working capital |
1,302 | 12,880 | 15,297 | 12,352 | ||||||||||||
| Total assets |
24,131 | 47,586 | 47,246 | 60,862 | ||||||||||||
| Total indebtedness |
9,629 | 8,936 | 9,619 | 12,027 | ||||||||||||
| Deferred revenue |
594 | 1,094 | 851 | 1,961 | ||||||||||||
| Total liabilities |
16,575 | 19,011 | 19,043 | 26,667 | ||||||||||||
| Redeemable convertible preferred stock |
83,122 | 109,345 | 107,431 | 116,744 | ||||||||||||
| Total stockholders’ deficit |
75,566 | 80,770 | 79,228 | 82,549 | ||||||||||||
|
|
||||||||||||||||
Non-GAAP financial measures
EBITDA and Adjusted EBITDA are a financial measures that are not calculated in accordance with generally accepted accounting principles in the United States, or GAAP. We define EBITDA as net income or loss excluding interest income, interest expense, taxes and depreciation and amortization. Adjusted EBITDA also excludes the change in the fair value of our preferred stock warrant liability and stock-based compensation. Below, we have provided a reconciliation of EBITDA and Adjusted EBITDA to our net income or loss, the most directly comparable financial measure calculated and presented in accordance with GAAP. EBITDA and Adjusted EBITDA
-56-
Table of Contents
should not be considered alternatives to net income or loss or any other measure of financial performance calculated and presented in accordance with GAAP. Our EBITDA and Adjusted EBITDA may not be comparable to similarly titled measures of other organizations because other organizations may not calculate EBITDA and Adjusted EBITDA in the same manner as we calculate these measures.
We include EBITDA and Adjusted EBITDA in this prospectus because they are important measures upon which our management assesses our operating performance. We use EBITDA and Adjusted EBITDA as key performance measures because we believe they facilitate operating performance comparisons from period to period by excluding potential differences primarily caused by variations in capital structures, tax positions, the impact of depreciation and amortization expense on our fixed assets, changes related to the fair value remeasurements of our preferred stock warrant, and the impact of stock-based compensation expense. Because EBITDA and Adjusted EBITDA facilitate internal comparisons of our historical operating performance on a more consistent basis, we also use EBITDA and Adjusted EBITDA for business planning purposes, to incentivize and compensate our management personnel, and in evaluating acquisition opportunities. In addition, we believe EBITDA and Adjusted EBITDA and similar measures are widely used by investors, securities analysts, ratings agencies, and other parties in evaluating companies in our industry as a measure of financial performance and debt-service capabilities.
Our use of EBITDA and Adjusted EBITDA have limitations as analytical tools, and you should not consider them in isolation or as a substitute for analysis of our results as reported under GAAP. Some of these limitations are:
| • | EBITDA and Adjusted EBITDA do not reflect our cash expenditures for capital equipment or other contractual commitments; |
| • | Although depreciation and amortization are non-cash charges, the assets being depreciated and amortized may have to be replaced in the future, and EBITDA and Adjusted EBITDA do not reflect capital expenditure requirements for such replacements; |
| • | EBITDA and Adjusted EBITDA do not reflect changes in, or cash requirements for, our working capital needs; |
| • | EBITDA and Adjusted EBITDA do not reflect the interest expense or the cash requirements necessary to service interest or principal payments on our indebtedness; and |
| • | Other companies, including companies in our industry, may calculate EBITDA and Adjusted EBITDA measures differently, which reduces their usefulness as a comparative measure. |
In evaluating EBITDA and Adjusted EBITDA, you should be aware that in the future we will incur expenses similar to the adjustments in this presentation. Our presentation of EBITDA and Adjusted EBITDA should not be construed as an inference that our future results will be unaffected by these expenses or any unusual or non-recurring items. When evaluating our performance, you should consider EBITDA and Adjusted EBITDA alongside other financial performance measures, including our net loss and other GAAP results.
-57-
Table of Contents
The following table presents a reconciliation of EBITDA and Adjusted EBITDA to our net income or loss, the most comparable GAAP measure, for each of the periods indicated:
| EBITDA and Adjusted EBITDA | Year ended December 31, |
Nine months ended September 30, |
||||||||||||||
| (in thousands) | 2011 | 2012 | 2012 | 2013 | ||||||||||||
|
|
|
|
|
|
||||||||||||
| (as restated) |
(unaudited) | |||||||||||||||
| Net income (loss) |
$ | (2,002 | ) | $ | 564 | $ | 456 | $ | 3,464 | |||||||
| Non-GAAP adjustments: |
||||||||||||||||
| Interest income |
(113 | ) | (88 | ) | (84 | ) | (9 | ) | ||||||||
| Interest expense |
261 | 493 | 381 | 312 | ||||||||||||
| Provision for income taxes |
13 | 18 | 20 | 151 | ||||||||||||
| Depreciation and amortization |
3,198 | 4,984 | 3,451 | 5,995 | ||||||||||||
|
|
|
|
|
|
|
|
|
|||||||||
| EBITDA |
1,357 | 5,971 | 4,224 | 9,913 | ||||||||||||
| Change in fair value of preferred stock warrant liability |
119 | (148 | ) | (148 | ) | 202 | ||||||||||
| Stock-based compensation |
144 | 60 | 48 | 116 | ||||||||||||
|
|
|
|
|
|
|
|
|
|||||||||
| Adjusted EBITDA |
$ | 1,620 | $ | 5,883 | $ | 4,124 | $ | 10,231 | ||||||||
|
|
||||||||||||||||
58
Table of Contents
Management’s discussion and analysis of financial condition and results of operations
You should read the following discussion and analysis of our financial condition and results of operations together with the financial statements and the related notes thereto included elsewhere in this prospectus. This discussion contains forward-looking statements that reflect our plans, estimates and beliefs. Our actual results may differ materially from those discussed in these forward-looking statements. Factors that could cause or contribute to these differences include those discussed below and elsewhere in this prospectus, particularly in the section of the prospectus entitled “Risk factors” and “Special note regarding forward-looking statements.”
Overview
We are a medical technology company that develops, manufactures and markets innovative portable oxygen concentrators used to deliver supplemental long-term oxygen therapy to patients suffering from chronic respiratory conditions. Traditionally, these patients have relied on stationary oxygen concentrator systems for use in the home and oxygen tanks or cylinders for mobile use. The tanks and cylinders must be delivered regularly and have a finite amount of oxygen, which limits patient mobility and requires patients to plan activities outside of their homes around delivery schedules. Additionally, patients must attach long, cumbersome tubing to their stationary concentrators simply to enable mobility within their homes. We refer to this traditional delivery approach as the delivery model. Our proprietary Inogen One systems are portable devices that concentrate the air around them to offer a single source of supplemental oxygen anytime, anywhere. Using our systems, patients can eliminate their dependence on stationary concentrators and tank and cylinder deliveries, thereby improving quality-of-life and fostering mobility.
In May 2004, we received 510(k) clearance from the U.S. Food and Drug Administration, or the FDA, for our Inogen One G1. Since we launched the Inogen One G1 in 2004, through 2008, we derived our revenue almost exclusively from sales to healthcare providers and distributors. In December 2008, we acquired Comfort Life Medical Supply, LLC in order to secure access to the Medicare rental market and began accepting Medicare reimbursement for our oxygen solutions in certain states. At the time of the acquisition, Comfort Life Medical Supply, LLC had an active Medicare billing number but few other assets and limited business activities. In January 2009, following the acquisition of Comfort Life Medical Supply, LLC, we initiated our direct-to-consumer marketing strategy and began selling Inogen One systems directly to patients and building our Medicare rental business in the United States. In April 2009, we became a Durable, Medical Equipment, Prosthetics, Orthotics, and Supplies accredited Medicare supplier by the Accreditation Commission for Health Care for our Goleta, California facility for Home/Durable Medical Equipment Services for oxygen equipment and supplies. We believe we are the only portable oxygen concentrator manufacturer that employs a direct-to-consumer marketing strategy in the United States, meaning we advertise directly to patients, process their physician paperwork, provide clinical support as needed and bill Medicare or insurance on their behalf.
We believe our direct-to-consumer strategy has been critical to driving patient adoption of our technology. All other portable oxygen concentrator manufacturers access patients through home medical equipment providers, which we believe are disincentivized to encourage portable oxygen concentrator adoption. In order to facilitate the regular delivery and pickup of oxygen tanks, home medical equipment providers have invested in geographically dispersed distribution
-59-
Table of Contents
infrastructures consisting of delivery vehicles, physical locations, and delivery personnel within each area. Because portable oxygen concentrator technology eliminates the need for physical distribution infrastructure but has higher initial equipment costs than oxygen tanks and cylinders, we believe converting to a portable oxygen concentrator model would require both significant restructuring and capital investment for home medical equipment providers. Our direct-to-consumer marketing strategy allows us to sidestep the home medical equipment channel, appeal to patients directly, and capture both the manufacturing and provider margin. We believe our ability to capture this top-to-bottom margin, combined with our portable oxygen concentrator technology that eliminates the need for the costs associated with oxygen deliveries, gives us a cost structure advantage over our competitors using the delivery model.
We derive a majority of our revenue from the sale and rental of our Inogen One systems and related accessories to patients, insurance carriers, home healthcare providers and distributors. We sell multiple configurations of our Inogen One systems with various batteries, accessories, warranties, power cords, and language settings. We also rent our products to Medicare beneficiaries and patients with other insurance coverage to support their oxygen needs as prescribed by a physician as part of a care plan. Our goal is to design, build and market oxygen solutions that redefine how oxygen therapy is delivered. To accomplish this goal and to grow our revenue, we intend to continue to:
| • | Expand our sales and marketing channels. We will continue to hire additional internal sales representatives to drive our direct-to-consumer marketing efforts. During the year ended December 31, 2013, we increased our internal sales force from 93 to 108. Additionally, we are building a physician referral channel that currently consists of ten employees. Lastly, we are focused on building our international distribution capabilities. |
| • | Invest in our product offerings to develop innovative products. We expended $1.8 million and $2.3 million in 2011 and 2012, respectively, in research and development expenses, and we intend to continue to make such investments in the foreseeable future. |
| • | Secure contracts with healthcare payors and insurers. Based on our patient population, we estimate that at least 30% of oxygen therapy patients are covered by non-Medicare payors, and that these patients often represent a younger, more active patient segment. By becoming an in-network provider with more insurance companies, we can reduce the co-pay for patients, which we believe will allow us to attract additional patients to our Inogen One solutions. |
We have been developing and refining the manufacturing of our Inogen One Systems over the past eight years. While nearly all of our manufacturing and assembly processes were originally outsourced, assembly of the manifold, compressor, sieve bed and concentrator is now conducted in-house in order to improve quality control and reduce cost. Additionally, we use lean manufacturing practices to maximize manufacturing efficiency. We rely on third-party manufacturers to supply several components of our Inogen One Systems. We typically enter into supply agreements for these components that specify quantity, quality requirements and delivery terms. In certain cases, these agreements can be terminated by either party upon relatively short notice. We have elected to source certain key components from single sources of supply, including our batteries, bearings, carry bags, motors, pistons, valves, and molded plastic components. While alternative sources of supply are readily available for these components, we believe that maintaining a single-source of supply allows us to control production costs and inventory levels, and to manage component quality.
-60-
Table of Contents
Historically, we have generated a majority of our revenue from sales and rentals to customers in the United States. In 2011 and 2012, approximately 26% and 27%, respectively, of our total revenue was from customers outside the United States, primarily in Europe. To date, all of our revenue has been denominated in United States dollars. We sell our products in 41 countries outside the United States through distributors or directly to large “house” accounts, which include gas companies and home oxygen providers. In this case, we sell to and bill the distributor or “house” accounts directly, leaving responsibility for the patient billing, support and clinical setup to the local provider. As of January 1, 2014, we have four employees who focused on selling our products to distributors and “house” accounts outside the United States.
Our total revenue increased to $48.6 million in 2012 from $10.7 million in 2009, due to growth in rental revenue associated with an increase in the number of patients using Medicare or private payors to rent our products, and growth in sales revenue associated with the increases in international sales and direct-to-consumer cash sales of our Inogen One systems and new product launches. In 2010 our total revenue was $23.6 million and in 2011 our total revenue was $30.6 million. We generated Adjusted EBITDA of $1.6 million and $5.9 million in 2011 and 2012, respectively. We generated a net loss of $2.0 million in 2011 and net income of $0.6 million in 2012. For the nine months ended September 30, 2013, we had total revenue and net income of $55.7 million and $3.5 million, respectively. As of September 30, 2013, our accumulated deficit was $82.6 million.
The vast majority of our revenue consists of sales revenue and rental revenue.
Sales revenue
Our future financial performance will be driven in part by the growth in sales of our Inogen One systems, and, to a lesser extent, sales of batteries and other accessories. We plan to grow our system sales in the coming years through multiple strategies, including: expanding our direct-to-consumer sales efforts through hiring additional sales representatives, investing in consumer awareness, expanding our sales infrastructure and efforts outside of the United States and enhancing our product offerings through additional product launches. As our product offerings grow, we solicit feedback from our customers and focus our research and development efforts on continuing to improve patient preference and reduce the total cost of the product, in order to further drive sales of our products.
Our direct-to-consumer sales process involves numerous interactions with the individual patient, the physician and the physician’s staff, and includes an in-depth analysis and review of our product, the patient’s diagnosis and prescribed oxygen therapy, including procuring an oxygen prescription, and assessing the patient’s available insurance benefits. The patient may consider whether to finance the product through an Inogen-approved third party or whether to purchase the equipment. Product is not deployed until both the prescription and payment are received. Once product is deployed, the patient has 30 days to return the product under a trial, subject to the patient payment of a minimal processing and handling fee. Approximately 5% to 10% of patients who purchase a system for cash return the system during this 30-day trial period. As a result, we have experienced fluctuations in our direct-to-consumer sales on a period-to-period basis in the past, a trend that we anticipate will continue in the future.
Our business-to-business efforts are focused on selling to home medical equipment distributors, oxygen providers and resellers who are primarily based outside of the United States. This process involves interactions with various key customer stakeholders, including sales, purchasing, product
-61-
Table of Contents
testing, and clinical personnel. Businesses that have patient demand that can be met with our portable oxygen concentrator systems place purchase orders to secure product deployment. This may be influenced based on outside factors, including the result of tender offerings, changes in insurance plan coverage, and overall changes in the net oxygen therapy patient population. Products are shipped FOB Inogen, and based on financial history and profile, businesses may either prepay or receive extended terms. As a result of these factors, product purchases can be subject to changes in demand by customers. Given the potential for variability in ordering history that we have in the past experienced, and likely will in the future experience, there may be fluctuations in our business-to-business sales on a period-to-period basis.
We sold more than 7,300 Inogen One systems in 2011 and 11,900 Inogen One systems in 2012. Management focuses on system sales as an indicator of current business success.
Rental revenue
Our rental process involves numerous interactions with the individual patient, the physician and the physician’s staff. The process includes an in-depth analysis and review of our product, the patient’s diagnosis and oxygen needs, and their medical history to confirm the appropriateness of our product for the patient’s oxygen therapy and compliance with Medicare and private payor billing requirements, which often necessitates additional physician evaluation and/or testing as well as a Certificate of Medical Necessity. Once the product is deployed, the patient receives direction on product use and receives a clinical titration from our trained staff to confirm the product meets the patient’s needs prior to billing. As a result, the time from initial contact with a customer to billing can vary significantly and be up to one month or longer.
We plan to grow our rental revenue in the coming years through multiple strategies, including expanding our direct-to-consumer marketing efforts through hiring additional sales representatives and investing in patient awareness and physician-based sales, securing additional insurance contracts and continuing to enhance our product offerings through additional product launches. In addition, patients may come off of our services due to death, a change in their condition, a change in location, a change in provider or other factors. In each case, we maintain asset ownership and can redeploy assets as appropriate following such events. Given the length and uncertainty of our patient acquisition cycle and potential returns we have in the past experienced, and likely will in the future experience, there may be fluctuations in our net new patient setups on a period-to-period basis.
As the rental patient base increases, this rental model generates recurring revenue with minimal additional sales and general and administrative expenses. A portion of rentals include a capped rental period when no additional reimbursement will be allowed unless additional criteria are met. In this scenario, the ratio of billable patients to patients on service is critical to maintaining rental revenue growth as patients on service increases. As the rental base expands, we expect our rental revenue to increase and over time to become an increasingly important contributor to our total revenue. Over time, we believe that our rental revenue should be subject to less period-to-period fluctuation than our sales revenue.
As of December 31, 2012, we had over 13,500 oxygen rental patients, an increase from over 7,500 oxygen rental patients as of December 31, 2011. Management focuses on rental revenue as an indicator of current business success and a leading indicator of likely future rental revenue; however, actual rental revenue recognized is subject to a variety of other factors, including reimbursement levels by patient zip code, the number of capped patients, and adjustments for patients in transition.
-62-
Table of Contents
Reimbursement
We rely heavily on reimbursement from Medicare, and secondarily from private payors and Medicaid, for our rental revenue. For the nine months ended September 30, 2013, approximately 73% of our rental revenue was derived from Medicare reimbursement. The U.S. Medicare list price for our stationary oxygen rentals (E1390) is $260 per month and for our oxygen generating portable equipment (OGPE) rentals (E1392) is $70 per month. The current standard Medicare allowable effective January 1, 2014 for stationary oxygen rentals (E1390) is $178.24 per month and for OGPE rentals (E1392) is $51.63 per month. These are the two primary codes that we bill to Medicare and other payors for our product rentals.
As of January 1, 2011, Medicare has phased in a program called competitive bidding. Competitive bidding impacts the amount Medicare pays suppliers of durable medical equipment, including portable oxygen concentrators. The program is defined geographically, with suppliers submitting bids to provide medical equipment for a specific product category within that geography. Once bids have been placed, an individual company’s bids across products within the category are aggregated and weighted by each product’s market share in the category. The weighted average price is then indexed against competitors. Medicare determines a “clearing price” out of these weighted average prices at which sufficient suppliers have indicated they will support patients in the category, and this threshold is typically designed to generate theoretical supply that is twice the expected demand. Bids for each modality among the suppliers that made the cut are then arrayed to determine what Medicare will reimburse for each product category. The program has strict anti-collusion guidelines to ensure bidding is truly competitive. Competitive bidding contracts last three years once implemented, after which they are subject to a new round of bidding. Discounts off the standard Medicare allowable occur in competitive bidding Metropolitan Statistical Areas where contracts have been awarded as well as in cases where private payors pay less than this allowable. Current Medicare payment rates in competitive bidding areas are at 48-64% of the standard Medicare allowable for stationary oxygen rentals (average of $93.29 per month) and OGPE rentals are at 70-92% of the standard Medicare allowable (average of $42.33 per month). Competitive bidding rates are based on the zip code where the patient resides. Rental revenue includes payments for product, disposables, and customer service/support.
The following table sets forth the current Medicare standard allowable reimbursement rates and the weighted average reimbursement rates applicable in Metropolitan Statistical Areas covered by rounds one and two of competitive bidding. The round one re-compete was completed in the same Metropolitan Statistical Areas as round one for the next three year period starting 1/1/14 when the original contracts expire.
| Medicare effective 1/1/14 |
Round one weighted average 1/1/11- 12/11/13 |
Round two weighted average 7/1/13- 6/30/16 |
Round one re- compete weighted average 1/1/14- 12/31/16 |
|||||||||||||
|
|
||||||||||||||||
| E1390 |
$ | 178.24 | $ | 116.16 | $ | 93.10 | $ | 95.74 | ||||||||
| E1392 |
51.63 | 41.89 | 42.69 | 38.08 | ||||||||||||
|
|
|
|||||||||||||||
| Total |
$ | 229.87 | $ | 158.05 | $ | 135.79 | $ | 133.82 | ||||||||
| % of standard |
69% | 59% | 58% | |||||||||||||
|
|
||||||||||||||||
-63-
Table of Contents
In addition to reducing the Medicare reimbursement rates in the Metropolitan Statistical Areas, the competitive bidding program has effectively reduced the number of oxygen suppliers that can participate in the Medicare program. We believe that more than 75% of existing oxygen suppliers were eliminated in round one of competitive bidding, which was implemented January 1, 2011 in 9 Metropolitan Statistical Areas. Round two of competitive bidding was implemented July 1, 2013 in 91 Metropolitan Statistical Areas and we believe the impact on the number of oxygen suppliers will be similar when released. We believe that 59% of the market was covered by round one and round two of competitive bidding.
Cumulatively in rounds one, two and round one re-compete, we were offered contracts for a substantial majority of the competitive bidding areas and products for which we submitted bids. However, there is no guarantee that we will garner additional market share as a result of these contracts. The contracts include products that may require us to subcontract certain services or products to third parties, which must be approved by the Centers for Medicare & Medicaid Services.
Following round one of competitive bidding, we were excluded from the Kansas City-MO-KS, Miami-Fort Lauderdale-Pompano-FL, and Orlando—Kissimmee-FL competitive bidding areas and Honolulu-Hawaii, where we have never maintained a license. After round one recompete, we gained access to Kansas City-MO-KS and were excluded from the following competitive bidding areas: Cleveland-Elyria-Mentor-OH, Cincinnati-Middletown-OH, Miami-Fort Lauderdale-Pompano-FL, Orlando—Kissimmee-FL, Pittsburg-PA, Riverside-San Bernardino-Ontario-CA. After round two of competitive bidding, we were excluded from an additional 10 competitive bidding areas, including Akron-OH, Cape Coral-Fort Myers-FL, Deltona-Daytona Beach-Ormond Beach-FL, Jacksonville-FL, Lakeland-Winter Haven-FL, North Port-Bradenton-Sarasota-FL, Ocala, Palm Bay-Melbourne-Titusville-FL, Tampa-St. Petersburg-Clearwater-FL and Toledo-OH. Collectively, we have incrementally lost access to approximately seven percent of the Medicare market. As a result, on a going forward basis we will continue to have access to approximately 90% of the Medicare market based on our analysis of the 92 competitive bidding areas that we have won out of the 109 competitive bidding areas, representing 59% of the market, with the remaining 41% of the market not subject to competitive bidding. The incremental loss of access to approximately seven percent of the Medicare market is expected to have an adverse impact on our rental business, which represented approximately 40% of our total revenue in the three and nine months ended on September 30, 2013. However, we expect the decline in total revenue resulting from the loss of competitive bidding contract in the areas that we were excluded from to be partially offset by the grandfathering of existing Medicare patients and direct sales to former Medicare patients with third party insurance coverage or who pay cash.
Under the Medicare competitive bidding program, oxygen therapy providers may “grandfather” existing patients on service up to the implementation date of competitive bidding program. This means oxygen therapy providers may retain all existing patients and continue to receive reimbursement for them so long as the new reimbursement rate is accepted and the applicable beneficiary chooses to continue to receive equipment from the provider. Providers must either keep or release all patients under this “grandfathering” arrangement in each competitive bidding area; specific individual selection of patients for retention or release is not allowed. Providers can continue to sell equipment in competitive bid areas where they were not awarded contracts to patients paying with cash or third-party insurance coverage.
We have elected to grandfather and retain all patients in competitive bid areas where contracts were not awarded to us. In addition, we plan to continue to accept patients in competitive
-64-
Table of Contents
bidding areas where we did not receive contracts through private insurance. We will also pursue retail sales of our equipment to patients in those areas.
For rental equipment, Medicare reimbursement for oxygen equipment is limited to a maximum of 36 months, after which time the equipment continues to be owned by the home oxygen provider for as long as the patient’s medical need exists. The provider that billed Medicare for the 36th month continues to be responsible for the patient’s care for months 37 through 60, and there is generally no additional reimbursement for oxygen generating portable equipment for these later months. The Centers for Medicare & Medicaid Services does not reimburse suppliers for oxygen tubing, cannulas and supplies that may be required for the patient. The provider is required to keep the equipment provided in working order and in some cases the Centers for Medicare & Medicaid Services will reimburse for repair costs. After the five year useful life is reached, the patient may request replacement equipment and, if he or she can be re-qualified for the Medicare benefit, a new maximum 36-month rental period would begin. The supplier may not arbitrarily issue new equipment. We cannot state with certainty the number of patients in the capped rental period or the potential impact to revenue associated with patients in the capped rental period.
Our obligations to service assigned Medicare patients over the contract rental period include supplying working equipment that meets the patient’s oxygen needs pursuant to their doctor’s prescription and certificate of medical necessity form and supplying all disposables required for the patient to operate the equipment, including cannulas, filters, replacement batteries, carts and carry bags, as needed. If the equipment malfunctions, we must repair or replace the equipment. We determine what equipment the patient receives, and we can deploy existing used assets as long as the doctor’s requirements are met. We must also procure a recertification certificate of medical necessity from the patient’s doctor to confirm the patient’s need for oxygen therapy one year after first receiving oxygen therapy and one year after each new 36-month reimbursement period begins. These contracts are cancellable by the patient at any time and by the provider at any time as long as the patient can transition to another provider.
In addition to the adoption of the competitive bidding program, reimbursable fees for oxygen rental services in non-competitive bidding areas were eligible to receive mandatory annual Consumer Price Index for all Urban Consumers, or CPI-U, updates beginning in 2010. The CPI-U for 2012 was +3.6%, but the “multi-factor productivity adjustment” remained -1.2%, so the net result was a 2.4% increase in fee schedule payments in 2012 for items and services not included in an area subject to competitive bidding. For 2013, the CPI-U is +1.7%, but the adjustment is -0.9%, so the net result is a 0.8% increase in fee schedule payments in 2013. For 2014, the CPI-U is +1.8%, but the adjustment is -0.8%, so the net result is a 1.0% increase in fee schedule payments in 2014. However, the stationary oxygen equipment codes payment amounts, as required by statute, must be adjusted on an annual basis, as necessary, to ensure budget neutrality of the new payment class for oxygen generating portable equipment. Thus, the increase in allowable for stationary oxygen equipment codes increased 0.5% from 2013 to 2014. At this time, it is unclear if the current CPI-U method or a proposed inflation method included in President Obama’s 2014 fiscal budget proposal would apply to future year’s calculations.
As of September 30, 2013, we had 30 contracts with Medicaid and private payors. These contracts qualify us an in-network provider for these payors. As a result, patients can use our systems at the same cost as other in-network oxygen therapy solutions, including those utilizing the delivery model. Based on our patient population, we believe at least 30% of all oxygen therapy patients are covered by private payors. Private payors typically provide reimbursement at 60% to 100% of
-65-
Table of Contents
Medicare allowables for in-network plans, and private payor plans have 36-month caps similar to Medicare. We anticipate that private payor reimbursement levels will generally be reset in accordance with Medicare payment amounts established through competitive bidding.
We cannot predict the full extent to which reimbursement for our products will be affected by competitive bidding or by initiatives to reduce costs for private payors. We believe that we are well positioned to respond to the changing reimbursement environment because our product offerings are innovative, patient-focused and cost-effective. We have historically been able to reduce our costs through scalable manufacturing, better sourcing, continuous innovation, and reliability improvements, as well as innovations that reduce our product service costs by minimizing exchanges, such as user replaceable batteries and oxygen filtration cartridges. As a result of bringing manufacturing and assembly largely in-house and our commitment to driving efficient manufacturing processes, we have reduced our overall system cost by 36% since 2009. We intend to continue to seek ways to reduce our cost of revenue through manufacturing and design improvements.
Basis of presentation
The following describes the line items set forth in our statements of operations.
Revenue
We classify our revenue in four main categories: sales revenue, rental revenue, sale of used rental equipment and other revenue. There will be fluctuations in mix between business-to-business sales, direct-to-consumer sales and rentals from period to period. We expect rental revenue should constitute a larger percentage of total revenue, which would increase our gross margins. In addition, we expect both the average selling price and the manufacturing cost of our products to decrease following the introduction of future generations of our Inogen One systems. Inogen One system selling prices and gross margins for our Inogen One systems may fluctuate as we introduce new products and reduce our product costs. For example, the gross margin for our Inogen One G3 is higher than our Inogen One G2. Thus, to the extent our sales of our Inogen One G3 systems are higher than sales of our Inogen One G2 systems, our overall gross margins should improve and, conversely, to the extent our sales of our Inogen One G2 systems are higher than sales of our Inogen One G3 systems, our overall gross margins should decline.
Sales revenue. Our sales revenue is derived from the sale of our Inogen One systems and related accessories to patients in the United States and to home healthcare providers, distributors and resellers worldwide. Sales revenue is classified into two areas: business-to-business sales and direct-to-consumer sales. Business-to-business sales were 67% of sales revenue in 2011 and 68% of sales revenue in 2012. For the nine months ended September 30, 2012 and 2013, business-to-business sales as a percentage of sales revenue were 69% and 61%, respectively. Generally, our direct-to-consumer sales have higher margins than our business-to-business sales.
Rental revenue. Our rental revenue is derived from the rental of our Inogen One systems to patients through Medicare, private payors and Medicaid, which typically also include a patient responsibility component for patient co-insurance and deductibles. Generally, our product rentals have higher gross margins than our product sales.
Sales of used rental equipment. Our sales of used rental equipment revenue is derived from the sale of our Inogen One systems and related accessories to home healthcare providers and
-66-
Table of Contents
patients when the product has previously been sold or rented to another patient or business. Sales in this category are not material.
Other revenue. Other revenue consists of service and freight revenue. Revenue from the sales of our services is recognized when no significant obligations remain undelivered and collection of the receivables is reasonably assured. We offer extended service contracts on our Inogen One concentrator line for periods ranging from 12 to 24 months after the end of the standard warranty period. Revenue from these extended service contracts is recognized in income on a straight-line basis over the contract period.
We also offer a lifetime warranty for direct-to-consumer sales. For a fixed price, we agree to provide a fully functional oxygen concentrator for the remaining life of the patient. Lifetime warranties are only offered to patients upon the initial sale of oxygen equipment by us, and are non-transferable. Product sales with lifetime warranties are considered to be multiple element arrangements within the scope of ASC 605-25.
There are two deliverables when product that includes a lifetime warranty is sold. The first deliverable is the oxygen concentrator equipment which comes with a standard warranty of three years. The second deliverable is the lifetime warranty that provides for a functional oxygen concentrator for the remaining lifetime of the patient. These two deliverables qualify as separate units of accounting.
The revenue is allocated to the two deliverables on a relative selling price method. We have vendor-specific objective evidence of selling price for the equipment. To determine the selling price of the lifetime warranty, we use our best estimate of the selling price for that deliverable as the lifetime warranty is neither separately priced nor selling price is available through third-party evidence. To calculate the selling price associated with the lifetime warranties, management considered the profit margins of the overall business, the average estimated cost of lifetime warranties and the price of extended warranties. A significant estimate used to calculate the price and expense of lifetime warranties is the life expectancy of patients. Based on clinical studies, we estimate that 60% of patients will succumb to their disease within three years. Given the approximate mortality rate of 20% per year, we estimate on average all patients will succumb to their disease within five years. We have taken into consideration that when patients decide to buy an Inogen portable oxygen concentrator with a lifetime warranty, they typically have already been on oxygen for a period of time, which can have a large impact on their life expectancy from the time our product is deployed.
After applying the relative selling price method, revenue from equipment sales is recognized when all other revenue recognition criteria for product sales are met. Lifetime warranty revenue is recognized using the straight-line method during the fourth and fifth year after the delivery of the equipment which is the estimated usage period of the contract based on the average patient life expectancy.
Freight revenue consists of fees associated with the deployment of products internationally or domestically, when expedited freight options or minimum order quantities are not met. Freight revenue is a percentage markup of freight costs.
Cost of revenue
Cost of sales revenue and cost of used rental equipment sales consists primarily of costs incurred in the production process, including costs of component materials, assembly labor and overhead,
-67-
Table of Contents
warranty, provisions for slow-moving and obsolete inventory and delivery costs for items sold. Cost of rental revenue consists primarily of depreciation expense and service costs for rental assets, including material, labor, freight, consumable disposables and logistics costs. We provide a three-year or lifetime warranty on Inogen One systems sold, and we establish a reserve for warranty repairs based on historical warranty repair costs incurred. Provisions for warranty obligations, which are included in cost of sales revenue, are provided for at the time of shipment. We expect the average unit costs of our Inogen One systems to decline in future periods as a result of our ongoing efforts to develop lower-cost Inogen One systems and to improve our manufacturing processes, reduced rental service costs and expected increases in production volume and yields.
Operating expenses
Research and development
Research and development expenses consist primarily of personnel-related expenses, including salaries, benefits and stock-based compensation, allocated facility costs, laboratory supplies, consulting fees and related costs, costs associated with patent amortization costs, patent legal fees including defense costs and testing costs for new product launches. We have made substantial investments in research and development since our inception. Our research and development efforts have focused primarily on the tasks required to enhance our technologies and to support development and commercialization of new and existing products. We expect to have moderate increases in research and development expense over time.
Sales and marketing
Our sales and marketing expenses primarily support our direct-to-consumer strategy. Our sales and marketing expenses consist primarily of personnel-related expenses, including salaries, commissions, benefits, and stock-based compensation, for employees, and allocated facilities costs. They also include expenses for media and advertising, informational kits, public relations and other promotional and marketing activities, including travel and entertainment expenses, as well as customer service and clinical services. Sales and marketing expenses increased throughout 2012 primarily due to an increase in the sales force and the increasing number of rental patients and we expect a further increase in 2013 as we continue to increase sales and marketing activities.
General and administrative
General and administrative expenses consist primarily of personnel-related expenses, including salaries, benefits, and stock-based compensation for employees in our compliance, finance, medical billing, human resources, information technology, business development and general management functions, and allocated facilities costs. In addition, general and administrative expenses include professional services, such as legal, consulting and accounting services. We expect general and administrative expenses to increase in future periods as the number of administrative personnel grows and we continue to introduce new products, broaden our customer base and grow our business. We also expect legal, accounting and compliance costs to increase due to costs associated with our initial public offering and with being a public company.
Other income (expense), net
Other income (expense), net consists primarily of interest expense related to our revolving credit and term loan agreement and interest income driven by the interest accruing on cash and cash
-68-
Table of Contents
equivalents and on past due customer balances. Other income (expense) also includes the change in valuation of warrant liability based on the Monte Carlo valuation model.
Result of operations
Comparison of nine months ended September 30, 2012 and 2013 and
selected three months ended September 30, 2012 and 2013
Revenue
| Nine months
ended September 30, |
Change 2012 v. 2013 | |||||||||||||||
| (dollars in thousands) | 2012 | 2013 | $ | % | ||||||||||||
|
|
||||||||||||||||
| Revenue: |
||||||||||||||||
| Sales revenue |
$ | 20,375 | $ | 33,043 | $ | 12,668 | 62.2% | |||||||||
| Rental revenue |
13,898 | 21,901 | 8,003 | 57.6% | ||||||||||||
| Sales of used equipment |
53 | 200 | 147 | 277.4% | ||||||||||||
| Other revenue |
409 | 537 | 128 | 31.3% | ||||||||||||
|
|
|
|||||||||||||||
| Total revenue |
$ | 34,735 | $ | 55,681 | $ | 20,946 | 60.3% | |||||||||
|
|
||||||||||||||||
| Three months
ended September 30, |
Change 2012 v. 2013 | |||||||||||||||
| (dollars in thousands) | 2012 | 2013 | $ | % | ||||||||||||
|
|
||||||||||||||||
| Revenue: |
||||||||||||||||
| Sales revenue |
$ | 7,342 | $ | 11,917 | $ | 4,575 | 62.3% | |||||||||
| Rental revenue |
5,639 | 7,643 | 2,004 | 35.5% | ||||||||||||
| Sales of used equipment |
14 | 55 | 41 | 292.9% | ||||||||||||
| Other revenue |
156 | 162 | 6 | 3.8% | ||||||||||||
|
|
|
|||||||||||||||
| Total revenue |
$ | 13,151 | $ | 19,777 | $ | 6,626 | 50.4% | |||||||||
|
|
||||||||||||||||
The increase in sales revenue in the nine months ended September 30, 2012 compared to the nine months ended September 30, 2013 was attributable to an increase in the number of systems sold primarily related to the launch of the Inogen One G3, an increase in direct-to-consumer sales in the United States due to increased sales and marketing efforts, and an increase in business-to-business sales worldwide as the adoption of portable oxygen concentrators improved. The average selling price of our products was relatively flat at a 1% decrease period-to-period. We experienced price erosion of 5% in business-to-business sales and 6% in direct-to-consumer sales. This effects of this erosion were partially offset by increased sales volumes and an increased proportion of higher average selling price direct-to-consumer sales, which have a higher average selling price. The increase in sales revenue of 62.3% in the comparison of the three months ended September 30, 2012 and 2013 was consistent with the 62.2% increase seen in the comparison of the nine months ending September 30, 2012 versus 2013.
The increase in rental revenue in the nine months ended September 30, 2012 compared to the nine months ended September 30, 2013 was attributable to the increase in rental patients from over 11,700 as of September 30, 2012 to over 19,200 as of September 30, 2013 due to additional marketing efforts and increased sales personnel. This increase was partially offset by the reduced reimbursement rates resulting from the associated with round two Competitive Bidding that became effective in 91 Metropolitan Statistical Areas on July 1, 2013. As a result of the reduced
-69-
Table of Contents
reimbursement rates, rental revenue for the three months ended September 30, 2013 was $7.6 million, compared to $5.6 million for the three months ended September 30, 2012, representing a period over period increase of approximately 35.5%. The period over period increase for the three month period was significantly less than the period over period increase for the nine month period of 57.6%. We expect this trend to continue for the next several fiscal quarters. As expected, the growth in sales revenue was not impacted by the reduced reimbursement rates resulting from competitive bidding. Sales revenue grew 62.3% for the three month period ended September 30, 2013 compared to the three month period ended September 30, 2012, compared to 62.2% for the nine month period ended September 30, 2013 compared to the nine month period ended September 30, 2012.
Cost of revenue and gross profit
| Nine months
ended September 30, |
Change 2012 v. 2013 | |||||||||||||||
| (dollars in thousands) | 2012 | 2013 | $ | % | ||||||||||||
|
|
||||||||||||||||
| Cost of sales revenue |
$ | 12,679 | $ | 18,309 | $ | 5,630 | 44.4% | |||||||||
| Cost of rental revenue |
5,122 | 8,459 | 3,337 | 65.2% | ||||||||||||
| Cost of used rental equipment sales |
20 | 97 | 77 | 385.0% | ||||||||||||
|
|
|
|||||||||||||||
| Total cost of revenue |
17,821 | 26,865 | 9,044 | 50.7% | ||||||||||||
|
|
|
|||||||||||||||
| Gross profit |
$ | 16,914 | $ | 28,816 | $ | 11,902 | 70.4% | |||||||||
| Gross margin % |
48.7% | 51.8% | ||||||||||||||
|
|
||||||||||||||||
Cost of revenue and gross profit
| Three months
ended September 30, |
Change 2012 v. 2013 | |||||||||||||||
| (dollars in thousands) | 2012 | 2013 | $ | % | ||||||||||||
|
|
||||||||||||||||
| Cost of sales revenue |
$ | 4,723 | $ | 6,727 | $ | 2,004 | 42.4% | |||||||||
| Cost of rental revenue |
1,926 | 3,384 | 1,458 | 75.7% | ||||||||||||
| Cost of used rental equipment sales |
6 | 24 | 18 | 300.0% | ||||||||||||
|
|
|
|||||||||||||||
| Total cost of revenue |
6,655 | 10,135 | 3,480 | 52.3% | ||||||||||||
|
|
|
|||||||||||||||
| Gross profit |
$ | 6,496 | $ | 9,642 | $ | 3,146 | 48.4% | |||||||||
| Gross margin % |
49.4% | 48.8% | ||||||||||||||
|
|
||||||||||||||||
We manufacture our Inogen One product line in our Goleta, California and Richardson, Texas facilities. Our manufacturing process includes final assembly, testing, and packaging to customer specifications. The increase in cost of sales revenue was attributable to an increase in the number of systems sold, partially offset by reduced bill of material and labor and overhead costs for our products associated with better sourcing and increased volumes. The increase in cost of rental revenue was attributable to an increase of rental patients and related rental assets, depreciation and product exchange and logistics costs. Cost of rental revenue includes depreciation of our rental assets of $4.9 million for the nine months ending September 30, 2013 versus $2.8 million for the nine months ending September 30, 2012.
Gross margin is defined as revenue less costs of revenue divided by revenue. The overall increase in sales and rental revenue and the continued shift towards rental revenue in our revenue mix, partially offset by declining rental reimbursement rates, account for the gross margin improvement from 48.7% to 51.8% in the nine months ending September 30, 2012 and 2013,
-70-
Table of Contents
respectively. The rental revenue gross margin was 61.4% in the nine months ended September 30, 2013 versus 63.1% in the nine months ended September 30, 2012 due to lower rental reimbursement rates resulting from round two Competitive Bidding that became effective July 1, 2013, partially offset by lower asset deployment costs per patient and also additional economies of scale of our servicing costs. The sales revenue gross margin was 44.2% in the nine months ended September 30, 2013 versus 37.8% in the nine months ended September 30, 2012 due to the reduction in average cost per unit sold and improved sales revenue mix towards direct-to-consumer sales.
The declining rental reimbursement rates, partially offset by increased revenue, and the continued shift towards rental revenue in our revenue mix, account for the gross margin decreases from 49.4% to 48.8% in the three months ending September 30, 2012 and 2013, respectively. The rental revenue gross margin was 55.7% in the three months ended September 30, 2013 versus 65.9% in the three months ended September 30, 2012 due to lower rental reimbursement rates associated with Competitive Bidding, partially offset by lower asset deployment costs per patient and also additional economies of scale of our servicing costs. The sales revenue gross margin was 43.6% in the three months ended September 30, 2013 versus 35.7% in the three months ended September 30, 2012 due to the reduction in average cost per unit sold and improved sales revenue mix towards direct-to-consumer sales.
Research and development expense
| Nine months ended September 30, | Change 2012 v. 2013 | |||||||||||||||
| (dollars in thousands) | 2012 | 2013 | $ | % | ||||||||||||
|
|
||||||||||||||||
| Research and development expense |
$ | 1,731 | $ | 1,817 | $ | 86 | 5.0% | |||||||||
|
|
||||||||||||||||
The increase was primarily attributable to an increase in personnel-related expenses of $0.2 million and product development materials and costs of $0.1 million, partially offset by decreasing patent litigation expenses of $0.2 million. Headcount increased due to our Inogen One G3 product launch in 2012 and Inogen At Home product development in 2013. Research and development expenses were $1.8 million, or 3.3% of total revenue, for the nine months ending September 30, 2013 compared to $1.7 million, or 5.0% of total revenue, for the nine months ending September 30, 2012.
General and administrative expense
| Nine months ended September 30, | Change 2012 v. 2013 | |||||||||||||||
| (dollars in thousands) | 2012 | 2013 | $ | % | ||||||||||||
|
|
||||||||||||||||
| General and administrative expense |
$ | 5,805 | $ | 9,796 | $ | 3,991 | 68.8% | |||||||||
|
|
||||||||||||||||
The increase was primarily attributable to a $1.9 million increase in personnel-related expenses as a result of increased administrative headcount in compliance, billing, human resources, information technology, and finance to support the growth of our business. To accommodate the higher headcount in 2013, we incurred higher facility costs of $0.4 million for rent, utilities, property taxes and maintenance. In addition, we incurred $0.2 million of costs associated with this offering.
In addition, bad debt expense increased $0.6 million primarily due to the significant growth of our rental patient population and the increase in aged patient copayment balances in our
-71-
Table of Contents
outstanding accounts receivables. The provision for doubtful accounts, expressed as a percentage of total net revenue, was 2.4% and 2.2% in the nine months ended September 30, 2013 and September 30, 2012, respectively.
General and administrative expenses were $9.8 million, or 17.6% of total revenue, for the nine months ending September 30, 2013 compared to $5.8 million, or 16.7% of total revenue, for the nine months ending September 30, 2012.
Sales and marketing expense
| Nine months ended September 30, | Change 2012 v. 2013 | |||||||||||||||
| (dollars in thousands) | 2012 | 2013 | $ | % | ||||||||||||
|
|
||||||||||||||||
| Sales and marketing expense |
$ | 8,753 | $ | 13,292 | $ | 4,539 | 51.9% | |||||||||
|
|
||||||||||||||||
The increase was primarily attributable to a $3.2 million increase in personnel-related expenses as a result of increased sales and marketing headcount to support the growth of our business, $0.6 million in primarily media-related marketing costs and licensing fees for software and patient support services to continue to grow our rental patient base and consumer cash sales, and a $0.5 million increase in personnel-related expenses for customer service and clinical services to support our increased rental patient base.
Sales and marketing expenses were $13.3 million, or 23.9% of total net revenue for, the nine months ending September 30, 2013 compared to $8.8 million, or 25.2% of total revenue, for the nine months ending September 30, 2012.
Other income (expense), net
| Nine months ended September 30, | Change 2012 v. 2013 | |||||||||||||||
| (dollars in thousands) | 2012 | 2013 | $ | % | ||||||||||||
|
|
||||||||||||||||
| Interest income |
$ | 84 | $ | 9 | $ | (75 | ) | (89.3)% | ||||||||
| Interest expense |
(381 | ) | (312 | ) | 69 | 18.1% | ||||||||||
| (Increase) decrease in fair value of preferred stock warrant liability |
148 | (202 | ) | (350 | ) | (236.5)% | ||||||||||
| Other income |
— | 209 | 209 | N/A | ||||||||||||
|
|
|
|||||||||||||||
| Total other expense, net |
$ | (149 | ) | $ | (296 | ) | $ | (147 | ) | (98.7)% | ||||||
|
|
||||||||||||||||
The higher interest income in 2012 was associated with interest accruing on a past due customer balance that was not relevant in 2013. The decrease in interest expense was driven by the decrease in average debt balances under our revolving credit and term loan agreement compared to the prior period. The other income in 2013 was associated with investment income received in connection with the sale of our interest in our former product liability insurance company. This other income is not expected to recur in future periods.
The increase in preferred stock warrant liability was due to the revaluation of our preferred stock warrants outstanding through a Monte Carlo valuation model due to higher enterprise value and the increased likelihood of an initial public offering.
-72-
Table of Contents
Comparison of years ended December 31, 2011 and 2012
Revenue
| Year ended December 31, | Change 2011 v. 2012 | |||||||||||||||
| (dollars in thousands) | 2011 | 2012 | $ | % | ||||||||||||
|
|
||||||||||||||||
| Revenue: |
||||||||||||||||
| Sales revenue |
$ | 19,076 | $ | 28,077 | $ | 9,001 | 47.2% | |||||||||
| Rental revenue |
10,977 | 19,872 | 8,895 | 81.0% | ||||||||||||
| Sales of used equipment |
46 | 95 | 49 | 106.5% | ||||||||||||
| Other revenue |
535 | 532 | (3 | ) | (0.6)% | |||||||||||
|
|
|
|||||||||||||||
| Total revenue |
$ | 30,634 | $ | 48,576 | $ | 17,942 | 58.6% | |||||||||
|
|
||||||||||||||||
The increase in sales revenue was attributable to an increase in the number of systems sold, related to an increase in business-to-business sales and an increase in direct-to-consumer sales in the United States and worldwide due to increased sales and marketing efforts and the adoption of portable oxygen concentrators. We experienced a price erosion of 4% in business-to-business sales, which was partially offset by the shift towards direct-to-consumer sales, which experienced a 2% increase in the average selling price. This resulted in a 4% decrease in the average selling price of our products. The increase in rental revenue was related to our increased rental patients from over 7,500 as of December 31, 2011 to over 13,500 as of December 31, 2012 due to additional marketing efforts and increased sales personnel.
Cost of revenue and gross profit
| Year ended December 31, | Change 2011 v. 2012 | |||||||||||||||
| (dollars in thousands) | 2011 | 2012 | $ | % | ||||||||||||
|
|
||||||||||||||||
| Cost of sales revenue |
12,127 | 17,359 | 5,232 | 43.1% | ||||||||||||
| Cost of rental revenue |
3,783 | 7,243 | 3,460 | 91.5% | ||||||||||||
| Cost of used rental equipment sales |
20 | 25 | 5 | 25.0% | ||||||||||||
|
|
|
|||||||||||||||
| Total cost of revenue |
$ | 15,930 | $ | 24,627 | $ | 8,697 | 54.6% | |||||||||
| Gross profit |
14,704 | 23,949 | 9,245 | 62.9% | ||||||||||||
| Gross margin % |
48.0% | 49.3% | ||||||||||||||
|
|
||||||||||||||||
The increase in cost of revenue was attributable to an increase in the number of systems sold and increased bill of material costs for our products associated with the sales shift to the direct-to-consumer channel where system packages include higher accessories per order. Cost of revenue includes depreciation of our rental assets of $4.1 million for the year ended December 31, 2012 versus $2.4 million for the year ended December 31, 2011.
The continued shift towards rental revenue in our revenue mix accounts for the gross margin improvement from 48% to 49%. The gross margin on our rental revenue was 64% in the year ended December 31, 2012 versus 66% in the year ended December 31, 2011 due to lower reimbursement levels. The gross margin on our sales revenue including sales of used rental equipment was 39% in the year ended December 31, 2012 versus 36% in the year ended December 31, 2011 due to the improved revenue mix towards direct-to-consumer sales.
-73-
Table of Contents
Research and development expense
| Year ended December 31, | Change 2011 v. 2012 | |||||||||||||||
| (dollars in thousands) | 2011 | 2012 | $ | % | ||||||||||||
|
|
||||||||||||||||
| Research and development expense |
$ | 1,789 | $ | 2,262 | $ | 473 | 26.4% | |||||||||
|
|
||||||||||||||||
The increase was primarily attributable to a $0.1 million increase in personnel related expenses as a result of increased headcount, a $0.3 million increase in patent and patent defense costs, and $0.1 million in additional research and development spend on new product development.
Research and development expenses were $2.3 million, or 4.7% of total net revenue, for the year ending 2012 compared to $1.8 million, or 5.8% of total net revenue, for the year ending 2011.
General and administrative expense
| Year ended December 31, | Change 2011 v. 2012 | |||||||||||||||
| (dollars in thousands) | 2011 | 2012 | $ | % | ||||||||||||
|
|
||||||||||||||||
| General and administrative expense |
$ | 5,623 | $ | 8,289 | $ | 2,666 | 47.4% | |||||||||
|
|
||||||||||||||||
The increase was primarily attributable to a $1.8 million increase in personnel-related expenses as a result of increased administrative headcount in compliance, billing, human resources, information technology, and finance to support the growth of our business and $0.2 million increase in facility costs associated with the leased additional space in Richardson, Texas, and $0.4 million increase in miscellaneous general and administrative costs including telecom costs, postage, supplies, and dues.
In addition, bad debt expense increased $0.06 million due to the growth of our patient population and associated rental revenue bad debt as well as increased bad debt from our business-to-business channel due to a single customer write off. The provision for doubtful accounts, expressed as a percentage of total net revenue, was 2.2% and 3.3% in the year ended December 31, 2012 and December 31, 2011, respectively.
General and administrative expenses were $8.3 million, or 17.1% of total net revenue, for the year ending 2012 compared to $5.6 million, or 18.4% of total net revenue, for the year ending 2011.
Sales and marketing expense
| Year ended December 31, | Change 2011 v. 2012 | |||||||||||||||
| (dollars in thousands) | 2011 | 2012 | $ | % | ||||||||||||
|
|
||||||||||||||||
| Sales and marketing expense |
$ | 9,014 | $ | 12,569 | $ | 3,555 | 39.4% | |||||||||
|
|
||||||||||||||||
The increase was primarily attributable to a $1.7 million increase in personnel-related expenses as a result of increased sales and marketing headcount to support the growth of our business, $0.9 million in primarily media-related marketing costs to continue to grow our rental patient base and consumer cash sales, and a $0.5 million increase in personnel-related expenses for customer service and clinical services to support our increased number of rental patients.
Sales and marketing expenses were $12.6 million, or 25.9% of total net revenue, for the year ending 2012 compared to $9.0 million, or 29.4% of total net revenue, for the year ending 2011.
-74-
Table of Contents
Other income (expense), net
| Year ended December 31, | Change 2011 v. 2012 | |||||||||||||||
| (dollars in thousands) | 2011 | 2012 | $ | % | ||||||||||||
|
|
||||||||||||||||
| Interest income |
$ | 113 | $ | 88 | $ | (25 | ) | (22.1% | ) | |||||||
| Interest expense |
(261 | ) | (493 | ) | (232 | ) | 88.9 | |||||||||
| Revaluation of preferred stock warrant liability |
(119 | ) | 148 | 267 | (224.4 | ) | ||||||||||
| Other income (expense) |
— | 10 | 10 | — | ||||||||||||
|
|
|
|||||||||||||||
| Total other income (expense), net |
$ | (267 | ) | $ | (247 | ) | $ | 20 | (7.5)% | |||||||
|
|
||||||||||||||||
The increase in interest expense was driven by a $5.3 million increase in borrowings under our revolving credit and term loan agreement. The decrease in interest income was driven by the reduction of interest accruing on past due customer balances as a result of lower past due accounts receivable balances for business-to-business sales in 2012, as compared to 2011.
Liquidity and capital resources
As of September 30, 2013, we had cash and cash equivalents of $17.1 million, which consisted of highly-liquid investments with an original maturity of three months or less. Since inception, we have financed our operations primarily through the sale of equity securities and, to a lesser extent, from borrowings. As of September 30, 2013, we had $12.0 million secured debt outstanding including $11.1 million in bank financing and $0.9 million in patent licensing debt. Since inception, we have received net proceeds of $91.4 million from the issuance of redeemable convertible preferred stock. Our principal uses of cash are funding our capital expenditures including additional rental assets and debt service payments as described below.
We believe that our current cash and cash equivalents together with our short-term investments and available borrowings under our revolving credit and term loan agreement and the cash to be generated from expected product sales and rentals, will be sufficient to meet our projected operating and investing requirements for at least the next 12 months.
The following table shows a summary of our cash flows for the periods indicated:
| Year ended December 31, | Nine months ended September 30, | |||||||||||||||
| (dollars in thousands) | 2011 | 2012 | 2012 | 2013 | ||||||||||||
|
|
||||||||||||||||
| Cash provided by operating activities |
$ | 1,859 | $ | 4,004 | $ | 2,173 | $ | 11,478 | ||||||||
| Cash used in investing activities |
(8,918 | ) | (12,475 | ) | (9,101 | ) | (14,497 | ) | ||||||||
| Cash provided by financing activities |
5,176 | 19,677 | 20,120 | 4,966 | ||||||||||||
|
|
||||||||||||||||
Operating activities
We derive operating cash flows from cash collected from the sale of our products and services. These cash flows received are partially offset by our use of cash for operating expenses to support the growth of our business. Net income in each period has increased associated with increased sales and gross margin associated with product mix and lower costs. In addition, operating expense leverage has increased as expenses have not grown as quickly as sales due to improved operating efficiencies. The changes in cash related to operating assets and liabilities discussed below were primarily due to the following factors that occurred across all periods: an increase in cash used related to inventory and rental assets as we increased inventory and rental
-75-
Table of Contents
assets to support our growth in revenue; an increase in cash used by accounts receivable resulting from growth in rental receivables which typically have a longer collection cycle; and an increase in cash related to accounts payable resulting from the higher level of operating expenses needed to support the higher sales level.
Net cash provided by operating activities for the nine months ended September 30, 2013 consisted of our net income of $3.5 million and non-cash expense items such as depreciation and amortization of our equipment and leasehold improvements of $6.0 million, provision for doubtful accounts of $1.4 million, loss on disposal of rental units of $0.4 million, loss on change in fair value of warrants of $0.2 million and stock-based compensation of $0.1 million. These items were partially offset by net changes in our operating assets and liabilities of $0.2 million.
Net cash provided by operating activities for the nine months ended September 30, 2012 consisted of our net income of $0.5 million and non-cash expense items such as depreciation and amortization of our equipment and leasehold improvements of $3.5 million, provision for doubtful accounts of $0.7 million, gain on change in fair value of warrants of $0.1 million, and stock-based compensation of $0.05 million. These items were partially offset by net changes in our operating assets and liabilities of $2.6 million.
Net cash provided by operating activities for 2012 consisted of our net income of $0.6 million and non-cash expense items such as depreciation and amortization of our equipment and leasehold improvements of $5.0 million, provision for doubtful accounts of $1.1 million, gain on change in fair value of warrants of $0.2 million, stock-based compensation of $0.1 million. These items were partially offset by net changes in our operating assets and liabilities of $1.4 million.
Net cash provided by operating activities for 2011 consisted of non-cash expense items such as depreciation and amortization of our equipment and leasehold improvements of $3.2 million, provision for doubtful accounts of $1.0 million, stock-based compensation of $0.1 million, loss on change in fair value of warrants of $0.1 million, These items were partially offset by net losses of $2.0 million and net changes in our operating assets and liabilities of $0.9 million.
Investing activities
Net cash used in investing activities for each of the periods presented was primarily for the purchase of rental assets, research and development laboratory, manufacturing and computer equipment and software to support our expanding business.
In the nine months ended September 30, 2013, we invested $11.9 million in rental assets. In the nine months ended September 30, 2012, we invested $7.4 million in rental assets. In 2012, we invested $10.4 million in rental assets deployed. In 2011, we invested $7.9 million in rental assets deployed.
During the year ended December 31, 2011, we acquired Breathe Oxygen Services, LLC mainly to acquire an accredited Medicare facility and a Medicare license to service patients located in Tennessee in compliance with applicable law. The acquisition resulted in recording an intangible asset in the amount of $0.1 million which amortizes over its estimated useful life of ten years. As of September 30, 2013, December 31, 2012 and 2011, there were no impairments recorded related to this intangible asset. In 2011, Breathe Oxygen Services, LLC merged with us, and was dissolved.
-76-
Table of Contents
We expect to continue investing in property and equipment as we expand our operations. Other than the deployment of product for rental to our customers and the necessary manufacturing equipment/tooling for the launch of our next oxygen concentrator in development, we have no major capital expenditures planned for the remainder of 2013. Our operations are inherently capital intensive due to our portions of revenue derived from our rental business model; investments will continue to be required in order to grow rental revenue.
Financing activities
Historically, we have funded our operations through the issuance of preferred stock and the incurrence of indebtedness.
For the nine months ended September 30, 2013, net cash provided by financing activities consisted of $1.9 million received upon exercise of series D convertible preferred stock warrants and common stock options and $6.0 million of new debt issuance under our revolving credit and term loan agreement entered into in October 2012. This was partially offset by repayments of borrowings under our revolving credit and term loan agreement of $2.8 million as existing balances and payback terms were not changed.
For the nine months ended September 30, 2012, net cash provided by financing activities consisted of the issuance of 2,840,260 shares of series G convertible preferred stock for net proceeds of $19.9 million in March 2012, the incurrence of an aggregate of $2.0 million of borrowings under our revolving credit and term loan agreement, which were offset in part by repayment of $1.9 million of such borrowings, and the exercise of series B convertible and series C convertible preferred stock warrants for $0.2 million.
For 2012, net cash provided by financing activities consisted of the issuance of 2,840,260 shares of series G convertible preferred stock which generated net proceeds of $19.9 million in March 2012, the incurrence of an aggregate of $6.0 million of borrowings under our revolving credit and term loan agreement, which were offset in part by repayment of $6.5 million of such borrowings, and the exercise of series B convertible and series C convertible preferred stock warrants for $0.4 million.
For 2011, net cash provided by financing activities consisted of net incurrence of indebtedness under our revolving credit and term loan agreement of $5.3 million.
Accounts receivable
Accounts receivable before allowance for doubtful accounts, rental adjustments and sales returns increased $4.5 million, or 49%, from $9.1 million at December 31, 2012 to $13.6 million at September 30, 2013. Revenues for the three month periods ending December 31, 2012 and September 30, 2013 were $13.8 million and $19.8 million, respectively, which is an increase of $5.9 million and 43%. The increase in accounts receivable was primarily attributable to an increase in sales as well as an increase in the aging of our rental receivables.
Included in accounts receivable are earned but unbilled receivables of $1.0 million at December 31, 2012 and $1.2 million at September 30, 2013. Delays, ranging from a day to several weeks between the date of service, and billing can occur due to delays in obtaining certain required payor-specific documentation from internal and external sources. Earned but unbilled receivables are aged from the date of service and are considered in our analysis of historical performance and collectability.
-77-
Table of Contents
Due to the nature of the industry and the reimbursement environment in which we operate, certain estimates are required to record net revenue and accounts receivable at their net realizable values. Inherent in these estimates is the risk that they will have to be revised or updated as additional information becomes available. Specifically, the complexity of many third-party billing arrangements and the uncertainty of reimbursement amounts for services from some payors may result in adjustments to amounts originally recorded. These adjustments are typically identified and recorded at the point of cash application, claim denial or account review.
Management performs analyses to evaluate the net realizable value of accounts receivable. Specifically, management considers historical realization data, accounts receivable aging trends, other operating trends and relevant business conditions. Because of continuing changes in the healthcare industry and third-party reimbursement, it is possible that management’s estimates could change, which could have an impact on operations and cash flows.
We derive a significant portion of our rental revenue from Medicare. Revenue is recognized at net realizable amounts estimated to be paid by payors and patients. Our billing system contains payor-specific price tables that reflect the fee schedule amounts in effect or contractually agreed upon by various government and commercial payors for each item of equipment or supply provided to a customer. For Medicare and Medicaid revenues, as well as most other third-party payors, final payment is subject to administrative review and audit. We make estimated provisions for adjustments, including adjustments from administrative review and audit, based on historical experience. We closely monitor our historical collection rates as well as changes in applicable laws, rules and regulations and contract terms in an attempt to use the most accurate information available in determining these provisions. However, due to the complexities involved in these estimates, actual payments we receive could be different from the amounts we estimate and record.
Collection of receivables from third-party payors and patients is a significant source of cash and is critical to our operating performance. Our primary collection risks relate to patient accounts for which the primary insurance payor has paid, but patient responsibility amounts (generally deductibles and co-payments) remain outstanding. We record bad debt expense based on a percentage of revenue using historical data specific to us. The percentage and amounts used to record bad debt expense and the allowance for doubtful accounts are supported by various methods including current and historical cash collections, bad debt write-offs and aging of accounts receivable. We write off accounts receivable against the allowance when all collection efforts (including payor appeals processes) have been exhausted. We routinely review accounts receivable balances in conjunction with our historical contractual adjustments and bad debt rates and other economic conditions that might ultimately affect the collectability of patient accounts when we consider the adequacy of the amounts we record as provision for doubtful accounts. Prior to 2014, we managed our billing and collection of accounts receivable through our own staff.
-78-
Table of Contents
Accounts receivable balance concentrations by major category as of December 31, 2012 and September 30, 2013 were as follows:
| December 31, 2012 |
September 30, 2013 |
|||||||
|
|
||||||||
| Percentage of Accounts Receivable Outstanding: |
||||||||
| Medicare |
39% | 24% | ||||||
| Medicaid/Other Government |
3% | 4% | ||||||
| Private Insurance |
21% | 27% | ||||||
| Patient Responsibility |
18% | 23% | ||||||
| Business to Business Sales |
19% | 22% | ||||||
|
|
|
|||||||
| Total |
100.0% | 100.0% | ||||||
|
|
||||||||
The following table sets forth the percentage breakdown of our accounts receivable by aging category as of December 31, 2012 and September 30, 2013.
| December 31, 2012 |
September 30, 2013 |
|||||||
|
|
||||||||
| Accounts receivable by aging category: |
||||||||
| Unbilled |
11% | 9% | ||||||
| Aged 0-90 days |
63% | 57% | ||||||
| Aged 91-180 days |
12% | 12% | ||||||
| Aged 181-365 days |
12% | 14% | ||||||
| Aged over 365 days |
2% | 8% | ||||||
|
|
|
|||||||
| Total |
100% | 100% | ||||||
|
|
||||||||
The following table sets forth the percentage breakdown of our allowances to accounts receivable as of December 31, 2012 and September 30, 2013.
| December 31, 2012 |
September 30, 2013 |
|||||||
|
|
||||||||
| Percentage of Allowance to Accounts Receivable: |
||||||||
| Bad Debt Reserve |
8% | 14% | ||||||
| Rental Adjustments & Write-Offs Reserve |
14% | 14% | ||||||
| Direct to Consumer Sales Returns Reserve |
1% | 1% | ||||||
|
|
|
|||||||
| Total Percentage of Allowance to Accounts Receivable |
23% | 29% | ||||||
|
|
||||||||
The increase in total percentage of our allowances to accounts receivable from 23% as of December 31, 2012 to 29% as of September 30, 2013 was primarily related to our rental business and patient co-pay balances. These balances aged over 365 days have increased from 2% to 8% in the periods presented. We believe our reserves are adequate and properly present the collectability of our outstanding accounts receivable balances based on our analysis of these balances. We review the accounts receivables on at least a quarterly basis to assess the allowance for doubtful accounts. In general, our allowance for doubtful accounts is higher for our rental revenue compared to our sales revenue. Due to our growth in our rental patient base in the relevant periods, as well as approximately 30% annualized turnover in our billing and collections team, our write-offs and past due rental accounts receivable balances have increased. In order to
-79-
Table of Contents
achieve higher collectability rates on the aging patient balances, we have engaged a third party collection agency which will focus collection efforts on these balances starting in 2014.
The ultimate collection of accounts receivable may not be known for several months because the third party collection firm will not start collection efforts until 2014. We record bad debt expense based on a percentage of revenue using historical data specific to us. The percentage and amounts used to record bad debt expense and the allowance for doubtful accounts are supported by various methods and analyses, including current and historical cash collections, bad debt write-offs, aged accounts receivable and consideration of any payor-specific concerns. The ultimate write-off of an accounts receivable occurs once collection is considered to be unlikely.
We do not use an aging threshold for account receivable write-offs. However, the age of an account balance may provide an indication that collection procedures have been exhausted, and would be considered in the review and approval of an account balance write-off.
Sources of funds
Our cash provided in operations in the nine months ended September 30, 2013 was $11.5 million compared to $2.2 million in the nine months ended September 30, 2012. As of September 30, 2013 we had cash and cash equivalents of $17.1 million and available borrowing capacity under our revolving credit and term loan agreement totaling $6.0 million.
We believe, based on our current operating plan, that our existing cash and cash equivalents, cash generated from operating activities and available borrowings under our borrowing arrangements will be sufficient to fund capital expenditures, operating expenses and other cash requirements for at least the next 12 months. Although we are not currently a party to any agreement or letter of intent with respect to potential material investments in, or acquisitions of, complementary businesses, we may enter into these types of arrangements in the future, which could require us to seek additional equity or debt financing. Additional funds may not be available on terms favorable to us, or at all.
Amended and restated revolving credit and term loan agreement
In October 2012, we entered into an amended and restated revolving credit and term loan agreement with Comerica Bank as the administrative agent, which we refer to as our revolving credit and term loan agreement. This agreement incorporated amounts outstanding under one prior loan agreement whereby the existing balances and the payback terms were not changed. This transaction did not result in any debt extinguishment losses or gains. We did not incur or defer any financing cost directly related to the amended loan and security agreement.
The revolving credit and term loan agreement also provides for a pre-existing term loan facility for rental assets amounting to up to $3.0 million, which we refer to as Term Loan A, a pre-existing term loan facility for rental assets amounting to up to $8.0 million, which we refer to as Term Loan B, a new term loan facility for rental assets amounting to up to $12.0 million, which we refer to as Term Loan C, and an accounts receivable revolving line of credit amounting to up to $1.0 million based on 80% of eligible accounts receivable, which we refer to as the revolver.
We had borrowings of $1.4 million, $2.3 million and $0.7 million outstanding under Term Loan A as of December 31, 2012 and 2011 and September 30, 2013, respectively. We had borrowings of $6.4 million, $6.0 million and $4.4 million outstanding under Term Loan B, as of December 31,
-80-
Table of Contents
2012 and 2011 and September 30, 2013, respectively. There were no borrowings and borrowings of $6.0 million outstanding under Term Loan C as of December 31, 2012 and September 30, 2013, respectively. Future draws under Term Loan C will bear variable interest at the Base Rate. There were no borrowings under the revolver during 2011, 2012, or as of September 30, 2013. The revolver expired on October 13, 2013 and we have no plans to renew or replace it.
Payments of interest for the Term Loan are generally payable monthly. Payment of principal is payable monthly. Each term loan bears interest at the base rate, which is a rate equal to the applicable margin plus the greater of (i) the prime rate, (ii) the federal funds effective rate, as defined in the agreement, plus 1%, and (iii) the daily adjusting LIBOR rate, plus 1%. The applicable margins for Term Loans A, B and C are 1.25%, 2.50% and 2.25%, respectively. Upon the closing of an acquisition or initial public offering during the term of the revolving credit and term loan agreement, the lenders are entitled to a fee equal to $120,000.
The revolving credit and term loan agreement contains customary conditions to borrowing, events of default and covenants, including covenants that restrict our ability to dispose of assets, merge with or acquire other entities, incur indebtedness, incur encumbrances, make distributions to holders of our capital stock, make investments, engage in transactions with our affiliates. In addition, we must comply with certain financial covenants relating to liquidity, debt service, and leverage ratios. We were in compliance with all covenants as of December 31, 2012 and September 30, 2013. As of September 30, 2013, in order to be in compliance with the liquidity requirements, debt service ratios, and leverage ratios of existing debt obligations, we were required to maintain $2.5 million of unaudited Adjusted EBITDA in the previous six months, and we had $6.6 million in actual unaudited Adjusted EBITDA, and $7.8 million of cash and qualified accounts receivable, and we had $17.1 million of actual cash. Our obligations under the revolving credit and term loan agreement are secured by substantially all of our assets, including intellectual property.
We may from time to time, depending upon market conditions and financing needs, seek to refinance or repurchase our debt securities or loans in privately negotiated or open market transactions, by tender offer or otherwise.
Use of funds
Our principal uses of cash are funding our new rental asset deployments and other capital purchases, operations, satisfaction of our obligations under our debt instruments, and other working capital requirements. Over the past several years, our revenue has increased significantly from year to year and, as a result, our cash flows from customer collections have increased as have our profits. As a result, our cash used in operating activities has decreased over time and now is a source of capital to the business. We expect operating activities to continue to be a source of capital to the business in the future.
Due to the portion of our business that drives rental revenue, which needs continuing asset deployments to new patients, our cash used in investing activities has increased over time. We expect our investment cash requirements to increase in the future as we increase our rental patient base and deploy rental assets among Medicare and private payors.
We may need to raise additional funds to support our investing operations, and such funding may not be available to us on acceptable terms, or at all. If we are unable to raise additional funds when needed, our operations and ability to execute our business strategy could be adversely affected. We may seek to raise additional funds through equity, equity-linked or debt
-81-
Table of Contents
financings. If we raise additional funds through the incurrence of indebtedness, such indebtedness would have rights that are senior to holders of our equity securities and could contain covenants that restrict our operations. Any additional equity financing may be dilutive to our stockholders.
Contractual obligations
The following table reflects a summary of our contractual obligations as of December 31, 2012.
| Payments due by period | ||||||||||||||||||||
| Contractual obligations | Total | Less than 1 year |
1-3 years |
3-5 years |
More than 5 years |
|||||||||||||||
|
|
||||||||||||||||||||
| (in thousands) | ||||||||||||||||||||
| Operating lease obligations(1) |
$ | 3,605 | $ | 788 | $ | 1,864 | $ | 329 | $ | 624 | ||||||||||
| Long-term debt obligations(2)(3) |
8,936 | 3,879 | 5,057 | — | — | |||||||||||||||
|
|
|
|||||||||||||||||||
| Total |
$ | 12,541 | $ | 4,667 | $ | 6,921 | $ | 329 | $ | 624 | ||||||||||
|
|
||||||||||||||||||||
| (1) | Operating lease costs are primarily for office and manufacturing space. |
| (2) | Includes principal and accrued interest on long-term debt obligations. |
| (3) | In 2011, we entered into an amendment of a licensing agreement whereby we were assigned the entire right, title and interest in a portfolio of patents in exchange for a non-interest bearing promissory note for $650,000, in addition to an $850,000 existing obligation to the original licensor, for a total of $1.5 million due to the original licensor in installments starting May 22, 2011, and ending October 31, 2016. |
Critical accounting policies and significant estimates
Our discussion and analysis of our financial condition and results of operations are based upon our financial statements which have been prepared in accordance with GAAP. The preparation of these financial statements requires us to make estimates and judgments that affect the reported amounts of assets and liabilities and related disclosure of contingent assets and liabilities, revenue and expenses at the date of the financial statements. Generally, we base our estimates on historical experience and on various other assumptions in accordance with GAAP that we believe to be reasonable under the circumstances. Actual results may differ from these estimates and such differences could be material to the financial position and results of operations.
Critical accounting policies and estimates are those that we consider the most important to the portrayal of our financial condition and results of operations because they require our most difficult, subjective or complex judgments, often as a result of the need to make estimates about the effect of matters that are inherently uncertain. Our critical accounting policies and estimates include those related to:
| • | revenue recognition; |
| • | stock-based compensation; |
| • | inventory and rental asset valuation; |
| • | accounts receivables and allowance for bad debts, returns and adjustments; |
| • | fair value measurements; and |
| • | income taxes. |
Revenue recognition
We generate revenue primarily from sales and rentals of our products. Our products consist of our proprietary line of portable oxygen concentrators and related accessories. A small portion of our revenue comes from extended service contracts and freight revenue for product shipments.
-82-
Table of Contents
Revenue from product sales is recognized when all of the following criteria are met: (1) persuasive evidence of an arrangement exists; (2) delivery has occurred or services have been rendered; (3) the price to the customer is fixed or determinable; and (4) collectability is reasonable assured. Revenue from product sales is recognized upon shipment of the product. Provisions for estimated returns and discounts are made at the time of shipment. Provisions for warranty obligations, which are included in cost of sales revenue, are also provided for at the time of shipment.
Accruals for estimated warranty expenses are made at the time that the associated revenue is recognized. We use judgment to estimate these accruals and, if we were to experience an increase in warranty claims or if costs of servicing our products under warranty were greater than our estimates, our cost of revenue could be adversely affected in future periods. The provisions for estimated returns, discounts and warranty obligations are made based on known claims and discount commitments and estimates of additional returns and warranty obligations based on historical data and future expectations. We accrued $0.4 million and $0.3 million to provide for future warranty costs at December 31, 2012 and 2011, respectively.
We recognize equipment rental revenue over the non-cancelable lease term, which is one month, less estimated adjustments, per ASC 840. We have separate contracts with each patient that are not subject to a master lease agreement with any payor. The leases do not contain a bargain renewal option associated with the potential capped free rental period as we determined that the lessee cannot renew the lease completely at his or her option, and the exercise of such option is not reasonably assured at lease inception. The lease term begins on the date products are shipped to patients and are recorded at amounts estimated to be received under reimbursement arrangements with third-party payors, including Medicare, private payors, and Medicaid. Due to the nature of the industry and the reimbursement environment in which we operate certain estimates are required to record net revenue and accounts receivable at their net realizable values. Inherent in these estimates is the risk that they will have to be revised or updated as additional information becomes available. Specifically, the complexity of many third-party billing arrangements and the uncertainty of reimbursement amounts for certain products may result in adjustments to amounts originally recorded. Such adjustments are typically identified and recorded at the point of cash application, claim denial or account review. Accounts receivable are reduced by an allowance for doubtful accounts which provides for those accounts from which payment is not expected to be received, although product was delivered and revenue was earned. Upon determination that an account is uncollectible, it is written-off and charged to the allowance. Amounts billed but not earned due to the timing of the billing cycle are deferred and recognized in income on a straight-line basis over the monthly billing period. For example, if the first day of the billing period does not fall on the first day of the month, then a portion of the monthly billing period will fall in the subsequent month and the related revenue and cost would be deferred. Therefore, we defer income for the service days in the following month.
Rental revenue is recognized as earned, less estimated adjustments. Revenue not billed at the end of the period is reviewed for the likelihood of collections and accrued. The rental revenue stream is not guaranteed and payment will cease if the patient no longer needs oxygen or returns the equipment. Revenue recognized is at full estimated allowable; transfers to secondary insurances / patient responsibility have no net effect on revenue. Rental revenue is earned for that month if the patient is on service on the first day of the 30-day period commencing on the recurring date of service for a particular claim, regardless if there is a change in condition/death after that date. There is no refund for revenue collected in the 3 year period if the patient does not reach the
end of the 5 year capped period. In the event that a third-party payor does not accept the claim for
-83-
Table of Contents
payment, the consumer is ultimately responsible for payment for the products and services. We have determined that the balances are collectable at the time of revenue recognition because the patient signs a notice of financial responsibility outlining their obligations.
Included in rental revenue are unbilled amounts that were earned but not able to be billed for various reasons. The criteria for recognizing revenue had been met as of period-end, but there were specific reasons why we were unable to bill Medicare and private insurance for these amounts. As a result, we create an unbilled rental revenue accrual based on these earned revenues not billed based on a percentage of unbilled amounts and historical trends and estimates of future collectability.
Revenue from the sale of used rental equipment is recognized upon delivery and when collectability is reasonably assured and other revenue recognition criteria are met. When a rental unit is sold, the related cost and accumulated depreciation are removed from their respective accounts, and any gains or losses are included in gross profit.
Revenue from the sales of our services is recognized when no significant obligations remain undelivered and collection of the receivables is reasonably assured, which is generally when shipment has occurred. We offer extended service contracts on our Inogen One systems for periods ranging from 12 to 24 months after the end of the standard warranty period. Revenue from extended service contracts and lifetime warranty is deferred and recognized in income over the contract period. To calculate the value associated with the lifetime warranties, management considered the profit margins of the overall company, the average cost of lifetime warranties and the price of extended warranties and created a best estimate. Lifetime warranty revenue is deferred and recognized after the standard three year warranty period, on straight-line basis, in year four and five. Under the lifetime warranty, the company will provide replacement equipment without any additional cost to the consumer for the duration of the patient’s life. Lifetime warranties are non-transferable.
Stock-based compensation
We measure and recognize compensation expense for the cost of employee services received in exchange for an award of equity instruments based on the grant date fair value of the award. The fair value of options on the grant date is estimated using the Black-Scholes option-pricing model, which requires the use of certain subjective assumptions including expected term, volatility, risk-free interest rate and the fair value of our common stock. These assumptions generally require significant judgment.
The resulting costs, net of estimated forfeitures, are recognized over the period during which an employee is required to provide service in exchange for the award, usually the vesting period. We amortize the fair value of stock-based compensation on a straight-line basis over the requisite service periods.
Currently, our equity awards consist only of stock options. However, in the future we may grant shares of restricted stock and restricted stock units under the terms of our equity incentive plans. We account for stock options issued to nonemployees at their estimated fair value determined using the Black-Scholes option-pricing model. The fair value of the options granted to nonemployees is re-measured as they vest, and the resulting change in value, if any, is recognized as a stock-based compensation expense during the period the related services are rendered. In the years ending December 31, 2011 and 2012 and the nine-month periods ending September 30, 2012 and 2013, we did not issue stock options to any non-employees and all previous stock options issued to non-employees were fully vested in previous periods.
-84-
Table of Contents
The Black-Scholes option-pricing model requires the input of highly subjective assumptions, including the expected volatility of the price of our common stock, the expected term of the option, the expected dividend yield, and the risk-free interest rate. These estimates involve inherent uncertainties and the significant application of management’s judgment. If factors change and different assumptions are used, our stock-based compensation expense could be materially different in the future. We determined weighted average valuation assumptions as follows:
Risk free rate. The risk free interest rate is based on the yields of U.S. Treasury securities with maturities similar to the expected term of the options for each option group.
Expected term. Using the simplified method, the expected term is estimated as the midpoint of the expected time to vest and the contractual term, as permitted by the SEC. For out of the money option grants, we estimate the expected lives based on the midpoint of the expected time to a liquidity event and the contractual term.
Dividend yield. We have never declared or paid any cash dividends and do not presently plan to pay cash dividends in the foreseeable future. Consequently, we use an expected dividend yield of zero.
Volatility. Our expected volatility is derived from the historical volatilities of several unrelated public companies in the medical manufacturing and healthcare service industries because we have little information on the volatility of the price of our common stock because we have no trading history. When making the selections of our industry peer companies to be used in the volatility calculation, we consider operational area, size, business model, industry and the business of potential comparable companies. These historical volatilities are weighted based on certain qualitative factors and combined to produce a single volatility factor.
The following table summarizes the assumptions relating to our stock options for the years ended December 31, 2011 and 2012 and the nine-month periods ended September 30, 2012 and 2013:
| Year ended December 31, |
Nine months ended September 30, | |||||||
| 2011 | 2012 | 2012 | 2013 | |||||
|
| ||||||||
| Risk-free interest rates |
1.18%-2.71% | 0.73%-1.33% | 0.92%-3.04% | 0.73%-2.89% | ||||
| Expected term |
5.91-6.08 years | 5.51-6.07 years | 5.18-6.16 years | 5.51-6.08 years | ||||
| Expected dividend yield |
0% | 0% | 0% | 0% | ||||
| Volatility |
47.76-48.55% | 48.95-50.52% | 44.62-49.96% | 46.58-50.52% | ||||
|
| ||||||||
If in the future we determine that another method is more reasonable, or if another method for calculating these input assumptions is prescribed by authoritative guidance, and, therefore, should be used to estimate volatility or expected life, the fair value calculated for our stock options could change significantly. Higher volatility and longer expected lives result in an increase to stock-based compensation expense determined at the date of grant. Stock-based compensation expense affects our cost of revenue, research and development expense, and selling, general and administrative expense.
We estimate our forfeiture rate based on an analysis of our actual forfeitures and will continue to evaluate the appropriateness of the forfeiture rate based on actual forfeiture experience, analysis of employee turnover behavior and other factors. Quarterly changes in the estimated
-85-
Table of Contents
forfeiture rate can have a significant effect on reported stock-based compensation expense, as the cumulative effect of adjusting the rate for all expense amortization is recognized in the period the forfeiture estimate is changed. If a revised forfeiture rate is higher than the previously estimated forfeiture rate, an adjustment is made that will result in a decrease to the stock-based compensation expense recognized in the financial statements. If a revised forfeiture rate is lower than the previously estimated forfeiture rate, an adjustment is made that will result in an increase to the stock-based compensation expense recognized in the financial statements. The effect of forfeiture adjustments was insignificant for the years ended December 31, 2011 and 2012 and the nine-month periods ended September 30, 2012 and 2013. We will continue to use significant judgment in evaluating the expected term, volatility and forfeiture rate related to our stock-based compensation.
We recorded stock-based compensation of $144,000 and $60,000 for the years ended December 31, 2011 and 2012, respectively, and $48,000 and $116,000 for the nine-month periods ended September 30, 2012 and 2013, respectively. As of September 30, 2013, we had $0.5 million of unrecognized stock-based compensation costs, which are expected to be recognized over an average period of four years. In future periods, we expect stock-based compensation to increase due in part to our existing unrecognized stock-based compensation and as we issue additional stock-based awards to continue to attract and retain employees.
Common stock valuation
It is also necessary to estimate the fair value of the common stock underlying our equity awards when computing the fair value calculation of options under the Black-Scholes option-pricing model. The fair value of the common stock underlying our equity awards was assessed on each grant date by our board of directors. Given the absence of an active market for our common stock prior to this offering, our board of directors determined the estimated fair value of our common stock based on an analysis of a number of objective and subjective factors that we believe market participants would consider, including the following:
| • | our results of operations, history of losses and other financial metrics; |
| • | our capital resources and financial condition; |
| • | the contemporaneous valuations of our common stock by Timan, LLC, an unrelated third-party valuation firm; |
| • | the prices of our convertible redeemable preferred stock sold to outside investors in arms-length transactions; |
| • | the rights, preferences and privileges of our convertible preferred stock relative to those of our common stock; |
| • | the rights of freestanding warrants and other similar instruments related to our securities that are redeemable; |
| • | the hiring of key personnel; |
| • | the introduction of new products; |
| • | the fact that the option grants involve illiquid securities in a private company; |
| • | the risks inherent in the development and expansion of our products and services; and |
-86-
Table of Contents
| • | the likelihood of achieving a liquidity event, such as an initial public offering or sale of our company given prevailing market conditions. |
We have historically granted stock options with exercise prices no less than the fair value of our common stock underlying the stock options, as determined at the date of grant by our board of directors, with input from our management and Timan, LLC, an independent third party valuation expert. The following table summarizes, by grant date, the number of stock options granted since January 1, 2012 and the associated per share exercise price:
| Grant date | Common shares underlying options granted |
Exercise price per share |
Fair value per common by the |
Fair value per common share for financial reporting purposes at grant date |
Intrinsic per |
|||||||||||||||
|
|
||||||||||||||||||||
| March 28, 2012 |
209,967 | $ | 0.81 | $ | 0.81 | $ | 0.81 | $ | 0.00 | |||||||||||
| June 6, 2012 |
10,122 | 0.81 | 0.81 | 0.81 | 0.00 | |||||||||||||||
| September 18, 2012 |
8,403 | 0.81 | 0.81 | 0.81 | 0.00 | |||||||||||||||
| December 7, 2012 |
20,104 | 0.81 | 0.81 | 0.81 | 0.00 | |||||||||||||||
| February 12, 2013 |
376,660 | 1.17 | 1.17 | 1.17 | 0.00 | |||||||||||||||
| May 14, 2013 |
63,333 | 1.17 | 1.17 | 6.24 | 5.07 | |||||||||||||||
| October 11, 2013 |
276,334 | 8.37 | 8.37 | 8.37 | 0.00 | |||||||||||||||
|
|
||||||||||||||||||||
Our board of directors intended that all options granted be exercisable at a price per share not less than the per share fair market value of our common stock underlying those options on the date of grant. The following is a discussion of all options we have granted since January 1, 2012 and the significant factors contributing to our board of director’s determination of the fair value:
| • | March 28, 2012, June 6, 2012, September 18, 2012, and December 7, 2012—Options granted on these dates had an exercise price of $0.81 per share, which was equal to the fair value of our common stock as determined by our board of directors on each grant date. In anticipation of the March grants, our board of directors obtained a third-party valuation of our common stock in December 2011 and March 2012, described in more detail below, both of which assumed a $20.0 million financing event and suggested a fair value of $0.81 per share. Our board of directors considered these valuations together with the other objective and subjective factors described above in reaching its determination of the fair value of our common stock as of March 2012. In particular, our board of directors considered the price of its most recent round of financing, which occurred in March 2012 and involved the sale and issuance of an additional $20.0 million in Series G convertible preferred stock; the other rights, privileges and preferences associated with our convertible preferred stock relative to the common stock; the general financial condition of the business and its capital resources at that time; and the risks and uncertainties associated with further development and expansion of our products. For each of the grant dates subsequent to March 2012 through December 2012, our board of directors again considered the March 2012 third-party valuation together with additional changes that may have occurred within the business since March 2012. At each grant date, our board of directors considered the impact of the rights, privileges and preferences of our outstanding shares of convertible preferred stock, the continued illiquidity of our common stock given our status as a private company, the ongoing risks associated with further development of the company and generally low likelihood of a liquidity event, such as an initial public offering or a sale of the company, occurring during 2012. Our board of directors |
-87-
Table of Contents
| also noted the initial launch of the Inogen One G3 in September 2012, but given the limited nature of the launch and the inability to predict its impact on the business at that time our board of directors determined this did not constitute a significant change in the business. In particular, our board of directors considered that in December 2011 we decided to raise an additional $20.0 million in financing through the sale and issuance of our series G convertible preferred stock, the proceeds of which were used to continue to invest the business operations, in particular the capital intensive rental business. This financing closed on March 12, 2012 and was critical to the success of growing our revenue to $48.6 million in 2012. The amount of the financing was determined based on the projections of capital necessary to achieve our goal of exceeding $100 million of sales in order to pursue a sale of the company or an initial public offering following the achievement of this goal. It was estimated that we would achieve this goal within a minimum of three years. Based on these considerations, our board of directors determined that no significant change in our business or expectations of future business had occurred as of each grant date since the March 31, 2012 valuation that would have warranted a materially different determination of the value of our common stock than that suggested by the board of directors’ original determination in March 2012 and the corresponding contemporaneous independent third-party valuation. |
| • | February 12, 2013—Options granted on this date had an exercise price of $1.17 per share, which was equal to the fair value of our common stock as determined by our board of directors on that date. In reaching this determination, our board of directors considered each of the objective and subjective factors described above, including our most recent independent third party valuation, described in more detail below, which suggested a fair value of our common stock of $1.17 per share as of December 31, 2012. In addition to the third-party valuation, our board of directors considered that in December 2012 the Inogen One G3 product manufacturing was at full capacity and that we had shown year-over-year improvement in our financial results due to the strength of our business to business and direct-to-consumer sales. However, the board of directors also noted that, while financial results had improved, they were still in line with expectations set in December 2011. The board of directors also considered the likelihood of a liquidity event. We had engaged an investment banking firm to consider a sale of the company, which increased this likelihood from 40% to 65% as that investment banking firm was not pursuing an initial public offering due to the board’s direction and the firm’s expertise being primarily in mergers and acquisitions. Due to our continued growth, the likelihood of an initial public offering had increased from 5% to 10% as well, although no immediate plans were made to pursue an initial public offering. Based on these considerations, our board of directors determined that no significant change in our business, financial results and trends, expected probabilities of various exit scenarios, or expectations of future business had occurred between the December 31, 2012 unrelated third-party valuation and the February 12, 2013 grant date that would have warranted a materially different determination of the value of our common stock than that suggested by the valuation, so as a result a new valuation was not performed. We believe that a retrospective valuation of our common shares as of February 12, 2013 would not result in a different value from the December 31, 2012 valuation previously performed and thus determined a new valuation was not necessary. The valuation approach used for December 31, 2012 was the Option-Pricing Method, which we and the valuation specialist determined to be the appropriate valuation method due to the low probability of an initial public offering at the time and our stage of development. |
-88-
Table of Contents
| • | May 14, 2013—Options granted on this date had an exercise price of $1.17 per share, which was equal to the fair value of our common stock as determined by our board of directors on that date. In reaching this determination, our board of directors considered each of the objective and subjective factors described above, including the most recent unrelated third-party valuation of our common stock as of December 31, 2012. Based on these considerations, our board of directors determined that no significant change in our business or expectations of future business had occurred between the December 31, 2012 independent third-party valuation and the May 14, 2013 grant date that would have warranted a materially different determination of the fair value of our common stock than that suggested by the valuation. |
In preparing for this offering, we determined that a retrospective valuation of the fair value of our common stock as of May 14, 2013 was appropriate for accounting purposes. In assessing the retrospective value of the common stock, our board of directors considered the unrelated-third party valuation it received as of July 31, 2013, described in more detail below, which suggested a fair market value at that date of $6.24 per share. Our board of directors noted that the primary drivers for increased value in the July 2013 third-party valuation were largely associated with increases in the likelihood of a potential liquidity event. Our board of directors determined that the likelihood of a strategic sale decreased and the likelihood of an initial public offering increased due to the fact that the initial public offering market was now accessible to companies with less than $100 million in sales, the valuations for similarly situated companies were increasing, and the JOBS Act was successfully allowing for a more streamlined initial public offering process. In addition, our board of directors noted that it had ended our relationship with the investment banking firm engaged in the fourth quarter of 2012 to sell the company and had engaged its current investment banking firm in May 2013 primarily to consider an initial public offering as the sales efforts undertaken with the assistance of the prior investment banking firm had not produced a strategic or financial investor that met our board of director’s expectations. Management estimated that the probability of an initial public offering within 180 days was 40%. In July 2013, we held our organizational meeting in connection with this offering. As a result of these factors, the independent third-party valuation performed in July 2013 indicated a fair value of our common stock of $6.24 per share. Based on this analysis, our board of directors determined that for accounting purposes the retrospective fair value of our common stock on May 14, 2013 was $6.24 per share.
| • | October 11, 2013. Options granted on this date had an exercise price of $8.37 per share, which was equal to the fair value of our common stock as determined by our board of directors on that date. In reaching this determination, our board of directors considered each of the objective and subjective factors described above. Our board of directors also considered that sales and profits continued to grow in 2013 in line with our expectations. Our board of directors also considered the most recent independent third party valuation of our common stock as of September 30, 2013, described in detail below, which suggested a fair value of $8.37 per share. In addition to third-party valuation, our board of directors noted that over the past 12 months, we had consistently added new customers and improved efficiencies in operations, such that our revenue had grown as had our overall profits. This growth was experienced across the entire company, including rental, direct-to-consumer and business-to-business sales channels. Moreover, revenue growth and profits had slightly exceeded expectations. In addition, management estimated that the probability of an initial public offering within 180 days was 60%. Based on these considerations, our board of directors determined that the fair value of our common stock as of October 11, 2013 was $8.37 per share. |
-89-
Table of Contents
Contemporaneous independent third-party valuations
The independent third-party valuations described below were prepared by Timan, LLC using methodologies, approaches and assumptions consistent with the American Institute of Certified Public Accountants, or AICPA, Audit and Accounting Practice Aid Series: Valuation of Privately Held Company Equity Securities Issued as Compensation, or the AICPA Practice Guide. At the March 31, 2012 and December 31, 2012 valuation dates described below, we used the income approach to estimate our aggregate enterprise value. The income approach measures the value of a company as the present value of its future economic benefits by applying an appropriate risk-adjusted discount rate to expected cash flows, based on forecasted revenue and costs. We prepared a financial forecast for each valuation date to be used in the computation of the enterprise value for the income approach. The financial forecasts took into account our past experience and future expectations. The risks associated with achieving these forecasts were assessed in selecting the appropriate discount rate. There is inherent uncertainty in these estimates.
In order to arrive at the estimated fair value of our common stock, the indicated enterprise value of our company calculated at each valuation date using the income approach was allocated to the shares of convertible redeemable preferred stock and the warrants to purchase these shares, and shares of common stock and the options to purchase these shares using a Black Scholes option-pricing model. The Black-Scholes option-pricing model treats common stock and preferred stock as call options on the total equity value of a company, with exercise prices based on the value thresholds at which the allocation among the various holders of a company’s securities changes. Under the Black-Scholes option-pricing model, the common stock has value only if the funds available for distribution to stockholders exceed the value of the liquidation preference at the time of a liquidity event, such as a strategic sale, merger or initial public offering, assuming the enterprise has funds available to make a liquidation preference meaningful and collectable by the holders of preferred stock. The common stock is modeled as a call option on the underlying equity value at a predetermined exercise price. In the model, the exercise price is based on a comparison with the total equity value rather than, as in the case of a regular call option, a comparison with a per share stock price. Thus, common stock is considered to be a call option with a claim on the enterprise at an exercise price equal to the remaining value immediately after the preferred stock is liquidated. The Black-Scholes option-pricing model is then used to price the options. This model defines the securities’ fair values as functions of the current fair value of a company and uses assumptions such as the anticipated timing of a potential liquidity event, marketability, cost of capital and the estimated volatility of the equity securities. The anticipated timing of a liquidity event utilized in these valuations was based on then-current plans and estimates of our board of directors and management regarding a liquidity event. Estimates of the volatility of our stock were based on available information on the volatility of capital stock of comparable publicly-traded companies. In addition, the valuation considers the fact that our stockholders cannot freely trade our common stock in the public markets. Therefore, the estimated fair value of our common stock at each grant date reflects a non-marketability discount.
December 31, 2011 and March 31, 2012 common stock valuation analyses
Our December 2011 and March 2012 unrelated third-party valuations used a Black-Scholes option pricing model to allocate our estimated enterprise value to the common stock. The valuations applied a risk-adjusted discount of 30%, a non-marketability discount of 15%, and an estimated
-90-
Table of Contents
time to a liquidity event of 3 years. The risk-adjusted discount was estimated to be 30% due to the assumption is that we were in the “Bridge / IPO” stage of development per AICPA valuation methodologies since we have product revenue and achieved positive EBITDA in 2012. Based on these considerations, the independent third-party valuations suggested that the fair market value of our common stock was $0.81 per share as of December 31, 2011 and March 31, 2012.
December 31, 2012 common stock valuation analysis
Our December 2012 independent third-party valuation analysis also used a Black-Scholes option pricing model to allocate our estimated enterprise value to the common stock. The analysis applied a risk-adjusted discount of 30%, a non-marketability discount of 15%, and an estimated time to a liquidity event of 1 to 3 years, with a weighted average time to exit estimated at 1.9 years. The risk-adjusted discount was estimated to be 30% due to the assumption is that we were in the “Bridge / IPO” stage of development per AICPA valuation methodologies since we have product revenue and achieved positive EBITDA in 2012. Based on these considerations, the third-party valuation suggested that the fair market value of our common stock was $1.17 per share as of December 31, 2012.
July 31, 2013 and September 30, 2013 common stock valuation analyses
Due to our decision to pursue this offering, along with our belief that we could reasonably estimate the form and timing of potential liquidity events, independent probability weighted expected return method, or PWERM, to allocate our estimated enterprise value to our common stock for purposes of our July 31, 2013 and September 30, 2013 common stock valuations. The values derived under the income or discounted cash flow approach were first used to determine an initial estimated enterprise value. The initial estimated enterprise value was then subjected to the PWERM model which produced the per share value utilizing a probability-weighted scenarios analysis. The following scenarios were assumed:
| • | Initial public offering. Estimates the value based on an estimated initial public offering, or IPO, value discounted to the present value based on both risk and timing. |
| • | Sale of the company. Estimates the value assuming the sale of the entire enterprise, based on estimates of future value in a potential sale transaction discounted to the present value. |
| • | Private company. Uses both the market comparable approach and the income approach to estimate the equity value as of the valuation date, and then allocates that value using the option pricing model, assuming that the company remains private for longer than in either of the previous scenarios. |
| • | Liquidation. Assumes we are dissolved, in which case the book value less the applicable liquidation preferences represents the amount available to the holders of common stock. |
Over time, as we achieve certain milestones, the probabilities, likely exit values in an initial public offering and sale of the company scenarios, and current value in the private company scenario are adjusted accordingly, with the probability of a successful exit such as an initial public offering or sale of the company increasing over time.
The July 2013 independent third-party valuation used a risk-adjusted discount of 30%, a non-marketability discount of 12-16%, and an estimated time to liquidity event of 0.5 years to 3.0 years, with a weighted average time to exit estimated at 0.71 years. The risk-adjusted
-91-
Table of Contents
discount was estimated to be 30% due to the assumption that we were in the “Bridge / IPO” stage of development per AICPA valuation methodologies since we have product revenue and achieved positive EBITDA in 2012. The unrelated third-party valuation analysis used the following probability weighted scenarios:
| Scenario | Weight | |||
|
|
||||
| IPO within 180 days |
40% | |||
| Sale of the Company within 1 year |
30% | |||
| Private Company |
0% | |||
| Liquidation |
30% | |||
|
|
||||
Based on these considerations, the independent third-party valuation suggested that the fair market value of our common stock was $6.24 per share as of July 31, 2013.
The September 2013 valuation used a risk-adjusted discount of 30%, a non-marketability discount of 12-16%, and an estimated time to liquidity event of 0.5 years to 3.0 years, with a weighted average time to exit estimated at 0.63 years. The risk-adjusted discount was estimated to be 30% due to the assumption is that we were in the “Bridge / IPO” stage of development per AICPA valuation methodologies since we have product revenue and achieved positive EBITDA in 2012. The independent third-party valuation analysis used the following probability weighted scenarios:
| Scenario | Weight | |||
|
|
||||
| IPO within 180 days |
60% | |||
| Sale of the Company within 1 year |
20% | |||
| Private Company |
0% | |||
| Liquidation |
20% | |||
|
|
||||
Based on these considerations, the independent third-party valuation suggested that the fair market value of our common stock was $8.37 per share as of September 30, 2013.
We believe that it is reasonable to expect that the completion of an initial public offering will add value to the shares of our common stock because they will have increased liquidity and marketability. We believe that the estimates above are a reasonable description of the value that market participants would place on the common stock as of each valuation date. There is inherent uncertainty in these estimates and if we or the valuation firm had made different assumptions than those described above, the amount of our stock-based compensation expense, net loss and net loss per share amounts could have been significantly different.
Inventory and rental asset valuation
Inventory consists of raw materials, certain component parts to be used in manufacturing our products and finished goods. Inventory is stated at the lower of cost or market. Cost is determined using a standard cost method, including material, labor, and manufacturing overhead, whereby the standard costs are updated at least quarterly to approximate actual costs using the first-in, first-out (“FIFO”) method and market represents the lower of replacement cost or estimated net realizable value. We record adjustments to inventory for potentially excess, obsolete, slow-moving or impaired items. The business environment in which we operate is subject to changes in technology and customer demand. We review inventory for excess and obsolete products and components at least quarterly, taking into account product life cycle and
-92-
Table of Contents
development plans, product expiration and quality issues, historical experience and our current inventory levels. If actual market conditions are less favorable than anticipated, additional inventory adjustments could be required.
Rental assets are valued at standard cost to manufacture or purchase the product, including appropriate labor and overhead. Costs are reviewed at least quarterly to confirm standard costs approximate actual costs using the first-in, first-out (“FIFO”) method. Rental assets are depreciated over the life of the asset, typically 18 months to 60 months. Rental asset disposals or losses are recorded at net book value in cost of revenue.
Accounts receivable and allowance for bad debts, returns, and adjustments
Accounts receivable are customer obligations due under normal sales and rental terms. We perform continuing credit evaluations of the customers’ financial condition and generally do not require collateral. The allowance for doubtful accounts is maintained at a level that, in our opinion, is adequate to absorb potential losses related to account receivables and is based upon our continuous evaluation of the collectability of outstanding balances. Our evaluation takes into consideration such factors as past bad debt experience, economic conditions, and information about specific receivables. Our evaluation also considers the age and composition of the outstanding amount in determining their net realizable values. The allowance is based on estimates and ultimate losses may vary from current estimates. As adjustments to these estimates become necessary, they are reported in earnings in the periods that they become known. The allowance is increased by bad debt provisions charged to operating expense and reduced by direct write-offs, net of recoveries. In the event that a third-party payor does not accept the claim for payment, the consumer is ultimately responsible for payment for the products and services.
In general, our allowance for doubtful accounts is higher for our rental revenue compared to our sales revenue. The nature of our rental business necessitates a larger bad debt reserve against billings, as a higher percentage of our billed revenue may never be collected as a result of the failure of some patients to pay their co-insurance and deductible obligations and some billing disputes with payors.
Provision for sales returns applies to direct-to-consumer sales only. We do not allow returns from providers. This reserve is calculated based on actual historical return rates under our 30-day return program and is applied to the current period’s sales revenue for direct to consumer sales. We have experienced a small increase in the historical returns rate during the period, primarily due to increased competition among other providers and resellers and a slight increase in product failures in the relevant periods.
We also record an allowance for rental revenue adjustments and write-offs, which is recorded as a reduction of rental revenue and rental accounts receivable balances. These adjustments and write offs result from contractual adjustments, audit adjustments, untimely claims filings or billing not paid due to another provider performing same or similar functions for the patient in the same period, all of which prevent billed revenue to become realizable. The reserve is based on historical revenue adjustments as a percentage of rental revenue billed during the related period.
Included in accounts receivable are earned but unbilled receivables of $1.2 million in September 30, 2013 and $1.0 million at December 31, 2012. Delays in billing can occur between the date revenue is earned and when billing occurs due to delays in receiving the appropriate
-93-
Table of Contents
paperwork for each payor. Earned but unbilled receivables are aged from the date of service and are considered in our analysis of historical performance and collectability. A portion of revenue and related costs are deferred each month for monthly rental revenue based on the timing of the recurring billing and then recorded as revenue in the subsequent month.
Fair value measurements
Accounting Standards Codification (ASC) 820, Fair Value Measurements and Disclosures, creates a single definition of fair value, establishes a framework for measuring fair value in generally accepted accounting principles and expands disclosures about fair value measurements. ASC 820 emphasizes that fair value is a market-based measurement, not an entity-specific measurement, and states that a fair value measurement should be determined based on assumptions that market participants would use in pricing the asset or liability. Assets and liabilities adjusted to fair value in the balance sheet are categorized based upon the level of judgment associated with the inputs used to measure their fair value.
The warrant liability is marked to market each reporting date until the warrants are settled. The fair value of the warrant liability is estimated using a Monte Carlo option pricing model, which takes into consideration the market values of comparable public companies, considering among other factors, the use of multiples of earnings, and adjusted to reflect the restrictions on the ability of the company’s securities to trade in an active market.
Income taxes
We use the liability method of accounting for income taxes. Deferred tax assets and liabilities are recognized for the future tax consequences attributable to the differences between the financial statement carrying amounts of existing assets and liabilities and their respective tax basis. Deferred tax assets and liabilities are measured using enacted tax rates expected to be in effect when such assets and liabilities are recovered or settled. The effect on deferred tax assets and liabilities of a change in tax rates is recognized in the year that includes the enactment date. We determine deferred tax assets including net operating losses and liabilities, based on temporary differences between the book and tax bases of assets and liabilities. We believe that it is currently more likely than not that our deferred tax assets will not be realized, and as such, a full valuation allowance is required.
We utilize a two-step approach for evaluating uncertain tax positions. Step one, recognition, requires us to determine if the weight of available evidence indicates that a tax position is more likely than not to be sustained upon audit, including resolution of related appeals or litigation processes, if any. If a tax position is not considered “more likely than not” to be sustained, no benefits of the position are recognized. If we determine that a position is “more likely than not” to be sustained, then we proceed to step two, measurement, which is based on the largest amount of benefit which is more likely than not to be realized on effective settlement. This process involves estimating our actual current tax exposure, including assessing the risks associated with tax audits, together with assessing temporary differences resulting from the different treatment of items for tax and financial reporting purposes. If actual results differ from our estimates, our net operating loss and credit carryforwards could be materially impacted.
At December 31, 2012, we had federal net operating loss carryforwards, or NOLs, of approximately $62 million and federal research and experimentation credit carryforwards of
-94-
Table of Contents
approximately $0.6 million, which may be used to reduce future taxable income or offset income taxes due. These NOLs and credit carryforwards expire during the period 2022 through 2032.
Our realization of the benefits of the NOLs and credit carryforwards is dependent on sufficient taxable income in future fiscal years. We have established a valuation allowance against the carrying value of our deferred tax assets, as it is not currently more likely than not that we will be able to realize these deferred tax assets. In addition, utilization of NOLs and credits to offset future income subject to taxes may be subject to substantial annual limitations due to the “change in ownership” provisions of the Code and similar state provisions. We may have already experienced one or more ownership changes. Depending on the timing of any future utilization of our carryforwards, we may be limited as to the amount that can be utilized each year as a result of such previous ownership changes. However, we do not believe such limitations will cause our NOL and credit carryforwards to expire unutilized. We are in the process of determining whether this offering would constitute an ownership change resulting in further limitations on our ability to use our net operating loss and tax credit carryforwards. If an ownership change is deemed to have occurred as a result of this offering, potential near term utilization of these assets could be reduced.
We recognize interest and penalties on taxes, if any, within operations as income tax expense. No significant interest or penalties were recognized during the periods presented.
We operate in multiple states. The statute of limitations has expired for all tax years prior to 2009 for federal and 2008 to 2009 for various state tax purposes. However, the net operating loss generated on the federal and state tax returns in prior years may be subject to adjustments by the federal and state tax authorities.
We do not anticipate that the amount of our existing unrecognized tax benefits will significantly increase or decrease within the next 12 months. Due to the presence of NOLs in most jurisdictions, our tax years remain open for examination by taxing authorities back to the inception of the company.
Recent accounting pronouncements
We have reviewed recent accounting pronouncements and concluded that they are either not applicable to our business or that no material effect is expected on the financial statements as a result of future adoption.
As an “emerging growth company” the JOBS Act allows us to delay adoption of new or revised accounting pronouncements applicable to public companies until such pronouncements are made applicable to private companies. As a result, our financial statements may not be comparable to the financial statements of issuers who are required to comply with the effective dates for new or revised accounting standards that are applicable to public companies.
Internal controls and procedures
In connection with the audits of our financial statements for the years ended December 31, 2011 and 2012, we concluded that there were material weaknesses in our internal control over financial reporting. A material weakness is a significant deficiency, or a combination of significant deficiencies, in internal control over financial reporting such that it is reasonably possible that a material misstatement of the annual or interim financial statements will not be
-95-
Table of Contents
prevented or detected on a timely basis. The material weaknesses that we identified related to (1) a lack of sufficient staff to deal with the various rules and regulations with respect to financial reporting, (2) accounting for revenue recognition as it relates to properly recording deferred revenue, estimated earned but unbilled revenue and billing adjustments and (3) accounting for warranty revenue and cost recognition with regard to lifetime warranties. The lack of adequate staffing levels resulted in insufficient time spent on review and approval of certain information used to prepare our financial statements and the maintenance of effective controls to adequately monitor and review significant transactions for financial statement completeness and accuracy. These control deficiencies, although varying in severity, contributed to the material weaknesses in the control environment. If one or more material weaknesses persist or if we fail to establish and maintain effective internal control over financial reporting, our ability to accurately report our financial results could be adversely affected.
Although remediation efforts are still in progress, management is taking steps to remediate the material weakness in our internal control over financial reporting, including the implementation of new accounting processes and control procedures and the identification of gaps in our skills base and expertise of the staff required to meet the financial reporting requirements of a public company. We have hired and plan to hire additional accounting personnel who are degreed accountants, which has enabled us to expedite our month-end close process, thereby facilitating the timely preparation of financial reports and strengthen our segregation of duties.
We will be required, pursuant to Section 404(a) of the Sarbanes-Oxley Act, to furnish a report by management on, among other things, the effectiveness of our internal control over financial reporting for the year following our first annual report required to be filed with the SEC. This assessment will need to include disclosure of any material weaknesses identified by management over our internal control over financial reporting. However, our independent registered public accounting firm will not be required to report on the effectiveness of our internal control over financial reporting pursuant to Section 404(b) until the later of the year following our first annual report required to be filed with the SEC, or the date we are no longer an “emerging growth company” if we take advantage of the exemptions contained in the JOBS Act.
We are in the very early stages of the costly and challenging process of compiling the system and processing documentation necessary to perform the evaluation needed to comply with Section 404. We may not be able to complete our evaluation, testing or any required remediation in a timely fashion. During the evaluation and testing process, if we identify one or more material weaknesses in our internal control over financial reporting, we will be unable to assert that our internal controls are designed and operating effectively, which could result in a loss of investor confidence in the accuracy and completeness of our financial reports. This could cause the price of our common stock to decline, and we may be subject to investigation or sanctions by the SEC.
Off-balance sheet arrangements
We do not have any relationships with unconsolidated entities or financial partnerships, such as entities often referred to as structured finance or special purpose entities, which would have been established for the purpose of facilitating off-balance sheet arrangements or for any other contractually narrow or limited purpose. However, from time to time we enter into certain types of contracts that contingently require us to indemnify parties against third-party claims including certain real estate leases, supply purchase agreements, and directors and officers. The terms of
-96-
Table of Contents
such obligations vary by contract and in most instances a maximum dollar amount is not explicitly stated therein. Generally, amounts under these contracts cannot by reasonably estimated until a specific claim is asserted thus no liabilities have been recorded for these obligations on our balance sheets for any of the periods presented.
Inflation
We experience pricing pressures in the form of continued reductions in reimbursement rates, particularly from governmental payors such as Medicare or Medicaid but also private payors. We can also be impacted by rising costs for certain inflation-sensitive operating expenses such as labor and employee benefits. However, we do not believe that inflation has had a material effect on our business, financial condition or results of operations. If our costs were to become subject to significant inflationary pressures, we may not be able to fully offset such higher costs through price increases, especially in contracts where pricing is fixed over a specific period. Our inability or failure to do so could adversely affect our business, financial condition and results of operations.
Quantitative and qualitative disclosures about market risk
We are exposed to various market risks, including changes in commodity prices and interest rates. Market risk is the potential loss arising from adverse changes in market rates and prices. Prices for our products are denominated in U.S. dollars and, as a result, we do not face significant risk with respect to foreign currency exchange rates.
Interest rate fluctuation risk
The principal market risk we face is interest rate risk. We had cash and cash equivalents of $17.1 million as of September 30, 2013, which consisted of highly-liquid investments with an original maturity of three months or less. The goals of our investment policy are liquidity and capital preservation. We do not enter into investments for trading or speculative purposes. We believe that we do not have any material exposure to changes in the fair value of these assets as a result of changes in interest rates due to the short term nature of our cash and cash equivalents. Declines in interest rates, however, would reduce future investment income. A decline in interest rates of 1%, occurring on October 1, 2013 and sustained throughout the period ended September 30, 2014, would not be material.
As of September 30, 2013, the principal and accrued interest outstanding under our term borrowings was $11.1 million. The interest rates on our term borrowings under our revolving credit and term loan agreement are fixed. If overall interest rates had increased by 10% during the periods presented, our interest expense would not have been materially affected.
Foreign currency exchange risk
To date, our international customer and distributor agreements have been denominated almost exclusively in U.S. dollars. Accordingly, we have limited exposure to foreign currency exchange rates. The effect of a 10% adverse change in exchange rates on foreign denominated cash, receivables and payables would not have been material for the periods presented. As our operations in countries outside of the United States grow, our results of operations and cash flows will be subject to fluctuations due to changes in foreign currency exchange rates, which could harm our business in the future. To date, we have not entered into any material foreign currency hedging contracts although we may do so in the future.
-97-
Table of Contents
Overview
We are a medical technology company that develops, manufactures and markets innovative portable oxygen concentrators used to deliver supplemental long-term oxygen therapy to patients suffering from chronic respiratory conditions. Traditionally, these patients have relied on stationary oxygen concentrator systems for use in the home and oxygen tanks or cylinders for mobile use, which we call the delivery model. The tanks and cylinders must be delivered regularly and have a finite amount of oxygen, which requires patients to plan activities outside of their homes around delivery schedules and a finite oxygen supply. Additionally, patients must attach long, cumbersome tubing to their stationary concentrators simply to enable mobility within their homes. Our proprietary Inogen One systems concentrate the air around the patient to offer a single source of supplemental oxygen anytime, anywhere with a portable device weighing approximately 4.8 or 7.0 pounds. Our Inogen One G3 and G2 have up to 4.5 and 5 hours of battery life, respectively, with a single battery and can be plugged into an outlet when at home, in a car, or in a public place with outlets available. Our systems reduce the patient’s reliance on stationary concentrators and scheduled deliveries of tanks with a finite supply of oxygen, thereby improving patient quality of life and fostering mobility.
Although portable oxygen concentrators represent the fastest-growing segment of the Medicare oxygen therapy market, we estimate based on 2012 Medicare data that patients using portable oxygen concentrators represent approximately 4% to 5% of the total addressable oxygen market in the United States. Based on 2012 industry data, we were the leading worldwide manufacturer of portable oxygen concentrators, as well as the largest provider of portable oxygen concentrators to Medicare patients, as measured by dollar volume. We believe we are the only manufacturer of portable oxygen concentrators that employs a direct-to-consumer strategy in the United States, meaning we market our products to patients, process their physician paperwork, provide clinical support as needed and bill Medicare or insurance on their behalf. To pursue a direct-to-consumer strategy, our manufacturing competitors would need to meet national accreditation and state-by-state licensing requirements and secure Medicare billing privileges, as well as compete with the home medical equipment providers that many rely on across their entire homecare business.
We believe our direct-to-consumer strategy has been critical to driving patient adoption of our technology. Other portable oxygen concentrator manufacturers access patients by selling through home medical equipment providers that we believe are disincentivized to encourage adoption of portable oxygen concentrators. In order to facilitate the regular delivery and pickup of oxygen tanks, home medical equipment providers have invested in geographically dispersed distribution infrastructure consisting of delivery vehicles, physical locations and delivery personnel within each area. Because portable oxygen concentrators eliminate the need for a physical distribution infrastructure, but have higher initial equipment costs than the delivery model, we believe converting to a portable oxygen concentrators model would require significant restructuring and capital investment for home medical equipment providers. Our direct-to-consumer marketing strategy allows us to sidestep the home medical equipment channel, appeal to patients directly and capture both the manufacturing and provider margin associated with long-term oxygen therapy. We believe our ability to capture this top-to-bottom margin, combined with our portable oxygen concentrators technology that eliminates the need for the service and infrastructure costs associated with the delivery model, gives us a cost structure advantage over our competitors.
-98-
Table of Contents
Since adopting our direct-to-consumer strategy in 2009 following our acquisition of Comfort Life Medical Supply, LLC, which had an active Medicare billing number but few other assets and limited business activities, we have directly sold or rented our Inogen One systems to more than 40,000 patients, growing our revenue from $10.7 million in 2009 to $48.6 million in 2012. In 2012, 27.6% of our revenue came from our international markets and 40.9% of our revenue came from oxygen rentals. Our percentage of rental revenue increased from 35.8% in 2011, increasing our proportion of recurring revenue. Additionally, we have increased our gross margin from 48.0% in 2011 to 49.3% in 2012 by increasing rental mix, improving system reliability, reducing material cost per system and lowering overhead cost per system. Our net loss was $2.6 million in 2009 transitioning to net income of $0.6 million in 2012.
Our market
Overview of oxygen therapy market
We believe the current total addressable oxygen therapy market in the United States is approximately $3 billion to $4 billion, based on 2012 Medicare data and our estimate of the ratio of the Medicare market to the total market. We estimate that more than 2.5 million patients in the United States and more than 4.5 million patients worldwide use oxygen therapy, and more than 60% of oxygen therapy patients in the United States are covered by Medicare. The number of oxygen therapy patients in the United States is projected to grow by approximately 7% to 10% per year between 2013 and 2019, which we believe is the result of earlier diagnosis of chronic respiratory conditions, demographic trends and longer durations of long-term oxygen therapy.
Long-term oxygen therapy is used by patients with a variety of respiratory conditions that suffer from hypoxemia, a condition in which patients have insufficient oxygen in the blood. Hypoxemic patients are unable to convert oxygen found in the air into the bloodstream in an efficient manner. Sufficient oxygen in the blood is critical for healthy organ function. Air contains approximately 21% oxygen, which is sufficient to supply individuals with normal lung function, but for individuals suffering from hypoxemia, a high-purity oxygen stream, typically 85% to 99% pure, is used to supplement regular air to compensate for the inefficiencies of the lungs. Because long-term oxygen therapy patients are able to breathe on their own but with less lung function than non-oxygen patients, patients may disconnect from their oxygen source for short periods of time, such as to shower or change oxygen sources. However, optimal outcomes are associated with 24/7 oxygen therapy, and patients typically experience shortness of breath if they disconnect for too long, with the amount of time before they experience shortness of breath varying based on the severity of their disease and remaining lung function. A variety of conditions can cause breathing-related problems that lead to impaired lung function, including chronic obstructive pulmonary disease, or COPD, congestive heart failure and pulmonary fibrosis. COPD refers to a group of diseases including emphysema and chronic bronchitis, and is generally associated with long term tobacco use. Approximately 70% of our patient population has been diagnosed with COPD, which we believe is reflective of the long-term oxygen therapy market in general.
Long-term oxygen therapy has been shown to be a cost-efficient and clinically effective means to treat hypoxemia. For example, the cost of one year of home oxygen therapy costs less than one day in the hospital. Increasing emphasis on early diagnosis and more intensive management of respiratory conditions is driving increased diagnosis rates of COPD and other conditions that lead to hypoxemia. Industry sources estimate that 24 million people in the United States have COPD,
-99-
Table of Contents
and one-half are undiagnosed. We believe the increased emphasis on early diagnosis of respiratory conditions and awareness of the benefits of oxygen therapy will continue to drive growth in the oxygen therapy patient population.
Treatment alternatives
According to our analysis of 2011 and 2012 Medicare data, approximately two-thirds of U.S. oxygen users require ambulatory oxygen and the remaining one-third require only stationary or nocturnal oxygen. Clinical data has shown that ambulatory patients that use oxygen twenty-four hours a day, seven days a week, or 24/7, regardless of whether such patients rely on portable oxygen concentrators or the delivery model, have approximately two times the survival rate and spend at least 60% fewer days annually in the hospital than non-ambulatory 24/7 patients. Of the ambulatory patients, we estimate that approximately 85% rely upon the delivery model that has the following disadvantages:
| • | limited flexibility outside the home, dictated by the finite oxygen supply provided by tanks and cylinders and dependence on delivery schedules; |
| • | restricted mobility and inconvenience within the home, as patients must attach long, cumbersome tubing to a noisy stationary concentrator to move within their homes; |
| • | products are not cleared for use on commercial aircraft and cannot plug into a vehicle outlet for extended use; and |
| • | high costs driven by the infrastructure necessary to establish a geographically diverse distribution network to serve patients locally, as well as personnel, fuel and other costs, which have limited economies of scale and generally increase over time. |
The drawbacks of the delivery model and stationary concentrator systems have led to the emergence of a variety of oxygen therapy solutions, including home transfill systems, and most recently, portable oxygen concentrators. Home transfill systems attach to a stationary machine and allow patients to refill oxygen canisters at home, eliminating the need for deliveries but not the finite oxygen supply contraints or the need to use a bulky, noisy stationary concentrator in the home. Portable oxygen concentrators were developed in response to many of the limitations associated with traditional oxygen therapy and other sources. Portable oxygen concentrators are designed to offer a self-replenishing, unlimited supply of oxygen that is concentrated from the surrounding air and operate without the need for oxygen tanks or regular oxygen deliveries. With the exception of portable oxygen concentrators, we believe that none of the currently available oxygen therapy alternatives fully eliminate both the delivery and finite supply constraints that impede a patient’s travel and mobility. The following table summarizes the current oxygen therapy alternatives.
-100-
Table of Contents
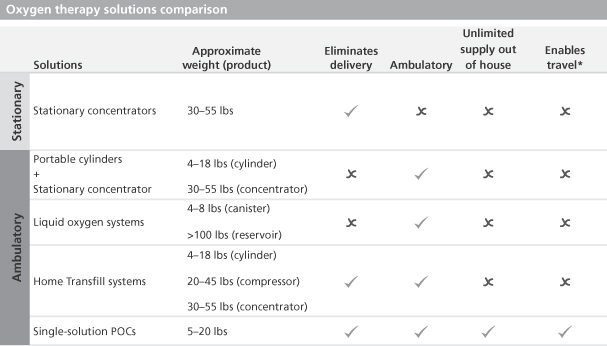
| * | Cleared for use on commercial aircraft and can plug into a car outlet for extended use |
Our Inogen One G3 and G2 have up to 4.5 and 5 hours of battery life, respectively, with a single battery and can be plugged into an outlet when at home, in a car, or in a public place with outlets available. By freeing patients from having to plan their activities around oxygen supply and deliveries, portable oxygen concentrators allow patients to enhance their independence and mobility. Additionally, because portable oxygen concentrators do not require the physical infrastructure and service intensity of the delivery model, we believe portable oxygen concentrators can provide oxygen therapy with a lower cost structure. As a result, we believe portable oxygen concentrators are well suited for Medicare’s competitive bidding program, which is designed to reduce and control Medicare expenditures on select medical supplies used in the home, such as oxygen therapy, sleep apnea products, diabetic infusion supplies and other equipment. This program requires providers to compete on the price they can receive for servicing Medicare beneficiaries.
Despite the ability of portable oxygen concentrators to address many of the shortcomings of traditional oxygen therapy, we estimate based on 2012 Medicare data that the amount spent by patients with portable oxygen concentrators represents approximately 5% to 6% of total oxygen therapy spend. We believe the following has hindered the market acceptance of portable oxygen concentrators:
| • | To obtain portable oxygen concentrators, patients are dependent on home medical equipment providers, which have made investments in the physical distribution infrastructure to support the delivery model. In order to provide oxygen therapy using the delivery model, most home medical equipment providers have made significant investments in fleets of delivery vehicles, personnel, and physical locations required to provide traditional oxygen therapy and other homecare products in local markets. As a result, home medical equipment providers are somewhat disincentivized to drive patients to adopt portable oxygen concentrators, which do not require physical infrastructure but require higher upfront equipment costs. |
-101-
Table of Contents
| • | Manufacturing cost of conventional portable oxygen concentrators is constrained by manufacturer reliance on home medical equipment channel. In order to incentivize third-party home medical equipment providers to represent them, other portable oxygen concentrators manufacturers have to compete not only against portable oxygen concentrators, but also against other oxygen solutions that are highly commoditized, such as oxygen tanks, home transfill, liquid oxygen and stationary concentrators. Additionally, these portable oxygen concentrators manufacturers have to share the resulting top-to-bottom margin with the distribution channel. As a result, these portable oxygen concentrators manufacturers have been particularly focused on constraining manufacturing costs in order to enable them to compete effectively within the home medical equipment market. |
| • | Limitations of conventional portable oxygen concentrators. We believe portable oxygen concentrators have historically suffered from a reputation of being bulky, unreliable, impractical, and suitable only for intermittent or travel use. The 5th Consensus Conference on Oxygen recommended that ambulatory oxygen products weigh less than 10 pounds. While in recent years several other manufacturers have introduced sub-10 pound portable oxygen concentrators, we believe that none are explicitly designed to provide a single oxygen solution for the patient’s regular oxygen needs, and patients must generally use conventional portable oxygen concentrators for intermittent or travel purposes or with a stationary concentrator in the home. We believe this is because many other sub-10 pound portable oxygen concentrators on the market lack the durability and clinical validation to be used 24/7. |
In spite of the home medical equipment channel resistance to portable oxygen concentrators and the limitations of conventional portable oxygen concentrators, patients continue to demand portable oxygen concentrators. According to Medicare data, the number of patients using portable oxygen concentrators grew by 109% from 2010 to 2012. As patients bear more of their healthcare costs and become more involved in their own healthcare decisions, we believe they will continue to demand portable oxygen concentrators in increasingly greater numbers, especially as the traditional technological and channel limitations break down.
Our solution
Our Inogen One systems provide patients who require long-term oxygen therapy with a reliable, lightweight single solution product that improves quality-of-life, fosters mobility and eliminates dependence on both oxygen tanks and cylinders as well as stationary concentrators. We believe our direct-to-consumer strategy increases our ability to effectively develop, design and market our Inogen One solutions, as it allows us to:
| • | drive patient awareness of our portable oxygen concentrator through direct marketing, sidestepping the home medical equipment channel that other manufacturers rely upon across their homecare businesses and that is incentivized to continue to service oxygen patients through the delivery model; |
| • | capture the manufacturer and home medical equipment provider margins, allowing us to focus on the total cost of the solution and to invest in the development of product features instead of being constrained by the price required to attract representation from a distribution channel. For example, we have invested in features that improve patient satisfaction, product durability, reliability and longevity, which increase the cost of our hardware, but reduce the total cost of our solution by reducing our maintenance and repair cost; and |
-102-
Table of Contents
| • | access and utilize direct patient feedback in our research and development efforts, allowing us to innovate based on this feedback and stay at the forefront of patient preference. For example, we have integrated a double battery into our product offering based on direct patient feedback. |
We believe the combination of our direct-to-consumer strategy with our singular focus on designing and developing oxygen concentrator technology has created the best-in-class portfolio of portable oxygen concentrators. Our two current product offerings, the Inogen One G3 and Inogen One G2, at approximately 4.8 and 7.0 pounds, respectively, are amongst the most lightweight portable oxygen concentrators on the market. We believe our Inogen One solutions offer the following benefits:
| • | Single solution for home, ambulatory, travel and nocturnal treatment. We believe our Inogen One solutions are the only portable oxygen concentrators marketed as a single solution, by which we mean a patient can use our Inogen One systems as their only supplemental oxygen source with no need to also use a stationary concentrator regularly. Our compressors are specifically designed to enable our patients to run our portable oxygen concentrators 24/7, whether powered by battery or plugged into an outlet at home or in a car while the battery is recharging. |
| • | Reliability. We have made product performance a priority and have improved reliability with each generation. For example, we have introduced patented air-dryer and patent-pending user-replaceable sieve beds to our products, which have improved product performance and, as a result, patient satisfaction. Reliability is not only critical to patient satisfaction, but also cost management, as our minimal physical infrastructure makes product exchanges more costly to us than providers with greater local physical infrastructure. |
| • | Clinical validation for nocturnal use. We have clinically validated, through independently commissioned patient studies, our Intelligent Delivery Technology, which enables our portable oxygen concentrators to provide consistent levels of oxygen during sleep despite decreased respiratory rates. As a result, patients can rely on the Inogen One G3 and Inogen One G2 portable oxygen concentrators overnight while sleeping. |
| • | Unparalleled flow capacity. Our 4.8 pound Inogen One G3 has at least 50% more flow capacity than other sub-5 pound portable oxygen concentrators, and our 7.0 pound Inogen One G2 has at least 15% more flow capacity than other sub-10 pound portable oxygen concentrators. |
| • | User friendly features. Our systems are designed with multiple user friendly features, including long battery life and low noise-levels in their respective weight categories. |
Our strengths
We believe our products and business model position us well to compete not only against other oxygen device manufacturers, but also to increase our share of the overall oxygen therapy market. We believe we have the following advantages relative to both traditional oxygen therapy providers and other oxygen device manufacturers:
| • | Attractive economic model. Our non-delivery model allows us to receive a premium monthly Medicare reimbursement for deployment of our devices to oxygen patients versus the delivery |
-103-
Table of Contents
| model. Standard Medicare reimbursement for ambulatory patients using the delivery model is $208.21 per month versus $229.87 per month for our portable oxygen concentrator model, representing a premium of $21.66 per month. A similar premium was maintained in the round one recompete ($19.09 per month) and in the round two ($23.30 per month) competitive bidding areas. In addition, we believe our portable oxygen concentrator technology and direct-to-consumer strategy allow us to provide our solutions through a more efficient cost structure. The delivery model requires ongoing gaseous or liquid oxygen container refills and regular home deliveries with accompanying costs, while our portable oxygen concentrator non-delivery model eliminates oxygen container refills and regular deliveries of oxygen containers and their associated costs. Following the first two rounds of competitive bidding and the round one recompete, we retained access to approximately 90% of the U.S. long-term oxygen therapy market, with the majority of contracts through mid-2016, while many providers were priced out of this market. |
| • | Direct-to-consumer capabilities. We believe our direct-to-consumer strategy enables patient access and retention as well as innovation and investment in our product portfolio. Pursuing a direct-to-consumer strategy requires national accreditation, state-by-state licensing and Medicare billing privileges. Given that we are unaware of any manufacturing competitor that currently markets on a direct-to-consumer basis, we do not believe any of these manufacturers possesses the necessary qualification to do so. If any of our manufacturing competitors were to pursue a direct-to-consumer strategy, they would risk negative reaction from the home medical equipment providers that sell their other homecare products, such as sleep apnea and mobility products, which generally represent significantly larger portions of their businesses than oxygen therapy products. |
| • | Commitment to customer service. We are focused on providing our patients the highest quality of customer service. We guide them through the reimbursement and physician paperwork process, perform clinical titration and offer 24/7 telephone support, which includes clinical support as required. We believe our focus on customer service has helped drive our sustained patient satisfaction rating of approximately 95%, as measured by our customer satisfaction surveys. |
| • | Patient-friendly, single-solution, sub-5 and sub-10 pound portable oxygen concentrators. We have clinically validated the technology used in Inogen One G2 and Inogen One G3 for nocturnal use through independently commissioned patient studies. Additionally, we believe our products provide a unique combination of durability and reliability, ease-of-use and other user friendly-features. |
| • | Commitment to research and development and developing intellectual property portfolio. As of January 1, 2014, we had 24 issued U.S. patents, one issued Canadian patent and six pending U.S. patent applications covering the design and construction of our oxygen concentrators and system optimization. Additionally, we have invested significantly in research and development and have a robust product pipeline of next-generation oxygen concentrators. |
| • | Management team with proven track record and cost focus. Our management team has built our direct-to-consumer capabilities and launched our two current primary product offerings, Inogen One G2 and Inogen One G3. We continue to realize meaningful product manufacturing cost savings of approximately 36% from our Inogen One G1 to our Inogen One G3 as a result of management’s improvements in design, sourcing and reliability, as well as higher production volumes. |
-104-
Table of Contents
| • | Revenue growth, profitability and recurring revenue. We have grown our revenue from $10.7 million in 2009 to $48.6 million in 2012, representing a year-over-year growth rate of 58.8%. In 2012, our recurring rental revenue represented 40.9% of sales. Our net loss was $2.6 million in 2009 transitioning to net income of $0.6 million in 2012. |
Our strategy
Our goal is to design, build and market oxygen solutions that redefine how oxygen therapy is delivered. To accomplish this goal, we will continue to invest in our product offerings and our commercial infrastructure to:
| • | Expand our sales and marketing channels. We plan to continue to expand our direct-to-consumer efforts and invest in advertising as well as internal and physician-based salespeople, as we have been able to drive growth through these investments historically. We intend to invest in additional distribution, particularly in our international markets. |
| • | Develop innovative products. We intend to continue to invest in research and development to stay at the forefront of innovation and patient preference. Our product pipeline includes a stationary concentrator and a fourth-generation portable oxygen concentrator. The stationary concentrator, which we are calling Inogen At Home and expect to launch in 2014, will allow us to access the non-ambulatory patient group and serve as an emergency backup for our Inogen One patients. The fourth-generation portable oxygen concentrator will be an ultra-lightweight portable oxygen concentrator and we expect to launch this in the next several years. |
| • | Secure contracts with health care payors and insurers. We are actively pursuing additional private payor and Medicaid contracts. Based on our patient population, at least 30% of our home oxygen therapy patients have non-Medicare coverage, and we believe these patients represent a younger and more active patient population that will be drawn to the quality-of-life benefits of our solution. By increasing the number of private payors for which we are an in-network provider, we believe we can expand oxygen patient access to our products and services at more favorable in-network terms. |
| • | Focus on cost reduction through scalable manufacturing, reliability improvements, asset utilization and service cost reduction. Close interaction between our design engineering, manufacturing and materials teams has resulted in numerous design improvements that have enabled us to cut our material and labor costs by approximately 36% from our Inogen One G1 to our Inogen One G3. We intend to continue to reduce our cost basis through scalable manufacturing, better sourcing, continuous innovation and reliability improvements, as well as innovations that reduce our product service costs by minimizing exchanges, such as user-replaceable batteries and oxygen filtration cartridges. |
Our Inogen One systems
We market our current product offerings, the Inogen One G3 and the Inogen One G2, as single solutions for oxygen therapy. This means our solutions can operate on a 24/7 basis for at least 60 months without a stationary concentrator. We have clinically validated the technology used in Inogen One G3 and the Inogen One G2 for nocturnal use through independently commissioned patient studies. Our Inogen One G2 and the Inogen One G3 are sub-5 and sub-10 pound portable oxygen concentrators that can operate reliably and cost-effectively over the long period of time needed to service oxygen therapy patients without supplemental use of a stationary concentrator or a replacement portable oxygen concentrator. To the extent our competitors’ portable oxygen solutions
-105-
Table of Contents
require supplemental use of a stationary oxygen concentrator, their solutions are less cost-effective and less convenient for patients. The following table summarizes our key product features:
| Key Product Specifications | ||||
| Inogen One G3 | Inogen One G2 | |||
|
| ||||
| Capacity (ml/min) |
840 | 1,260 | ||
| Weight (lbs) |
4.8 (single battery) 5.8 (double battery) |
7.0 (single battery) 8.4 (double battery) | ||
| Battery run-time | Up to 4.5 hours (single battery) Up to 9.0 hours (double battery) |
Up to 5 hours (single battery) Up to 10 hours (double battery) | ||
| Maintenance prevention advantages | User replaceable oxygen filtration cartridges & battery |
Air dryer & user replaceable battery | ||
| Technology clinically validated through independently commissioned patient studies for overnight use | Yes | Yes | ||
| Sound | 42 dBA | 38 dBA | ||
|
| ||||
We have focused our research and development efforts on creating solutions that we believe have overcome the reputation of portable oxygen concentrators as being limited in durability and reliability as well as unsuitable for nighttime or 24/7 use. We specifically designed our compressors for 24/7 use. We have worked to improve our reliability and reduce service costs by equipping our portable oxygen concentrators with features such as membrane air dryers and user replaceable filtration cartridges.
All of our Inogen One systems are equipped with Intelligent Delivery Technology, a form of pulse-dose technology from which the patient receives a bolus of oxygen upon inhalation. Pulse dose technology was developed to extend the number of hours an oxygen tank would last and is generally used on all ambulatory oxygen therapy devices. Our proprietary conserver technology utilizes differentiated triggering sensitivity to quickly detect a breath and ensure oxygen delivery within the first 400 milliseconds of inspiration, the interval when oxygen has the most effect on lung gas exchange. During periods of sleep, respiratory rates typically decrease. Our Inogen One systems actively respond to this changing physiology through the use of proprietary technology that increases bolus size. We have clinically validated, through independently commissioned patient studies, our Intelligent Delivery Technology in published, peer-reviewed clinical studies, and we have demonstrated levels of blood oxygen saturation during sleep and all other periods of rest and activity that are substantially equivalent to continuous flow systems.
The Inogen One G3, our next-generation product, is among the most lightweight products on the market with substantially higher oxygen production capabilities than the other sub-5 pound portable oxygen concentrators on the market. We believe the performance parameters around the Inogen One G3 and Inogen One G2 allow us to serve approximately 95% of the ambulatory oxygen patients and enable us to address a patient’s particular clinical needs, as well as lifestyle and performance preferences.
-106-
Table of Contents
Our direct-to-consumer business model has enabled us to receive direct patient feedback, and we have used this feedback to create portable oxygen concentrators that address the full suite of features and benefits critical to patient preference and retention. Our products prevent patients from having to choose between lightweight size, suitability for 24/7 use, reliability, and key features such as battery life, flow and reduced noise levels.
Sales and marketing
Our direct-to-consumer sales and marketing efforts are focused on generating awareness and demand for our Inogen One systems among patients, physicians and other clinicians, and third-party payors. In the United States as of January 1, 2014 we employed a marketing team of five people, an in-house sales team of 120 people, and a field-based sales force of 14 people. Of the $34.6 million of our 2012 revenue derived from the United States, approximately 57% represented direct-to-patient rentals through Medicare or private insurance, 26% represented cash pay sales to patients and 17% represented sales to third-party home medical equipment providers.
Our Medicare and private insurance patients rent our systems, while a portion of our patients choose to pay cash for our Inogen One solutions. Our ability to rent to patients directly, bill third-party payors on their behalf, and service patients in their homes requires that we hold a valid Medicare supplier number, are accredited by an independent agency approved by Medicare, and comply with the unique licensure and process requirements in the 49 states in which we serve patients.
-107-
Table of Contents
We use a variety of direct-to-consumer marketing strategies to generate interest in our solutions among current oxygen therapy patients. After a patient contacts us, we guide them through product selection and insurance eligibility, and, if they choose to move forward, process the necessary reimbursement and physician paperwork on their behalf, as well as coordinate the shipping, instruction, and clinical setup process. In accordance with Medicare regulations we do not initially contact patients directly and contact them only upon an inbound inquiry. The below chart describes our United States direct-to-consumer sales process.
In addition to the direct-to-consumer sales model, we are increasingly utilizing a physician referral model as a complementary sales method. Under this model, our field sales representatives work with physicians in the representative’s territory to help physicians understand our products and the value these products provide for patients. We believe that by educating physicians on our products, we can cost-effectively supplement our direct-to-consumer sales and capture a greater number of patients earlier in the course of their oxygen therapy.
We engage in a number of other initiatives to increase awareness, demand, and orders for Inogen One systems. These include attendance at oxygen therapy support groups, guest speaking arrangements at trade shows, and product demonstrations as requested. Additionally, we are targeting private payors to become an in-network provider of oxygen therapy solutions, which we expect will reduce or eliminate any additional patient co-pay associated with using our solution. We believe this will result in both increased conversion of our initial leads, as well as direct referrals from insurance companies in some cases.
International
Approximately 27% of our sales were from outside the United States in 2012. We sell our products in 41 countries outside the United States through distributors or directly to large “house” accounts, which include gas companies and home oxygen providers. In this case, we sell to and bill the distributor or “house” accounts directly, leaving the patient billing, support, and clinical setup to the local provider. As of January 1, 2014, we had four people who focused on
-108-
Table of Contents
selling our products to distributors and “house” accounts. In fiscal year 2012, an international distributor accounted for 12% of our revenue, however this distributor accounts for less than 10% of our revenue as of September 30, 2013.
International sales have been a rapidly growing portion of our business, and we estimate there are 2 million long-term oxygen therapy patients outside of the United States. We believe that the international market is attractive for the following reasons:
| • | More favorable reimbursement in certain countries, including France and the United Kingdom, where portable oxygen concentrators receive more favorable reimbursement than in the United States. |
| • | Less developed oxygen delivery infrastructure in some countries. We believe that some countries outside the United States have less developed oxygen delivery infrastructure than in the United States. As a result, portable oxygen concentrators enable providers to reach and service patients they cannot economically reach with the delivery model. |
| • | An absence of reimbursement for any ambulatory oxygen therapy modalities in some countries, resulting in patients bearing all of the cost of ambulatory oxygen therapy and therefore becoming more involved in the selection of the modality. In Australia, for example, patients shoulder the burden of all costs associated with ambulatory oxygen therapy. In these cases, they tend to choose products like portable oxygen concentrators that provide a higher level of personal freedom. |
We will continue to focus on building out our international sales efforts.
Customer support and order fulfillment
Our procedures enable us to package and ship a system directly to the patient in the patient’s preferred configuration the same day the order is received. This enables us to minimize the amount of finished goods inventory we keep on hand. Our primary logistics partner is United Parcel Service, or UPS. UPS supports both our domestic and international shipments and provides additional services that support our direct-to-consumer oxygen therapy program. The UPS pick up service is used to retrieve patient paperwork, products requiring repair and systems that are no longer needed by the patient. Additionally, UPS, when necessary and requested by us, will go into a patient’s home to remove a replacement product from the box, box the failed device and return it to us. In this manner, we are able to operate as a remote provider while maintaining the level of customer service of a local oxygen therapy provider.
We believe it is crucial to provide patients with the highest quality customer support to achieve satisfaction with our products and optimal outcomes. As of January 1, 2014, we had a dedicated client service team of 22 people who were trained on our products, a clinical support team of 17 people who were licensed nurses or respiratory therapists, and a dedicated billing services team of 50 people. We provide our patients with a dedicated 24/7 hotline that is only given to our Inogen One patients and is not published publicly. Via the hotline, patients have direct access to our client services representatives, who can handle product-related questions. Additionally, clinical staff is on call 24/7 and available to patients whenever either the patient or the client services representative deems appropriate. Our dedicated billing services team is available to answer patient questions regarding invoicing, reimbursement, and account status during normal business hours. We receive no additional reimbursement for patient support, but provide
-109-
Table of Contents
high-quality customer service to enhance patient comfort, satisfaction, compliance, and safety with our products. We believe our focus on providing the highest level of customer service has helped drive our sustained patient satisfaction rating of approximately 95%.
Third-party reimbursement
Medicare or private insurance rentals represented approximately 40.9% of our revenue in 2012. In cases where we rent our oxygen therapy solutions directly to patients, we bill third-party payors, such as Medicare or private insurance, for monthly rentals on behalf of our patients. We process and coordinate all physician paperwork necessary for reimbursement of our solutions. A common medical criterion for oxygen therapy reimbursement is insufficient blood oxygen saturation level. Our team in sales and sales administration are trained on how to verify benefits, review medical records and process physician paperwork. Additionally, an independent internal review is performed and our products are not deployed until after physician paperwork is processed and reimbursement eligibility is verified and communicated to the patient. As of January 1, 2014, our sales and sales administration consisted of 134 people.
We are authorized by Medicare to bill for oxygen therapy, and we believe that more than 60% of oxygen therapy patients have Medicare coverage. Our Inogen One systems are reimbursed under HCPCS codes E1390 and E1392. E1390 covers stationary/nocturnal oxygen therapy systems, while E1392 provides additional reimbursement for portable oxygen concentrators for the treatment of ambulatory patients. Even though E1390 is a stationary oxygen code, we bill under both the E1390 and E1392 codes for our portable oxygen concentrators, assuming that the patient qualifies for portable oxygen, as well as stationary oxygen. Only in the event the patient solely qualifies for portable oxygen would we exclusively billed under the E1392 code, which is not typical. Currently, Medicare reimburses oxygen therapy as a monthly rental for up to 36 months. We retain equipment ownership at all times. After 36 months, payment is “capped,” meaning the monthly payment amounts are discontinued. After five years or another qualifying event, the patient is eligible for replacement equipment and a new capped rental period.
As of January 1, 2011, Medicare has phased in a program called competitive bidding. Competitive bidding impacts the amount Medicare pays suppliers for durable medical equipment, including portable oxygen concentrators. The program is defined geographically, with suppliers submitting bids to provide medical equipment for a specific product category within that geography. Once bids have been placed, an individual company’s bids across products within the category are aggregated and weighted by each product’s market share in the category. The weighted average price is then indexed against competitors. Medicare determines a “clearing price” out of these weighted average prices at which sufficient suppliers have indicated they will support patients in the category, and this threshold is typically designed to have theoretical supply two times greater than expected demand. Bids for each modality among the suppliers that made the cut are then arrayed to determine what Medicare will reimburse for each product category. The program has strict anti-collusion guidelines to ensure bidding is truly competitive. Competitive bidding contracts last three years once implemented, after which they are subject to re-bidding or competitive bidding re-compete.
The competitive bidding program effectively reduces the number of oxygen suppliers that can participate in the Medicare program. We believe that more than 75% of existing oxygen suppliers were eliminated in round one of competitive bidding implemented January 1, 2011 in 9 U.S. Metropolitan Statistical Areas. Round two of competitive bidding was implemented July 1,
-110-
Table of Contents
2013 in 91 U.S. Metropolitan Statistical Areas and we believe the impact on the number of oxygen suppliers will be similar when released. Combined with the round one of competitive bidding, we believe that approximately 59% of the market was covered by round one and two. The following table sets forth the current standard Medicare reimbursement rates and the weighted average of reimbursement rates applicable in Metropolitan Statistical Areas covered by rounds one and two of competitive bidding. The round one re-compete was completed in the same Metropolitan Statistical Areas as round one for the next three year period starting January 1, 2014 when the original contracts expire.
| Medicare effective 1/1/14 |
Round one 1/1/11- |
Round two 7/1/13- |
Round one 1/1/14- |
|||||||||||||
|
|
||||||||||||||||
| E1390 |
$ | 178.24 | $ | 116.16 | $ | 93.10 | $ | 95.74 | ||||||||
| E1392 |
51.63 | 41.89 | 42.69 | 38.08 | ||||||||||||
|
|
|
|||||||||||||||
| Total |
$ | 229.87 | $ | 158.05 | $ | 135.79 | $ | 133.82 | ||||||||
| % of standard |
69% | 59% | 58% | |||||||||||||
|
|
||||||||||||||||
As of September 30, 2013, we had contracts with 30 non-Medicare payors. These contracts enable us to become an in-network provider for these payors, which enables patients to use our systems at the same cost as other in-network solutions, including the delivery model. Based on our patient population, we believe non-Medicare payors represent at least 30% of all oxygen therapy patients. We believe that private payor reimbursement levels will generally be reset in accordance with Medicare reimbursement level determined by competitive bidding.
We cannot predict the extent to which reimbursement for our products will be affected by competitive bidding or by initiatives to reduce costs for private payors. The unavailability of third-party coverage or inadequacy of reimbursement for our current or future products would adversely affect our business, financial conditions, and results of operations.
Manufacturing
We have been developing and refining the manufacturing of our Inogen One systems over the past eight years. While nearly all of our manufacturing and assembly process was originally outsourced, assembly of the manifold, compressor, sieve bed and concentrator is now conducted in-house in order to improve quality control and reduce cost. Additionally, we use lean manufacturing practices to maximize our manufacturing efficiency. Bringing manufacturing and assembly largely in-house, combined with our consistent focus on driving efficient manufacturing processes, has enabled us to reduce our cost of revenue per system by 36% over the past four years.
We rely on third party manufacturers to supply several components of our Inogen One systems. We typically enter into supply agreements for these components that specify quantity, quality requirements, and delivery terms, which, in certain cases, can be terminated by either party upon relatively short notice. We have elected to source certain key components from single sources of supply, including our batteries, bearings, carry bags, motors, pistons, valves, and molded plastic components. While alternative sources of supply are readily available for these components, we believe that maintaining a single-source of supply allows us to control production costs and inventory levels, and to manage component quality. In order to mitigate against the risks related
-111-
Table of Contents
to a single-source of supply, we qualify alternative suppliers and develop contingency plans for responding to disruptions. If any single-source supplier were no longer able to supply a component, we believe we would be able to promptly and cost-effectively switch to an alternative supplier without a significant disruption to our business and operations. We have adopted additional contingency plans to protect against an immediate disruption in supply of our battery and motor components, and any potential delay that may result from a switch to a new supplier. These contingency plans include our own inventory management, along with a requirement that each supplier maintains specified quantities of inventory in multiple locations, and our maintenance of back-up tooling that can easily be transferred to the new supplier. We believe that these contingency plans would limit any disruption to our business in the event of an immediate termination of either our battery or motor supply.
We currently manufacture in two leased buildings in Goleta, California and Richardson, Texas, which we have registered with the FDA and for which have obtained ISO 13485 certification. The Goleta, California facility is approximately 39,000 square feet. The Richardson, Texas facility is approximately 31,000 square feet. Because we have two separate manufacturing facilities, in the event one facility is incapacitated, the other facility will enable us to continue manufacturing our products to meet our current level of demand. We believe we have sufficient capacity to meet anticipated demand.
Our entire organization is responsible for quality management. Our Quality Assurance department oversees this by tracking component, device and organization performance and by training team members outside the Quality Assurance department to become competent users of our Quality Management system. By measuring component performance, communicating daily with the production group and our suppliers, and reviewing customer complaints, our Quality Assurance department, through the use of our corrective action program, drives and documents continuous performance improvement of our suppliers and internal departments. Our Quality Assurance department also trains internal auditors to audit our adherence to the Quality Management system. Our Quality Management system has been certified to International Standards Organization, or ISO, 13485:2012 by Intertek, a Notified Body to ISO.
As a medical device manufacturer, our manufacturing facilities are subject to periodic inspection by the FDA and certain corresponding state agencies. We have been audited twice since April 2012 by the FDA and found to be in compliance with Good Manufacturing Practices guidelines. We have completed two surveillance audits by our notifying body over the same period and identified one minor non-conformance, which is currently being addressed through implementation of new training software. Additionally, we have had two unannounced inspections by state inspectors from California and Texas within the past year and were determined to be in complete compliance with state health and safety requirements.
As of January 1, 2014, we had approximately 77 employees in operations, manufacturing and quality assurance.
Research and development
We are committed to ongoing research and development to stay at the forefront of patient preference in the oxygen concentrator field. As of January 1, 2014, our research and development staff included 16 engineers and scientists with expertise in air separation, compressors, pneumatics, electronics, embedded software, mechanical design, sensors and manufacturing technologies. Our current research and development efforts are focused primarily on increasing functionality,
-112-
Table of Contents
improving design for ease-of-use, and reducing production costs of our Inogen One systems, as well as development of our next-generation oxygen concentrators. Over the last 3 fiscal years, Inogen has invested over $5 million to efficiently bring two new generations of portable oxygen concentrators to market, leveraging our 24 issued U.S. patents and one issued Canadian patent while also reducing the bill of product costs 36% from the original Inogen One G1.
Utilizing lean product development methodologies, we have released three generations of disruptive products over the last 10 years, including our Inogen One G1 in October 2004, our Inogen One G2 in March 2010, and our Inogen One G3 in September 2012. Our dedication to continuous improvement has also resulted in three mid-cycle product updates and numerous incremental improvements. Development projects utilize a combination of rapid prototyping and accelerated life testing methods to ensure products are taken from concept to commercialization in a fast and capital efficient manner. We leverage our direct patient expertise to rapidly gain insight from end users and to identify areas of innovation that lead to higher-quality products and lower total cost of ownership for its products.
Our product pipeline consists of both a stationary concentrator and a fourth generation, ultralightweight portable oxygen concentrators. The stationary concentrator, which we are calling Inogen At Home, will allow us to access non-ambulatory patients and will serve as a backup to our Inogen One patients. We currently provide a backup source of oxygen to our patients who are able to elect either a stationary concentrator or oxygen tank as their backup source. We are not able to bill or be reimbursed for these backup sources and we supply them at our own cost, which is not material. These backup sources are currently acquired from third parties; however, upon the launch of our Inogen At Home product, we will be manufacturing and supplying these stationary backup sources. The Inogen At Home 510(k) submission was received by the FDA’s Devices and Radiological Health Document Control Center on August 8, 2013 and is currently in process. We expect to commercialize Inogen At Home in 2014. Our fourth-generation portable oxygen concentrators will be smaller and lighter than our Inogen One G3 and we expect to commercialize this product in the next several years. Additionally, we continue to focus our efforts on other design and functionality improvements that enhance patient quality of life.
Competition
The oxygen therapy market is a highly competitive industry. We compete with a number of manufacturers and distributors of portable oxygen concentrators, as well as providers of other oxygen therapy solutions such as home delivery of oxygen tanks, or cylinders.
Our significant manufacturing competitors are Invacare Corporation, Respironics (a subsidiary of Koninklijke Philips N.V.), AirSep Corporation and SeQual Technologies (subsidiaries of Chart Industries, Inc.), Inova Labs, Inc. and DeVilbiss Healthcare. Given the relatively low barriers to entry in the oxygen therapy device manufacturing market, we expect that the industry will become increasingly competitive in the future. Manufacturing companies compete for sales to providers primarily on the basis of product features, service and price. We believe our manufacturing competitors’ complete reliance on home medical equipment distribution compresses their margins and limits their ability to invest in product features that address consumer preferences. To pursue a direct-to-consumer strategy, our manufacturing competitors would need to meet national accreditation and state-by-state licensing requirements and secure Medicare billing privileges, as well as compete directly with the home medical equipment
-113-
Table of Contents
providers that many rely on across their entire homecare businesses. For our two largest medical device competitors, their entire oxygen business, including stationary and homefill, represents less than 13% percent of their billion-dollar plus homecare businesses.
Lincare Inc., Apria Healthcare, Inc. Rotech Healthcare, Inc. and American HomePatient, Inc. have been among the market leaders in providing oxygen therapy for many years, while the remaining oxygen therapy market is serviced by local providers. Because many oxygen therapy providers were either excluded from contracts in the Medicare competitive bidding process, or will have difficulty providing service at the prevailing Medicate reimbursement rates, we expect more industry consolidation. Oxygen therapy providers compete primarily on the basis of product features and service, rather than price, since reimbursement levels are established by Medicare and Medicaid, or by the individual determinations of private payors. We believe that the investment made by oxygen therapy providers in the physical distribution required for oxygen delivery limits their ability to easily switch their business model and employ a solution directly competitive to Inogen.
Some of our competitors are large, well-capitalized companies with greater resources than we have. As a consequence, they are able to spend more aggressively on product development, marketing, sales and other product initiatives than we can. Some of these competitors have:
| • | significantly greater name recognition; |
| • | established relations with healthcare professionals, customers and third-party payors; |
| • | established distribution networks; |
| • | additional lines of products, and the ability to offer rebates or bundle products to offer higher discounts or other incentives to gain a competitive advantage; |
| • | greater history in conducting research and development, manufacturing, marketing and obtaining regulatory approval for oxygen device products; and |
| • | greater financial and human resources for product development, sales and marketing, patent litigation and customer financing. |
As a result, our competitors may be able to respond more quickly and effectively than we can to new or changing opportunities, technologies, standards or customer requirements. In light of these advantages that our competitors maintain, even if our technology and direct-to-consumer distribution strategy is more effective than the technology and distribution strategy of our competitors, current or potential customers might accept competitor products and services in lieu of purchasing our products. We anticipate that we will face increased competition in the future as existing companies and competitors develop new or improved products and distribution strategies and as new companies enter the market with new technologies and distribution strategies. We may not be able to compete effectively against these organizations. Our ability to compete successfully and to increase our market share is dependent upon our reputation for providing responsive, professional and high-quality products and services and achieving strong customer satisfaction. Increased competition in the future could adversely affect our revenue, revenue growth rate, if any, margins and market share.
Government regulation
Inogen One systems are medical devices subject to extensive and ongoing regulation by the FDA, as well as other federal and state regulatory bodies in the United States and comparable
-114-
Table of Contents
authorities in other countries. The FDA regulations govern the following activities that we perform, or that are performed on our behalf, to ensure that medical products distributed domestically or exported internationally are safe and effective for their intended uses: product design and development, pre-clinical and clinical testing, manufacturing, labeling, storage, pre-market clearance or approval, record keeping, product marketing, advertising and promotion, sales and distribution, and post-marketing surveillance.
FDA’s pre-market clearance and approval requirements
Unless an exemption applies, each medical device we seek to commercially distribute in the United States will require either a prior 510(k) clearance or a pre-market approval from the FDA. Medical devices are classified into one of three classes—Class I, Class II or Class III—depending on the degree of risk associated with each medical device and the extent of control needed to ensure safety and effectiveness. Devices deemed to pose lower risks are placed in either Class I or II, which requires the manufacturer to submit to the FDA a premarket notification requesting permission to commercially distribute the device. This process is generally known as 510(k) clearance. Some low risk devices are exempted from this requirement. Devices deemed by the FDA to pose the greatest risk, such as life-sustaining, life-supporting or implantable devices, or devices deemed not substantially equivalent to a previously cleared 510(k) device, are placed in Class III, requiring premarket approval.
510(k) clearance pathway
When a 510(k) clearance is required, we must submit a premarket notification to the FDA demonstrating that our proposed device is substantially equivalent to a previously cleared and legally marketed 510(k) device or a device that was in commercial distribution before May 28, 1976 for which the FDA has not yet called for the submission of a pre-market approval application. By regulation, the FDA is required to clear or deny a 510(k) premarket notification within 90 days of submission of the application. As a practical matter, clearance often takes significantly longer. The FDA may require further information, including clinical data, to make a determination regarding substantial equivalence. If the FDA determines that the device, or its intended use, is not substantially equivalent to a previously-cleared device or use, the FDA will place the device, or the particular use, into Class III. We obtained 510(k) clearance for the original Inogen One system on May 13, 2004. We market the Inogen One G2 and G3 systems pursuant to the original Inogen One 510(k) clearance.
Pre-market approval pathway
A pre-market approval application must be submitted to the FDA if the device cannot be cleared through the 510(k) process. The pre-market approval application process is much more demanding than the 510(k) premarket notification process. A pre-market approval application must be supported by extensive data, including but not limited to technical, preclinical, clinical trials, manufacturing and labeling to demonstrate to the FDA’s satisfaction reasonable evidence of safety and effectiveness of the device.
After a pre-market approval application is submitted and the FDA determines that the application is sufficiently complete to permit a substantive review, the FDA will accept the application for review. The FDA has 180 days to review an “accepted” pre-market approval application, although the review of an application generally occurs over a significantly longer
-115-
Table of Contents
period of time and can take up to several years. During this review period, the FDA may request additional information or clarification of the information already provided. Also, an advisory panel of experts from outside the FDA may be convened to review and evaluate the application and provide recommendations to the FDA as to the approvability of the device. In addition, the FDA will conduct a preapproval inspection of the manufacturing facility to ensure compliance with quality system regulations.
Clinical trials
Clinical trials are almost always required to support pre-market approval and are sometimes required for 510(k) clearance. In the United States, these trials generally require submission of an application for an Investigational Device Exemption, or IDE, to the FDA. The IDE application must be supported by appropriate data, such as animal and laboratory testing results, showing it is safe to test the device in humans and that the testing protocol is scientifically sound. The IDE must be approved in advance by the FDA for a specific number of patients unless the product is deemed a non-significant risk device eligible for more abbreviated IDE requirements. Clinical trials for significant risk devices may not begin until the IDE application is approved by the FDA and the appropriate institutional review boards, or IRBs, at the clinical trial sites. We, the FDA or the IRB at each site at which a clinical trial is being performed may suspend a clinical trial at any time for various reasons, including a belief that the risks to study subjects outweigh the benefits. Even if a trial is completed, the results of clinical testing may not demonstrate the safety and efficacy of the device, may be equivocal or may otherwise not be sufficient to obtain approval or clearance of the product.
Pervasive and ongoing regulation by the FDA
Even after a device receives clearance or approval and is placed on the market, numerous regulatory requirements apply. These include:
| • | establishment registration and device listing; |
| • | quality system regulation, which requires manufacturers, including third-party manufacturers, to follow stringent design, testing, control, documentation and other quality assurance procedures during all aspects of the manufacturing process; |
| • | labeling regulations and the FDA prohibitions against the promotion of products for un-cleared, unapproved or “off-label” uses, and other requirements related to promotional activities; |
| • | medical device reporting regulations, which require that manufacturers report to the FDA if their device may have caused or contributed to a death or serious injury or malfunctioned in a way that would likely cause or contribute to a death or serious injury if the malfunction were to recur; |
| • | corrections and removals reporting regulations, which require that manufacturers report to the FDA field corrections and product recalls or removals if undertaken to reduce a risk to health posed by the device or to remedy a violation of the Federal Food, Drug and Cosmetic Act that may present a risk to health; and |
| • | post-market surveillance regulations, which apply when necessary to protect the public health or to provide additional safety and effectiveness data for the device. |
After a device receives 510(k) clearance or a pre-market approval, any modification that could significantly affect its safety or effectiveness, or that would constitute a major change in its
-116-
Table of Contents
intended use, will require a new clearance or approval. The FDA requires each manufacturer to make this determination initially, but the FDA can review any such decision and can disagree with a manufacturer’s determination. We have modified various aspects of our Inogen One systems since receiving regulatory clearance, but we believe that new 510(k) clearances are not required for these modifications. If the FDA disagrees with our determination not to seek a new 510(k) clearance, the FDA may retroactively require us to seek 510(k) clearance or pre-market approval. The FDA could also require us to cease marketing and distribution and/or recall the modified device until 510(k) clearance or pre-market approval is obtained. Also, in these circumstances, we may be subject to significant regulatory fines and penalties.
Failure to comply with applicable regulatory requirements can result in enforcement action by the FDA, which may include any of the following sanctions: Warning Letters, fines, injunctions, civil or criminal penalties, recall or seizure of our products, operating restrictions, partial suspension or total shutdown of production, refusing our request for 510(k) clearance or pre-market approval of new products, rescinding previously granted 510(k) clearances or withdrawing previously granted pre-market approvals.
We are subject to announced and unannounced inspections by the FDA, and these inspections may include the manufacturing facilities of our subcontractors. Inogen has been audited twice since April 2012 by the FDA and found to be in compliance with the Quality System Regulation. We cannot assure you that we can maintain a comparable level of regulatory compliance in the future at our facility.
International sales of medical devices are subject to foreign government regulations, which may vary substantially from country to country. The time required to obtain approval by a foreign country may be longer or shorter than that required for FDA approval, and the requirements may differ. There is a trend towards harmonization of quality system standards among the European Union, United States, Canada and various other industrialized countries.
Licensure
In April 2009, we became a Durable, Medical Equipment, Prosthetics, Orthotics, and Supplies accredited Medicare supplier by Accreditation Commission for Health Care for our Goleta, California facility for Home/Durable Medical Equipment Services for oxygen equipment and supplies. Our Medicare accreditation must be renewed every three years through passage of an on-site inspection. Our current accreditation with Medicare is due to expire in May 2015. Several states require that durable medical equipment providers be licensed in order to sell products to patients in that state. Certain of these states require that durable medical equipment providers maintain an in-state location. Most of our state licenses are renewed on an annual or bi-annual basis. Although we believe we are in compliance with all applicable state regulations regarding licensure requirements, if we were found to be noncompliant, we could lose our licensure in that state, which could prohibit us from selling our current or future products to patients in that state. In addition, we are subject to certain state laws regarding professional licensure. We believe that our certified clinicians are in compliance with all such state laws. If our clinicians were to be found non-compliant in a given state, we would need to modify our approach to providing education, clinical support and customer service in such state.
-117-
Table of Contents
Federal anti-kickback and self-referral laws
The Federal Anti-Kickback Statute prohibits the knowing and willful offer, payment, solicitation or receipt of any form of remuneration in return for, or to induce the:
| • | referral of a person; |
| • | furnishing or arranging for the furnishing of items or services reimbursable under Medicare, Medicaid or other governmental programs; or |
| • | purchase, lease, or order of, or the arrangement or recommendation of the purchasing, leasing, or ordering of any item or service reimbursable under Medicare, Medicaid or other governmental programs. |
The Federal Anti-Kickback Statute applies to our arrangements with sales representatives, customers and health care providers, as well as certain coding and billing information that we may provide to purchasers of Inogen One systems. Although we believe that we have structured such arrangements to be in compliance with the Anti-Kickback Statute and other applicable laws, regulatory authorities may determine otherwise. Noncompliance with the federal anti-kickback statute can result in exclusion from Medicare, Medicaid or other governmental programs, restrictions on our ability to operate in certain jurisdictions, as well as civil and criminal penalties, any of which could have an adverse effect on our business and results of operations.
Federal law also includes a provision commonly known as the “Stark Law,” which prohibits a physician from referring Medicare or Medicaid patients to an entity providing “designated health services,” including a company that furnishes durable medical equipment, in which the physician has an ownership or investment interest or with which the physician has entered into a compensation arrangement. Violation of the Stark Law could result in denial of payment, disgorgement of reimbursements received under a noncompliant arrangement, civil penalties, and exclusion from Medicare, Medicaid or other governmental programs. Although we believe that we have structured our provider arrangements to comply with current Stark Law requirements, these arrangements may not expressly meet the requirements for applicable exceptions from the law.
Additionally, as some of these laws are still evolving, we lack definitive guidance as to the application of certain key aspects of these laws as they relate to our arrangements with providers with respect to patient training. We cannot predict the final form that these regulations will take or the effect that the final regulations will have on us. As a result, our provider arrangements may ultimately be found to be not in compliance with applicable federal law.
Federal false claims act
The Federal False Claims Act provides, in part, that the federal government may bring a lawsuit against any person whom it believes has knowingly presented, or caused to be presented, a false or fraudulent request for payment from the federal government, or who has made a false statement or used a false record to get a claim approved. In addition, amendments in 1986 to the Federal False Claims Act have made it easier for private parties to bring “qui tam” whistleblower lawsuits against companies. Although we believe that we are in compliance with the federal government’s laws and regulations, if we are found in violation of these laws, penalties include fines ranging from $5,500 to $11,000 for each false claim, plus three times the amount of
-118-
Table of Contents
damages that the federal government sustained because of the act of that person. We believe that we are in compliance with the federal government’s laws and regulations concerning the filing of reimbursement claims.
Civil monetary penalties law
The Federal Civil Monetary Penalties Law prohibits the offering or transferring of remuneration to a Medicare or Medicaid beneficiary that the person knows or should know is likely to influence the beneficiary’s selection of a particular supplier of Medicare or Medicaid payable items or services. We sometimes offer customers various discounts and other financial incentives in connection with the sales of our products. While it is our intent to comply with all applicable laws, the government may find that our marketing activities violate the Civil Monetary Penalties Law. If we are found to be in noncompliance, we could be subject to civil money penalties of up to $10,000 for each wrongful act, assessment of three times the amount claimed for each item or service and exclusion from the Federal healthcare programs. In addition, to the extent we are found to not be in compliance, we may be required to curtail or restructure our operations. Any penalties, damages, fines, exclusions, curtailment or restructuring of our operations could adversely affect our ability to operate our business and our financial results.
State fraud and abuse provisions
Many states have also adopted some form of anti-kickback and anti-referral laws and false claims act that may apply to all payors. We believe that we are in compliance with such laws. Nevertheless, a determination of liability under such laws could result in fines and penalties and restrictions on our ability to operate in these jurisdictions.
HIPAA
In addition to creating the two new federal healthcare crimes, regulations implementing HIPAA also establish uniform standards governing the conduct of certain electronic healthcare transactions and protecting the security and privacy of individually identifiable health information maintained or transmitted by healthcare providers, health plans and healthcare clearinghouses, which are referred to as covered entities. Three standards have been promulgated under HIPAA’s regulations: the Standards for Privacy of Individually Identifiable Health Information, which restrict the use and disclosure of certain individually identifiable health information, the Standards for Electronic Transactions, which establish standards for common healthcare transactions, such as claims information, plan eligibility, payment information and the use of electronic signatures, and the Security Standards, which require covered entities to implement and maintain certain security measures to safeguard certain electronic health information, including the adoption of administrative, physical and technical safeguards to protect such information.
In 2009, Congress passed the American Recovery and Reinvestment Act of 2009, or ARRA, which included sweeping changes to HIPAA, including an expansion of HIPAA’s privacy and security standards. ARRA includes HITECH, which, among other things, made HIPAA’s privacy and security standards directly applicable to business associates of covered entities effective February 17, 2010. A business associate is a person or entity that performs certain functions or activities on behalf of a covered entity that involve the use or disclosure of protected health information in
-119-
Table of Contents
connection with recognized health care operations activities. As a result, business associates are now subject to significant civil and criminal penalties for failure to comply with applicable standards. Moreover, HITECH creates a new requirement to report certain breaches of unsecured, individually identifiable health information and imposes penalties on entities that fail to do so. HITECH also increased the civil and criminal penalties that may be imposed against covered entities, business associates and possibly other persons and gave state attorneys general new authority to file civil actions for damages or injunctions in federal courts to enforce the federal HIPAA laws and seek attorney fees and costs associated with pursuing federal civil actions. The 2013 final HITECH omnibus rule modifies the breach reporting standard in a manner that will likely make more data security incidents qualify as reportable breaches.
In addition to federal regulations issued under HIPAA, some states have enacted privacy and security statutes or regulations that, in some cases, are more stringent than those issued under HIPAA. In those cases, it may be necessary to modify our planned operations and procedures to comply with the more stringent state laws. If we fail to comply with applicable state laws and regulations, we could be subject to additional sanctions. Any liability from failure to comply with the requirements of HIPAA, HITECH or state privacy and security statutes or regulations could adversely affect our financial condition. The costs of complying with privacy and security related legal and regulatory requirements are burdensome and could have a material adverse effect on our results or operations.
International regulation
International sales of medical devices are subject to foreign governmental regulations, which vary substantially from country to country. The time required to obtain clearance or approval by a foreign country may be longer or shorter than that required for FDA clearance or approval, and the requirements may be different.
The primary regulatory environment in Europe is that of the European Union, which has adopted numerous directives and has promulgated voluntary standards regulating the design, manufacture, clinical trials, labeling and adverse event reporting for medical devices. Devices that comply with the requirements of a relevant directive will be entitled to bear the CE conformity marking, indicating that the device conforms with the essential requirements of the applicable directives and, accordingly, can be commercially distributed throughout the member states of the European Union, and other countries that comply with or mirror these directives. The method of assessing conformity varies depending on the type and class of the product, but normally involves a combination of self-assessment by the manufacturer and a third-party assessment by a notified body, an independent and neutral institution appointed by a country to conduct the conformity assessment. This third-party assessment may consist of an audit of the manufacturer’s quality system and specific testing of the manufacturer’s device. Such an assessment may be required in order for a manufacturer to commercially distribute the product throughout these countries. ISO 9001 and ISO 13845 certifications are voluntary standards. Compliance establishes the presumption of conformity with the essential requirements for a CE Marking. We have the authorization to affix the CE Mark to our products and to commercialize our devices in the European Union. Our ISO 13485 certification was issued on April 21, 2005 and our EC-Certificate was issued on March 16, 2007.
Before we can sell our devices in Canada we must submit and obtain clearance of a license application, implement and comply with ISO Standard 13485, and undergo an audit by a registrar
-120-
Table of Contents
accredited by Health Canada. On January 25, 2006, we received our Medical Device License in Canada. In Australia, we must appoint an agent sponsor who will interact on our behalf with the Therapeutics Goods Administration (TGA). We must also prepare a technical file and declaration of conformity to essential requirements under Australian law, provide evidence of CE Marking of the device and submit this information via our agent sponsor to the TGA in a Medical Device Application. On June 4, 2007, we received our Certificate for Inclusion of a Medical Device in Australia.
Intellectual property
We believe that to maintain a competitive advantage, we must develop and preserve the proprietary aspect of our technologies. We rely on a combination of patent, trademark, trade secret and other intellectual property laws, non-disclosure agreements and other measures to protect our proprietary rights. Currently, we require our employees, consultants and advisors to execute non-disclosure agreements in connection with their employment, consulting or advisory relationships with us, where appropriate. We also require our employees, consultants and advisors who we expect to work on our current or future products to agree to disclose and assign to us all inventions conceived during the work day, developed using our property or that relate to our business. Despite any measures taken to protect our intellectual property, unauthorized parties may attempt to copy aspects of our Inogen One systems or to obtain and use information that we regard as proprietary.
Patents
As of January 1, 2014, we had 24 issued U.S. patents, one issued Canadian patent and six additional pending U.S. patent applications. We anticipate it will take several years for the most recent of these U.S. patent applications to result in issued patents, if at all.
Our patent portfolio contains three principal sets of patents and patent applications. The first set relates to the construction and design of specific Inogen products. For example, U.S. Patent Nos. 8,440,004; 8,366,815; 8,377,181; and 8,568,519 are directed to design elements of the Inogen One G2 portable oxygen concentrator. These patents expire in 2031 (without taking into account any patent term adjustments) and may serve to deter competitors from reverse engineering or copying our design elements. This set of patents and patent applications also contains a pending U.S. patent application that relates to the design of the Inogen One G3 portable oxygen concentrator.
The second set of patents and patent applications within our portfolio pertains to operating algorithms and design optimization techniques. U.S. Patent Nos. 7,841,343; 7,585,351; 7,857,894; 8,142,544; and 6,605,136 are directed to optimization of the Pressure Swing Adsorption oxygen generating system and the oxygen conserving technology used across all of our products. These patents expire in 2027, 2026, 2027, 2026 and 2022 respectively (without taking into account any patent term adjustments). These algorithms and optimization techniques are developed to facilitate the design and manufacturing of our products. These patents may prevent competitors from achieving the same levels of optimization as found in our products.
The third set of patents and patent applications includes system component designs that may be incorporated into our products. For example, U.S. Patent No. 8,580,015, which expires in 2027 (without taking into account any patent term adjustments), is directed to product improvements that have been utilized in the Inogen One and Inogen One G2 products. Also within this class of
-121-
Table of Contents
patents are U.S. Patent Nos. 7,686,870 and 7,922,789 that are directed to designs that may be utilized in future Inogen products to improve performance over current product offerings. These patents expire in 2027 and 2023 respectively (without taking into account any patent term adjustments).
Trademarks
We have registered the trademarks Inogen; Inogen One; Inogen One G2; Oxygenation; Live Life in Moments, not Minutes; Never Run Out of Oxygen; Oxygen Therapy on Your Terms; Oxygen.Anytime.Anywhere; Reclaim Your Independence; Intelligent Delivery Technology; and the Inogen design with the United States Patent and Trademark Office on the Principal Register. We have applied with the United States Patent and Trademark Office to register the trademark Inogen at Home.
Legal proceedings
On November 4, 2011, we filed a lawsuit in the United States District Court for the Central District of California against Inova Labs Inc., or Defendant, for infringement of two of our patents. The case, Inogen Inc. v. Inova Labs Inc., Case No. 8:11-cv-01692-JST-AN, or the Lawsuit, involves U.S. Patent Nos. 7,841,343, entitled “Systems and Methods For Delivering Therapeutic Gas to Patients”, or the ’343 patent, and 6,605,136 entitled “Pressure Swing Adsorption Process Operation And Optimization”, or the ’136 patent. We alleged in the Lawsuit that certain of Defendant’s oxygen concentrators infringe various claims of the ’343 and ’136 patents. The Lawsuit seeks damages, injunctive relief, costs and attorneys’ fees.
The Defendant has answered the complaint, denying infringement and asserting various sets of defenses including non-infringement, invalidity and unenforceability, patent misuse, unclean hands, laches and estoppel. The Defendant also filed counterclaims against us alleging patent invalidity, non-infringement and inequitable conduct. We denied the allegations in the Defendant’s counterclaims. We have filed a motion to dismiss Defendant’s inequitable conduct counterclaim.
The Defendant filed a request with the U.S. Patent and Trademark Office seeking an inter partes reexamination of the ’343 and ’136 patents. The Defendant also filed a motion to stay the Lawsuit pending outcome of the reexamination. On March 20, 2012, the Court granted the Defendant’s motion to stay the Lawsuit pending outcome of the reexamination and also granted our motion to dismiss the Defendant’s inequitable conduct counterclaim.
Facilities and property
We lease approximately 39,000 square feet of manufacturing and office space at our corporate headquarters in Goleta, California under a lease that expires in September 2015, and approximately 31,000 square feet of manufacturing and office space in Richardson, Texas under a lease that expires in December 2019. In addition, we lease office space in Smyrna, Tennessee, and Corinth, Mississippi under leases expiring in August 2014 and May 2014, respectively. We believe that our existing facilities are adequate to meet our business requirements for the near-term and that additional space will be available on commercially reasonable terms, if required.
-122-
Table of Contents
Employees
As of January 1, 2014, we had 354 full and part-time employees, including 178 in sales, marketing, clinical and client services, 77 in operations,manufacturing and quality assurance, 83 in general administration and 16 in research and development. None of our employees is represented by a collective bargaining agreement. We believe that our employee relations are good.
Corporate and available information
We were incorporated in Delaware in November 2001. Our principal executive offices are located at 326 Bollay Drive, Goleta, California 93117. Our telephone number is (805) 562-0500. Our website address is www.inogen.com. Information contained on our website is not incorporated by reference into this prospectus, and should not be considered to be part of this prospectus.
Environmental matters
Our research and development and manufacturing processes involve the controlled use of hazardous materials, including flammables, toxics, and corrosives. Our research and manufacturing operations produce hazardous chemical waste products. We seek to comply with applicable laws regarding the handling and disposal of such materials. Given the small volume of such materials used or generated at our facilities, we do not expect our compliance efforts to have a material effect on our capital expenditures, earnings, and competitive position. However, we cannot eliminate the risk of accidental contamination or discharge and any resultant injury from these materials. We do not currently maintain separate environmental liability coverage and any such contamination or discharge could result in significant cost to us in penalties, damages, and suspension of our operations.
Backlog
We have no material backlog of orders.
Geographic information
During the last two years, all of our long-lived assets were located within the United States. Approximately 27% of our 2012 revenue and 26% of our 2011 revenue came from international markets. Please see Note 2 to each of our audited and unaudited financial statements included elsewhere in the prospectus for additional information related to our U.S. and non-U.S. revenue.
Seasonality
We believe our sales may be impacted by seasonal factors. For example, we typically experience higher sales in the second quarter, as a result of consumers traveling and vacationing during the summer months.
-123-
Table of Contents
Executive officers and directors
Our executive officers and directors, and their ages and positions as of January 1, 2014 are as set forth below:
| Name | Age | Position | ||
|
| ||||
| Raymond Huggenberger |
54 | President, Chief Executive Officer and Director | ||
| Scott Wilkinson |
48 | Executive Vice President, Sales and Marketing | ||
| Alison Bauerlein |
32 | Vice President, Finance and Chief Financial Officer, Secretary and Treasurer | ||
| Matt Scribner |
46 | Vice President, Operations | ||
| Brenton Taylor |
32 | Vice President, Engineering | ||
| Byron Myers |
34 | Vice President, Marketing | ||
| Heath Lukatch, Ph.D.(2) |
46 | Chairman of the Board | ||
| Stephen E. Cooper |
67 | Director | ||
| William J. Link, Ph.D. |
67 | Director | ||
| Charles E. Larsen(1) |
62 | Director | ||
| Timothy Petersen(1)(2) |
49 | Director | ||
| Benjamin Anderson-Ray(2) |
59 | Director | ||
| Loren McFarland(1) |
55 | Director | ||
|
| ||||
| (1) | Member of our audit committee. |
| (2) | Member of our compensation, nominating and governance committee. |
Executive officers
Raymond Huggenberger has served as our President, Chief Executive Officer and as a member of the board of directors of Inogen since 2008. Prior to joining our company, Mr. Huggenberger held various management positions with Sunrise Medical Inc., a global manufacturer and distributor of durable medical equipment, including: President of Marketing for Sunrise’s German subsidiary from 1994 to 1996, President of Sunrise’s German division from 1998 until 2000, President of the European Operating Group from 2000 to 2002, President and Chief Operating Officer from 2002 until 2004, and President of European Operations 2006 to 2007. Mr. Huggenberger also held various management positions with McDermott and Bull Inc., an executive search firm, from 2005 to 2006 and in the healthcare division of TA Triumph Adler AG, a document process management firm, from 1996 to 1998. Mr. Huggenberger currently serves on the board of directors of Wellfount Corporation, a pharmacy services company, and previously served on the board of IYIA Technologies, a healthcare company. Mr. Huggenberger graduated from AKAD University in Rendsburg, Germany in Economics and completed the Advanced Marketing Strategies Program at INSEAD, Fontainebleau, France. The board of directors believes that he is qualified to serve as a director of Inogen because of his deep understanding of our business, operations and strategy.
-124-
Table of Contents
Scott Wilkinson has served as our Executive Vice President, Sales and Marketing since 2008. Previously, he served as our Director of Product Management from 2005 to 2006 and Vice President, Product Management from 2006 to 2008. From 2000 to 2005, Mr. Wilkinson worked for Invacare Corporation, a designer and manufacturer of oxygen products, as a Group Product Manager and helped launch their $100 million O2 product line segment. From 1999 to 2000, Mr. Wilkinson served as a Product Line Director with Johnson & Johnson, a healthcare company. From 1988 to 1999, Mr. Wilkinson worked as a Research Scientist, Product Manager, and Project Leader at Kimberly Clark, a consumer products company. Mr. Wilkinson received a Bachelor’s degree in Chemical Engineering from the University of Akron and an MBA from University of Wisconsin, Oshkosh.
Alison Bauerlein is a co-founder of Inogen and has served as our Chief Financial Officer since 2009 and Vice President, Finance since 2008. Prior to serving in these positions, Ms. Bauerlein also served as Controller with our company from 2001 to 2004 and 2008 to 2009, and Director of Financial Planning and Analysis from 2004 to 2008. Ms. Bauerlein has also served as Corporate Secretary and Corporate Treasurer since 2002. During her time with our company, Ms. Bauerlein has helped the company raise approximately $91 million in venture capital funding. Ms. Bauerlein currently serves on the board of directors of Active Life Scientific, Inc. Ms. Bauerlein received a Bachelor of Arts degree in Economics/Mathematics with high honors from the University of California, Santa Barbara.
Matthew Scribner has served as our Vice President, Operations since 2008. Previously, he served as our Director of Supply Chain from 2004 to 2007 and Director of Manufacturing from 2007 to 2008. From 1998 to 2004, Mr. Scribner worked for Computer Motion, a manufacturer of surgical robots that was acquired by Intuitive Surgical, in various executive capacities, including as a Manufacturing Manager and as a Project Manager. From 1989 to 2013, Mr. Scribner also served in the United States Navy as a helicopter pilot, on both active duty and as a reservist. He was mobilized and deployed to Iraq in 2003 to fly in support of Operation Iraqi Freedom. He achieved the rank of Commander and retired from the U.S. Navy in July 2013. Mr. Scribner received a Bachelor of Science degree in Ocean Engineering from the United States Naval Academy. Mr. Scribner also received an MBA from the University of San Diego.
Brenton Taylor is a co-founder of Inogen and has served as our Vice President, Engineering since 2008. Prior to serving in this position, Mr. Taylor served as Director of Technology with our company from 2003 to 2008. Mr. Taylor is listed as an inventor on 20 of the company’s U.S. patents related to portable oxygen concentrator development. Mr. Taylor received a Bachelor of Science degree in Microbiology from the University of California, Santa Barbara.
Byron Myers is a co-founder of Inogen and has served as our Vice President, Marketing since 2011. Prior to serving in this position, Mr. Myers held various roles with our company, including: Product Manager from 2002 to 2006, Director of Marketing from 2006 to 2007 and 2008 to 2011, International Product Manager during 2007, and Director of International Product Management from 2007 to 2008. Mr. Myers received a Bachelor’s degree in Economics/Mathematics from the University of California, Santa Barbara and an MBA from University of California, San Diego.
Board of directors
Heath Lukatch, Ph.D. has served as chairman of our board of directors since 2008, and as a director since 2006. Dr. Lukatch is employed as a Partner at Novo Ventures (US) Inc., which
-125-
Table of Contents
provides certain consultancy services to Novo A/S. Dr. Lukatch joined Novo Ventures (US) Inc. in 2006. Prior to joining Novo Ventures (US) Inc., Dr. Lukatch was a Managing Director responsible for biotechnology venture investments at Piper Jaffray Ventures and SightLine Partners, a private equity firm and spin off of Piper Jaffray Ventures, from 2001 to 2006. Prior to joining Piper Jaffray Ventures, Dr. Lukatch worked as a strategy consultant with McKinsey & Company, a consulting firm, from 1997 to 2000. Dr. Lukatch also served as co-founder and chief executive officer of AutoMate Scientific, a biotechnology instrumentation company from 1991 to 1997, and held scientific positions with Chiron Corporation, a biotechnology company, from 1990 to 1991, Roche Bioscience, a healthcare company, from 1996 to 1997, and Cetus Corporation, a biotechnology company, in 1987. He currently serves on the boards of directors of AnaptysBio, Inc., Cianna Medical, Inc., Flexion Therapeutics, Inc., FLAPCo LLC, and Panmira Pharmaceuticals LLC. Dr. Lukatch previously served on the boards of directors of Amira Pharmaceuticals, Elevation Pharmaceuticals, Inc., FoldRx Pharmaceuticals, Inc., InSound Medical, Inc., NeuroTherapeutics Pharma, Inc., Synosia Therapeutics, Inc., and Verax Biomedical, Inc. Dr. Lukatch received his Ph.D. in Neuroscience from Stanford University where he was a DOD USAF Fellow, and his B.A. in Biochemistry from the University of California at Berkeley. The board of directors believes that he is qualified to serve as a director of Inogen because of his extensive industry experience and experience as a venture capital investor and a board member for several venture-backed healthcare companies.
Stephen Cooper has served as a member of the board of directors of Inogen since 2002 and previously served as chairman of the board of directors. Since 2012, Mr. Cooper has served as chief executive officer and co-founder of Solution Deposition Systems, Inc. and has owned High Tech CEO Advisor, a consulting firm, since 2010. From 2003 to 2010, Mr. Cooper was Chairman, chief executive officer and co-founder of Skyler Technology, Inc., a software company. From 1993 to 2000, Mr. Cooper worked for Etec Systems, a technology company, as its chairman, president and chief executive officer, which was sold to Applied Materials, an electronics company, in March of 2000. From 1987 to 1990, Mr. Cooper served as president and chief executive officer of Bipolar Integrated Technology, a manufacturer of bipolar semiconductors. From 1980 to 1987, Mr. Cooper held various positions, including president and chief operating officer, with Silicon Systems, Inc., a manufacturer of analog/digital semiconductors. From 1973 to 1980, Mr. Cooper worked for Intel, a semiconductor company, in various engineering and management positions, including as an engineering manager and wafer fabrication manager. He currently serves on the board of directors of Aurrion, Inc., Solution Deposition Systems, Inc., Built on Logic, Inc., and AgentBridge, LLC. Previously, Mr. Cooper served on the boards of directors of Active Scientific, Inc., and Skyler Technology, Inc. Mr. Cooper holds a BS in Electrical Engineering from the University of California, Santa Barbara, where he is a Trustee and former Chair of the Foundation, a member of the Dean’s Cabinet of the College of Engineering, and a member of the Steering Committee for the Technology Management Program. The board of directors believes that he is qualified to serve as a director of Inogen because of his extensive industry and leadership experience with technology and medical device companies.
William J. Link, Ph.D. has served as a member of the board of directors of Inogen since 2003. Since 1999, Dr. Link has served as a managing director and co-founder of Versant Ventures, a venture capital firm investing in early-stage healthcare companies. Dr. Link has also served as a general partner at Brentwood Venture Capital, a venture capital firm, since 1998. From 1986 to 1997, Dr. Link was founder, chairman and chief executive officer of Chiron Vision, a healthcare company, which was later sold to Bausch & Lomb, Inc., a health products company. He also
-126-
Table of Contents
founded and served as president of American Medical Optics, Inc., a medical supply company, which was acquired by Allergan, Inc., a pharmaceutical company. Before entering the healthcare industry, Dr. Link was an assistant professor in the Department of Surgery at the Indiana University School of Medicine from 1973 to 1976. Dr. Link currently serves on the board of directors of Edwards Lifesciences Inc. (NYSE: EW), Glaukos, Inc., Neurotech Pharmaceuticals, Inc., Oculeve, Inc., Nexis Vision, Inc., ForSight VISION 4, Inc., ForSight VISION 5, Inc., Alpheon, Inc., and Second Sight Medical Products, Inc. Previously, Dr. Link served on the boards of Cameron Health, Inc., LenSx, Inc., NeoVista, Inc., and ROX, Inc. Dr. Link earned his Bachelor’s, Master’s, and Doctorate degrees in Mechanical Engineering from Purdue University. The board of directors believes that he is qualified to serve as a director of Inogen because of his extensive industry and leadership experience along with his experience as a venture capital investor.
Charles E. Larsen has served as a member of the board of directors of Inogen since 2006. Mr. Larsen is a co-founder of Accuitive Medical Ventures, a venture capital firm, where he has served as a managing director since 2003. Mr. Larsen also serves as vice chairman of The Innovation Factory, a medical device venture that he co-founded in 1999. Mr. Larsen was co-founder of Novoste Corporation, a medical technology company, in 1992 and held various management positions with the company, including chief operating officer from 1992 until 1997, and then as senior vice president and chief technical officer until 1999. Mr. Larsen co-founded and was vice president and director of Novoste Puerto Rico, Inc. from 1987 to May 1992. From 1983 through 1987, Mr. Larsen was a manager of manufacturing engineering at Cordis Corporation, a healthcare company. Mr. Larsen currently serves as a board member for Acufocus, Inc., CardioFocus, Inc. and Torax Medical, Inc. Previously, Mr. Larsen served on the boards of Novalign Orthopaedics, Inc., and Neovista, Inc. Mr. Larsen received a Bachelor of Science degree in Mechanical Engineering from New Jersey Institute of Technology. The board of directors believes that he is qualified to serve as a director of Inogen because of his extensive industry and leadership experience in the medical industry.
Timothy Petersen has served as a member of the board of directors of Inogen since 2010. He has been a managing director at Arboretum Ventures, a venture capital firm, since 2002. Prior to joining Arboretum, he was the managing director of the Zell Lurie Institute for Entrepreneurial Studies at the University of Michigan from 1999 to 2002. During his tenure at the University of Michigan, he also directed the Wolverine Venture Fund, the Institute’s venture capital fund focusing on early-stage life science and technology investments. Prior to the University of Michigan, Mr. Petersen was a manager in the investment banking practice at Plante Moran Corporate Finance, a professional services and consulting firm, and served as a management consultant at Industrial Economics, Inc., a consulting firm. He currently serves on the boards of Advanced ICU Care, Inc., IntelliCyt Corp., Fidelis SeniorCare, Inc., Tangent Medical Technologies, Inc., My Health Direct, Inc., and CerviLenz, Inc. Previously, Mr. Petersen served on the boards of HealthMedia, Inc. (sold to Johnson & Johnson), KFx Medical Corp., PathCentral, Inc., and Accuri Cytometers, Inc (sold to Becton, Dickinson and Company). Mr. Petersen earned a BA in Economics from Williams College. He also holds an MS in Economics from the University of Wisconsin-Madison, and an MBA from the Ross School of Business at the University of Michigan. The board of directors believes that he is qualified to serve as a director of Inogen because of his extensive experience as an investor and board member for various healthcare companies.
Benjamin Anderson-Ray has served as a member of the board of directors since 2013. He has been a partner and advisor with Trinitas Advisors, a consulting firm, since 2009. Prior to joining
-127-
Table of Contents
Trinitas Advisors, he served as the chief executive officer of three manufacturing companies: Hubbardton Forge, LLC from 2008 to 2009, Chromcraft Revington, Inc. from 2005 to 2008 and Gravograph New Hermes from 2002 to 2004. Prior to that, Mr. Anderson-Ray held various senior leadership roles at Sunrise Medical, a medical equipment manufacturer, including president of the Global Business Group in 2001, president of the Continuing Care Group from 1998 to 2000, and president of the Mobility Products Division from 1996 to 2001. Earlier in his career, Mr. Anderson-Ray held management and marketing roles at GE Lighting, a lighting solutions company, from 1984 to 1993, Black & Decker Home Products, a product manufacturing company, from 1993 to 1994, and Rubbermaid Home Products, a manufacturer and distributor of household items, from 1994 to 1996. He currently serves on the boards of 5i Science, the Episcopal Church Foundation, and the Addison County Economic Development Corporation. Previously, Mr. Anderson-Ray served on the board of Briggs Plant Propagation. Mr. Anderson-Ray has Bachelor’s degrees in Marketing and Horticulture from Michigan State University, an MBA from the University of Michigan, and is a Certified Advisor with The CEO Advantage. The board of directors believes that he is qualified to serve as a director of Inogen because of his leadership experience and his extensive industry experience.
Loren McFarland has served as a member of the board of directors of Inogen since 2013. He has been president and managing member of Santa Barbara Financial Services, LLC since 2008. Prior to founding Santa Barbara Financial Services, he served as the chief financial officer and treasurer of Mentor Corporation, a medical equipment company (now Ethicon, Inc., a Johnson & Johnson company), from 2004 to 2007. Prior to that, Mr. McFarland fulfilled various finance and accounting roles at Mentor from 1985 to 2004. He worked as a certified public accountant and audit supervisor with Touche Ross, an accounting firm, from 1981 to 1985 and served in the North Dakota Army National Guard from 1978 to 1984. He currently serves on the board of Cure Medical, LLC, a privately held manufacturer of disposable urology products, and on the board and executive committee of the MIT Enterprise Forum of the Central Coast. Previously, Mr. McFarland served on the board of directors of Patient Safety Technologies, Inc. (PSTX) as the financial expert on the audit committee and as a member of the compensation committee. Mr. McFarland has a Bachelor’s degree in accounting from the University of North Dakota and an MBA from the University of California, Los Angeles. He completed an ISS Director Certification Program in October 2008 at the University of California, Los Angeles’ Anderson School. The board of directors believes that he is qualified to serve as a director of Inogen because of his leadership experience and his extensive experience in finance and accounting.
Family relationships
There are no family relationships among any of our directors and executive officers.
Board composition and risk oversight
Our board of directors is currently composed of eight members. Upon the completion of this offering, Dr. Link and Mr. Cooper will voluntarily resign from our board of directors and our board of directors will be comprised of six directors. Five of the six directors that will comprise our board of directors upon the completion of this offering are independent within the meaning of the independent director guidelines of the NASDAQ Global Market. All of the directors were initially elected to our board of directors pursuant to a voting agreement that will terminate automatically by its terms upon the completion of this offering. The certificate of incorporation
-128-
Table of Contents
and bylaws to be in effect upon the completion of this offering provide that the number of directors shall be at least one and will be fixed from time to time by resolution of our board of directors.
During 2013, our board of directors met four times.
Immediately prior to this offering, our board of directors will be divided into three classes of directors. At each annual meeting of stockholders, a class of directors will be elected for a three-year term to succeed the class whose term is then expiring. The terms of the directors will expire upon the election and qualification of successor directors at the annual meeting of stockholders to be held during the years 2015 for the Class I directors, 2016 for the Class II directors and 2017 for the Class III directors.
The Class I directors will be Timothy Petersen and Charles E. Larsen.
The Class II directors will be Loren McFarland and Benjamin Anderson-Ray.
The Class III directors will be Heath Lukatch, Ph.D. and Raymond Huggenberger.
The division of our board of directors into three classes with staggered three-year terms may delay or prevent a change of our management or a change in control. See the section of this prospectus captioned “Description of capital stock—Anti-takeover effects of Delaware law and our amended and restated certificate of incorporation and amended and restated bylaws” for a discussion of other anti-takeover provisions found in the certificate of incorporation.
Our board of directors has an active role, as a whole and also at the committee level, in overseeing the management of our risks. Our board of directors is responsible for general oversight of risks and regular review of information regarding our risks, including credit risks, liquidity risks and operational risks. Our compensation, nominating and corporate governance committee is responsible for overseeing the management of risks relating to our executive compensation plans and arrangements and the risks associated with the independence of our board of directors and potential conflicts of interest. Our audit committee is responsible for overseeing the management of our risks relating to accounting matters and financial reporting. While each committee is responsible for evaluating certain risks and overseeing the management of such risks, the entire board of directors is regularly informed through discussions from committee members about such risks. Our board of directors believes its administration of its risk oversight function has not affected our board of directors’ leadership structure.
Director independence
Upon the completion of this offering, we anticipate that our common stock will be listed on the NASDAQ Global Market. Under the rules of the NASDAQ Global Market, independent directors must comprise a majority of a listed company’s board of directors within a specified period of the completion of this offering. In addition, the rules of the NASDAQ Global Market require that, subject to specified exceptions, each member of a listed company’s audit and compensation, nominating and governance committee be independent. Audit committee members must also satisfy the independence criteria set forth in Rule 10A-3 under the Securities Exchange Act of 1934, as amended, or the Exchange Act). Under the rules of the NASDAQ Global Market, a director will only qualify as an “independent director” if, in the opinion of that company’s board of directors, that person does not have a relationship that would interfere with the exercise of independent judgment in carrying out the responsibilities of a director.
-129-
Table of Contents
To be considered to be independent for purposes of Rule 10A-3, a member of an audit committee of a listed company may not, other than in his or her capacity as a member of our audit committee, our board of directors, or any other board committee: (1) accept, directly or indirectly, any consulting, advisory, or other compensatory fee from the listed company or any of its subsidiaries; or (2) be an affiliated person of the listed company or any of its subsidiaries.
In October 2013, our board of directors undertook a review of its composition, the composition of its committees and the independence of our directors and considered whether any director has a material relationship with us that could compromise his or her ability to exercise independent judgment in carrying out his or her responsibilities. Based upon information requested from and provided by each director concerning his background, employment and affiliations, including family relationships, our board of directors has determined that none of Mr. Anderson-Ray, Mr. Larsen, Dr. Lukatch, Mr. McFarland, and Mr. Petersen, representing five of our six directors that will be seated upon the completion of this offering, has a relationship that would interfere with the exercise of independent judgment in carrying out the responsibilities of a director and that each of these directors is “independent” as that term is defined under the rules of the NASDAQ Global Market. Our board of directors also determined that Messrs. McFarland (chairman), Petersen and Larsen, who comprise our audit committee, and Dr. Lukatch (chairman), Mr. Petersen, and Mr. Anderson-Ray, who comprise our compensation, nominating and governance committee, satisfy the independence standards for those committees established by applicable Securities and Exchange Commission, or SEC, rules and the listing standards of the NASDAQ Global Market.
In making this determination, our board of directors considered the relationships that each non-employee director has with us and all other facts and circumstances our board of directors deemed relevant in determining independence, including the beneficial ownership of our capital stock by each non-employee director.
Board committees
Our board of directors has an audit committee and a compensation, nominating and governance committee, each of which has the composition and the responsibilities described below.
Audit committee
The members of our audit committee are Messrs. McFarland, Petersen and Larsen, each of whom is a non-employee member of our board of directors. Our audit committee chairman, Mr. McFarland, is our audit committee financial expert, as that term is defined under the SEC rules implementing Section 407 of the Sarbanes-Oxley Act of 2002, and possesses financial sophistication, as defined under the listing standards of the NASDAQ Global Market. Our audit committee oversees our corporate accounting and financial reporting process and assists our board of directors in monitoring our financial systems. Our audit committee will also:
| • | approve the hiring, discharging and compensation of our independent auditors; |
| • | oversee the work of our independent auditors; |
| • | approve engagements of the independent auditors to render any audit or permissible non-audit services; |
-130-
Table of Contents
| • | review the qualifications, independence and performance of the independent auditors; |
| • | review our financial statements and our critical accounting policies and estimates; |
| • | review the adequacy and effectiveness of our internal controls; and |
| • | review and discuss with management and the independent auditors the results of our annual audit, our annual and quarterly financial statements and our publicly filed reports. |
Our audit committee met five times during 2013.
Compensation, nominating and governance committee
The members of our compensation, nominating and governance committee are Dr. Lukatch and Messrs. Petersen and Anderson-Ray. Dr. Lukatch is the chairman of our compensation, nominating and governance committee. Our compensation, nominating and governance committee oversees our compensation policies, plans and benefits programs. Our compensation, nominating and governance committee will also:
| • | review and recommend policies relating to compensation and benefits of our officers and employees; |
| • | review and approve corporate goals and objectives relevant to compensation of our chief executive officer and other senior officers; |
| • | evaluate the performance of our officers in light of established goals and objectives; |
| • | recommend compensation of our officers based on its evaluations; |
| • | administer the issuance of stock options and other awards under our stock plans; |
| • | evaluate and make recommendations regarding the organization and governance of our board of directors and its committees; |
| • | evaluate and propose nominees for election to our board of directors; |
| • | assess the performance of members of our board of directors and make recommendations regarding committee and chair assignments; |
| • | recommend desired qualifications for board of directors membership and conduct searches for potential members of our board of directors; and |
| • | review and make recommendations with respect to our corporate governance guidelines. |
Our compensation, nominating and governance committee met one time during 2013.
Our board of directors may from time to time establish other committees.
-131-
Table of Contents
Director compensation
In 2013, we provided compensation and granted stock option awards to Messrs. Anderson-Ray and McFarland in connection with their appointment to our board of directors. We have not historically paid cash or equity compensation to our non-employee directors who are associated with our principal stockholders for their service on our board of directors. We have reimbursed and will continue to reimburse all of our non-employee directors for their travel, lodging and other reasonable expenses incurred in attending meetings of our board of directors and committees of our board of directors. The following table sets forth information concerning the compensation paid or accrued for services rendered to us by each of our directors who was not serving as an executive officer in 2013.
Director Compensation
| Name | Fees Earned or paid in Cash($) |
Option Awards($)(1) |
Total($) | |||||||||
|
|
||||||||||||
| Heath Lukatch, Ph.D. |
— | — | — | |||||||||
| Stephen E. Cooper |
— | — | — | |||||||||
| William J. Link, Ph.D. |
— | — | — | |||||||||
| Charles E. Larsen |
— | — | — | |||||||||
| Timothy Petersen |
— | — | — | |||||||||
| Benjamin Anderson-Ray |
$ | 8,750 | (2) | $ | 6,647 | (4) | $ | 15,397 | ||||
| Loren McFarland |
$ | 13,750 | (3) | $ | 8,311 | (5) | $ | 22,061 | ||||
|
|
||||||||||||
| (1) | Represents the aggregate grant date fair value recognized for financial statement reporting purposes for 2013, calculated in accordance with ASC Topic 718. Such grant-date fair value does not take into account any estimated forfeitures related to service-vesting conditions. See the notes to our financial statements included elsewhere in this prospectus for a discussion of assumptions made in determining the grant date fair value and compensation expense of our stock options. |
| (2) | Cash fees paid for board membership reflect a partial year of service at the amounts discussed in the “Cash compensation” section below. |
| (3) | Cash fees paid for board and committee service reflect a partial year of service at the amounts discussed in the “Cash compensation” section below. |
| (4) | As of December 31, 2013, Mr. Anderson-Ray had one option to purchase a total of 1,666 shares of our common stock. The option vests in 12 successive equal monthly installments from October 1, 2013, subject to continued service through each such date. 277 shares of our common stock subject to this option were vested as of December 31, 2013. |
| (5) | As of December 31, 2013, Mr. McFarland had one option to purchase a total of 2,083 shares of our common stock. The option vests in 12 successive equal monthly installments from October 1, 2013, subject to continued service through each such date. 347 shares of our common stock subject to this option were vested as of December 31, 2013. |
In October 2013, our board of directors, after reviewing data provided by our independent compensation consulting firm, Pearl Meyer & Partners, regarding practices at comparable companies, adopted a compensation program for non-employee directors to attract, retain and reward its qualified directors and align the financial interests of the non-employee directors with those of our stockholders. Pursuant to this compensation program, each member of our board of directors who is not our employee will receive the following cash and equity compensation for board services. We also will continue to reimburse our non-employee directors for expenses incurred in connection with attending board and committee meetings.
-132-
Table of Contents
Cash compensation
All non-employee directors will be entitled to receive the following cash compensation for their services following the effective date of the registration statement of which this prospectus forms a part:
$35,000 per year for service as a board member;
$20,000 per year for service as chair of the board;
$20,000 per year for service as chair of the audit committee; and
$15,000 per year for service as chair of the compensation, nominating and governance committee.
All cash payments to non-employee directors will be paid quarterly in arrears.
Equity compensation
Within 90 days of the effective date of the registration statement of which this prospectus forms a part, we will grant each non-employee director an option to purchase 13,333 shares of our common stock, which will vest in twenty-four equal monthly installments beginning on the first monthly anniversary after the grant date, subject to the non-employee director continuing to provide services to us through any vesting date.
On the date of each annual meeting of stockholders beginning with the first annual meeting following this offering, each non-employee director will be granted an nonstatutory stock option to purchase 6,666 shares of our common stock, which grant will vest in twelve equal monthly installments beginning with the first monthly anniversary after the grant date, but will vest fully on the date of the next annual meeting held after the date of grant if not fully vested on such date, in each case, subject to the non-employee director continuing to be a service provider through each vesting date.
On the date of each annual meeting of stockholders beginning with the first annual meeting following this offering, each non-employee director who serves as chairman of our board of directors or one of its committees will be granted a nonstatutory stock option to purchase: 1,666 shares of our common stock (chairman of the board of directors), 1,666 shares of our common stock (chairman of the audit committee), and/or 1,166 shares of our common stock (chairman of the compensation, nominating and governance committee). Each of these grants will vest in twelve equal monthly installments beginning with the first monthly anniversary after the grant date, but will vest fully on the date of the next annual meeting held after the date of grant if not fully vested on such date, in each case, subject to the non-employee director continuing to be a service provider through each vesting date.
For further information regarding the equity compensation of our non-employee directors, see the section titled “Executive compensation—Employee benefit and stock plans.”
Code of ethics and conduct
We have adopted a written code of ethics and conduct that applies to our directors, officers and employees, including our principal executive officer, principal financial officer, principal accounting officer or controller, or persons performing similar functions that will become
-133-
Table of Contents
effective upon the completion of this offering. Following this offering, a current copy of the code will be posted on the investor section of our website, www.inogen.com.
Compensation committee interlocks and insider participation
During the past fiscal year, none of the members of our compensation, nominating and governance committee were an officer or employee of our company. None of our executive officers currently serves, or in the past year has served, as a member of the board of directors or compensation committee (or other board committee performing equivalent functions) of any entity that has one or more of its executive officers serving on our board of directors or compensation, nominating and governance committee. Our stockholder, Novo A/S, purchased shares of our series G convertible preferred stock in March 2012. For additional information regarding Novo A/S and its equity holdings, see “Certain relationships and related party transactions” and “Principal and selling stockholders.”
Limitation of liability and indemnification
Our amended and restated certificate of incorporation and amended and restated bylaws that will become effective upon the completion of this offering contain provisions that limit the personal liability of our directors for monetary damages to the fullest extent permitted by Delaware law. Consequently, our directors will not be personally liable to us or our stockholders for monetary damages for any breach of fiduciary duties as directors, except liability for:
| • | any breach of the director’s duty of loyalty to us or our stockholders; |
| • | any act or omission not in good faith or that involves intentional misconduct or a knowing violation of law; |
| • | unlawful payments of dividends or unlawful stock repurchases or redemptions as provided in Section 174 of the Delaware General Corporation Law; or |
| • | any transaction from which the director derived an improper personal benefit. |
Our amended and restated certificate of incorporation that will become effective upon the completion of this offering, provides that we indemnify our directors to the fullest extent permitted by Delaware law. In addition, our amended and restated bylaws, that will become effective prior to the completion of this offering, provide that we indemnify our directors and officers to the fullest extent permitted by Delaware law. Our amended and restated bylaws, that will become effective upon the completion of this offering, also provide that we shall advance expenses incurred by a director or officer in advance of the final disposition of any action or proceeding, and permit us to secure insurance on behalf of any officer, director, employee or other agent for any liability arising out of his or her actions in that capacity, regardless of whether we would otherwise be permitted to indemnify him or her under the provisions of Delaware law. We have entered and expect to continue to enter into agreements to indemnify our directors, executive officers and other employees as determined by our board of directors. With certain exceptions, these agreements provide for indemnification for related expenses including, among others, attorneys’ fees, judgments, fines and settlement amounts incurred by any of these individuals in any action or proceeding. We believe that these bylaw provisions and indemnification agreements are necessary to attract and retain qualified persons as directors and officers. We also maintain directors’ and officers’ liability insurance.
-134-
Table of Contents
The limitation of liability and indemnification provisions in our amended and restated certificate of incorporation and amended and restated bylaws, that will become effective upon the completion of this offering, and our indemnification agreements may discourage stockholders from bringing a lawsuit against our directors for breach of their fiduciary duty of care. They may also reduce the likelihood of derivative litigation against our directors and officers, even though an action, if successful, might benefit us and other stockholders. Further, a stockholder’s investment may be adversely affected to the extent that we pay the costs of settlement and damage awards against directors and officers. At present, there is no pending litigation or proceeding involving any of our directors, officers or employees for which indemnification is sought, and we are not aware of any threatened litigation that may result in claims for indemnification.
-135-
Table of Contents
Summary compensation table
The following table provides information regarding the compensation of our named executive officers during 2013 and 2012, which consist of our principal executive officer and the next two most highly compensated executive officers.
| Name and principal position | Year | Salary ($) |
Bonus ($)(1) |
Option awards ($)(2) |
Non—equity incentive plan compensation ($) |
All other compensation ($) |
Total ($) |
|||||||||||||||||||||
|
|
||||||||||||||||||||||||||||
| Raymond Huggenberger |
2013 | $ | 346,883 | $ | — | $ | 186,685 | $ | — | (5) | $ | 10,236 | (4) | $ | 543,804 | |||||||||||||
| President and Chief Executive Officer |
2012 | $ | 337,905 | $ | 40,000 | $ | 28,262 | $ | 148,086 | (3) | $ | 19,657 | (4) | $ | 573,910 | |||||||||||||
| Scott Wilkinson |
2013 | $ | 215,946 | $ | — | $ | 140,044 | $ | — | (5) | $ | — | $ | 355,990 | ||||||||||||||
| Executive Vice President, Sales and Marketing |
2012 | $ | 205,598 | $ | 15,000 | $ | 9,209 | $ | 45,446 | (3) | $ | — | $ | 275,253 | ||||||||||||||
| Alison Bauerlein |
2013 | $ | 203,542 | $ | — | $ | 140,654 | $ | — | (5) | $ | — | $ | 344,196 | ||||||||||||||
| Vice President, Finance and Chief Financial Officer |
2012 | $ | 176,849 | $ | 15,000 | $ | 10,730 | $ | 39,904 | (3) | $ | — | $ | 242,483 | ||||||||||||||
|
|
||||||||||||||||||||||||||||
| (1) | The amounts reported for 2012 refer to special discretionary bonuses paid in 2013 related to 2012 services. |
| (2) | The dollar amounts in this column represent the aggregate grant date fair value of stock option awards. These amounts have been computed in accordance with FASB ASC Topic 718. Pursuant to SEC rules, the amounts shown exclude the impact of estimated forfeitures related to service—based vesting conditions. For a discussion of valuation assumptions, see the notes to our financial statements included elsewhere in this prospectus. |
| (3) | Represents the amounts earned and payable under the 2012 Bonus Plan, all of which were paid in 2013. |
| (4) | Amount represents a housing allowance paid to Mr. Huggenberger. |
| (5) | The amount of non—equity incentive plan compensation for each of Mr. Huggenberger, Mr. Wilkinson, and Ms. Bauerlein in 2013 will be calculated after we complete our annual audit and our board of directors determines the extent to which we achieved the performance objectives under our 2013 Bonus Plan, which we expect to occur on or around March 19, 2014. |
Non—equity incentive plan compensation and bonus
2013 non—equity incentive plan payments
For 2013, the target incentive amounts for our named executive officers were the following:
| Name and principal position | Target award opportunity ($) |
|||
|
|
||||
| Raymond Huggenberger. |
$ | 173,442 | ||
| President and Chief Executive Officer |
||||
| Scott Wilkinson. |
$ | 75,581 | ||
| Executive Vice President, Sales and Marketing |
||||
| Alison Bauerlein |
$ | 71,240 | ||
| Vice President, Finance and Chief Financial Officer |
||||
|
|
||||
Our 2013 incentive compensation plan, or 2013 Bonus Plan, provides our named executive officers with an annual incentive compensation payment, subject to our achievement of our corporate performance goals. For 2013, our corporate-level goals included achieving specified adjusted
-136-
Table of Contents
EBITDA targets for the year. If our adjusted EBITDA achievement is at target, each named executive officer would receive 100% of his or her 2013 target award opportunity. Performance above 100% of our adjusted EBITDA target entitles each named executive officer to an increase to his or her incentive award payment based on the extent of the achievement above target. For our 2013 Bonus Plan, our adjusted EBITDA target was $10.5 million, excluding expenses incurred in connection with our initial public offering.
The actual award amounts earned by each named executive officer for 2013 have not yet been calculated, and will be calculated after our annual audit and our board of directors determines achievement against the corporate performance goal.
2012 discretionary bonus payments
Mr. Huggenberger, Mr. Wilkinson, and Ms. Bauerlein earned a discretionary one-time bonus during 2012 of $40,000, $15,000 and $15,000 respectively. Such bonus was paid in fiscal year 2013.
2012 non-equity incentive plan payments
For 2012, the target incentive amounts and the aggregate annual payments earned by our named executive officers were the following:
| Named executive officer | Target award opportunity ($) |
Actual award ($) |
||||||
|
|
||||||||
| Raymond Huggenberger |
133,600 | 148,086 | ||||||
| Scott Wilkinson |
41,000 | 45,446 | ||||||
| Alison Bauerlein |
36,000 | 39,904 | ||||||
|
|
||||||||
Our 2012 incentive compensation plan, or 2012 Bonus Plan, provides our named executive officers with an annual incentive compensation payment, subject to our achievement of our corporate performance goals. For 2012, our corporate-level goals included achieving specified EBITDA targets for the year. For 2012, we achieved our corporate goals at a level of approximately 111%. The actual award amounts were calculated by multiplying the target bonus amounts by approximately 111%.
Executive employment agreements
Raymond Huggenberger
We entered into an amended and restated employment agreement with Raymond Huggenberger, our president and chief executive officer, effective October 1, 2013. Mr. Huggenberger’s current base salary is $400,000 and he is eligible to receive an annual performance bonus of up to 50% of his base salary. Immediately following the effective date of this prospectus, Mr. Huggenberger’s base salary will increase to $440,000 and his bonus opportunity will increase to 60% of his base salary.
Mr. Huggenberger is entitled under his employment agreement to the following severance and change of control benefits upon certain qualifying terminations.
-137-
Table of Contents
If Mr. Huggenberger’s employment is terminated without “cause” (excluding by reason of death or disability) or he resigns for “good reason” (as such terms are defined in the employment agreement), he will be eligible to receive the following benefits if he timely signs and does not revoke a release of claims:
| • | (a) if prior to the effective date of the registration statement of which this prospectus forms a part, continued payment of his base salary for a period of 12 months; or (b) if after the effective date of the registration statement of which this prospectus forms a part and outside the Change in Control Period, continued payment of his base salary for a period of 24 months (collectively, the “CEO Severance Payments”); and |
| • | Throughout the period during which he would be able to obtain COBRA coverage, Mr. Huggenberger and his dependents will only be required to pay the portion of the costs of medical benefits as Mr. Huggenberger was required to pay as of the date of his termination, or Mr. Huggenberger will receive taxable monthly payments for the equivalent period in the event the Company determines that the COBRA subsidy could violate applicable law (the “CEO COBRA Benefits”). |
The Change in Control Period is the period beginning three months before a change in control, as defined in the employment agreement, and ending 12 months after a change in control.
If, following the effective date of this prospectus and during the Change of Control Period, Mr. Huggenberger’s employment is terminated without “cause” (excluding by reason of death or disability) or he resigns for “good reason”, he will be eligible to receive the CEO Severance Payments and CEO COBRA Benefits, however the CEO Severance Payments will continue for a period of 36 months.
In the event any of the amounts provided for under this employment agreement or otherwise payable to Mr. Huggenberger would constitute “parachute payments” within the meaning of Section 280G of the Internal Revenue Code and could be subject to the related excise tax, Mr. Huggenberger would be entitled to receive either full payment of benefits under this employment agreement or such lesser amount which would result in no portion of the benefits being subject to the excise tax, whichever results in the greater amount of after-tax benefits to Mr. Huggenberger. The employment agreement does not require us to provide any tax gross-up payments.
Scott Wilkinson and Alison Bauerlein
We entered into an amended and restated employment agreement with each of Scott Wilkinson, our vice president, sales and marketing and Alison Bauerlein, our vice president, finance and chief financial officer, treasurer and secretary, effective October 1, 2013. Mr. Wilkinson’s current base salary is $240,000 and he is eligible to receive an annual performance bonus of up to 35% of his base salary. Ms. Bauerlein’s current base salary is $250,000 and she is eligible to receive an annual performance bonus of up to 35% of her base salary. Immediately following the effective date of this prospectus, Mr. Wilkinson’s base salary will increase to $258,000 and his bonus opportunity shall increase to 40% of his base salary, and Ms. Bauerlein’s base salary will increase to $270,000 and her bonus opportunity will increase to 40% of her base salary.
Each of Mr. Wilkinson and Ms. Bauerlein is entitled under their respective employment agreements to the following severance and change of control benefits upon certain qualifying terminations.
-138-
Table of Contents
If the named executive officer’s employment is terminated without “cause” (excluding by reason of death or disability) or the named executive officer resigns for “good reason” (as such terms are defined in the employment agreement), such named executive officer will be eligible to receive the following benefits if he or she timely signs and does not revoke a release of claims:
| • | (a) if prior to the effective date of the registration statement of which this prospectus forms a part, continued payment of his or her base salary for a period of six months or (b) if after the effective date of the registration statement of which this prospectus forms a part, and outside the Change in Control Period continued payment of his or her base salary for a period of 12 months (the “NEO Severance Payments”); and |
| • | Throughout the period during which he would be able to obtain COBRA coverage, the named executive and his or her eligible dependents will only be required to pay the portion of the costs of medical benefits as he or she was required to pay as of the date of his termination, or he or she will receive taxable monthly payments for the equivalent period in the event the Company determines that the COBRA subsidy could violate applicable law, (the “NEO COBRA Benefits”). |
If, following the effective date of this prospectus and during the Change of Control Period, the named executive officer’s employment is terminated without cause (excluding by reason of death or disability) or he or she resigns for good reason, he or she will be eligible to receive the NEO Severance Payments and NEO COBRA Benefits, however the NEO Severance Payments will continue for a period of 24 months.
In the event any of the amounts provided for under an employment agreement or otherwise payable to the named executive officer would constitute “parachute payments” within the meaning of Section 280G of the Internal Revenue Code and could be subject to the related excise tax, the named executive officer would be entitled to receive either full payment of benefits under the employment agreement or such lesser amount which would result in no portion of the benefits being subject to the excise tax, whichever results in the greater amount of after-tax benefits to the named executive officer. Neither employment agreement requires us to provide any tax gross-up payments.
-139-
Table of Contents
Outstanding equity awards at 2013 fiscal year-end
The following table presents information concerning equity awards held by our named executive officers as of December 31, 2013.
| Option awards | ||||||||||||||||||||
| Vesting date |
Number of securities underlying unexercised options (#) |
Option price ($) |
Option expiration date |
|||||||||||||||||
|
|
|
|||||||||||||||||||
| Name | Exercisable | Unexercisable | ||||||||||||||||||
|
|
||||||||||||||||||||
| Raymond Huggenberger |
1/2/08 | 168,399 | (1) | 0 | 2.40 | 1/17/2018 | ||||||||||||||
| 2/10/09 | 56,133 | (2) | 0 | 0.60 | 2/9/2019 | |||||||||||||||
| 2/24/10 | 270,449 | (3) | 0 | 0.60 | 2/23/2020 | |||||||||||||||
| 4/1/12 | 30,670 | (4) | 42,939 | 0.81 | 3/27/2022 | |||||||||||||||
| 10/1/13 | 1,851 | (11) | 42,590 | 8.37 | 10/9/2023 | |||||||||||||||
| Scott Wilkinson |
11/21/05 | 6,666 | (5) | 0 | 8.70 | 11/20/2015 | ||||||||||||||
| 1/1/08 | 25,000 | (6) | 0 | 2.40 | 3/26/2018 | |||||||||||||||
| 2/10/09 | 26,666 | (7) | 0 | 0.60 | 2/9/2019 | |||||||||||||||
| 2/24/10 | 71,371 | (8) | 0 | 0.60 | 2/23/2020 | |||||||||||||||
| 2/24/10 | 14,658 | (9) | 637 | 0.60 | 2/23/2020 | |||||||||||||||
| 8/1/11 | 10,311 | (10) | 7,366 | 0.75 | 10/10/2021 | |||||||||||||||
| 4/1/12 | 9,993 | (4) | 13,991 | 0.81 | 3/27/2022 | |||||||||||||||
| 10/1/13 | 1,389 | (11) | 31,949 | 8.37 | 10/9/2023 | |||||||||||||||
| Alison Bauerlein |
1/1/08 | 32,798 | (6) | 0 | 2.40 | 3/26/2018 | ||||||||||||||
| 2/10/09 | 20,000 | (7) | 0 | 0.60 | 2/9/2019 | |||||||||||||||
| 2/24/10 | 93,147 | (8) | 0 | 0.60 | 2/23/2020 | |||||||||||||||
| 2/24/10 | 9,760 | (9) | 425 | 0.60 | 2/23/2020 | |||||||||||||||
| 8/1/11 | 5,894 | (10) | 4,211 | 0.75 | 10/10/2021 | |||||||||||||||
| 4/1/12 | 11,644 | (4) | 16,302 | 0.81 | 3/27/2022 | |||||||||||||||
| 10/1/13 | 1,395 | (11) | 32,088 | 8.37 | 10/9/2023 | |||||||||||||||
|
|
||||||||||||||||||||
| (1) | The option fully vested on January 2, 2012. |
| (2) | The option fully vested on February 10, 2009. |
| (3) | The option fully vested on January 24, 2012. |
| (4) | 1/48th of the shares subject to the option vest monthly from April 1, 2012 subject to continued service through each vesting date. |
| (5) | The option fully vested on November 21, 2009. |
| (6) | The option fully vested on January 1, 2012. |
| (7) | The option fully vested on February 10, 2013. |
| (8) | The option fully vested on August 24, 2012. |
| (9) | The option vested with respect to 25% of the shares subject to the option on February 24, 2011, and 1/36th of the remaining shares subject to the option vest monthly thereafter subject to continued service through each vesting date. |
| (10) | 1/48th of the shares subject to the option vest monthly from August 1, 2011 subject to continued service through each vesting date. |
| (11) | 1/48th of the shares subject to the option vest monthly from October 1, 2013 subject to continued service through each vesting date. |
Employee benefit and stock plans
2014 Equity Incentive Plan
Our board of directors has adopted a 2014 Equity Incentive Plan, or the 2014 Plan, and our stockholders have approved it. The 2014 Plan will become effective immediately prior to the effectiveness of this prospectus. Our 2014 Plan provides for the grant of incentive stock options,
-140-
Table of Contents
within the meaning of Section 422 of the Internal Revenue Code, to our employees and any parent and subsidiary corporations’ employees, and for the grant of nonstatutory stock options, restricted stock, restricted stock units, stock appreciation rights, performance units and performance shares to our employees, directors and consultants and our parent and subsidiary corporations’ employees and consultants.
Authorized shares
A total of 895,346 shares of our common stock has been reserved for issuance pursuant to the 2014 Plan, of which no awards are issued and outstanding. In addition, the shares to be reserved for issuance under our 2014 Plan will also include shares returned to the 2012 Plan and 2002 Plan as the result of expiration or termination of awards (provided that the maximum number of shares that may be added to the 2014 Plan pursuant to such previously granted awards under the 2012 Plan and 2002 Plan is 2,328,659 shares). The number of shares available for issuance under the 2014 Plan also includes an annual increase on the first day of each fiscal year beginning in 2015, equal to the least of:
| • | 895,346 shares; |
| • | 4% of the outstanding shares of common stock as of the last day of our immediately preceding fiscal year; or |
| • | such other amount as our board of directors may determine. |
Plan administration
Our board of directors or one or more committees appointed by our board of directors will administer the 2014 Plan. We anticipate that our compensation, nominating and governance committee of our board of directors will administer our 2014 Plan. In the case of awards intended to qualify as “performance-based compensation” within the meaning of Section 162(m) of the Internal Revenue Code, the committee will consist of two or more “outside directors” within the meaning of Section 162(m). In addition, if we determine it is desirable to qualify transactions under the 2014 Plan as exempt under Rule 16b-3 of the Exchange Act, or Rule 16b-3, such transactions will be structured to satisfy the requirements for exemption under Rule 16b-3. Subject to the provisions of our 2014 Plan, the administrator has the power to administer the plan, including but not limited to, the power to interpret the terms of the 2014 Plan and awards granted under it, to create, amend and rescind rules and regulations relating to the 2014 Plan, including rules and regulations relating to sub-plans, and to determine the terms of the awards, including the exercise price, the number of shares subject to each such award, the exercisability of the awards, and the form of consideration, if any, payable upon exercise. The administrator also has the authority to amend existing awards to reduce or increase their exercise price, to allow participants the opportunity to transfer outstanding awards to a financial institution or other person or entity selected by the administrator, and to institute an exchange program by which outstanding awards may be surrendered in exchange for awards of the same type which may have a higher or lower exercise price or different terms, awards of a different type and/or cash.
Stock options
We may grant stock options under the 2014 Plan. The exercise price of options granted under our 2014 Plan will at least be equal to 100% of the fair market value of our common stock on the
-141-
Table of Contents
date of grant. The term of an incentive stock option may not exceed seven years, except that with respect to any participant who owns more than 10% of the voting power of all classes of our outstanding stock, the term must not exceed five years and the exercise price must equal at least 110% of the fair market value on the grant date. The administrator will determine the methods of payment of the exercise price of an option, which may include cash, shares or other property acceptable to the administrator, as well as other types of consideration permitted by applicable law. After the termination of service of an employee, director or consultant, he or she may exercise his or her option, to the extent vested as of the termination date, for the period of time stated in his or her option agreement. Generally, if termination is due to death or disability, the option will remain exercisable for 12 months. In all other cases, the option will generally remain exercisable for three months following the termination of service. However, in no event may an option be exercised later than the expiration of its term. Subject to the provisions of our 2014 Plan, the administrator determines the other terms of options.
Stock appreciation rights
We may grant stock appreciation rights under our 2014 Plan. Stock appreciation rights allow the recipient to receive the appreciation in the fair market value of our common stock between the exercise date and the date of grant. Stock appreciation rights may not have a term exceeding seven years. After the termination of service of an employee, director or consultant, he or she may exercise his or her stock appreciation right for the period of time stated in his or her option agreement. However, in no event may a stock appreciation right be exercised later than the expiration of its term. Subject to the provisions of our 2014 Plan, the administrator determines the other terms of stock appreciation rights, including when such rights become exercisable and whether to pay any increased appreciation in cash or with shares of our common stock, or a combination thereof, except that the per share exercise price for the shares to be issued pursuant to the exercise of a stock appreciation right will be no less than 100% of the fair market value per share on the date of grant.
Restricted stock
We may grant restricted stock under our 2014 Plan. Restricted stock awards are grants of shares of our common stock that vest in accordance with terms and conditions established by the administrator. The administrator will determine the number of shares of restricted stock granted to any employee, director or consultant and, subject to the provisions of our 2014 Plan, will determine the terms and conditions of such awards. The administrator may impose whatever conditions to vesting it determines to be appropriate (for example, the administrator may set restrictions based on the achievement of specific performance goals or continued service to us); provided, however, that the administrator, in its sole discretion, may accelerate the time at which any restrictions will lapse or be removed. Recipients of restricted stock awards generally will have voting and dividend rights with respect to such shares upon grant without regard to vesting, unless the administrator provides otherwise. Shares of restricted stock that do not vest are subject to our right of repurchase or forfeiture. Notwithstanding the foregoing, the administrator, in its sole discretion, may accelerate the time at which any restrictions will lapse or be removed.
Restricted stock units
We may grant restricted stock units under our 2014 Plan. Restricted stock units are bookkeeping entries representing an amount equal to the fair market value of one share of our common
-142-
Table of Contents
stock. Subject to the provisions of our 2014 Plan, the administrator determines the terms and conditions of restricted stock units, including the vesting criteria (which may include accomplishing specified performance criteria or continued service to us) and the form and timing of payment. Notwithstanding the foregoing, the administrator, in its sole discretion, may reduce or waive any vesting criteria that must be met to receive a payout.
Performance units and performance shares
We may grant performance units and performance shares under our 2014 Plan. Performance units and performance shares are awards that will result in a payment to a participant only if performance goals established by the administrator are achieved or the awards otherwise vest. The administrator will establish organizational or individual performance goals or other vesting criteria in its discretion, which, depending on the extent to which they are met, will determine the number and/or the value of performance units and performance shares to be paid out to participants. After the grant of a performance unit or performance share, the administrator, in its sole discretion, may reduce or waive any performance criteria or other vesting provisions for such performance units or performance shares. Performance units shall have an initial dollar value established by the administrator prior to the grant date. Performance shares shall have an initial value equal to the fair market value of our common stock on the grant date. The administrator, in its sole discretion, may pay earned performance units or performance shares in the form of cash, in shares or in some combination thereof.
Outside directors
Our 2014 Plan provides that all outside directors will be eligible to receive all types of awards (except for incentive stock options) under the 2014 Plan. In October 2013, we implemented a formal policy pursuant to which our non-employee directors will be eligible to receive equity awards under the 2014 Plan. Our 2014 Plan provides that in any given fiscal year, an outside director will not receive awards covering more than 200,000 shares (increasing to 250,000 shares for the initial year of service as an outside director).
Non-transferability of awards
Unless the administrator provides otherwise, our 2014 Plan generally will not allow for the transfer of awards and only the recipient of an award may exercise an award during his or her lifetime.
Certain adjustments
In the event of certain changes in our capitalization, to prevent diminution or enlargement of the benefits or potential benefits available under the 2014 Plan, the administrator will adjust the number and class of shares that may be delivered under the 2014 Plan and/or the number, class, and price of shares covered by each outstanding award, and the numerical share limits set forth in the 2014 Plan. In the event of our proposed liquidation or dissolution, the administrator will notify participants as soon as practicable and all awards will terminate immediately prior to the consummation of such proposed transaction.
Merger or change in control
Our 2014 Plan provides that in the event of a merger or change in control, as defined under the 2014 Plan, each outstanding award will be treated as the administrator determines, except that if
-143-
Table of Contents
a successor corporation or its parent or subsidiary does not assume or substitute an equivalent award for any outstanding award, then such award will fully vest, all restrictions on such award will lapse, all performance goals or other vesting criteria applicable to such award will be deemed achieved at 100% of target levels and such award will become fully exercisable, if applicable, for a specified period prior to the transaction. The award will then terminate upon the expiration of the specified period of time. If the service of an award holder is terminated on or within the 12 months following a change in control, as a result of an involuntary termination as defined in the 2014 Plan, his or her options, restricted stock units and stock appreciation rights, if any, will vest fully and become immediately exercisable, all restrictions on his or her restricted stock will lapse, and all performance goals or other vesting requirements for his or her performance shares and units will be deemed achieved at 100% of target levels, and all other terms and conditions met.
In addition, in the event of a change in control, options, stock appreciation rights, restricted stock, and restricted stock units held by our outside directors, if any, will vest fully and become immediately exercisable, all restrictions on his or her restricted stock will lapse, and all performance goals or other vesting for his or her performance shares and units will be deemed achieved at one hundred percent (100%) of target levels, and all other terms and conditions met.
Amendment, suspension or termination
The administrator will have the authority to amend, suspend or terminate the 2014 Plan provided such action does not impair the existing rights of any participant. Our 2014 Plan will automatically terminate in 2024, unless the administrator terminates it sooner.
2012 Equity Incentive Plan
Our board of directors adopted, and our stockholders approved, our 2012 Equity Incentive Plan, or the 2012 Plan, in March 2012 and the 2012 Plan was amended and restated in October 2013. Our 2012 Plan will terminate in connection with this offering and, accordingly, no shares are available for issuance under this plan. The 2012 Plan will continue to govern outstanding awards granted thereunder.
Authorized shares
An aggregate of 1,219,027 shares of our common stock was reserved for issuance under the 2012 Plan. In addition, the shares reserved for issuance under our 2012 Plan also included shares returned to the 2002 Plan as the result of expiration or termination of awards (provided that the maximum number of shares that could be added to the 2012 Plan was 1,424,646 shares). The 2012 Plan provided for the grant of incentive stock options, within the meaning of Section 422 of the Internal Revenue Code, to our employees and any parent and subsidiary corporations’ employees, and for the grant of nonstatutory stock options, restricted stock, restricted stock units, and stock appreciation rights to our employees, directors and consultants. As of September 30, 2013, options to purchase 688,589 shares of our common stock remained outstanding under the 2012 Plan.
Plan administration
Our board of directors or one or more committees appointed by our board of directors administers the 2012 Plan. Following this offering, we anticipate that our compensation,
-144-
Table of Contents
nominating and governance committee will administer the 2012 Plan. Subject to the provisions of our 2012 Plan, the administrator has the power to administer the plan, including but not limited to, the power to: (1) determine the fair market value of our common stock; (2) determine when an option may be settled in cash; (3) implement an exchange program; (4) adjust the vesting of an option; (5) construe and interpret the 2012 Plan; and (6) modify terms of grants to non-U.S. recipients in accordance with applicable laws. The administrator may also make all other determinations deemed necessary or advisable for administering the 2012 Plan.
Options
Under the 2012 Plan, the administrator had the power to grant options. The exercise price per share of options generally had to equal at least 100% of the fair market value per share of our common stock on the date of grant. The term of an option could not exceed ten years. An incentive stock option held by a participant who owns more than 10% of the total combined voting power of all classes of our stock, or any parent or subsidiary corporations, could not have had a term in excess of ten years and must have had an exercise price of at least 110% of the fair market value per share of our common stock on the date of grant.
After the termination of service, a participant may generally exercise his or her option, to the extent vested as of such date of termination, for the period of time stated in his or her option agreement. Generally, if termination is due to disability or death, the option will remain exercisable, to the extent vested as of such date of termination, for 6 months or such longer period of time as is specified in the option agreement. In all other cases, the option generally will remain exercisable for three months following termination of service. However, in no event may an option be exercised later than the expiration of its term.
Transferability of awards
Our 2012 Plan generally does not allow for the transfer of stock options and a stock option only may be exercised during the stock option recipient’s lifetime.
Certain adjustments
In the event of certain changes in our capitalization without our receipt of consideration, the number of shares of our common stock covered by each outstanding option under the 2012 Plan and the exercise price per share of each outstanding option will be appropriately adjusted. In the event of our proposed liquidation or dissolution, all outstanding awards terminate immediately prior to such event.
Change in control
Our 2012 Plan provides that in the event of a merger or change in control (as defined in the 2012 Plan), each outstanding option will be treated as the administrator determines, except that if a successor corporation or its parent or subsidiary does not assume or substitute an equivalent award for an outstanding option, then the vesting of such options will be accelerated in full, and the options will be terminated if not exercised prior to such event. If the service of an award holder is terminated on or within the 12 months following a change in control, as a result of an involuntary termination as defined in the 2014 Plan, his or her options, restricted stock units and stock appreciation rights, if any, will vest fully and become immediately exercisable, all restrictions on his or her restricted stock will lapse, and all performance goals or other vesting
-145-
Table of Contents
requirements for his or her performance shares and units will be deemed achieved at 100% of target levels, and all other terms and conditions met.
Amendment or termination
Our board of directors may amend the 2012 Plan at any time. As noted above, in connection with this offering, the 2012 Plan will terminate and no further awards will be granted thereunder. All outstanding options will continue to be governed by their existing terms.
2002 Stock Incentive Plan, as most recently amended in February 2010
Our board of directors adopted and approved, and our stockholders approved, our 2002 Stock Incentive Plan, or the 2002 Plan, in May 2002. Our 2002 Plan was terminated in March 2012 in connection with the adoption of our 2012 Plan and, accordingly, no shares were available for issuance under this plan after that time. The 2002 Plan continues to govern outstanding stock options granted thereunder. An aggregate of 1,983,093 shares of our common stock was reserved for issuance under the 2002 Plan. The 2002 Plan provided for the grant of incentive stock options and nonqualified stock options. As of September 30, 2013, options to purchase 1,390,749 shares of our common stock remained outstanding under the 2002 Plan.
Plan administration
Our board of directors or one or more committees appointed by our board of directors administers the 2002 Plan. Following this offering, we anticipate that our compensation, nominating and governance committee will administer the 2002 Plan. Subject to the provisions of our 2002 Plan, the administrator has the power to administer the plan. Any action, decision, interpretation, or determination made in good faith by the administrator will be final and binding on us and all 2002 Plan participants.
Options
Under the 2002 Plan, the administrator had the power to grant options. The exercise price per share of options generally had to equal at least 100% of the fair market value per share of our common stock on the date of grant. The term of an option could not exceed 10 years. An incentive stock option held by a participant who owns more than 10% of the total combined voting power of all classes of our stock, or any parent or subsidiary corporations, could not have had a term in excess of 5 years and must have had an exercise price of at least 110% of the fair market value per share of our common stock on the date of grant.
After the termination of service, a participant may generally exercise his or her option, to the extent vested as of such date of termination, for the period of time stated in his or her option agreement. Generally, if termination is due to disability or death, the option will remain exercisable, to the extent vested as of such date of termination, for at least 6 months. If the termination is for a reason other than death, disability, or cause (as defined in the 2002 Plan), the option will remain exercisable, to the extent vested as of such date of termination, for at least 30 days.
Transferability of options
Our 2012 Plan generally does not allow for the transfer of stock options and a stock option only may be exercised during the stock option recipient’s lifetime.
-146-
Table of Contents
Certain adjustments
In the event of certain changes in our capitalization without our receipt of consideration, the number of shares of our common stock covered by each outstanding option under the 2002 Plan and the exercise price per share of each outstanding option will be appropriately adjusted.
Change in control
Our 2002 Plan provides that in the event of a change in control (as defined in the 2002 Plan), each outstanding option will accelerate automatically, effective as of immediately prior to the change in control unless the options are to be assumed by the acquiring or successor entity (or parent thereof) or new options are to be issued in exchange thereof.
Amendment or termination
Our board of directors may amend the 2002 Plan at any time, provided that such amendment generally may not affect or impair the rights of any holder of outstanding options without the option holder’s consent. As noted above, the 2002 Plan was terminated in March 2012 and no further awards will be granted thereunder. All outstanding awards will continue to be governed by their existing terms.
2014 Employee Stock Purchase Plan
Our board of directors has adopted a 2014 Employee Stock Purchase Plan, or the ESPP, and our stockholders have approve it. The ESPP will become effective immediately prior to the effectiveness of this prospectus.
Authorized shares
A total of 179,069 shares of our common stock available have been reserved for sale under the ESPP. In addition, our ESPP provides for annual increases in the number of shares available for sale under the ESPP on the first day of each fiscal year beginning in 2015, equal to the least of:
| • | 179,069 shares; |
| • | 1.5% of the outstanding shares of our common stock on the last day of our immediately preceding fiscal year; or |
| • | such other amount as may be determined by the administrator. |
Plan administration
Our board of directors or a committee appointed by our board of directors will administer the ESPP. We anticipate that our compensation, nominating and governance committee of our board of directors will administer the ESPP. The administrator will have authority to administer the plan, including but not limited to, full and exclusive authority to interpret the terms of the ESPP, determine eligibility to participate subject to the conditions of our ESPP as described below, and to establish procedures for plan administration necessary for the administration of the ESPP, including adopting sub-plans.
-147-
Table of Contents
Eligibility
Generally, all of our employees will be eligible to participate if they are employed by us, or any participating subsidiary, for at least 20 hours per week and more than five months in any calendar year. However, an employee may not be granted an option to purchase stock under the ESPP if such employee:
| • | immediately after the grant would own stock possessing 5% or more of the total combined voting power or value of all classes of our capital stock; or |
| • | holds rights to purchase stock under all of our employee stock purchase plans that accrue at a rate that exceeds $25,000 worth of stock for each calendar year in which the option is outstanding. |
Offering periods
Our ESPP is intended to qualify under Section 423 of the Code, and provides for six-month offering periods. The offering periods generally start on the first trading day on or after March 1 and September 1 of each year. However, the first offering period will begin on the registration date on which this prospectus forms a part and will end on the first trading day on or after September 1, 2014. The administrator may, in its discretion, modify the terms of future offering periods subject to the terms of our ESPP.
Payroll deductions
Our ESPP will permit participants to purchase common stock through payroll deductions of up to 15% of their eligible compensation, which includes a participant’s base straight time gross earnings, incentive compensation, bonuses, overtime and shift premium, but exclusive of payments for equity compensation and other similar compensation. A participant may purchase a maximum of 1,500 shares during a purchase period.
Exercise of option
Amounts deducted and accumulated by the participant are used to purchase shares of our common stock at the end of each six-month offering period. The purchase price of the shares will be 85% of the lower of the fair market value of our common stock on the first trading day of each offering period or on the exercise date. Participants may end their participation at any time during an offering period, and will be paid their accrued payroll deductions that have not yet been used to purchase shares of common stock. Participation ends automatically upon termination of employment with us.
Non-transferability of options
A participant may not transfer rights granted under the ESPP other than by will, the laws of descent and distribution, or as otherwise provided under the ESPP.
Merger or change in control
In the event of our merger or change in control, as defined under the ESPP, a successor corporation may assume or substitute for each outstanding option. If the successor corporation refuses to assume or substitute for the option, the offering period then in progress will be shortened, and a new exercise date will be set. The administrator will notify each participant that
-148-
Table of Contents
the exercise date has been changed and that the participant’s option will be exercised automatically on the new exercise date unless prior to such date the participant has withdrawn from the offering period.
Amendment or termination
Our ESPP will automatically terminate in 2034, unless we terminate it sooner. The administrator has the authority to amend, suspend or terminate our ESPP, except that, subject to certain exceptions described in the ESPP, no such action may adversely affect any outstanding rights to purchase stock under our ESPP.
Executive incentive compensation plan
Our board of directors has adopted an Executive Incentive Compensation Plan, or the Bonus Plan. The Bonus Plan allows our compensation, nominating and governance committee to provide cash incentive awards to selected employees, including our named executive officers, based upon performance goals established by our compensation, nominating and governance committee.
Under the Bonus Plan, our compensation, nominating and governance committee will determine the performance goals applicable to any award, which goals may include, without limitation: enrollments, business divestitures and acquisitions, cash flow, cash position, customer satisfaction, earnings (which may include earnings before interest and taxes, earnings before taxes and net earnings), earnings per share, adherence to budget, expenses, gross margin, growth in stockholder value relative to the moving average of the S&P 500 Index or another index, innovation, internal rate of return, net income, net profit, net sales, new product development, new product invention or innovation, number of customers, operating cash flow, operating expenses, operating income, operating margin, overhead or other expense reduction, productivity, profit, reduce cost per enrollment, return on assets, return on capital, return on equity, return on investment, return on sales, revenue, revenue growth, sales results, sales growth, stock price, time to market, total stockholder return, working capital, and individual objectives such as peer reviews or other subjective or objective criteria and individual objectives such as peer reviews or other subjective or objective criteria. Performance goals that include the Company’s financial results may be determined in accordance with U.S. generally accepted accounting principles, or GAAP, or such financial results may consist of non-GAAP financial measures and any actual results may be adjusted by our compensation, nominating and governance committee for one-time items or unbudgeted or unexpected items when determining whether the performance goals have been met. The goals may be on the basis of any factors our compensation, nominating and governance committee determines relevant, and may be adjusted on an individual, divisional, business unit or company-wide basis. The performance goals may differ from participant to participant and from award to award.
Our compensation, nominating and governance committee may, in its sole discretion and at any time, increase, reduce or eliminate a participant’s actual award, and/or increase, reduce or eliminate the amount allocated to the bonus pool for a particular performance period. The actual award may be below, at or above a participant’s target award, in our compensation, nominating and governance committee’s discretion. Our compensation, nominating and governance committee may determine the amount of any reduction on the basis of such factors as it deems relevant, and it is not be required to establish any allocation or weighting with respect to the factors it considers.
-149-
Table of Contents
Actual awards are paid in cash only after they are earned, which usually requires continued employment through the date a bonus is paid. Payment of bonuses occurs as soon as administratively practicable after they are earned, but no later than the dates set forth in the Bonus Plan.
Our board of directors has the authority to amend, alter, suspend or terminate the Bonus Plan provided such action does not impair the existing rights of any participant with respect to any earned bonus.
401(k) plan
We maintain a tax-qualified retirement plan that provides eligible employees with an opportunity to save for retirement on a tax advantaged basis. All participants’ interests in their deferrals are 100% vested when contributed. In 2012, we made no matching contributions into the 401(k) plan. Pre-tax contributions are allocated to each participant’s individual account and are then invested in selected investment alternatives according to the participants’ directions. The 401(k) plan is intended to qualify under Sections 401(a) and 501(a) of the Internal Revenue Code. As a tax-qualified retirement plan, contributions to the 401(k) plan and earnings on those contributions are not taxable to the employees until distributed from the 401(k) plan, and all contributions are deductible by us when made.
-150-
Table of Contents
Certain relationships and related party transactions
The following is a summary of transactions since January 1, 2011 to which we have been a party in which the amount involved exceeded $120,000 and in which any of our executive officers, directors, promoters or beneficial holders of more than 5% of our capital stock had or will have a direct or indirect material interest, other than compensation arrangements which are described under the section of this prospectus captioned “Management—Director compensation” and “Executive compensation.”
Related person transaction policy
We have adopted a written Related Person Transactions Policy that sets forth our policies and procedures regarding the identification, review, consideration, approval and oversight of “related person transactions” and that will be effective upon the completion of this offering. For purposes of our policy only, a “related person transaction” is a past, present or future transaction, arrangement or relationship (or any series of similar transactions, arrangements or relationships) in which we and any “related person” are participants, the amount involved exceeds $120,000 and a related person has a direct or indirect material interest. Transactions involving compensation for services provided to us as an employee, director, consultant or similar capacity by a related person are not covered by this policy. A “related person,” as determined since the beginning of our last fiscal year, is any executive officer, director or nominee to become director, a holder of more than 5% of our common stock, including any immediate family members of such persons. Any related person transaction may only be consummated if approved or ratified by our audit committee in accordance with the policy guidelines set forth below.
Under the policy, where a transaction has been identified as a related person transaction, management must present information regarding the proposed related person transaction to our audit committee for review and approval. In considering related person transactions, our audit committee takes into account the relevant available facts and circumstances including, but not limited to whether the terms of such transaction are no less favorable than terms generally available to an unaffiliated third party under the same or similar circumstances and the extent of the related person’s interest in the transaction. In the event a director has an interest in the proposed transaction, the director must recuse himself from the deliberations and approval process.
-151-
Table of Contents
Private placements
Series G convertible preferred stock
In March 2012, we issued 2,840,260 shares of our series G convertible preferred stock at an issuance price of $7.0416 per share for aggregate monetary consideration of approximately $20,000,000, to a total of eight accredited investors, including Novo A/S, and entities affiliated with Arboretum Ventures, each of which hold 5% or more of our capital stock and is represented on our board of directors. In connection with the closing of the offering contemplated by this prospectus, such shares of series G convertible preferred stock will convert to common stock at a ratio of one to one. The following table summarizes purchases of series G convertible preferred stock by such investors:
| Name of stockholder | Inogen director | Number of series G shares |
Approximate purchase price |
|||||||
|
|
||||||||||
| Novo A/S(1) |
Heath Lukatch, Ph.D. | 2,376,947 | $ | 16,738,000 | ||||||
| Funds affiliated with Arboretum Ventures(2)(3) |
Timothy Petersen | 426,039 | $ | 3,000,000 | ||||||
|
|
||||||||||
| (1) | Consists of 2,376,947 shares of series G convertible preferred stock issued to Novo A/S in March 2012, at a price of $7.0416 per share in exchange for an aggregate cash purchase price of approximately $16,738,000. |
| (2) | Arboretum Ventures affiliates holding our securities whose shares are aggregated for purposes of reporting share ownership information in this table include Arboretum Ventures II, L.P., and Arboretum Ventures IIa, L.P. |
| (3) | Consists of 426,039 shares of series G convertible preferred stock issued to Arboretum Ventures affiliates in March 2012, at a price of $7.0416 per share in exchange for an aggregate cash purchase price of approximately $3,000,000. |
Investors’ rights agreement
We entered into an amended and restated investors’ rights agreement with the holders of our preferred stock, including Novo A/S, entities affiliated with Arboretum Ventures, entities affiliated with Versant Ventures, Avalon Ventures VII, L.P and AMV Partners I, L.P, which each hold 5% or more of our capital stock and of which certain of our directors are affiliates, and entities affiliated with Stephen E. Cooper, a member of our board of directors. Such agreement provides, among other things, that the holders of our preferred stock are entitled to rights with respect to the registration of their shares. For a description of these registration rights, see the section of this prospectus captioned “Description of capital stock—Registration rights.”
Voting agreement
The election of the members of our board of directors is governed by a voting agreement with certain of the holders of our outstanding common stock, convertible preferred stock and warrants to purchase our capital stock, including Novo A/S, entities affiliated with Arboretum Ventures, entities affiliated with Versant Ventures, Avalon Ventures VII, L.P, AMV Partners I, L.P., entities affiliated with Stephen E. Cooper, a member of our board of directors, and Alison Bauerlein, our Vice President, Finance and Chief Financial Officer. The parties to the voting agreement have agreed, subject to certain conditions, to vote their shares so as to elect as directors (1) one nominee designated by Stephen E. Cooper, currently Stephen E. Cooper; (2) one nominee designated by Versant Venture Capital II, L.P. and its affiliates, currently William J. Link, Ph.D.; (3) one nominee designated by the AMV Partners I, L.P. and its affiliates, currently Charles E. Larsen; (4) one nominee designated by Novo A/S and its affiliates, currently Heath Lukatch, Ph.D.; and (5) one nominee designated by the Arboretum Ventures 1, LLC and its affiliates,
-152-
Table of Contents
currently Timothy Petersen. For so long as Mr. Huggenberger is employed as our chief executive officer, the parties to the voting agreement have agreed to vote their shares so as to elect Mr. Huggenberger to our board of directors. In addition, the parties to the voting agreement have agreed to vote their shares to elect two individuals who are designated by a majority of the other members of the board of directors, currently Loren McFarland and Benjamin Anderson-Ray. Upon the consummation of this offering, the obligations of the parties to the voting agreement to vote their shares so as to elect these nominees will terminate and none of our stockholders will have any special rights regarding the nomination, election or designation of members of our board of directors. Our existing certificate of incorporation contains provisions that correspond to the voting agreement; however, such provisions will be removed in the amended and restated certificate of incorporation that will be effective at the closing of the offering.
Other transactions
We have entered into separate indemnification agreements with each of our directors and certain of our officers. For a description of these agreements, see the section of this prospectus captioned “Management—Limitation of liability and indemnification.”
We have entered into employment agreements with certain of our executive officers that, among other things, provide for certain severance and change of control benefits. For a description of employment agreements with our named executive officers, see the section of this prospectus captioned “Executive compensation—Executive employment agreements.”
We have granted stock options to our named executive officers, other executive officers and certain of our directors. See the section of this prospectus captioned “Executive compensation—Executive employment agreements.”
-153-
Table of Contents
Principal and selling stockholders
The following table sets forth certain information with respect to the beneficial ownership of our common stock at January 1, 2014, as adjusted to reflect the sale of common stock offered by us in this offering, for:
| • | each person who we know beneficially owns more than 5% of our common stock; |
| • | each of our directors; |
| • | each of our named executive officers; |
| • | all of our directors and executive officers as a group; and |
| • | each selling stockholder. |
The percentage of beneficial ownership prior to the offering shown in the table is based upon 14,499,975 shares outstanding as of January 1, 2014. The percentage of beneficial ownership after this offering shown in the table is based on shares of common stock outstanding after the closing of this offering, which assumes the cash exercise of warrants to purchase an aggregate of 24,588 shares of common stock and our sale of shares in this offering. The table assumes the exercise of the underwriters’ option to purchase additional shares, which shares will be allocated on a pro rata basis among the selling stockholders on a pro rata basis based on the number of shares such selling stockholder has agreed to sell pursuant to the option.
Information with respect to beneficial ownership has been furnished by each director, officer or beneficial owner of more than 5% of our common stock. We have determined beneficial ownership in accordance with the rules of the SEC. These rules generally attribute beneficial ownership of securities to persons who possess sole or shared voting power or investment power with respect to those securities. In addition, the rules take into account shares of common stock issuable pursuant to the exercise of stock options or warrants that are either immediately exercisable or exercisable within 60 days of January 1, 2014. These shares are deemed to be outstanding and beneficially owned by the person holding those options or warrants for the purpose of computing the percentage ownership of that person, but they are not treated as outstanding for the purpose of computing the percentage ownership of any other person. Unless otherwise indicated, the persons or entities identified in this table have sole voting and investment power with respect to all shares shown as beneficially owned by them, subject to applicable community property laws.
-154-
Table of Contents
Except as otherwise noted below, the address for each person or entity listed in the table is c/o Inogen, Inc., 326 Bollay Drive, Goleta, California 93117.
| Beneficial ownership prior to the offering |
Shares
being offered |
Beneficial ownership after the offering | ||||||||||||||
| Name of beneficial owner | Shares | % |
Primary shares |
Option to purchase additional shares |
Shares | % | ||||||||||
|
| ||||||||||||||||
| 5% stockholders: |
||||||||||||||||
| Novo A/S(1) |
6,166,320 | 42.15% | ||||||||||||||
| Entities affiliated with Versant Ventures(2) |
3,798,950 | 26.08% | ||||||||||||||
| Entities affiliated with Arboretum Ventures(3) |
2,185,583 | 15.07% | ||||||||||||||
| Avalon Ventures VII, L.P.(4) |
942,961 | 6.50% | ||||||||||||||
| AMV Partners I, L.P(5) |
864,422 | 5.95% | ||||||||||||||
| Directors and named executive officers: |
||||||||||||||||
| Raymond Huggenberger(6) |
534,983 | 3.58% | ||||||||||||||
| Scott Wilkinson(7) |
171,378 | 1.17% | ||||||||||||||
| Alison Bauerlein(8) |
202,865 | 1.38% | ||||||||||||||
| Heath Lukatch, Ph.D. |
— | * | ||||||||||||||
| Stephen E. Cooper(9) |
148,115 | 1.02% | ||||||||||||||
| William J. Link, Ph.D.(10) |
3,798,950 | 26.08% | ||||||||||||||
| Charles E. Larsen(11) |
864,422 | 5.95% | ||||||||||||||
| Timothy Petersen(12) |
2,185,583 | 15.07% | ||||||||||||||
| Benjamin Anderson-Ray(13) |
694 | * | ||||||||||||||
| Loren McFarland(14) |
867 | * | ||||||||||||||
| All directors and executive officers as a group (13 persons)(15) |
8,460,035 | 52.95% | ||||||||||||||
| Other selling stockholders: |
||||||||||||||||
| UCSB Foundation(16) |
8,418 | * | ||||||||||||||
| The DeHont Family Revocable Trust u/t/d 3/6/84(17) |
27,160 | * | ||||||||||||||
| John Petote(18) |
21,632 | * | ||||||||||||||
| The Susan L. Henricksen Revocable Living Trust UTA dated October 11, 2007(19) |
6,316 | * | ||||||||||||||
| Dan Thomas(20) |
683 | |
* |
|
||||||||||||
| All other selling stockholders as a group (5 persons)(21) |
64,209 | * | ||||||||||||||
|
| ||||||||||||||||
| (*) | Less than one percent. |
| (1) | Consists of 6,036,449 shares held and 129,871 shares that may be acquired pursuant to the exercise of warrants held by Novo A/S. Novo A/S is a Danish limited liability company. The board of directors of Novo A/S, which consists of Sten Scheibye, Göran Ando, Jørgen Boe, Jeppe Christiansen, Steen Riisgaard and Per Wold-Olsen, has shared investment and voting control with respect to the shares held by Novo A/S and may exercise such control only with the support of a majority of the members of the Novo A/S board of directors. As such, no individual member of the Novo A/S board of directors is deemed to hold any |
-155-
Table of Contents
| beneficial ownership or reportable pecuniary interest in the shares held by Novo A/S. Dr. Lukatch, a member of our board of directors, is employed as a Partner of Novo Ventures (US) Inc. Dr. Lukatch is not deemed a beneficial owner of, and does not have a reportable pecuniary interest in, the shares held by Novo A/S. The address of Novo A/S is Tuborg Havnevej 19, 2900 Hellerup, Denmark. See “Certain relationships and related party transactions” above, for additional information regarding participation in a private placement transaction in 2012. |
| (2) | Consists of (i) 68,925 shares held and 1,196 shares that may be acquired pursuant to the exercise of warrants held of record by Versant Affiliates Fund II-A, L.P., a Delaware limited partnership (“VAF II-A”), (ii) 32,453 shares held and 560 shares that may be acquired pursuant to the exercise of warrants held of record by Versant Side Fund II, L.P., a Delaware limited partnership (“VSF II”), and (iii) 3,632,651 shares held and 63,165 shares that may be acquired pursuant to the exercise of warrants held of record by Versant Venture Capital II, L.P., a Delaware limited partnership (“VVC II”). Versant Ventures II, LLC, a Delaware limited liability company (“VV II”) serves as the sole general partner of VAF II-A, VSF II and VVC II own no shares directly. Brian G. Atwood, Samuel D. Colella, Ross A. Jaffe, William J. Link, Ph.D., Donald B. Milder, Rebecca B. Robertson, Bradley J. Bolzon, Charles M. Warden, and Barbara N. Lubash are directors and/or members of VV II and share voting and dispositive power over the shares held by VAF II-A, VSF II and VVC II; however, they disclaim beneficial ownership of the shares held by VAF II-A, VSF II and VVC II except to the extent of their pecuniary interests therein. The address for such entities and persons is c/o Versant Ventures, 3000 Sand Hill Road, Building 4, Suite 210, Menlo Park, California 94025. William J. Link, Ph.D., is a member of our board of directors. |
| (3) | Consists of (i) 1,364,470 shares of common stock held of record by Arboretum Ventures II, L.P., (ii) 319,688 shares of common stock held of record by Arboretum Ventures IIa, L.P., (iii) 300,858 shares of common stock held of record by Arboretum Ventures 1, LLC, all of which are pledged as security for an outstanding credit facility, and (iv) 200,567 shares of common stock held of record by Arboretum Ventures 1-A, LLC, all of which are pledged as security for an outstanding credit facility. Arboretum Investment Manager II, LLC (“AIM II”) serves as the general partner of Arboretum Ventures II, L.P. and serves as the sole manager of Arboretum Investment Manager IIa, LLC, which serves as the general partner of Arboretum Ventures IIa, L.P. Jan Garfinkle and Timothy Petersen are the managing members of AIM II and share the power to vote or dispose of these shares and therefore each of the foregoing managing members may be deemed to have voting and investment power with respect to such shares. Arboretum Investment Manager, LLC (“AIM”) serves as the managing member of Arboretum Ventures 1, LLC and Arboretum Ventures 1-A, LLC. Jan Garfinkle and Timothy Petersen are the managing members of AIM and share the power to vote or dispose of these shares and therefore each of the foregoing managing members may be deemed to have voting and investment power with respect to such shares. The address for such entities and persons is c/o Arboretum Ventures, 303 Detroit Street, Suite 301, Ann Arbor, Michigan 48104. Timothy Petersen is a member of our board of directors. |
| (4) | Represents 926,755 shares held and 16,206 shares that may be acquired pursuant to the exercise of warrants held of record by Avalon Ventures VII, L.P. Kevin J. Kinsella and Stephen L. Tomlin are the managing members of Avalon Ventures VII GP, LLC, which acts as the general partner of Avalon Ventures VII, L.P. As a result, Kevin J. Kinsella and Stephen L. Tomlin may be deemed to be the beneficial owners of the shares held by Avalon Ventures VII, L.P. However, Kevin J. Kinsella and Stephen L. Tomlin disclaim beneficial ownership of the reported securities except to the extent of their pecuniary interest therein. The address for such entities and persons is c/o Avalon Ventures, 1134 Kline Street, La Jolla, CA 92037. |
| (5) | Represents 844,809 shares held and 19,613 shares that may be acquired pursuant to the exercise of warrants held of record by AMV Partners I, L.P. (“AMV”). AMV has sole voting and dispositive power over the shares, except that (i) Accuitive Medical Ventures, LLC (“AMV LLC”), the general partner of AMV, may be deemed to have shared power to vote and dispose of these shares and (ii) Thomas Weldon, a managing member of AMV LLC, may be deemed to have shared power to vote and dispose of these shares and Charles E. Larsen, a managing member of AMV LLC, may be deemed to have shared power to vote and dispose of these shares. Each of Mr. Weldon and Mr. Larsen disclaims beneficial ownership of these shares, except to the extent of their pecuniary interest in such shares. AMV’s address is Accuitive Medical Ventures LLC, 2905 Premiere Parkway, Suite 150, Duluth, GA 30097. Charles E. Larsen is a member of our board of directors. On May 23, 2013, July 3, 2013, and September 5, 2013, AMV Partners I, L.P. exercised warrants to purchase an aggregate of 17,834 shares of common stock for an aggregate exercise price of approximately $210,000. |
| (6) | Includes 4,300 shares held and options to purchase 534,683 shares of common stock that are exercisable within 60 days of January 1, 2014. |
| (7) | Consists of options to purchase 171,378 shares of common stock that are exercisable within 60 days of January 1, 2014. |
| (8) | Includes 23,332 shares held and options to purchase 179,533 shares of common stock that are exercisable within 60 days of January 1, 2014. |
| (9) | Consists of (i) 118,681 shares held and 3,100 shares that may be acquired pursuant to the exercise of warrants held of record by Stephen E. Cooper and Susan D. Cooper, as trustees of the Cooper Revocable Trust dated July 26, 1996, and (ii) 26,334 shares held by the Stephen E. Cooper Family Partnership in which Mr. Cooper is the General Partner and has voting and dispositive power over such shares. On October 28, 2013, the Cooper Revocable Trust dated 7/26/96 exercised a warrant to purchase 699 shares of our common stock for aggregate gross proceeds of approximately $8,000. On January 6, 2014, the Cooper Revocable Trust dated 7/26/96 exercised a warrant to purchase 3,100 shares of our common stock for aggregate gross proceeds of approximately $31,500. |
| (10) | Consists of the shares described in Note (2) above. Dr. Link disclaims beneficial ownership of the shares held by VAF II-A, VSFII, and VVCII as described in Note (2) above, except to the extent of his pecuniary interest therein. The address for Dr. Link is c/o Versant Ventures, 3000 Sand Hill Road, Building 4, Suite 210, Menlo Park, California 94025. |
| (11) | Consists of the shares described in Note (5) above. Mr. Larsen disclaims beneficial ownership of the shares held by AMV, as described in Note (5) above, except to the extent of his pecuniary interest therein. |
-156-
Table of Contents
| (12) | Consists of the shares described in Note (3) above. |
| (13) | Consists of options to purchase 694 shares of common stock that are exercisable within 60 days of January 1, 2014. |
| (14) | Consists of options to purchase 867 shares of common stock that are exercisable within 60 days of January 1, 2014. |
| (15) | Includes 6,983,732 shares held, 87,634 shares that may be acquired pursuant to the exercise of warrants held of record and options to purchase 1,388,669 shares of common stock that are exercisable within 60 days of January 1, 2014. |
| (16) | Consists of (i) 2,500 shares held of record by the UCSB Foundation f/b/o the Center for Entrepreneurship and Engineering Management and (ii) 5,918 shares held of record by the UCSB Foundation f/b/o the College of Engineering. Neither we nor our predecessors or affiliates have had a material relationship with either the UCSB Foundation f/b/o the Center for Entrepreneurship and Engineering Management or the UCSB Foundation f/b/o the College of Engineering during the last three years. |
| (17) | Consists of 26,721 shares held and 439 shares that may be acquired pursuant to the exercise of warrants held of record by Charles L. DeHont as trustee of the DeHont Family Revocable Trust u/t/d 3/6/84. 14,273 of the shares were acquired from us in a private placement transaction in 2012 for aggregate gross proceeds of approximately $33,500. Neither we nor our predecessors or affiliates have had a material relationship with either the DeHont Family Revocable Trust u/t/d 3/6/84 or Mr. DeHont during the last three years. |
| (18) | Includes 21,440 shares held and 192 shares that may be acquired pursuant to the exercise of warrants held of record by John Petote. 21,302 of the shares were acquired from us in a private placement transaction in 2012 for aggregate gross proceeds of approximately $50,000. Neither we nor our predecessors or affiliates have had a material relationship with Mr. Petote during the last three years. |
| (19) | Consists of 6,316 shares held of record by Susan L. Henricksen as trustee of the Susan L. Henricksen Revocable Living Trust UTA dated October 11, 2007. Neither we nor our predecessors or affiliates have had a material relationship with either the Susan L. Henricksen Revocable Living Trust UTA dated October 11, 2007 or Ms. Henricksen during the last three years. |
| (20) | Includes 287 shares held and options to purchase 396 shares of common stock that are exercisable within 60 days of January 1, 2014. Subsequent to January 1, 2014, Mr. Thomas exercised his option to purchase all 396 shares of common stock at prices ranging from $2.10 to $4.50 per share for aggregate gross proceeds to us of $1,445.40. Neither we nor our predecessors or affiliates have had a material relationship with Mr. Thomas during the last three years. |
| (21) | Includes 63,182 shares held, 631 shares that may be acquired pursuant to the exercise of warrants held of record and options to purchase 396 shares of common stock that are exercisable within 60 days of January 1, 2014. |
-157-
Table of Contents
General
The following is a summary of the rights of our common stock and preferred stock and of certain provisions of our amended and restated certificate of incorporation and amended and restated bylaws, as they will be in effect upon the completion of this offering. This summary is not complete. For more detailed information, please see the amended and restated certificate of incorporation and amended and restated bylaws which are filed as exhibits to the registration statement of which this prospectus is a part.
Immediately upon completion of this offering, our authorized capital stock will consist of shares, all with a par value of $0.001 per share, of which:
| • | 200,000,000 shares are designated as common stock; and |
| • | 10,000,000 shares are designated as preferred stock. |
Upon the closing of this offering, all the outstanding shares of our convertible preferred stock will automatically convert into an aggregate of 14,218,319 shares of our common stock. Additionally, warrants to purchase an aggregate of 24,588 shares of common stock (upon conversion of the convertible preferred stock) at a weighted average exercise price of $10.1635 will expire if they are not exercised prior to the closing of the offering. Additionally, upon the closing of this offering and after giving effect to the conversion of our convertible preferred stock into common stock, warrants to purchase an aggregate of 268,200 shares of common stock will remain outstanding if they are not exercised prior to closing of this offering at a weighted average exercise price of $1.4216.
Common stock
Based on 276,618 shares of common stock outstanding as of September 30, 2013, the conversion of convertible preferred stock outstanding as of September 30, 2013 into 14,218,319 shares of common stock upon the completion of this offering, the issuance of shares of common stock in this offering, and no exercise of options or warrants, there will be shares of common stock outstanding upon the closing of this offering. As of September 30, 2013, assuming the conversion of all outstanding convertible preferred stock into common stock upon the closing of this offering, we had approximately 71 record holders of our common stock.
As of September 30, 2013, there were 268,200 shares of common stock subject to outstanding warrants, assuming the cash exercise of warrants to purchase an aggregate of 24,588 shares of common stock on or prior to the closing of this offering at a weighted average exercise price of $10.1635 per share, after conversion of the convertible preferred stock upon the closing of this offering. There were also 2,079,338 shares of common stock subject to outstanding options.
The holders of our common stock are entitled to one vote per share on all matters to be voted on by our stockholders. Subject to preferences that may be applicable to any outstanding shares of preferred stock, holders of common stock are entitled to receive ratably such dividends as may be declared by our board of directors out of funds legally available for that purpose. In the event of our liquidation, dissolution or winding up, the holders of common stock are entitled to share ratably in all assets remaining after the payment of liabilities, subject to the prior distribution rights of preferred stock then outstanding. Holders of common stock have no preemptive, conversion or subscription rights. There are no redemption or sinking fund provisions applicable to the common stock.
-158-
Table of Contents
Preferred stock
Though we currently have no plans to issue any shares of preferred stock, upon the closing of this offering and the filing of our amended and restated certificate of incorporation, our board of directors will have the authority, without further action by our stockholders, to designate and issue up to 10,000,000 shares of preferred stock in one or more series. Our board of directors may also designate the rights, preferences and privileges of each such series of preferred stock, any or all of which may be greater than or senior to those of the common stock. Though the actual effect of any such issuance on the rights of the holders of common stock will not be known until our board of directors determines the specific rights of the holders of preferred stock, the potential effects of such an issuance include:
| • | diluting the voting power of the holders of common stock; |
| • | reducing the likelihood that holders of common stock will receive dividend payments; |
| • | reducing the likelihood that holders of common stock will receive payments in the event of our liquidation, dissolution, or winding up; and |
| • | delaying, deterring or preventing a change-in-control or other corporate takeover. |
Dividends
Subject to preferences that may be applicable to any then outstanding preferred stock, holders of common stock are entitled to receive dividends, if any, as may be declared from time to time by our board of directors out of legally available funds. For more information, see the section of this prospectus captioned “Dividend policy.”
Liquidation
In the event of our liquidation, dissolution or winding up, holders of common stock will be entitled to share ratably in the net assets legally available for distribution to stockholders after the payment of all of our debts and other liabilities and the satisfaction of any liquidation preference granted to the holders of any then outstanding shares of preferred stock.
Rights and preferences
Holders of common stock have no preemptive, conversion, subscription or other rights, and there are no redemption or sinking fund provisions applicable to the common stock. The rights, preferences and privileges of the holders of common stock are subject to and may be adversely affected by, the rights of the holders of shares of any series of preferred stock that we may designate in the future.
Fully paid and nonassessable
All of our outstanding shares of common stock are, and the shares of common stock to be issued pursuant to this offering, when paid for, will be fully paid and nonassessable.
-159-
Table of Contents
Warrants
As of September 30, 2013, we had the following warrants outstanding:
| • | warrants exercisable for an aggregate of 233,611 shares of our common stock at an exercise price of $0.30 per share issued in connection with our 2007 convertible note financing and 2009 series E convertible preferred stock financing. These warrants have various expiration dates through February 26, 2019, but expire earlier upon a change in control of our company; |
| • | warrants exercisable for an aggregate of 14,215 shares of our series C convertible preferred stock at an exercise price of $17.58 per share issued in connection with a 2005 financing. These warrants will expire upon the earliest of (1) May 31, 2015, (2) a change in control of our company, and (3) the offering contemplated by this prospectus. Upon completion of the offering contemplated by this prospectus, and assuming the exercise of these warrants, these warrants will convert into an aggregate of 24,588 shares of common stock; |
| • | warrants exercisable for an aggregate of 942 shares of our series D convertible preferred stock at an exercise price of $21.90 per share issued to various purchasers in connection with our 2006 note and warrant financings. These warrants expire on various dates through November 8, 2013 unless a change in control of our company occurs prior to such expiration dates. To the extent that these warrants are not exercised prior to the offering contemplated by this prospectus, they will be exercisable for a maximum of 1,770 shares of common stock at the series D conversion rate of 1.8795056643:1; |
| • | a warrant exercisable for 11,415 shares of our series D convertible preferred stock at an exercise price of $21.90 per share issued to Venture Lending and Leasing IV, LLC in 2006. This warrant will expire in February, 2014. To the extent that these warrants are not exercised prior to the offering contemplated by this prospectus, they will be exercisable for a maximum of 21,454 shares of common stock at the series D conversion rate of 1.8795056643:1; and |
| • | warrants exercisable for an aggregate of 4,222 shares of our series E convertible preferred stock at an exercise price of $9.6120 per share issued to Square One Bank. These warrants will expire on various dates between July 10, 2015 and July 23, 2016; provided, however, that if the offering contemplated by this prospectus occurs within the three-year period immediately prior to the expiration date of any one of these warrants, the expiration date shall automatically be extended to third anniversary of our initial public offering. To the extent that these warrants are not exercised prior to the offering contemplated by this prospectus, they will be exercisable for a maximum of 11,365 shares of common stock at the series E conversion rate of 2.6924369748:1. |
These warrants have a net exercise provision under which their holders may, in lieu of payment of the exercise price in cash, surrender the warrant and receive a net amount of shares based on the fair market value of our stock at the time of exercise of the warrants after deduction of the aggregate exercise price. These warrants contain provisions for adjustment of the exercise price and number of shares issuable upon the exercise of warrants in the event of certain stock dividends, stock splits, reorganizations, reclassifications and consolidations.
-160-
Table of Contents
Registration rights
Under our investors’ rights agreement, following the closing of this offering, the holders of approximately 14,462,893 shares of common stock (including the shares underlying the warrants described in “Shares Eligible for Future Sale—Warrants”) or their transferees, have the right to require us to register the offer and sale of their shares, or to include their shares in any registration statement we file, in each case as described below.
Demand registration rights
At any time after February 16, 2014, or six months after the effective date of the offering contemplated under this prospectus, the holders of at least 50% of the shares having registration rights have the right to demand that we use best efforts to file a registration statement for the registration of the offer and sale of shares having registration rights that are requested to be registered. We are only obligated to file up to two registration statements in connection with the exercise of demand registration rights. These registration rights are subject to specified conditions and limitations, including the right of the underwriters to limit the number of shares included in any such registration under certain circumstances and our ability to defer the filing of a registration statement with respect to an exercise of such demand registration rights for up to 90 days under certain circumstances.
Form S-3 registration rights
At any time after we are qualified to file a registration statement on Form S-3, a stockholder with registration rights will have the right to demand that we file a registration statement on Form S-3 so long as the aggregate amount of shares to be offered and sold under such registration statement on Form S-3 is at least $1.0 million (net of any underwriters’ discounts or commissions). We are only obligated to file up to two registration statements on Form S-3 within a 12 month period. These registration rights are subject to specified conditions and limitations, including our ability to defer the filing of a registration statement with respect to an exercise of such Form S-3 registration rights for up to 90 days under certain circumstances.
Piggyback registration rights
At any time after the closing of this offering, if we propose to register the offer and sale of any of our securities under the Securities Act either for our own account or for the account of other stockholders, a stockholder with registration rights will have the right, subject to certain exceptions, to include their shares of common stock in the registration statement. These registration rights are subject to specified conditions and limitations, including the right of the underwriters to limit the number of shares included in any such registration statement under certain circumstances, but not below 25% of the total number of shares covered by the registration statement.
Expenses of registration
We will pay all expenses relating to any demand registrations, Form S-3 registrations and piggyback registrations, other than underwriting discounts and selling commissions.
-161-
Table of Contents
Termination
The registration rights terminate upon the earliest of (1) the date that is five years after the closing of this offering, and (2) as to a given holder of registration rights, when such holder of registration rights can sell all of such holder’s registrable securities in a 90-day period pursuant to Rule 144 promulgated under the Securities Act.
Voting rights
Under the provisions of our amended and restated certificate of incorporation to become effective upon completion of this offering, holders of our common stock are entitled to one vote for each share of common stock held by such holder on any matter submitted to a vote at a meeting of stockholders. In addition, our amended and restated certificate of incorporation provides that certain corporate actions require the approval of our stockholders. These actions, and the vote required, are as follows:
| • | the removal of a director requires the vote of a majority of the voting power of our issued and outstanding capital stock entitled to vote in the election of directors; and |
| • | the amendment of provisions of our amended and restated certificate of incorporation relating to blank check preferred stock, the classification of our directors, the removal of directors, the filling of vacancies on our board of directors, cumulative voting, and annual and special meetings of our stockholders require the vote of 66 2/3% of our then outstanding voting securities. |
Anti-takeover effects of delaware law and our amended and restated certificate of incorporation and amended and restated bylaws
Delaware law
Certain provisions of Delaware law and our restated certificate of incorporation and bylaws that will become effective upon completion of this offering contain provisions that could have the effect of delaying, deferring or discouraging another party from acquiring control of us. These provisions, which are summarized below, are expected to discourage certain types of coercive takeover practices and inadequate takeover bids. These provisions are also designed in part to encourage anyone seeking to acquire control of us to negotiate with our board of directors. We believe that the advantages gained by protecting our ability to negotiate with any unsolicited and potentially unfriendly acquirer outweigh the disadvantages of discouraging such proposals, including those priced above the then-current market value of our common stock, because, among other reasons, the negotiation of such proposals could improve their terms.
Amended and restated certificate of incorporation and amended and restated bylaws
Our amended and restated certificate of incorporation and amended and restated bylaws to become effective in connection with this offering include provisions that:
| • | authorize our board of directors to issue, without further action by our stockholders, up to 10,000,000 shares of undesignated preferred stock; |
| • | require that any action to be taken by our stockholders be effected at a duly called annual or special meeting and not by written consent; |
-162-
Table of Contents
| • | specify that special meetings of our stockholders can be called only by our board of directors, the chairman of our board of directors, the chief executive officer or the president; |
| • | establish an advance notice procedure for stockholder approvals to be brought before an annual meeting of our stockholders, including proposed nominations of persons for election to our board of directors; |
| • | provide that directors may be removed only for cause; |
| • | provide that vacancies on our board of directors may be filled only by a majority of directors then in office, even though less than a quorum; |
| • | establish that our board of directors is divided into three classes, Class I, Class II and Class III, with each class serving staggered terms; |
| • | specify that no stockholder is permitted to cumulate votes at any election of our board of directors; and |
| • | require a super majority of the stockholders and a majority of the board to amend certain of the above-mentioned provisions. |
Exclusive jurisdiction
Under the provisions of our amended and restated certificate of incorporation to become effective upon the completion of this offering, unless we consent in writing to the selection of an alternative forum, the Court of Chancery of the State of Delaware will be the sole and exclusive forum for: (i) any derivative action or proceeding brought on behalf of us; (ii) any action asserting a claim of breach of a fiduciary duty owed by any of our directors, officers or other employees or agents to us or our stockholders; (iii) any action asserting a claim against us arising pursuant to any provision of the Delaware General Corporation Law or our amended and restated certificate of incorporation or amended and restated bylaws; or (iv) any action asserting a claim against us governed by the internal affairs doctrine. The enforceability of similar choice of forum provisions in other companies’ certificates of incorporation has been challenged in legal proceedings, and it is possible that, in connection with any action, a court could find the choice of forum provisions contained in our amended and restated certificate of incorporation to be inapplicable or unenforceable in such action.
Delaware anti-takeover statute
We are subject to the provisions of Section 203 of the Delaware General Corporation Law regulating corporate takeovers. In general, Section 203 prohibits a publicly-held Delaware corporation from engaging, under certain circumstances, in a business combination with an interested stockholder for a period of three years following the date the person became an interested stockholder unless:
| • | prior to the date of the transaction, our board of directors of the corporation approved either the business combination or the transaction which resulted in the stockholder becoming an interested stockholder; |
| • | upon completion of the transaction that resulted in the stockholder becoming an interested stockholder, the interested stockholder owned at least 85% of the voting stock of the corporation outstanding at the time the transaction commenced, excluding for purposes of |
-163-
Table of Contents
| determining the voting stock outstanding, but not for determining the outstanding voting stock owned by the interested stockholder, (1) shares owned by persons who are directors and also officers, and (2) shares owned by employee stock plans in which employee participants do not have the right to determine confidentially whether shares held subject to the plan will be tendered in a tender or exchange offer; or |
| • | at or subsequent to the date of the transaction, the business combination is approved by our board of directors of the corporation and authorized at an annual or special meeting of stockholders, and not by written consent, by the affirmative vote of at least 66 2/3% of the outstanding voting stock which is not owned by the interested stockholder. |
Generally, a business combination includes a merger, asset or stock sale, or other transaction resulting in a financial benefit to the interested stockholder. An interested stockholder is a person who, together with affiliates and associates, owns or, within three years prior to the determination of interested stockholder status, did own 15% or more of a corporation’s outstanding voting stock. We expect the existence of this provision to have an anti-takeover effect with respect to transactions our board of directors does not approve in advance. We also anticipate that Section 203 may discourage business combinations or other attempts that might result in the payment of a premium over the market price for the shares of common stock held by our stockholders.
The provisions of Delaware law and our restated certificate of incorporation and amended and restated bylaws to become effective upon completion of this offering could have the effect of discouraging others from attempting hostile takeovers and, as a consequence, they may also inhibit temporary fluctuations in the market price of our common stock that often result from actual or rumored takeover attempts. These provisions may also have the effect of preventing changes in our management. It is possible that these provisions could make it more difficult to accomplish transactions that stockholders may otherwise deem to be in their best interests.
Transfer agent and registrar
The transfer agent and registrar for our common stock is Computershare. The transfer agent and registrar’s address is P.O. Box 43006, Providence, RI 02940-3006. The transfer agent’s telephone number is (888) 667-7671.
Listing
We intend to apply to have our common stock approved for listing on the NASDAQ Global Market under the symbol “INGN.”
-164-
Table of Contents
Shares eligible for future sale
Prior to this offering, there has been no public market for our common stock, and although we expect that our common stock will be approved for listing on the NASDAQ Global Market, we cannot assure you that there will be an active public market for our common stock following this offering. We cannot predict what effect, if any, sales of our shares in the public market or the availability of shares for sale will have on the market price of our common stock. Future sales of substantial amounts of common stock in the public market, including shares issued upon exercise of outstanding options, or the perception that such sales may occur, however, could adversely affect the market price of our common stock and also could adversely affect our future ability to raise capital through the sale of our common stock or other equity-related securities at times and prices we believe appropriate.
Upon completion of this offering, based on our shares outstanding as of September 30, 2013 and after giving effect to (1) the automatic conversion of our outstanding convertible preferred stock into an aggregate of 14,218,319 shares of common stock immediately prior to the completion of this offering and (2) the cash exercise of warrants to purchase an aggregate of 24,588 shares of our common stock on or prior to the closing of this offering, shares of our common stock will be outstanding. All of the shares of common stock expected to be sold in this offering will be freely tradable without restriction or further registration under the Securities Act unless held by our “affiliates,” as that term is defined in Rule 144 under the Securities Act. The remaining outstanding shares of our common stock will be deemed “restricted securities” as that term is defined under Rule 144. Restricted securities may be sold in the public market only if their offer and sale is registered under the Securities Act or if the offer and sale of those securities qualify for an exemption from registration, including exemptions provided by Rules 144 and 701 under the Securities Act, which are summarized below.
As a result of the lock-up agreements and market stand-off provisions described below and the provisions of Rules 144 or 701, the shares of our common stock that will be deemed “restricted securities” will be available for sale in the public market following the completion of this offering as follows:
| • | no shares will be eligible for sale on the date of this prospectus; and |
| • | shares will be eligible for sale upon expiration of the lock-up agreements and market stand-off provisions described below, beginning more than 180 days after the date of this prospectus, subject in some cases to applicable volume limitations under Rule 144. |
We may issue shares of our common stock from time to time for a variety of corporate purposes, including in capital-raising activities through future public offerings or private placements, in connection with exercise of stock options, vesting of restricted stock units and other issuances relating to our employee benefit plans and as consideration for future acquisitions, investments or other purposes. The number of shares of our common stock that we may issue may be significant, depending on the events surrounding such issuances. In some cases, the shares we issue may be freely tradable without restriction or further registration under the Securities Act; in other cases, we may grant registration rights covering the shares issued in connection with these issuances, in which case the holders of the common stock will have the right, under certain circumstances, to cause us to register any resale of such shares to the public.
-165-
Table of Contents
Lock-up agreements
We, the selling stockholders, our directors and officers and substantially all of the holders of our equity securities have agreed, subject to certain exceptions, not to offer, sell or transfer any common stock or securities convertible into or exchangeable or exercisable for common stock, for 180 days after the date of this prospectus without first obtaining the written consent of J.P. Morgan Securities LLC on behalf of the underwriters. These agreements are described in the section of this prospectus captioned “Underwriting.”
J.P. Morgan Securities LLC has advised us that they have no present intent or arrangement to release any shares subject to a lock-up, and will consider the release of any lock-up on a case-by-case basis. Upon a request to release any shares subject to a lock-up, J.P. Morgan Securities LLC would consider the particular circumstances surrounding the request, including, but not limited to, the length of time before the lock-up expires, the number of shares requested to be released, reasons for the request, the possible impact on the market of our common stock and whether the holder of our shares requesting the release is an officer, director or other affiliate of ours.
Rule 144
In general, under Rule 144, beginning 90 days after the date of this prospectus, a person who is not our affiliate and has not been our affiliate for purposes of the Securities Act at any time during the preceding three months will be entitled to sell any shares of our common stock that such person has beneficially owned for at least six months, including the holding period of any prior owner other than one of our affiliates, subject only to the availability of current public information about us. Sales of our common stock by any such person would be subject to the availability of current public information about us if the shares to be sold were beneficially owned by such person for less than one year.
In addition, under Rule 144, a person may sell shares of our common stock acquired from us immediately upon the completion of this offering, without regard to the registration requirements of the Securities Act or the availability of public information about us, if:
| • | the person is not our affiliate and has not been our affiliate at any time during the preceding three months; and |
| • | the person has beneficially owned the shares to be sold for at least one year, including the holding period of any prior owner other than one of our affiliates. |
Beginning 90 days after the date of this prospectus, our affiliates who have beneficially owned shares of our common stock for at least six months, including the holding period of any prior owner other than one of our affiliates, would be entitled to sell within any three-month period a number of shares that does not exceed the greater of:
| • | 1% of the number of shares of our common stock then outstanding, which will equal approximately shares immediately after this offering; and |
| • | the average weekly trading volume in our common stock on the NASDAQ Global Market during the four calendar weeks preceding the date of filing of a notice on Form 144 with respect to the sale. |
Sales under Rule 144 by our affiliates are also subject to manner of sale provisions and notice requirements and to the availability of current public information about us. To the extent that
-166-
Table of Contents
shares were acquired from one of our affiliates, a person’s holding period for the purpose of effecting a sale under Rule 144 would commence on the date of transfer from the affiliate.
Rule 701
In general, under Rule 701, an employee, director, officer, consultant or advisor of the Company who purchased shares of our common stock pursuant to a written compensatory plan or contract and who is not deemed to have been one of our affiliates during the immediately preceding 90 days may sell these shares in reliance upon Rule 144, but without being required to comply with the notice, manner of sale or public information requirements or volume limitation provisions of Rule 144. Rule 701 also permits affiliates to sell their Rule 701 shares under Rule 144 without complying with the holding period requirements of Rule 144. All holders of Rule 701 shares, however, are required to wait until 90 days after the date of this prospectus before selling such shares pursuant to Rule 701.
As of September 30, 2013, 240,590 shares of our outstanding common stock had been issued in reliance on Rule 701 as a result of exercises of stock options. All of these shares, however, are subject to lock-up agreements or market stand-off provisions as discussed above, and, as a result, these shares will only become eligible for sale at the earlier of the expiration of the lock-up period or upon obtaining the consent of J.P. Morgan Securities LLC on behalf of the underwriters to release all or any portion of these shares from the lock-up agreements.
Stock options
As of September 30, 2013, options to purchase an aggregate 2,079,338 shares of our common stock were outstanding. We intend to file one or more registration statements on Form S-8 under the Securities Act to register the offer and sale of all shares of our common stock subject to outstanding stock options and all shares issuable under our stock plans. We expect to file the registration statement covering these shares after the date of this prospectus, which will permit the resale of such shares by persons who are non-affiliates of ours in the public market without restriction under the Securities Act, subject, with respect to certain of the shares, to the provisions of the lock-up agreements and market stand-off provisions described above.
Warrants
Upon completion of this offering, warrants entitling holders to purchase an aggregate of 268,200 shares of our common stock at a weighted average exercise price of $1.4216 per share, after conversion of the convertible preferred stock, will remain outstanding. See “Description of capital stock—Warrants” for additional information. Such shares issued upon exercise of the warrants may be able to be sold after the expiration of the lock-up period described above subject to the requirements of Rule 144 described above.
Registration rights
Upon completion of this offering, the holders of approximately 14,462,893 shares of our common stock (including the shares underlying the warrants described in “Description of capital stock—Warrants” above), will be eligible to exercise certain rights to cause us to register their shares for resale under the Securities Act, subject to various conditions and limitations. These registration rights are described under the caption “Description of capital stock—Registration Rights.” Upon the effectiveness of a registration statement covering these shares, the shares would become freely tradable, and a large number of shares may be sold into the public market. If that occurs, the market price of our common stock could be adversely affected.
-167-
Table of Contents
Material U.S. federal income tax consequences
to non-U.S. holders of common stock
The following is a summary of the material U.S. federal income tax consequences to non-U.S. holders (as defined below) of the ownership and disposition of our common stock, but does not purport to be a complete analysis of all the potential tax considerations relating thereto. This summary is based upon the provisions of the Internal Revenue Code of 1986, as amended, or the Code, Treasury regulations promulgated thereunder, administrative rulings and judicial decisions, all as of the date hereof, all of which are subject to change, possibly with retroactive effect, which could result in U.S. federal income consequences different than those summarized below. We have not sought a ruling from the Internal Revenue Service, or the IRS, with respect to the statements made and the conclusions reached in the following summary, and there can be no assurance that the IRS will agree with such statements and conclusions.
This summary does not address the tax considerations arising under the laws of any state, local, non-U.S. or other jurisdiction or under U.S. federal estate and gift tax laws, except to the limited extent set forth below, and is limited to investors who will hold our common stock as a capital asset for tax purposes. This summary does not address the potential application of the Medicare contribution tax or any tax considerations applicable to an investor’s particular circumstances or to investors that may be subject to special rules, such as:
| • | banks, insurance companies or other financial institutions; |
| • | persons subject to the alternative minimum tax; |
| • | tax-exempt organizations; |
| • | controlled foreign corporations, passive foreign investment companies and corporations that accumulate earnings to avoid U.S. federal income tax; |
| • | dealers in securities or currencies; |
| • | traders in securities that elect to use a mark-to-market method of accounting for their securities holdings; |
| • | persons that own, or are deemed to own, more than 5% of our capital stock (except to the extent specifically set forth below); |
| • | certain former citizens or long-term residents of the United States; |
| • | persons who hold our common stock as a position in a hedging transaction, “straddle,” “conversion transaction” or other risk reduction transaction; or |
| • | persons deemed to sell our common stock under the constructive sale provisions of the Code. |
In addition, if a partnership (including any entity classified as a partnership for U.S. federal income tax purposes) holds our common stock, the tax treatment of a partner generally will depend on the status of the partner and upon the activities of the partnership. Accordingly, partnerships that hold our common stock, and partners in such partnerships, should consult their tax advisors.
You are urged to consult your tax advisor with respect to the application of the U.S. federal income tax laws to your particular situation, as well as any tax consequences of the purchase,
-168-
Table of Contents
ownership and disposition of our common stock arising under other U.S. federal tax rules or under the laws of any state, local, non-U.S. or other taxing jurisdiction or under any applicable tax treaty.
Non-U.S. holder defined
For purposes of this discussion, you are a non-U.S. holder if you are a holder other than a partnership (or other entity treated as a partnership for U.S. federal income tax purposes) and not a (1) U.S. citizen or U.S. resident alien, (2) a corporation or other entity taxable as a corporation for U.S. federal income tax purposes that was created or organized in or under the laws of the United States, any state thereof or the District of Columbia, (3) an estate whose income is subject to U.S. federal income taxation regardless of its source, or (4) a trust that either is subject to the supervision of a court within the United States and has one or more U.S. persons with authority to control all of its substantial decisions, or has a valid election in effect under applicable Treasury regulations to be treated as a U.S. person.
Distributions on common stock
We have not made any distributions on our common stock. However, if we make distributions on our common stock, these distributions generally will constitute dividends for U.S. tax purposes to the extent paid from our current or accumulated earnings and profits, as determined under U.S. federal income tax principles. To the extent these distributions exceed both our current and our accumulated earnings and profits, they will constitute a return of capital and will first reduce your basis in our common stock, but not below zero, and then will be treated as gain from the sale of stock as described below.
Subject to the discussion below regarding backup withholding and recent legislation relating to foreign accounts, any dividend paid to you generally will be subject to U.S. withholding either at a rate of 30% of the gross amount of the dividend or such lower rate as may be specified by an applicable income tax treaty. In order to receive a reduced treaty rate, you must provide the applicable withholding agent with an IRS Form W-8BEN or other appropriate version of IRS Form W-8 certifying qualification for the reduced rate. If you are eligible for a reduced rate of withholding pursuant to an income tax treaty, you may obtain a refund of any excess amounts withheld by filing an appropriate claim for refund with the IRS. If you hold our common stock through a financial institution or other agent acting on your behalf, you will be required to provide appropriate documentation to the agent, which then will be required to provide certification to the applicable withholding agent, either directly or through other intermediaries.
Dividends received by you that are effectively connected with your conduct of a U.S. trade or business (and, if an income tax treaty applies, attributable to a permanent establishment maintained by you in the United States) are exempt from such withholding tax. In order to claim this exemption, you must provide the applicable withholding agent with an IRS Form W-8ECI or other applicable IRS Form W-8 properly certifying such exemption. Such effectively connected dividends, although not subject to withholding tax, are taxed at the same graduated U.S. federal income tax rates applicable to U.S. persons, net of certain deductions and credits. In addition, if you are a corporate non-U.S. holder, dividends you receive that are effectively connected with your conduct of a U.S. trade or business may also be subject to a branch profits tax at a rate of 30% or such lower rate as may be specified by an applicable income tax treaty.
-169-
Table of Contents
Gain on disposition of common stock
Subject to the discussion below regarding backup withholding and recent legislation relating to foreign accounts, you generally will not be subject to U.S. federal income tax on any gain realized upon the sale or other disposition of our common stock unless:
| • | the gain is effectively connected with your conduct of a U.S. trade or business (and, if an income tax treaty applies, the gain is attributable to a permanent establishment maintained by you in the United States); |
| • | you are an individual who is present in the United States for a period or periods aggregating 183 days or more during the calendar year in which the sale or disposition occurs and certain other conditions are met; or |
| • | our common stock constitutes a U.S. real property interest by reason of our status as a “United States real property holding corporation,” or USRPHC, for U.S. federal income tax purposes at any time within the shorter of the five-year period preceding your disposition of our common stock and your holding period for our common stock. |
If you are a non-U.S. holder described in the first bullet above, you will be required to pay tax on the net gain derived from the sale at regular graduated U.S. federal income tax rates applicable to U.S. persons (net of certain deductions and credits), and if you are a corporate non-U.S. holder, you may also be subject to branch profits tax at a rate of 30% or such lower rate as may be specified by an applicable income tax treaty. If you are a non-U.S. holder described in the second bullet above, you will be required to pay a flat 30% tax on the gain derived from the sale, which tax may be offset by U.S. source capital losses (even though you are not considered a resident of the United States).
We believe that we are not currently and will not become a USRPHC. However, because the determination of whether we are a USRPHC depends on the fair market value of our U.S. real property relative to the fair market value of our other business assets, there can be no assurance that we will not become a USRPHC in the future. Even if we become a USRPHC, however, as long as our common stock is regularly traded on an established securities market, our common stock will be treated as a U.S. real property interest only if you actually or constructively hold more than 5% of such regularly traded common stock at any time during the shorter of the five-year period preceding your disposition of our common stock or your holding period for our common stock.
Federal estate tax
Our common stock beneficially owned by an individual who is not a citizen or resident of the United States (as defined for U.S. federal estate tax purposes) at the time of death generally will be includable in the decedent’s gross estate for U.S. federal estate tax purposes, unless an applicable estate tax treaty provides otherwise.
Backup withholding and information reporting
Generally, we must report annually to the IRS the amount of dividends paid to you, your name and address, and the amount of tax withheld, if any. A similar report will be sent to you. Pursuant to applicable income tax treaties or other agreements, the IRS may make these reports available to tax authorities in your country of residence.
-170-
Table of Contents
Payments of dividends on, or the gross proceeds of a disposition of, our common stock may be subject to additional information reporting and backup withholding at a current rate of 28% unless you establish an exemption, for example by properly certifying your non-U.S. status on an IRS Form W-8BEN or another appropriate version of IRS Form W-8. Notwithstanding the foregoing, backup withholding and information reporting may apply if either we or our paying agent has actual knowledge, or reason to know, that you are a U.S. person.
Backup withholding is not an additional tax. Any amounts withheld from a payment to you under the backup withholding rules will be allowed as a credit against your U.S. federal income tax liability and may entitle you to a refund, provided that the required information or returns are furnished to the IRS in a timely manner.
Recent legislation relating to foreign accounts
Legislation enacted in 2010 generally will impose a U.S. federal withholding tax of 30% on dividends on, and the gross proceeds of a disposition of, our common stock paid to a “foreign financial institution” (as specifically defined for this purpose) unless such institution enters into an agreement with the U.S. government to withhold on certain payments and to collect and provide to the U.S. tax authorities substantial information regarding U.S. account holders of such institution (which may include certain equity and debt holders of such institution, as well as certain account holders that are foreign entities with U.S. owners) or otherwise establishes an exemption. The legislation also will generally impose a U.S. federal withholding tax of 30% on dividends and the gross proceeds of a disposition of our common stock to a non-financial foreign entity unless such entity provides the withholding agent with a certification identifying certain substantial direct and indirect U.S. owners of the entity, certifies that there are none or otherwise establishes an exemption. This withholding obligation under this legislation with respect to dividends on our common stock will not begin until July 1, 2014 and with respect to the gross proceeds of a sale or other disposition of our common stock will not begin until January 1, 2017. Under certain circumstances, a non-U.S. holder might be eligible for refunds or credits of such taxes. An intergovernmental agreement between the United States and an applicable foreign country may modify the requirements described in this paragraph. Prospective investors are encouraged to consult with their tax advisors regarding the possible implications of this legislation on their investment in our common stock.
Each prospective investor should consult its tax advisor regarding the particular U.S. federal, state and local and non-U.S. tax consequences of purchasing, holding and disposing of our common stock, including the consequences of any proposed change in applicable laws.
-171-
Table of Contents
We and the selling stockholders are offering the shares of common stock described in this prospectus through a number of underwriters. J.P. Morgan Securities LLC is acting as book-running manager of the offering and as representative of the underwriters. We and the selling stockholders have entered into an underwriting agreement with the underwriters. Subject to the terms and conditions of the underwriting agreement, we and the selling stockholders have severally agreed to sell to the underwriters, and each underwriter has severally agreed to purchase, at the public offering price less the underwriting discounts and commissions set forth on the cover page of this prospectus, the number of shares of common stock listed next to its name in the following table:
| Underwriter |
Number of shares | |
|
| ||
| J.P. Morgan Securities LLC |
||
| Leerink Partners LLC |
||
| William Blair & Company, L.L.C. |
||
| Stifel, Nicolaus & Company, Incorporated |
||
|
| ||
| Total |
||
|
| ||
The underwriters are committed to purchase all the common shares offered by us and the selling stockholders if they purchase any shares. The underwriting agreement also provides that if an underwriter defaults, the purchase commitments of non-defaulting underwriters may also be increased or the offering may be terminated.
The underwriters propose to offer the common shares directly to the public at the initial public offering price set forth on the cover page of this prospectus and to certain dealers at that price less a concession not in excess of $ per share. After the initial public offering of the shares, the offering price and other selling terms may be changed by the underwriters. Sales of shares made outside of the United States may be made by affiliates of the underwriters. The representatives have advised us that the underwriters do not intend to confirm discretionary sales in excess of 5% of the common shares offered in this offering.
The underwriters have an option to buy up to additional shares of common stock from the selling stockholders to cover sales of shares by the underwriters which exceed the number of shares specified in the table above. The underwriters have 30 days from the date of this prospectus to exercise this option to purchase additional shares. If any shares are purchased with this option, the underwriters will purchase shares in approximately the same proportion as shown in the table above. Any shares purchased by the underwriters will be allocated among the selling stockholders on a pro rata basis based on the number of shares such selling stockholder has agreed to sell pursuant to the option. If any additional shares of common stock are purchased, the underwriters will offer the additional shares on the same terms as those on which the shares are being offered.
-172-
Table of Contents
The underwriting fee is equal to the public offering price per share of common stock less the amount paid by the underwriters to us and the selling stockholders per share of common stock. The underwriting fee is $ per share. The following tables show the per share and total underwriting discounts and commissions to be paid to the underwriters assuming both no exercise and full exercise of the underwriters’ option to purchase additional shares.
| Paid by us | Without over-allotment exercise |
With full over-allotment exercise |
||||||
|
|
||||||||
| Per share |
$ | $ | ||||||
| Total |
$ | $ | ||||||
|
|
||||||||
| Paid by the selling stockholders | Without over-allotment exercise |
With full over-allotment exercise |
||||||
|
|
||||||||
| Per share |
$ | $ | ||||||
| Total |
$ | $ | ||||||
|
|
||||||||
We estimate that the total expenses of this offering, including registration, filing and listing fees, printing fees and legal and accounting expenses, but excluding the underwriting discounts and commissions, will be approximately $ . We have agreed to reimburse the underwriters for certain expenses, including up to an aggregate of $45,000 in connection with the clearance of this offering with the Financial Industry Regulatory Authority, as set forth in the underwriting agreement.
A prospectus in electronic format may be made available on the web sites maintained by one or more underwriters, or selling group members, if any, participating in the offering. The underwriters may agree to allocate a number of shares to underwriters and selling group members for sale to their online brokerage account holders. Internet distributions will be allocated by the representatives to underwriters and selling group members that may make Internet distributions on the same basis as other allocations.
We, all of our directors and executive officers and holders of substantially all of our common stock and securities exercisable for or convertible into our common stock outstanding immediately prior to this offering have agreed not to (1) offer, pledge, sell, contract to sell, sell any option or contract to purchase, purchase any option or contract to sell, grant any option, right or warrant to purchase, or otherwise transfer or dispose of, directly or indirectly, or file with the SEC a registration statement under the Securities Act relating to, any shares of our common stock or securities convertible into or exchangeable or exercisable for any shares of our common stock (including, without limitation, common stock or such other securities which may be deemed to be beneficially owned by such directors, executive officers and security holders in accordance with the rules and regulations of the SEC and securities which may be issued upon exercise of a stock option or warrant), or publicly disclose the intention to make any offer, sale, pledge, disposition or filing, (2) enter into any swap or other agreement that transfers, in whole or in part, any of the economic consequences of ownership of any shares of our common stock or any such other securities (whether any such transactions described in clause (1) or (2) above is to be settled by the delivery of shares of common stock or such other securities, in cash or otherwise) or (3) in the case of our directors, executive officers and holders of common stock and securities exercisable for or convertible into our common stock outstanding immediately prior to this offering, make any demand for or exercise any right with respect to the registration of any
-173-
Table of Contents
shares of our common stock or any security convertible into or exercisable or exchangeable for our common stock, in each case without the prior written consent of J.P. Morgan Securities LLC for a period of 180 days after the date of this prospectus.
In our case, such restrictions shall not apply to:
| • | the shares of our common stock to be sold in this offering; |
| • | any shares of our common stock issued upon the exercise of options or warrants or the conversion of a security outstanding on the date of the underwriting agreement and described in this prospectus; |
| • | the grant of options or the issuance of shares of common stock by us to our employees, officers, directors, advisors or consultants pursuant to employee benefit plans in effect on the date of the underwriting agreement and as described in this prospectus; |
| • | the filing by us of a registration statement with the Commission on Form S-8 in respect of any shares issued under or the grant of any award pursuant to an employee benefit plan described herein; or |
| • | the sale or issuance of or entry into an agreement to sell or issue shares of our common stock or securities convertible into or exercisable or exchangeable for our common stock in connection with any (1) mergers, (2) acquisition of securities, businesses, property or other assets, (3) joint ventures, (4) strategic alliances, (5) partnerships with experts or other talent to develop or provide content, (6) equipment leasing arrangements or (7) debt financing, provided that the aggregate number of shares of our common stock or securities convertible into or exercisable for common stock (on an as-converted or as-exercised basis, as the case may be) that we may sell or issue or agree to sell or issue as described in this bullet point shall not exceed 5% of the total number of shares of our common stock issued and outstanding immediately following the completion of this offering, and provided, further, that each recipient of shares of our common stock or securities convertible into or exercisable for our common stock pursuant to this bullet point shall execute and deliver to J.P. Morgan Securities LLC a lock-up agreement. |
In the case of our directors, executive officers and holders of our common stock, and subject to certain conditions, such restrictions shall not apply to:
| • | the sale of shares of our common stock to the underwriters; |
| • | sales of shares of our common stock or other securities acquired in open market transactions after the completion of this offering, provided, that no filing under Section 16 of the Exchange Act or other public announcement is required or voluntarily made in connection with subsequent sales of the acquired securities; |
| • | transfers of shares of our common stock or any securities convertible into or exercisable or exchangeable for common stock (1) by bona fide gift, will or intestacy, (2) to the spouse, domestic partner, parent, child or grandchild of the director, executive officer or security holder, or to a trust for the benefit of such spouse, domestic partner, parent, child or grandchild, (3) if the director, executive officer or security holder is a corporation, partnership or other business entity (a) to another corporation, partnership or other business entity that controls, is controlled by or is under common control with it or (b) as part of a disposition, transfer or distribution without consideration by such director, executive officer or security |
-174-
Table of Contents
| holder to its equity holders, or (4) if the director, executive officer or security holder is a trust, to a trustee or beneficiary of the trust, provided that, in each case, the transferee agrees to be bound by the terms of the lock-up agreement and no filing under Section 16 of the Exchange Act reporting a reduction in beneficial ownership or other public announcement is required or voluntarily made; |
| • | transfers of shares of our common stock or any security convertible into common stock to us upon a vesting event of our securities or upon the exercise of options or warrants to purchase our securities, in each case on a “cashless” or “net exercise” basis or to cover tax withholding obligations of the director, executive officer or security holder in connection with such vesting or exercise, but only to the extent that such right expires during the lock up period; |
| • | the establishment of a trading plan pursuant to Rule 10b5-1 under the Exchange Act for the transfer of shares of our common stock; provided that such plan does not provide for the transfer of common stock during the lock-up period and no public announcement or filing under the Exchange Act is required or made voluntarily by the director, executive officer, security holder or us; or |
| • | transfers of shares of our common stock or any security convertible into or exercisable or exchangeable for our common stock pursuant to a bona fide third-party tender offer, merger, consolidation or other similar transaction made to all holders of our common stock involving a change of control of our company. |
We and the selling stockholders have agreed to indemnify the underwriters against certain liabilities, including liabilities under the Securities Act of 1933.
We will apply to have our common stock approved for listing on the NASDAQ Global Market under the symbol “INGN.”
In connection with this offering, the underwriters may engage in stabilizing transactions, which involves making bids for, purchasing and selling shares of common stock in the open market for the purpose of preventing or retarding a decline in the market price of the common stock while this offering is in progress. These stabilizing transactions may include making short sales of the common stock, which involves the sale by the underwriters of a greater number of shares of common stock than they are required to purchase in this offering, and purchasing shares of common stock on the open market to cover positions created by short sales. Short sales may be “covered” shorts, which are short positions in an amount not greater than the underwriters’ over-allotment option referred to above, or may be “naked” shorts, which are short positions in excess of that amount. The underwriters may close out any covered short position either by exercising their over-allotment option, in whole or in part, or by purchasing shares in the open market. In making this determination, the underwriters will consider, among other things, the price of shares available for purchase in the open market compared to the price at which the underwriters may purchase shares through the over-allotment option. A naked short position is more likely to be created if the underwriters are concerned that there may be downward pressure on the price of the common stock in the open market that could adversely affect investors who purchase in this offering. To the extent that the underwriters create a naked short position, they will purchase shares in the open market to cover the position.
The underwriters have advised us that, pursuant to Regulation M of the Securities Act of 1933, they may also engage in other activities that stabilize, maintain or otherwise affect the price of
-175-
Table of Contents
the common stock, including the imposition of penalty bids. This means that if the representatives of the underwriters purchase common stock in the open market in stabilizing transactions or to cover short sales, the representatives can require the underwriters that sold those shares as part of this offering to repay the underwriting discount received by them.
These activities may have the effect of raising or maintaining the market price of the common stock or preventing or retarding a decline in the market price of the common stock, and, as a result, the price of the common stock may be higher than the price that otherwise might exist in the open market. If the underwriters commence these activities, they may discontinue them at any time. The underwriters may carry out these transactions on the NASDAQ Global Market, in the over-the-counter market or otherwise.
Prior to this offering, there has been no public market for our common stock. The initial public offering price will be determined by negotiations between us and the representatives of the underwriters. In determining the initial public offering price, we and the representatives of the underwriters expect to consider a number of factors including:
| • | the information set forth in this prospectus and otherwise available to the representatives; |
| • | our prospects and the history and prospects for the industry in which we compete; |
| • | an assessment of our management; |
| • | our prospects for future earnings; |
| • | the general condition of the securities markets at the time of this offering; |
| • | the recent market prices of, and demand for, publicly traded common stock of generally comparable companies; and |
| • | other factors deemed relevant by the underwriters and us. |
Neither we, the selling stockholders, nor the underwriters can assure investors that an active trading market will develop for our common shares, or that the shares will trade in the public market at or above the initial public offering price.
Relationships with underwriters
The underwriters and their respective affiliates are full-service financial institutions engaged in various activities, which may include securities trading, commercial and investment banking, financial advisory, investment management, investment research, principal investment, hedging, financing, and brokerage activities. The underwriters and their affiliates have not, during the 180-day period preceding the date of the initial filing of the Registration Statement on Form S-1 of which this prospectus forms a part, but may, in the future, provide from time to time certain commercial banking, financial advisory, investment banking and other services for us and such affiliates in the ordinary course of their business, for which they may receive customary fees and commissions. Except as disclosed in this prospectus, we have no present arrangements with any of the underwriters for any further services. In addition, from time to time, certain of the underwriters and their affiliates may effect transactions for their own account or the account of customers, and hold on behalf of themselves or their customers, long or short positions in our debt or equity securities or loans, and may do so in the future.
-176-
Table of Contents
Selling restrictions outside the United States
Other than in the United States, no action has been taken by us or the underwriters that would permit a public offering of the securities offered by this prospectus in any jurisdiction where action for that purpose is required. The shares of common stock offered by this prospectus may not be offered or sold, directly or indirectly, nor may this prospectus or any other offering material or advertisements in connection with the offer and sale of any such securities be distributed or published in any jurisdiction, except under circumstances that will result in compliance with the applicable rules and regulations of that jurisdiction. Persons into whose possession this prospectus comes are advised to inform themselves about and to observe any restrictions relating to the offering and the distribution of this prospectus. This prospectus does not constitute an offer to sell or a solicitation of an offer to buy any securities offered by this prospectus in any jurisdiction in which such an offer or a solicitation is unlawful.
This document is only being distributed to and is only directed at (i) persons who are outside the United Kingdom or (ii) to investment professionals falling within Article 19(5) of the Financial Services and Markets Act 2000 (Financial Promotion) Order 2005, referred to as the Order, or (iii) high net worth entities, and other persons to whom it may lawfully be communicated, falling with Article 49(2)(a) to (d) of the Order, all such persons together being referred to as relevant persons. The shares of common stock are only available to, and any invitation, offer or agreement to subscribe, purchase or otherwise acquire such securities will be engaged in only with, relevant persons. Any person who is not a relevant person should not act or rely on this document or any of its contents.
Notice to prospective investors in the European Economic Area
In relation to each Member State of the European Economic Area which has implemented the Prospectus Directive, each referred to as a Relevant Member State, from and including the date, or Relevant Implementation Date, on which the European Union Prospectus Directive, or EU Prospectus Directive, was implemented in that Relevant Member State, an offer of shares of common stock described in this prospectus may not be made to the public in that Relevant Member State prior to the publication of a prospectus in relation to the shares which has been approved by the competent authority in that Relevant Member State or, where appropriate, approved in another Relevant Member State and notified to the competent authority in that Relevant Member State, all in accordance with the EU Prospectus Directive, except that, with effect from and including the Relevant Implementation Date, an offer of securities described in this prospectus may be made to the public in that Relevant Member State at any time:
| • | to any legal entity which is a qualified investor as defined under the EU Prospectus Directive; |
| • | to fewer than 100 or, if the Relevant Member State has implemented the relevant provision of the 2010 PD Amending Directive, 150 natural or legal persons (other than qualified investors as defined in the EU Prospectus Directive), as permitted under the EU Prospectus Directive, subject to obtaining the prior consent of J.P. Morgan Securities LLC for any such offer; or |
| • | in any other circumstances falling within Article 3(2) of the EU Prospectus Directive, provided that no such offer of securities described in this prospectus shall result in a requirement for the publication by us of a prospectus pursuant to Article 3 of the EU Prospectus Directive. |
For the purposes of this provision, the expression an “offer of securities to the public” in relation to any securities in any Relevant Member State means the communication in any form and by any
-177-
Table of Contents
means of sufficient information on the terms of the offer and the shares of common stock to be offered so as to enable an investor to decide to purchase or subscribe for the shares, as the same may be varied in that Member State by any measure implementing the EU Prospectus Directive in that Member State. The expression “EU Prospectus Directive” means Directive 2003/71/EC (and any amendments thereto, including the 2010 PD Amending Directive, to the extent implemented in the Relevant Member State) and includes any relevant implementing measure in each Relevant Member State, and the expression “2010 PD Amending Directive” means Directive 2010/73/EU.
Notice to prospective investors in the United Kingdom
Each underwriter has represented and agreed that:
(a) it has only communicated or caused to be communicated and will only communicate or cause to be communicated an invitation or inducement to engage in investment activity (within the meaning of Section 21 of the FSMA) received by it in connection with the issue or sale of the shares in circumstances in which Section 21(1) of the FSMA does not apply to the Issuer; and
(b) it has complied and will comply with all applicable provisions of the FSMA with respect to anything done by it in relation to the shares in, from or otherwise involving the United Kingdom.
Notice to prospective investors in Switzerland
The shares may not be publicly offered in Switzerland and will not be listed on the SIX Swiss Exchange, or the SIX, or on any other stock exchange or regulated trading facility in Switzerland. This document has been prepared without regard to the disclosure standards for issuance prospectuses under art. 652a or art. 1156 of the Swiss Code of Obligations or the disclosure standards for listing prospectuses under art. 27 ff. of the SIX Listing Rules or the listing rules of any other stock exchange or regulated trading facility in Switzerland. Neither this prospectus nor any other offering or marketing material relating to the shares or the offering may be publicly distributed or otherwise made publicly available in Switzerland. Neither this prospectus nor any other offering or marketing material relating to the offering, the Company, the shares have been or will be filed with or approved by any Swiss regulatory authority. In particular, this document will not be filed with, and the offer of shares will not be supervised by, the Swiss Financial Market Supervisory Authority FINMA, and the offer of shares has not been and will not be authorized under the Swiss Federal Act on Collective Investment Schemes, or the CISA. The investor protection afforded to acquirers of interests in collective investment schemes under the CISA does not extend to acquirers of shares.
Notice to prospective investors in Hong Kong
The shares may not be offered or sold by means of any document other than (i) in circumstances which do not constitute an offer to the public within the meaning of the Companies Ordinance (Cap.32, Laws of Hong Kong), or (ii) to “professional investors” within the meaning of the Securities and Futures Ordinance (Cap.571, Laws of Hong Kong) and any rules made thereunder, or (iii) in other circumstances which do not result in the document being a “prospectus” within the meaning of the Companies Ordinance (Cap.32, Laws of Hong Kong), and no advertisement, invitation or document relating to the shares may be issued or may be in the possession of any person for the purpose of issue (in each case whether in Hong Kong or elsewhere), which is directed at, or the contents of which are likely to be accessed or read by, the public in Hong Kong
-178-
Table of Contents
(except if permitted to do so under the laws of Hong Kong) other than with respect to shares which are or are intended to be disposed of only to persons outside Hong Kong or only to “professional investors” within the meaning of the Securities and Futures Ordinance (Cap. 571, Laws of Hong Kong) and any rules made thereunder.
Notice to prospective investors in Singapore
This prospectus has not been registered as a prospectus with the Monetary Authority of Singapore. Accordingly, this prospectus and any other document or material in connection with the offer or sale, or invitation for subscription or purchase, of the shares may not be circulated or distributed, nor may the shares be offered or sold, or be made the subject of an invitation for subscription or purchase, whether directly or indirectly, to persons in Singapore other than (i) to an institutional investor under Section 274 of the Securities and Futures Act, Chapter 289 of Singapore, or the SFA, (ii) to a relevant person, or any person pursuant to Section 275(1A), and in accordance with the conditions, specified in Section 275 of the SFA or (iii) otherwise pursuant to, and in accordance with the conditions of, any other applicable provision of the SFA.
Where the shares are subscribed or purchased under Section 275 by a relevant person which is: (a) a corporation (which is not an accredited investor) the sole business of which is to hold investments and the entire share capital of which is owned by one or more individuals, each of whom is an accredited investor; or (b) a trust (where the trustee is not an accredited investor) whose sole purpose is to hold investments and each beneficiary is an accredited investor, shares, debentures and units of shares and debentures of that corporation or the beneficiaries’ rights and interest in that trust shall not be transferable for 6 months after that corporation or that trust has acquired the shares under Section 275 except: (1) to an institutional investor under Section 274 of the SFA or to a relevant person, or any person pursuant to Section 275(1A), and in accordance with the conditions, specified in Section 275 of the SFA; (2) where no consideration is given for the transfer; or (3) by operation of law.
Notice to prospective investors in Japan
The securities have not been and will not be registered under the Financial Instruments and Exchange Law of Japan (the Financial Instruments and Exchange Law) and each underwriter has agreed that it will not offer or sell any securities, directly or indirectly, in Japan or to, or for the benefit of, any resident of Japan (which term as used herein means any person resident in Japan, including any corporation or other entity organized under the laws of Japan), or to others for re-offering or resale, directly or indirectly, in Japan or to a resident of Japan, except pursuant to an exemption from the registration requirements of, and otherwise in compliance with, the Financial Instruments and Exchange Law and any other applicable laws, regulations and ministerial guidelines of Japan.
-179-
Table of Contents
The validity of the shares of common stock offered hereby will be passed upon for us by Wilson Sonsini Goodrich & Rosati, Professional Corporation, Los Angeles, California. Latham & Watkins LLP, Costa Mesa, California is representing the underwriters.
The financial statements as of and for the year ended December 31, 2012 included in this Registration Statement have been so included in reliance on the report of BDO USA, LLP, an independent registered public accounting firm, appearing elsewhere herein, given on the authority of said firm as experts in auditing and accounting. The financial statements as of and for the year ended December 31, 2011 included in this Registration Statement have been so included in reliance on the report of Macias Gini & O’Connell LLP, an independent registered public accounting firm, appearing elsewhere herein, given on the authority of said firm as experts in auditing and accounting.
Change in independent registered public accounting firm
Our audit committee previously engaged BDO USA, LLP to audit our financial statements for the year ended December 31, 2011 and 2012. In July 2013, our audit committee engaged Macias Gini & O’Connell LLP (MGO), solely to audit our financial statements for the year ended December 31, 2011 due to the fact that BDO USA, LLP was not independent with regard to our financial statements for the year ended December 31, 2011. MGO’s report for our financial statements for the year ended December 31, 2011 did not contain an adverse opinion or disclaimer of opinion and was not qualified or modified as to uncertainty, audit scope or accounting principles.
During the period in which MGO served as our independent accountant, there were no disagreements between MGO and us on any matter of accounting principles or practices, financial statements disclosure or auditing scope or procedure, which disagreements, if not resolved to the satisfaction of MGO, would have caused MGO to make reference to such disagreements in the firm’s reports on our financial statements for such periods. In addition, no reportable events, as defined in Item 304 (a)(1)(v) of Regulation S-K, occurred during our two most recent fiscal years or the interim period preceding MGO’s resignation as our independent auditor.
We have provided MGO with a copy of the foregoing disclosure and have requested that MGO furnish us with a letter addressed to the SEC stating whether or not MGO agrees with the above statements and, if not, stating the respects in which it does not agree. A copy of the letter from MGO, in which MGO agrees with the above statements, is filed as an exhibit to the registration statement of which this prospectus is a part.
-180-
Table of Contents
Where you can find additional information
We have filed with the SEC a registration statement on Form S-1 under the Securities Act with respect to the shares of our common stock offered by this prospectus. This prospectus, which constitutes a part of the registration statement, does not contain all of the information set forth in the registration statement, some items of which are contained in exhibits and schedules to the registration statement as permitted by the rules and regulations of the SEC. For further information with respect to us and our common stock, we refer you to the registration statement, including the exhibits and schedules filed as a part of the registration statement. Statements contained in this prospectus concerning the contents of any contract or any other document are summaries and do not necessarily contain all of the terms or information set forth in such contract or document. If a contract or document has been filed as an exhibit to the registration statement, please see the copy of the contract or document that has been filed. Each statement in this prospectus relating to a contract or document filed as an exhibit is qualified in all respects by the filed exhibit.
You may read and copy the registration statement, including the exhibits and schedules thereto, at the Public Reference Room of the SEC, 100 F Street, N.E., Washington, D.C. 20549. You may obtain information on the operation of the Public Reference Room by calling the SEC at 1-800-SEC-0330. The SEC also maintains an Internet website that contains reports, proxy statements and other information about issuers, like us, that file electronically with the SEC. The address of that website is www.sec.gov. We also maintain a website at www.inogen.com, at which you may access these materials free of charge as soon as reasonably practicable after they are electronically filed with, or furnished to, the SEC. Information contained on our website is not a part of this prospectus and the inclusion of our website address in this prospectus is an inactive textual reference only.
Upon completion of this offering, we will become subject to the information and reporting requirements of the Exchange Act and, in accordance with this law, will file periodic reports, proxy statements and other information with the SEC. These periodic reports, proxy statements and other information will be available for inspection and copying at the SEC’s public reference facilities and the website of the SEC referred to above.
-181-
Table of Contents
Contents
Financial statements
As of and for the years ended
December 31, 2012 and 2011
F-1
Table of Contents
Report of independent registered public accounting firm
Board of Directors and Stockholders
Inogen, Inc.
Goleta, California
We have audited the accompanying balance sheet of Inogen, Inc. (Company) as of December 31, 2012 and the related statements of operations, redeemable convertible preferred stock and stockholders’ deficit, and cash flows for the year then ended. These financial statements are the responsibility of the Company’s management. Our responsibility is to express an opinion on these financial statements based on our audit.
We conducted our audit in accordance with the standards of the Public Company Accounting Oversight Board (United States). Those standards require that we plan and perform the audit to obtain reasonable assurance about whether the financial statements are free of material misstatement. The Company is not required to have, nor were we engaged to perform, an audit of its internal control over financial reporting. Our audit included consideration of internal control over financial reporting as a basis for designing audit procedures that are appropriate in the circumstances, but not for the purpose of expressing an opinion on the effectiveness of the Company’s internal control over financial reporting. Accordingly, we express no such opinion. An audit also includes examining, on a test basis, evidence supporting the amounts and disclosures in the financial statements, assessing the accounting principles used and significant estimates made by management, as well as evaluating the overall presentation of the financial statements. We believe that our audit provides a reasonable basis for our opinion.
In our opinion, the financial statements referred to above present fairly, in all material respects, the financial position of Inogen, Inc. at December 31, 2012, and the results of its operations and its cash flows for the year then ended, in conformity with accounting principles generally accepted in the United States of America.
As discussed in Note 10 to the financial statements, the financial statements as of and for the year ended December 31, 2012 have been restated to correct misstatements related to accounting for rental revenue and related expenses as well as the valuation of warrants.
/s/ BDO USA, LLP
Los Angeles, California
October 15, 2013, except for the reverse stock split disclosed in Note 11 which is as of November 12, 2013
F-2
Table of Contents
Report of independent registered public accounting firm
Board of Directors and Stockholders
Inogen, Inc.
Goleta, California
We have audited the accompanying balance sheet of Inogen, Inc. (Company) as of December 31, 2011 and the related statements of operations, redeemable convertible preferred stock, stockholders’ deficit, and cash flows for the year then ended. The Company’s management is responsible for these financial statements. Our responsibility is to express an opinion on these financial statements based on our audit.
We conducted our audit in accordance with the standards of the Public Company Accounting Oversight Board (United States). Those standards require that we plan and perform the audit to obtain reasonable assurance about whether the financial statements are free of material misstatement. The Company is not required to have, nor were we engaged to perform, an audit of its internal control over financial reporting. Our audit included consideration of internal control over financial reporting as a basis for designing audit procedures that are appropriate in the circumstances, but not for the purpose of expressing an opinion on the effectiveness of the Company’s internal control over financial reporting. Accordingly, we express no such opinion. An audit also includes examining, on a test basis, evidence supporting the amounts and disclosures in the financial statements, assessing the accounting principles used and significant estimates made by management, as well as evaluating the overall financial statement presentation. We believe that our audit provides a reasonable basis for our opinion.
As described in Note 10 the Company has restated its previously issued financial statements for the year ended December 31, 2011.
In our opinion, the financial statements referred to above present fairly, in all material respects, the financial position of the Company at December 31, 2011, and the results of its operations and its cash flows for the year then ended, in conformity with accounting principles generally accepted in the United States of America.
/s/ Macias Gini & O’Connell LLP
Los Angeles, California
October 15, 2013, except for the reverse stock split disclosed in Note 11 which is as of November 12, 2013
F-3
Table of Contents
Balance sheets
(amounts in thousands)
| As of December 31, | ||||||||
| 2012 (restated) |
2011 (restated) |
|||||||
|
|
||||||||
| Assets |
||||||||
| Current assets |
||||||||
| Cash and cash equivalents |
$ | 15,112 | $ | 3,906 | ||||
| Accounts receivable, net of allowances of $2,061 and $1,882 at December 31, 2012 and 2011, respectively |
7,031 | 4,369 | ||||||
| Inventories |
4,059 | 1,665 | ||||||
| Deferred cost of rental revenue |
159 | 70 | ||||||
| Prepaid expenses and other current assets |
309 | 433 | ||||||
|
|
|
|||||||
| Total current assets |
26,670 | 10,443 | ||||||
|
|
|
|||||||
| Property and equipment |
||||||||
| Rental equipment |
24,939 | 15,015 | ||||||
| Manufacturing equipment and tooling |
2,682 | 1,598 | ||||||
| Computer equipment and software |
2,290 | 1,280 | ||||||
| Furniture and equipment |
462 | 261 | ||||||
| Leasehold improvements |
499 | 408 | ||||||
| Construction in process |
46 | 421 | ||||||
|
|
|
|||||||
| Total property and equipment |
30,918 | 18,983 | ||||||
|
|
|
|||||||
| Less accumulated depreciation and amortization |
(10,639 | ) | (6,140 | ) | ||||
|
|
|
|||||||
| Property and equipment, net |
20,279 | 12,843 | ||||||
|
|
|
|||||||
| Intangible assets, net |
558 | 793 | ||||||
| Other assets |
79 | 52 | ||||||
|
|
|
|||||||
| Total assets |
$ | 47,586 | $ | 24,131 | ||||
|
|
||||||||
See accompanying notes to financial statements.
F-4
Table of Contents
Inogen, Inc.
Balance sheets (continued)
(amounts in thousands, except share and per share amounts)
| As of December 31, | ||||||||
| 2012 (restated) |
2011 (restated) |
|||||||
|
|
||||||||
| Liabilities, redeemable convertible preferred stock and stockholders’ deficit |
||||||||
| Current liabilities |
||||||||
| Accounts payable and accrued expenses |
$ | 8,335 | $ | 5,737 | ||||
| Current portion of long-term debt |
3,879 | 2,532 | ||||||
| Warranty reserve |
447 | 250 | ||||||
| Deferred revenue |
1,094 | 594 | ||||||
| Income tax payable |
25 | 21 | ||||||
| Deferred income taxes, net |
10 | 7 | ||||||
|
|
|
|||||||
| Total current liabilities |
13,790 | 9,141 | ||||||
|
|
|
|||||||
| Long-term liabilities |
||||||||
| Preferred stock warrant liability |
164 | 337 | ||||||
| Long-term debt, net of current portion |
5,057 | 7,097 | ||||||
|
|
|
|||||||
| Total liabilities |
19,011 | 16,575 | ||||||
|
|
|
|||||||
| Commitments and contingencies (Note 6) |
||||||||
| Redeemable convertible preferred stock |
||||||||
| Preferred stock, $0.001 par value per share; 9,606,450 and 6,769,657 shares authorized; 9,455,730 and 6,590,986 shares issued and outstanding; liquidation preference of $134,779 and $94,362 at December 31, 2012 and 2011, respectively |
109,345 | 83,122 | ||||||
| Stockholders’ deficit |
||||||||
| Preferred stock, $0.001 par value per share; 66,666 shares authorized; 66,666 shares issued and outstanding; liquidation preference of $250 at both December 31, 2012 and 2011 |
247 | 247 | ||||||
| Common stock, $0.001 par value per share; 18,333,333 and 15,000,000 shares authorized; 272,096 and 250,440 shares issued and outstanding at December 31, 2012 and 2011, respectively |
1 | 1 | ||||||
| Accumulated deficit |
(81,018 | ) | (75,814 | ) | ||||
|
|
|
|||||||
| Total stockholders’ deficit |
(80,770 | ) | (75,566 | ) | ||||
|
|
|
|||||||
| Total liabilities, redeemable convertible preferred stock and stockholders’ deficit |
$ | 47,586 | $ | 24,131 | ||||
|
|
||||||||
See accompanying notes to financial statements.
F-5
Table of Contents
Statements of operations
(amounts in thousands, except share and per share amounts)
| Year ended December 31, |
||||||||
| 2012 (restated) |
2011 (restated) |
|||||||
|
|
||||||||
| Revenue |
||||||||
| Sales revenue |
$ | 28,077 | $ | 19,076 | ||||
| Rental revenue |
19,872 | 10,977 | ||||||
| Sales of used rental equipment |
95 | 46 | ||||||
| Other revenue |
532 | 535 | ||||||
|
|
|
|||||||
| Total revenue |
48,576 | 30,634 | ||||||
| Cost of revenue |
||||||||
| Cost of sales revenue |
17,359 | 12,127 | ||||||
| Cost of rental revenue, including depreciation of $4,056 and $2,418, respectively |
7,243 | 3,783 | ||||||
| Cost of used rental equipment sales |
25 | 20 | ||||||
|
|
|
|||||||
| Total cost of revenue |
24,627 | 15,930 | ||||||
|
|
|
|||||||
| Gross profit |
23,949 | 14,704 | ||||||
|
|
|
|||||||
| Operating expenses |
||||||||
| Research and development |
2,262 | 1,789 | ||||||
| Sales and marketing |
12,569 | 9,014 | ||||||
| General and administrative |
8,289 | 5,623 | ||||||
|
|
|
|||||||
| Total operating expenses |
23,120 | 16,426 | ||||||
|
|
|
|||||||
| Income (loss) from operations |
829 | (1,722 | ) | |||||
|
|
|
|||||||
| Other (expense) income |
||||||||
| Interest expense |
(493 | ) | (261 | ) | ||||
| Interest income |
88 | 113 | ||||||
| Decrease (increase) in fair value of preferred stock warrant liability |
148 | (119 | ) | |||||
| Other income |
10 | — | ||||||
|
|
|
|||||||
| Total other (expense) income |
(247 | ) | (267 | ) | ||||
|
|
|
|||||||
| Income (loss) before provision for income taxes |
582 | (1,989 | ) | |||||
| Provision for income taxes |
18 | 13 | ||||||
|
|
|
|||||||
| Net income (loss) |
$ | 564 | $ | (2,002 | ) | |||
| Less deemed dividend on redeemable convertible preferred stock |
(5,781 | ) | (3,027 | ) | ||||
|
|
|
|||||||
| Net loss attributable to common stockholders |
$ | (5,217 | ) | $ | (5,029 | ) | ||
|
|
|
|||||||
| Basic and diluted net loss per share attributable to common stockholders |
$ | (19.97 | ) | $ | (20.15 | ) | ||
| Weighted average number of shares used in calculating loss per share attributable to common stockholders—basic and diluted |
261,268 | 249,519 | ||||||
| (unaudited) | ||||||||
| Pro forma net income per share attributable to common stockholders |
||||||||
| Basic |
$ | 0.04 | ||||||
| Diluted |
$ | 0.04 | ||||||
| Shares used in computing pro forma net income per share |
||||||||
| Basic |
14,601,861 | |||||||
| Diluted |
15,486,487 | |||||||
|
|
||||||||
See accompanying notes to financial statements.
F-6
Table of Contents
Statements of redeemable convertible preferred stock
(amounts in thousands, except share amounts)
| Series B redeemable convertible preferred stock |
Series C redeemable convertible preferred stock |
Series D redeemable convertible preferred stock |
Series
E redeemable convertible preferred stock |
Series
F redeemable convertible preferred stock |
Series
G redeemable convertible preferred stock |
Total stock |
||||||||||||||||||||||||||||||||||||||||||||||
| Shares | Amount | Shares | Amount | Shares | Amount | Shares | Amount | Shares | Amount | Shares | Amount | |||||||||||||||||||||||||||||||||||||||||
|
|
||||||||||||||||||||||||||||||||||||||||||||||||||||
| Balance, December 31, 2010 |
423,082 | $ | 5,026 | 341,294 | $ | 6,000 | 1,487,225 | $ | 32,571 | 1,634,874 | $ | 25,573 | 2,701,957 | $ | 10,877 | — | $ | — | $ | 80,047 | ||||||||||||||||||||||||||||||||
|
|
|
|||||||||||||||||||||||||||||||||||||||||||||||||||
| Warrants exercised |
— | — | 2,554 | 48 | — | — | — | — | — | — | — | — | 48 | |||||||||||||||||||||||||||||||||||||||
| Deemed dividend on redeemable convertible preferred stock |
— | — | — | — | — | — | — | 1,352 | — | 1,675 | — | — | 3,027 | |||||||||||||||||||||||||||||||||||||||
|
|
|
|||||||||||||||||||||||||||||||||||||||||||||||||||
| Balance, December 31, 2011 |
423,082 | 5,026 | 343,848 | 6,048 | 1,487,225 | 32,571 | 1,634,874 | 26,925 | 2,701,957 | 12,552 | — | — | 83,122 | |||||||||||||||||||||||||||||||||||||||
|
|
|
|||||||||||||||||||||||||||||||||||||||||||||||||||
| Series G financing |
— | — | — | — | — | — | — | — | — | — | 2,840,260 | 19,945 | 19,945 | |||||||||||||||||||||||||||||||||||||||
| Accretion of Series G financing costs |
55 | 55 | ||||||||||||||||||||||||||||||||||||||||||||||||||
| Warrants exercised |
2,429 | 30 | 22,055 | 412 | — | — | — | — | — | — | — | — | 442 | |||||||||||||||||||||||||||||||||||||||
| Deemed dividend on redeemable convertible preferred stock |
— | — | — | — | — | — | — | 1,119 | — | 1,503 | — | 3,159 | 5,781 | |||||||||||||||||||||||||||||||||||||||
|
|
|
|||||||||||||||||||||||||||||||||||||||||||||||||||
| Balance, December 31, 2012 |
425,511 | $ | 5,056 | 365,903 | $ | 6,460 | 1,487,225 | $ | 32,571 | 1,634,874 | $ | 28,044 | 2,701,957 | $ | 14,055 | 2,840,260 | $ | 23,159 | $ | 109,345 | ||||||||||||||||||||||||||||||||
|
|
||||||||||||||||||||||||||||||||||||||||||||||||||||
See accompanying notes to financial statements.
F-7
Table of Contents
Statements of stockholders’ deficit
(amounts in thousands, except share amounts)
| Series A convertible preferred stock |
Common stock | Additional paid-in capital (restated) |
Accumulated deficit (restated) |
Total stockholders’ deficit (restated) |
||||||||||||||||||||||||
| Shares | Amount | Shares | Amount | |||||||||||||||||||||||||
|
|
||||||||||||||||||||||||||||
| Balance, December 31, 2010 (restated) |
66,666 | $ | 247 | 248,597 | $ | 1 | $ | — | $ | (70,930 | ) | $ | (70,682 | ) | ||||||||||||||
| Stock-based compensation |
— | — | — | — | 144 | — | 144 | |||||||||||||||||||||
| Stock options exercised |
— | — | 1,843 | — | 1 | — | 1 | |||||||||||||||||||||
| Deemed dividend on redeemable convertible preferred stock |
— | — | — | — | (145 | ) | (2,882 | ) | (3,027 | ) | ||||||||||||||||||
| Net loss |
— | — | — | — | — | (2,002 | ) | (2,002 | ) | |||||||||||||||||||
|
|
|
|||||||||||||||||||||||||||
| Balance, December 31, 2011 (restated) |
66,666 | $ | 247 | 250,440 | $ | 1 | — | $ | (75,814 | ) | $ | (75,566 | ) | |||||||||||||||
| Stock-based compensation |
— | — | — | — | 60 | — | 60 | |||||||||||||||||||||
| Stock options exercised |
— | — | 4,270 | — | 3 | — | 3 | |||||||||||||||||||||
| Warrants exercised - common |
— | — | 17,386 | — | 5 | — | 5 | |||||||||||||||||||||
| Accretion of Series G financing costs |
— | — | — | — | — | (55 | ) | (55 | ) | |||||||||||||||||||
| Deemed dividend on redeemable convertible preferred stock |
— | — | — | — | (68 | ) | (5,713 | ) | (5,781 | ) | ||||||||||||||||||
| Net income |
— | — | — | — | — | 564 | 564 | |||||||||||||||||||||
|
|
|
|||||||||||||||||||||||||||
| Balance, December 31, 2012 (restated) |
66,666 | $ | 247 | 272,096 | $ | 1 | $ | — | $ | (81,018 | ) | $ | (80,770 | ) | ||||||||||||||
|
|
||||||||||||||||||||||||||||
See accompanying notes to financial statements.
F-8
Table of Contents
Statements of cash flows
(amounts in thousands)
| Year ended December 31, |
||||||||
| 2012 (restated) |
2011 (restated) |
|||||||
|
|
||||||||
| Cash flows from operating activities |
||||||||
| Net income (loss) |
$ | 564 | $ | (2,002 | ) | |||
| Adjustments to reconcile net income (loss) to net cash provided by operating activities: |
||||||||
| Depreciation and amortization |
4,984 | 3,198 | ||||||
| Loss of rental units |
263 | 83 | ||||||
| Provision for sales returns |
31 | (10 | ) | |||||
| Provision for doubtful accounts and adjustments |
1,071 | 1,016 | ||||||
| Provision for inventory obsolescence |
50 | 63 | ||||||
| Stock-based compensation expense |
60 | 144 | ||||||
| (Decrease) Increase in fair value of preferred stock warrant liability |
(148 | ) | 119 | |||||
| Changes in operating assets and liabilities: |
||||||||
| Accounts receivable |
(3,764 | ) | (1,565 | ) | ||||
| Inventories |
(2,444 | ) | 65 | |||||
| Deferred costs of rental revenue expenses |
(89 | ) | (10 | ) | ||||
| Prepaid expenses and other current assets |
124 | (181 | ) | |||||
| Accounts payable and accrued expenses |
2,598 | 673 | ||||||
| Warranty reserve |
197 | — | ||||||
| Deferred revenue |
500 | 253 | ||||||
| Income tax payable |
4 | 11 | ||||||
| Deferred income taxes |
3 | 2 | ||||||
|
|
|
|||||||
| Net cash provided by operating activities |
4,004 | 1,859 | ||||||
|
|
|
|||||||
| Cash flows from investing activities |
||||||||
| Investment in intangible assets |
(63 | ) | (161 | ) | ||||
| Production of rental equipment |
(10,361 | ) | (7,890 | ) | ||||
| Purchases of property and equipment |
(2,024 | ) | (909 | ) | ||||
| (Refund) reimbursement of deposit |
(27 | ) | 42 | |||||
|
|
|
|||||||
| Net cash used in investing activities |
(12,475 | ) | (8,918 | ) | ||||
|
|
||||||||
See accompanying notes to financial statements.
F-9
Table of Contents
Inogen, Inc.
Statements of cash flows (continued)
(amounts in thousands)
| Year ended December 31, |
||||||||
| 2012 (restated) |
2011 (restated) |
|||||||
|
|
||||||||
| Cash flows from financing activities |
||||||||
| Net proceeds from issuance of Series G redeemable convertible preferred stock |
19,945 | — | ||||||
| Proceeds from redeemable convertible preferred stock warrants exercised |
417 | 46 | ||||||
| Proceeds from common stock warrants exercised |
5 | — | ||||||
| Proceeds from stock options exercised |
3 | 1 | ||||||
| Repayment of debt from investment in intangible assets |
(213 | ) | (213 | ) | ||||
| Proceeds from borrowings |
6,000 | 6,000 | ||||||
| Repayment of borrowings |
(6,480 | ) | (658 | ) | ||||
|
|
|
|||||||
| Net cash provided by financing activities |
19,677 | 5,176 | ||||||
|
|
|
|||||||
| Net increase (decrease) in cash and cash equivalents |
11,206 | (1,883 | ) | |||||
| Cash and cash equivalents, beginning of year |
3,906 | 5,789 | ||||||
|
|
|
|||||||
| Cash and cash equivalents, end of year |
$ | 15,112 | $ | 3,906 | ||||
|
|
|
|||||||
| Supplemental disclosures of cash flow information |
||||||||
| Cash paid during the year for interest |
$ | 462 | $ | 258 | ||||
| Cash paid during the year for income taxes |
37 | 16 | ||||||
| Non-cash transactions: |
||||||||
| Deemed dividend on redeemable convertible preferred stock |
$ | 5,781 | $ | 3,027 | ||||
| Acquisition of intangible asset with note payable |
— | 650 | ||||||
|
|
||||||||
See accompanying notes to financial statements.
F-10
Table of Contents
Notes to financial statements
(amounts in thousands, except share and per share amounts)
1. Nature of business
Inogen, Inc. (Company or Inogen) was incorporated in Delaware on November 27, 2001. The Company is a medical technology company that develops, manufactures and markets innovative portable oxygen concentrators used for supplemental long-term oxygen therapy by patients with chronic obstructive pulmonary disease, or COPD, and other chronic respiratory conditions. Our proprietary Inogen One systems are designed to address the quality-of-life and other shortcomings of the traditional oxygen therapy model, which we call the delivery model. Traditionally, oxygen therapy patients have relied upon stationary oxygen concentrator systems in the home in conjunction with regular deliveries of oxygen tanks or cylinders for ambulatory, or mobile, use, limiting their mobility and requiring them to plan activities outside of their homes around delivery schedules and a finite oxygen supply. Our Inogen One systems concentrate the air around them to offer a single source of supplemental oxygen anytime, anywhere in devices weighing approximately five to seven pounds. Our products eliminate the need for oxygen deliveries, as well as regular use of a stationary concentrator, thereby improving patient quality-of-life and fostering patient mobility.
2. Summary of significant accounting policies
Basis of presentation
The financial statements of the Company have been prepared in accordance with accounting principles generally accepted in the United States of America (GAAP). As stated in Note 10, the Company has restated its previously issued financial statements as of and for the years ended December 31, 2012 and 2011.
Accounting estimates
The preparation of financial statements in conformity with GAAP requires management to make estimates and assumptions that affect the reported amounts of assets and liabilities and disclosure of contingent assets and liabilities at the date of the financial statements and the reported amounts of revenue and expenses during the reporting period. Significant estimates used in preparing these financial statements include accounts receivable reserves, inventory reserves, warranty reserves, warrant liability, stock-based compensation expense and income tax provision. Actual results could differ from those estimates and such differences could be material to the financial position and results of operations.
Revenue recognition
The Company generates revenue primarily from sales and rentals of its products. The Company’s products consist of its proprietary line of oxygen concentrators and related accessories. Other revenue comes from service contracts, extended warranty contracts and freight revenue for product shipments.
Revenue from product sales is recognized when all of the following criteria are met: (1) persuasive evidence of an arrangement exists; (2) delivery has occurred or services have been rendered; (3) the price to the customer is fixed or determinable; and (4) collectability is
F-11
Table of Contents
Inogen, Inc.
Notes to financial statements
(amounts in thousands, except share and per share amounts)
2. Summary of significant accounting policies (continued)
Revenue recognition (continued)
reasonably assured. Revenue from product sales is recognized upon shipment of the product. Provisions for estimated returns and discounts are made at the time of shipment. Provisions for standard warranty obligations, which are included in cost of sales revenue, are also provided for at the time of shipment.
Accruals for estimated standard warranty expenses are made at the time that the associated revenue is recognized. The provisions for estimated returns, discounts and warranty obligations are made based on known claims and discount commitments and estimates of additional returns and warranty obligations based on historical data and future expectations. The Company has accrued $447 and $250 to provide for future warranty costs at December 31, 2012 and 2011, respectively.
The Company recognizes equipment rental revenue over the non-cancelable lease term, which is one month, less estimated adjustments, per ASC 840. The Company has separate contracts with each patient that are not subject to a master lease agreement with any payor. The leases do not contain a bargain renewal option associated with the potential capped free rental period as the Company determined that the lessee cannot renew the lease completely at his or her option, and the exercise of such option is not reasonably assured at lease inception. The lease term begins on the date products are shipped to patients and are recorded at amounts estimated to be received under reimbursement arrangements with third-party payors, including Medicare, private payors, and Medicaid. Due to the nature of the industry and the reimbursement environment in which the Company operates, certain estimates are required to record net revenue and accounts receivable at their net realizable values. Inherent in these estimates is the risk that they will have to be revised or updated as additional information becomes available. Specifically, the complexity of many third-party billing arrangements and the uncertainty of reimbursement amounts for certain services from certain payors may result in adjustments to amounts originally recorded. Such adjustments are typically identified and recorded at the point of cash application, claim denial or account review. Accounts receivable are reduced by an allowance for doubtful accounts which provides for those accounts from which payment is not expected to be received, although product was delivered and revenue was earned. Upon determination that an account is uncollectible, it is written-off and charged to the allowance. Amounts billed but not earned due to the timing of the billing cycle are deferred and recognized in income on a straight-line basis over the monthly billing period. For example, if the first day of the billing period does not fall on the first of the month, then a portion of the monthly billing period will fall in the subsequent month and the related revenue and cost would be deferred based on the service days in the following month.
Rental revenue is recognized as earned, less estimated adjustments. Revenue not billed at the end of the period are reviewed for the likelihood of collections and accrued. The rental revenue stream is not guaranteed and payment will cease if the patient no longer needs oxygen or returns the equipment. Revenue recognized is at full estimated allowable amounts; transfers to secondary insurances / patient responsibility have no net effect on revenue. Rental revenue is
F-12
Table of Contents
Inogen, Inc.
Notes to financial statements
(amounts in thousands, except share and per share amounts)
2. Summary of significant accounting policies (continued)
Revenue recognition (continued)
earned for that month if the patient is on service on the first day of the 30-day period commencing on the recurring date of service for a particular claim, regardless if there is a change in condition/death after that date.
Included in rental revenue are unbilled amounts for which the revenue recognition criteria had been met as of period-end but were not billed. The estimate of unbilled rental revenue accrual is based on historical trends and estimates of future collectability.
Revenue from the sales of used rental equipment is recognized upon delivery and when collectability is reasonably assured and other revenue recognition criteria are met. When a rental unit is sold, the related cost and accumulated depreciation are removed from their respective accounts, and any gains or losses are included in gross profit.
Revenue from the sales of the Company’s services is recognized when no significant obligations remain undelivered and collection of the receivables is reasonably assured. The Company offers extended service contracts on its Inogen One concentrator line for periods ranging from 12 to 24 months after the end of the standard warranty period. Revenue from these extended service contracts is recognized in income on a straight-line basis over the contract period.
The Company also offers a lifetime warranty for direct-to-consumer sales. For a fixed price, the Company agrees to provide a fully functional oxygen concentrator for the remaining life of the patient. Lifetime warranties are only offered to patients upon the initial sale of oxygen equipment by the Company, and are non-transferable. Product sales with lifetime warranties are considered to be multiple element arrangements within the scope of ASC 605-25.
There are two deliverables when product that includes a lifetime warranty is sold. The first deliverable is the oxygen concentrator equipment which comes with a standard warranty of three years. The second deliverable is the life time warranty that provides for a functional oxygen concentrator for the remaining lifetime of the patient. These two deliverables qualify as separate units of accounting.
The revenue is allocated to the two deliverables on a relative selling price method. The Company has vendor-specific objective evidence of selling price for the equipment. To determine the selling price of the lifetime warranty, the company uses its best estimate of the selling price for that deliverable as the lifetime warranty is neither separately priced nor selling price is available through third-party evidence. To calculate the selling price associated with the lifetime warranties, management considered the profit margins of the overall business, the average estimated cost of lifetime warranties and the price of extended warranties. A significant estimate used to calculate the price and expense of lifetime warranties is the life expectancy of patients. Based on clinical studies, the company estimates that 60% of patients will succumb to their disease within three years. Given the approximate mortality rate of 20% per year, the company estimates on average all patients will succumb to their disease within five years. The Company has taken into consideration that when patients decide to buy an Inogen portable oxygen concentrator with a lifetime
F-13
Table of Contents
Inogen, Inc.
Notes to financial statements
(amounts in thousands, except share and per share amounts)
2. Summary of significant accounting policies (continued)
Revenue recognition (continued)
warranty, they typically have already been on oxygen for a period of time, which can have a large impact on their life expectancy from the time our product is deployed.
After applying the relative selling price method, revenue from equipment sales is recognized when all other revenue recognition criteria for product sales are met. Lifetime warranty revenue is recognized using the straight-line method during the fourth and fifth year after the delivery of the equipment which is the estimated usage period of the contract based on the average patient life expectancy.
Shipping and handling
Shipping and handling costs for sold products and rental assets, shipped to the Company’s customers are included on the statements of operations as part of cost of sales revenue and cost of rental revenue, respectively. The Company’s shipping and handling costs relating to sales revenue and rental revenue were $639 and $1,922, respectively, for the year ended December 31, 2012. The Company’s shipping and handling costs relating to sales revenue and rental revenue were $388 and $978, respectively, for the year ended December 31, 2011. Income from shipping and handling fees charged to its customers is included in other revenue on the statements of operations. The Company earned $214 and $164 from shipping and handling fees for the years ended December 31, 2012 and 2011, respectively.
Fair value of financial instruments
The Company’s financial instruments consist of cash and cash equivalents, accounts receivable, accounts payable and accrued expenses, debt and warrants. The carrying values of cash and cash equivalents, accounts receivable and accounts payable and accrued expenses approximate fair values based on the short-term nature of these financial instruments.
The fair value of the Company’s debt approximates carrying value based on the Company’s current incremental borrowing rate for similar types of borrowing arrangements. Imputed interest associated with the Company’s non-interest bearing debt is insignificant.
The fair value of the Company’s preferred stock warrant liability is estimated using a Monte Carlo valuation model.
Fair value accounting
Accounting Standards Codification (ASC) 820, Fair Value Measurements and Disclosures, creates a single definition of fair value, establishes a framework for measuring fair value in GAAP and expands disclosures about fair value measurements. ASC 820 emphasizes that fair value is a market-based measurement, not an entity-specific measurement, and states that a fair value measurement should be determined based on assumptions that market participants would use in pricing the asset or liability. Assets and liabilities adjusted to fair value in the balance sheet are categorized based upon the level of judgment associated with the inputs used to measure their fair value.
F-14
Table of Contents
Inogen, Inc.
Notes to financial statements
(amounts in thousands, except share and per share amounts)
2. Summary of significant accounting policies (continued)
Fair value accounting (continued)
Level inputs, as defined by ASC 820, are as follows:
| Level input | Input definition | |
|
| ||
| Level 1 |
Inputs are unadjusted, quoted prices for identical assets or liabilities in active markets at the measurement date. | |
| Level 2 |
Inputs, other than quoted prices included in Level 1, that are observable for the asset or liability through corroboration with market data at the measurement date. | |
| Level 3 |
Unobservable inputs that reflect management’s best estimate of what market participants would use in pricing the asset or liability at the measurement date. | |
|
| ||
The following table summarizes fair value measurements by level at December 31, 2012 for the liabilities measured at fair value on a recurring basis:
| Level 1 | Level 2 | Level 3 | Total | |||||||||||||
|
|
||||||||||||||||
| Preferred stock warrant liability |
$ | — | $ | — | $ | 164 | $ | 164 | ||||||||
|
|
|
|||||||||||||||
| Total liabilities |
$ | — | $ | — | $ | 164 | $ | 164 | ||||||||
|
|
||||||||||||||||
The following table summarizes fair value measurements by level at December 31, 2011 for the liabilities measured at fair value on a recurring basis:
| Level 1 | Level 2 | Level 3 | Total | |||||||||||||
|
|
||||||||||||||||
| Preferred stock warrant liability |
$ | — | $ | — | $ | 337 | $ | 337 | ||||||||
|
|
|
|||||||||||||||
| Total liabilities |
$ | — | $ | — | $ | 337 | $ | 337 | ||||||||
|
|
||||||||||||||||
The following table summarizes the fair value measurements using significant Level 3 inputs, and changes therein, for the year ended December 31, 2012 and 2011:
| Warrant liability |
||||
|
|
||||
| Balance as of December 31, 2010 |
$ | 220 | ||
| Fair value of preferred stock warrants exercised |
(2 | ) | ||
| Change in fair value |
119 | |||
|
|
|
|||
| Balance as of December 31, 2011 |
337 | |||
| Fair value of preferred stock warrants exercised |
(25 | ) | ||
| Change in fair value |
(148 | ) | ||
|
|
|
|||
| Balance as of December 31, 2012 |
$ | 164 | ||
|
|
||||
F-15
Table of Contents
Inogen, Inc.
Notes to financial statements
(amounts in thousands, except share and per share amounts)
2. Summary of significant accounting policies (continued)
Fair value accounting (continued)
The preferred stock warrant liability is marked to market each reporting date until the warrants are settled. The fair value of the preferred stock warrant liability is estimated using a Monte Carlo valuation model, which takes into consideration the market values of comparable public companies, considering among other factors, the use of multiples of earnings, and adjusted to reflect the restrictions on the ability of the Company’s shares to trade in an active market.
Cash and cash equivalents
Cash equivalents are recorded at cost, which approximates market value. The Company considers all highly liquid investments with original maturities of 90 days or less at the time of purchase to be cash equivalents.
Accounts receivable and allowance for bad debts, returns, and adjustments
Accounts receivable are customer obligations due under normal sales and rental terms. The Company performs continuing credit evaluations of the customers’ financial condition and generally does not require collateral. The allowance for doubtful accounts is maintained at a level that, in management’s opinion, is adequate to absorb potential losses related to account receivables and is based upon the Company’s continuous evaluation of the collectability of outstanding balances. Management’s evaluation takes into consideration such factors as past bad debt experience, economic conditions and information about specific receivables. The Company’s evaluation also considers the age and composition of the outstanding amounts in determining their net realizable value. The allowance is based on estimates, and ultimate losses may vary from current estimates. As adjustments to these estimates become necessary, they are reported in earnings in the periods that they become known. The allowance is increased by bad debt provisions charged to bad debt expense in operating expense and reduced by direct write-offs, net of recoveries.
Provision for sales returns applies to direct to consumer sales only. The Company does not allow returns from providers. This reserve is calculated based on actual historical return rates under our 30-day return program and is applied to the current period’s sales revenue for direct to consumer sales.
The Company also records an allowance for rental revenue adjustments and write-offs, which is recorded as a reduction of rental revenue and rental accounts receivable balances. These adjustments and write offs result from contractual adjustments, audit adjustments, untimely claims filings or billings not paid due to another provider performing same or similar functions for the patient in the same period, all of which prevent billed revenue to become realizable. The reserve is based on historical revenue adjustments as a percentage of rental revenue billed during the related period.
When recording the allowance for doubtful accounts, the bad debt expense account (general & administrative expense account) is charged, when recording allowance for sales returns, the sales
F-16
Table of Contents
Inogen, Inc.
Notes to financial statements
(amounts in thousands, except share and per share amounts)
2. Summary of significant accounting policies (continued)
Accounts receivable and allowance for bad debts, returns, and adjustments (continued)
returns account (contra sales revenue account) is charged, and when recording the allowance for adjustments, the rental revenue adjustments account (contra rental revenue account) is charged.
At December 31, 2011 and 2012, included in accounts receivable on the balance sheets are earned but unbilled receivables of $0.7 million and $1.0 million, respectively.
Concentration of credit risk
Financial instruments that potentially subject the Company to concentration of credit risk consist principally of cash and cash equivalents and accounts receivable. At times, cash account balances may be in excess of the amounts insured by the Federal Deposit Insurance Corporation (FDIC). However, management believes the risk of loss to be minimal. The Company performs periodic evaluations of the relative credit standing of these institutions and has not experienced any losses on its cash and cash equivalents and short-term investments to date.
Concentration of customers and vendors
The Company sells its products to home medical equipment providers in the United States and in foreign countries on a credit basis, which resulted in a customer concentration of a major customer that accounted for 12% of net revenue in 2012. This major customer is an international distributor of the Company’s products. The accounts receivable balance from the major customer was $265 or 3% of total accounts receivable at December 31, 2012.
The same customer accounted for 7% of total revenue in 2011, along with another international customer that also accounted for 7% of net revenue in 2011. Accounts receivable balances were $436 or 7% of total accounts receivable for one of these customers and immaterial for the other as of December 31, 2011.
The Company also rents products directly to patients, which resulted in a customer concentration relating to Medicare’s service reimbursement programs. Medicare’s service reimbursement programs (net of patient co-insurance obligations) accounted for 66% and 72% of rental revenue in 2012 and 2011, respectively and based on total revenue were 27% and 26% for 2012 and 2011, respectively. Account receivable balances relating to Medicare’s service reimbursement programs amounted to $3,043 or 33% of total accounts receivable at December 31, 2012, and $1,832 or 29% of total accounts receivable at December 31, 2011.
The Company currently purchases raw materials from a limited number of vendors, which resulted in a concentration of three major vendors that accounted for 19%, 14%, and 8%, respectively, of total raw material purchases in 2012. The three major vendors supply the Company with raw materials used to manufacture the Company’s products. Accounts payable balances for the three major vendors were $598, $509, and $618, respectively, or 15%, 12%, and 15%, respectively, of total accounts payable at December 31, 2012.
F-17
Table of Contents
Inogen, Inc.
Notes to financial statements
(amounts in thousands, except share and per share amounts)
2. Summary of significant accounting policies (continued)
Concentration of customers and vendors (continued)
For 2011, the Company’s three major vendors accounted for 17%, 15%, and 12%, respectively, of total raw material purchases in 2011. Accounts payable balances for the three major vendors were $487, $84, and $550, respectively, or 15%, 3%, and 17%, respectively, of total accounts payable at December 31, 2011.
A portion of revenue is earned from sales outside the United States. Non-U.S. revenue is denominated in U.S. dollars. A breakdown of the Company’s revenue from U.S. and non-U.S. sources for the years ended December 31, 2012 and 2011 is as follows (in thousands):
| 2012 | 2011 | |||||||
|
|
||||||||
| U.S. revenue |
$ | 35,180 | $ | 22,843 | ||||
| Non-U.S. revenue |
13,396 | 7,791 | ||||||
|
|
|
|||||||
| $ | 48,576 | $ | 30,634 | |||||
|
|
||||||||
Inventories
Inventories are stated at the lower of cost or market. Cost is determined using a standard cost method, including material, labor and manufacturing overhead, whereby the standard costs are updated at least quarterly to reflect approximate actual costs using the first-in, first out (FIFO) method and market represents the lower of replacement cost or estimated net realizable value. The Company records adjustments at least quarterly to inventory for potentially excess, obsolete, slow-moving or impaired items. Inventories consist of the following:
| December 31, | ||||||||
| 2012 | 2011 | |||||||
|
|
||||||||
| Raw materials and work-in progress |
$ | 3,744 | $ | 1,436 | ||||
| Finished goods |
413 | 337 | ||||||
| Less: reserves |
(98 | ) | (108 | ) | ||||
|
|
|
|||||||
| $ | 4,059 | $ | 1,665 | |||||
|
|
||||||||
Property and equipment
Property and equipment are stated at cost. Depreciation and amortization are calculated using the straight-line method over the assets estimated useful lives as follows:
| Rental equipment |
1.5-5 years | |
| Manufacturing equipment and tooling |
5 years | |
| Computer equipment and software |
3 years | |
| Furniture and equipment |
3-5 years | |
| Leasehold improvements |
Shorter of 3-7 years or life of underlying lease | |
|
| ||
F-18
Table of Contents
Inogen, Inc.
Notes to financial statements
(amounts in thousands, except share and per share amounts)
2. Summary of significant accounting policies (continued)
Property and equipment (continued)
Expenditures for repairs and maintenance are charged to operations as incurred. Expenditures for additions, improvements and replacements are capitalized.
Rental equipment is recorded at cost and depreciated over the estimated useful life of the equipment using the straight-line method. The range of estimated useful lives for rental equipment is eighteen months to five years. Rental equipment is depreciated to a salvage value of zero. Repair and maintenance costs are included in cost of revenue in the statements of operations. Repair and maintenance expense, including both labor and parts, for the rental equipment was $392 and $239 for the years ended December 31, 2012 and 2011, respectively.
Depreciation and amortization expense related to property and equipment and rental equipment is summarized below for the years ended December 31, 2012 and 2011, respectively (in thousands).
| December 31, | ||||||||
| 2012 | 2011 | |||||||
|
|
||||||||
| Rental equipment |
$ | 4,056 | $ | 2,418 | ||||
| Other property and equipment |
630 | 500 | ||||||
|
|
|
|||||||
| $ | 4,686 | $ | 2,918 | |||||
|
|
||||||||
Accumulated depreciation related to property and equipment and rental equipment is summarized below for the years ended December 31, 2012 and 2011, respectively (in thousands).
| December 31, | ||||||||
| 2012 | 2011 | |||||||
|
|
||||||||
| Rental equipment |
$ | 7,549 | $ | 3,672 | ||||
| Other property and equipment |
3,090 | 2,468 | ||||||
|
|
|
|||||||
| $ | 10,639 | $ | 6,140 | |||||
|
|
||||||||
Long-lived assets
The Company accounts for the impairment and disposition of long-lived assets in accordance with ASC 360, Property, Plant, and Equipment. In accordance with ASC 360, long-lived assets to be held are reviewed for events or changes in circumstances that indicate that their carrying value may not be recoverable. The Company periodically reviews the carrying value of long-lived assets to determine whether or not impairment to such value has occurred. No impairments were recorded during the years ended December 31, 2012 and 2011.
Deferred rent
The Company’s operating leases for its office facilities in California and Texas include a rent abatement period and scheduled rent increases. The Company has accounted for the leases to provide straight-line charges to operations over the life of the leases.
F-19
Table of Contents
Inogen, Inc.
Notes to financial statements
(amounts in thousands, except share and per share amounts)
2. Summary of significant accounting policies (continued)
Research and development
Research and development costs are expensed as incurred.
Advertising costs
Advertising costs, which approximated $2,503 and $1,800 during the years ended December 31, 2012 and 2011, respectively, are expensed as incurred, excluding the production costs of direct response commercials. Advertising costs are included in sales and marketing expense in the accompanying statements of operations.
Income taxes
The Company accounts for income taxes in accordance with ASC 740, Income Taxes. Under ASC 740, income taxes are recognized for the amount of taxes payable or refundable for the current year and deferred tax liabilities and assets are recognized for the future tax consequences of transactions that have been recognized in the Company’s financial statements or tax returns. A valuation allowance is provided when it is more likely than not that some portion, or all, of the deferred tax asset will not be realized.
The Company accounts for uncertainties in income tax in accordance with ASC 740-10, Accounting for Uncertainty in Income Taxes. ASC 740-10 prescribes a recognition threshold and measurement attribute for the financial statement recognition and measurement of a tax position taken or expected to be taken in a tax return. This accounting standard also provides guidance on derecognition, classification, interest and penalties, accounting in interim periods, disclosure and transition.
The Company recognizes interest and penalties on taxes, if any, within operations as income tax expense. No significant interest or penalties were recognized during the periods presented.
The Company operates in multiple states. The statute of limitations has expired for all tax years prior to 2009 for federal and 2008 to 2009 for various state tax purposes. However, the net operating loss generated on the federal and state tax returns in prior years may be subject to adjustments by the federal and state tax authorities.
Accounting for stock-based compensation
The Company accounts for its stock-based compensation in accordance with ASC 718, Compensation—Stock Compensation, which establishes accounting for share-based awards exchanged for employee services and requires companies to expense the estimated fair value of these awards over the requisite employee service period. Share–based compensation cost is determined at the grant date using the Black-Scholes option pricing model. The value of the award that is ultimately expected to vest is recognized as expense on a straight line basis over the employee’s requisite service period.
F-20
Table of Contents
Inogen, Inc.
Notes to financial statements
(amounts in thousands, except share and per share amounts)
2. Summary of significant accounting policies (continued)
Accounting for stock-based compensation (continued)
As part of the provisions of ASC 718, the Company is required to estimate potential forfeitures of stock grants and adjust compensation cost recorded accordingly. The estimate of forfeitures will be adjusted over the requisite service period to the extent that actual forfeitures differ, or are expected to differ, from such estimates. Changes in estimated forfeitures will be recognized through a cumulative catch-up adjustment in the period of change and will also impact the amount of stock compensation expense to be recognized in future periods.
Business segments
The Company operates in only one business segment-manufacturing and marketing of oxygen concentrators.
Earnings per share
Earnings per share, or EPS, is computed in accordance with ASC 260, Earnings per Share, and is calculated using the weighted average number of common shares outstanding during each period. Diluted EPS assumes the conversion, exercise or issuance of all potential common stock equivalents unless the effect is to reduce a loss or increase the income per share. For purposes of this calculation, common stock subject to repurchase by the Company, options and warrants are considered to be common stock equivalents and are only included in the calculation of diluted earnings per share when their effect is dilutive.
The shares used to compute basic and diluted net income per share represent the weighted-average common shares outstanding, reduced by the weighted-average unvested common shares subject to repurchase. Further, as the Company’s preferred stockholders have the right to participate in any dividend declared on the Company’s common stock, basic and diluted EPS are potentially subject to computation using the two-class method, under which the Company’s undistributed earnings are allocated amongst the common and preferred shareholders. However, as the company recorded a net loss attributable to common stockholders for the years ended December 31, 2012 and 2011, presentation of EPS using the two class method was not necessary.
F-21
Table of Contents
Inogen, Inc.
Notes to financial statements
(amounts in thousands, except share and per share amounts)
2. Summary of significant accounting policies (continued)
Earnings per share (continued)
The computation of EPS is as follows (amounts in thousands, except share and per share data):
| Years ended December 31, | 2012 | 2011 | ||||||
|
|
||||||||
| Numerator—basic and diluted: |
||||||||
| Net income (loss) |
$ | 564 | $ | (2,002 | ) | |||
| Less deemed dividend on redeemable preferred stock |
(5,781 | ) | (3,027 | ) | ||||
|
|
|
|||||||
| Net loss attributable to common stockholders |
$ | (5,217 | ) | $ | (5,029 | ) | ||
|
|
|
|||||||
| Denominator: |
||||||||
| Weighted-average common shares |
261,268 | 249,519 | ||||||
| Net loss per share—basic |
$ | (19.97 | ) | $ | (20.15 | ) | ||
| Net loss per share—diluted |
$ | (19.97 | ) | $ | (20.15 | ) | ||
| (unaudited) | ||||||||
| Pro forma net income per share—basic |
$ | 0.04 | ||||||
| Pro forma net income per share—diluted |
$ | 0.04 | ||||||
| Weighted-average common shares—basic |
14,601,861 | |||||||
| Weighted-average common shares—diluted |
15,486,487 | |||||||
|
|
||||||||
The pro forma EPS calculations gives effect to: (1) the automatic conversion of the outstanding convertible preferred stock into a weighted average of 14,216,838 shares of common stock, (2) the cash exercise of warrants to purchase an aggregate of 142,495 shares of common stock, which we expect will occur prior to closing of this offering as the warrants will otherwise expire at that time and (3) the reclassification of our preferred stock warrant liability to additional paid-in-capital upon the closing of this offering.
The computations of diluted net income applicable to common shareholders exclude redeemable convertible preferred stock, warrants and common stock options which were anti-dilutive. Shares excluded from the computations of diluted net loss applicable to common shareholders amounted to 14,720,678 and 11,546,760 on December 31, 2012 and December 31, 2011 respectively.
Recently issued accounting guidance
In May 2011, the FASB issued ASU 2011-04, Amendments to Achieve Common Fair Value Measurement and Disclosure Requirements in U.S. GAAP and IFRS, which generally represents clarifications of Topic 820, Fair Value Measurements, but also includes certain instances where a particular principle or requirement for measuring fair value or disclosing information about fair value measurements has changed. This ASU results in common principles and requirements for measuring fair value and for disclosing information about fair value measurements in accordance with U.S. GAAP and International Financial Reporting Standards (IFRS). The ASU was effective prospectively for interim and annual periods beginning after December 15, 2011 with earlier application not permitted. The adoption of this guidance did not have a material effect on the results of operations, financial position or cash flows of the Company.
F-22
Table of Contents
Inogen, Inc.
Notes to financial statements
(amounts in thousands, except share and per share amounts)
3. Intangible assets
During the year ended December 31, 2008, the Company acquired Comfort Life Medical, LLC (Comfort Life). The acquisition resulted in recording an intangible asset in the amount of $92 related to the Medicare license held by the acquired company. The Company amortizes this intangible asset over its estimated useful life of ten years. As of December 31, 2012 and 2011, there were no impairments recorded related to this intangible asset.
On April 1, 2009, Comfort Life Medical, LLC merged with Inogen, Inc., and was simultaneously dissolved.
During the year ended December 31, 2009, the Company was assigned four patents previously held as an exclusive license from Air Products & Chemicals (APC) in exchange for an increase in a long term liability due to APC of $250. The acquisition of these patents resulted in an intangible asset of $250. During the year ended December 31, 2011, the Company purchased additional patents from APC for a total value of $650. The Company amortizes these intangible assets over an estimated useful life of five years. As of December 31, 2012 and 2011, there were no impairments recorded related to these intangible assets.
During the year ended December 31, 2011, the Company acquired Breathe Oxygen Services, LLC. The acquisition resulted in recording an intangible asset in the amount of $66 related to the Medicare license held by the acquired company that allowed them to operate in the state of Tennessee as well as assets of the company. The Company amortizes this intangible asset over its estimated useful life of ten years. As of December 31, 2012 and 2011, there were no impairments recorded related to this intangible asset.
On August 29, 2011, Breathe Oxygen Services, LLC merged with Inogen, Inc., and was simultaneously dissolved.
The Company also capitalizes costs incurred for the production of direct response advertising commercials and amortizes these intangible assets over a useful life of two years. During the year ended December 31, 2011, the Company paid $95 for its G2 commercial and during the year ended December 31, 2012, the Company paid $63 for its G3 commercial.
Amortization expense for intangible assets for the years ended December 31, 2012 and 2011 was $298 and $280, respectively.
| December 31, 2012 | Average estimated useful lives (in years) |
Gross carrying amount |
Accumulated amortization |
Net amount |
||||||||||||
|
|
||||||||||||||||
| Licenses |
10.0 | $ | 158 | $ | 46 | $ | 112 | |||||||||
| Patents |
5.0 | 900 | 509 | 391 | ||||||||||||
| Commercial |
2.0 | 63 | 8 | 55 | ||||||||||||
|
|
|
|||||||||||||||
| Total |
$ | 1,121 | $ | 563 | $ | 558 | ||||||||||
|
|
||||||||||||||||
F-23
Table of Contents
Inogen, Inc.
Notes to financial statements
(amounts in thousands, except share and per share amounts)
3. Intangible assets (continued)
| December 31, 2011 | Average estimated useful lives (in years) |
Gross carrying amount |
Accumulated amortization |
Net amount |
||||||||||||
|
|
||||||||||||||||
| Licenses |
10.0 | $ | 158 | $ | 30 | $ | 128 | |||||||||
| Patents |
5.0 | 900 | 286 | 614 | ||||||||||||
| Commercial |
2.0 | 95 | 44 | 51 | ||||||||||||
|
|
|
|||||||||||||||
| Total |
$ | 1,153 | $ | 360 | $ | 793 | ||||||||||
|
|
||||||||||||||||
Annual estimated amortization expense for each of the succeeding fiscal years is as follows:
| Years ending December 31, | Intangible amortization |
|||
|
|
||||
| 2013 |
$ | 270 | ||
| 2014 |
207 | |||
| 2015 |
16 | |||
| 2016 |
16 | |||
| 2017 |
16 | |||
| Thereafter |
33 | |||
|
|
|
|||
| $ | 558 | |||
|
|
||||
4. Long-term debt
Revolving credit and term loan agreement
On May 19, 2011 the Company entered into an revolving credit and term loan agreement with its current lender and one additional lender whereby the existing balance of the revolving credit and term loan agreement with the predecessor lender outstanding at the time was split evenly in balance between the current lender and the new lender and the payback terms were not changed. This transaction did not result in any debt extinguishment losses or gains. The Company did not incur or defer any financing cost directly related to the amended loan and security agreement.
On October 12, 2012, the Company entered into an amended and restated revolving credit and term loan agreement with its current lenders whereby the existing balances and the payback terms were not changed. This transaction did not result in any debt extinguishment losses or gains. The Company did not incur or defer any financing cost directly related to the credit and term loan agreement. In the event that the Company enters into an acquisition or initial public offering (IPO) during the term of this Facility, Lenders shall receive a fee equal to 1.00% of the Facility Amount, or approximately $120.
The amended and restated revolving credit and term loan agreement with the Company’s current lenders provides for new borrowings of up to $12,000, secured by substantially all of the Company’s assets. The amended and restated revolving credit and term loan agreement provides
F-24
Table of Contents
Inogen, Inc.
Notes to financial statements
(amounts in thousands, except share and per share amounts)
4. Long-term debt (continued)
Revolving credit and term loan agreement (continued)
for the existing term loan facility for rental assets amounting to up to $3,000 (Term Loan A), a term loan facility for rental assets amounting to up to $8,000 (Term Loan B), a new term loan facility for rental assets amounting to up to $12,000 (Term Loan C), and an accounts receivable revolving line of credit amounting to up to $1,000 based on 80% of eligible accounts receivable, as defined (AR Revolver).
Payments of interest for all the Term Loans are generally payable monthly. Payment of principal is payable monthly. Each term loan bears interest at the Base Rate, which is a rate equal to the applicable margin plus the greater of (i) the prime rate, (ii) the federal funds effective rate, as defined in the agreement, plus 1% and (iii) the daily adjusting LIBOR rate, plus 1%. The applicable margins for Term Loans A, B, and C are 1.25%, 2.5% and 2.25%, respectively.
The Term Loan A facility of $3,000 is presented net of principal payments that began in May 2011. The net balances of this term loan facility were $1,417 and $2,319 as of December 31, 2012 and 2011, respectively. The Term Loan B facility for $8,000 is presented net of principal payments that began in May 2012. The net balances of this term loan facility were $6,444 and $6,022 as of December 31, 2012 and 2011, respectively.
There were no borrowings under the Term Loan C facility in 2012. Payment of principal is payable monthly over a period of 36 months starting October 2013 for Term Loan C.
There were no borrowings under the AR Revolver during 2012; future draws will bear variable interest at the Base Rate, as defined, plus 1.00%. Payments of interest for the AR revolver are generally payable monthly. The AR Revolver expired on October 13, 2013.
The total balances owed were $7,861 and $8,341 as of December 31, 2012 and 2011, respectively. The interest rates were 4.5% for Term Loan A and 5.75% for Term Loan B at December 31, 2012 and 2011.
As of December 31, 2012 and 2011, the Company was in compliance with all covenants of the amended and restated credit and term loan agreement.
Contractual obligation
During 2007, the Company entered into a licensing agreement to acquire a portfolio of patents relating to a continuous flow portable oxygen concentrator by issuing 3.4 million shares of Series D redeemable convertible preferred stock. Also as part of the licensing agreement the Company has accrued a one-time non-exclusive licensing fee of $850, which was originally payable January 1, 2011.
On March 22, 2011, the Company entered into an amendment of the licensing agreement whereby the Company was assigned the entire right, title and interest in the portfolio of patents in exchange for a non-interest bearing note for $650, in addition to the $850 existing obligation,
F-25
Table of Contents
Inogen, Inc.
Notes to financial statements
(amounts in thousands, except share and per share amounts)
4. Long-term debt (continued)
Contractual obligation (continued)
for a total of $1,500, due to the original licensor in installments starting May 22, 2011, and ending October 31, 2016. As of December 31, 2012, the Company included $212 as current portion of long-term debt and $863 in long-term debt in the accompanying balance sheets. As of December 31, 2011, the Company included $213 as current portion of long-term debt and $1,075 in long-term debt in the accompanying balance sheets.
Long-term debt consists of the following:
| As of December 31, |
||||||||
| 2012 | 2011 | |||||||
|
|
||||||||
| Term loan, bearing interest at Base Rate, monthly payments of $83 beginning May 2011 through April 2014 |
$ | 1,417 | $ | 2,319 | ||||
| Term loan, bearing interest at Base Rate, monthly payments of $222 beginning May 2012 through April 2015 |
6,444 | 6,022 | ||||||
| Contractual obligation, non-interest, quarterly payments of $53 beginning May 2011 through October 2014 and quarterly payments of $81 beginning January 2015 through October 2016 |
1,075 | 1,288 | ||||||
|
|
|
|||||||
| Subtotal |
8,936 | 9,629 | ||||||
| Less: current maturities |
(3,879 | ) | (2,532 | ) | ||||
|
|
|
|||||||
| Long-term debt, net of current portion |
$ | 5,057 | $ | 7,097 | ||||
|
|
||||||||
As of December 31, 2012, the minimum aggregate payments due under non-cancelable debt are summarized as follows:
| Years ending December 31, | ||||
|
|
||||
| 2013 |
$ | 3,879 | ||
| 2014 |
3,296 | |||
| 2015 |
1,436 | |||
| 2016 |
325 | |||
|
|
|
|||
| Total |
$ | 8,936 | ||
|
|
||||
F-26
Table of Contents
Inogen, Inc.
Notes to financial statements
(amounts in thousands, except share and per share amounts)
5. Income taxes
The provision for income taxes consists of the following:
| As of December 31, |
||||||||
| 2012 | 2011 | |||||||
|
|
||||||||
| Current tax expense |
||||||||
| Federal |
$ | — | $ | — | ||||
| State |
(15 | ) | (11 | ) | ||||
|
|
|
|||||||
| Total current tax expense |
(15 | ) | (11 | ) | ||||
|
|
|
|||||||
| Deferred tax benefit |
||||||||
| Federal |
523 | 676 | ||||||
| State |
88 | 132 | ||||||
|
|
|
|||||||
| Total deferred tax benefit |
611 | 808 | ||||||
| Less: valuation allowance |
(614 | ) | (810 | ) | ||||
|
|
|
|||||||
| Total deferred tax expense, net |
(3 | ) | (2 | ) | ||||
|
|
|
|||||||
| Income tax expense |
$ | (18 | ) | $ | (13 | ) | ||
|
|
||||||||
The components of deferred tax assets and liabilities consist of the following:
| As
of December 31, |
||||||||
| 2012 | 2011 | |||||||
|
|
||||||||
| Deferred tax assets (liabilities) |
||||||||
| Net operating losses |
$ | 27,100 | $ | 26,345 | ||||
| Other |
(79 | ) | 579 | |||||
|
|
|
|||||||
| Total deferred tax assets |
27,021 | 26,924 | ||||||
| Valuation allowance |
(27,031 | ) | (26,931 | ) | ||||
|
|
|
|||||||
| Net deferred tax liabilities |
$ | (10 | ) | $ | (7 | ) | ||
|
|
||||||||
As of December 31, 2012 and 2011, the Company has recorded a full valuation allowance against its net deferred tax assets. The allowance reduces the Company’s deferred tax assets to that amount which management believes to be more likely than not that the Company will ultimately realize.
The Company is a C-Corporation for both Federal and State income tax purposes.
As of December 31, 2012, the Company had $62,020 and $92,523 of federal and state net operating loss carryforwards, respectively, that begin to expire in 2022 and 2013 for federal and state purposes, respectively, if not utilized.
F-27
Table of Contents
Inogen, Inc.
Notes to financial statements
(amounts in thousands, except share and per share amounts)
5. Income taxes (continued)
As of December 31, 2011, the Company had $59,568 and $120,423 of federal and state net operating loss carryforwards, respectively, that begin to expire in 2022 and 2012 for federal and state purposes, respectively, if not utilized.
6. Commitments and contingencies
Leases
The Company leases its offices and certain equipment under operating leases that expire through December 2019. At December 31, 2012, the minimum aggregate payments due under non-cancelable leases are summarized as follows:
| Year ending December 31, |
||||
|
|
||||
| 2013 |
$ | 788 | ||
| 2014 |
815 | |||
| 2015 |
718 | |||
| 2016 |
331 | |||
| 2017 |
329 | |||
| Thereafter |
624 | |||
|
|
|
|||
| Total |
$ | 3,605 | ||
|
|
||||
Rent expense of $806 and $628 was included in the accompanying statements of operations for the years ended December 31, 2012 and 2011, respectively.
Warranty obligation
The following table identifies the changes in the Company’s aggregate product warranty liabilities for the year ended December 31, 2012 and 2011 (in thousands):
| Year ended December 31, |
||||||||
| 2012 | 2011 | |||||||
|
|
||||||||
| Product warranty liability at beginning of year |
$ | 250 | $ | 250 | ||||
| Accruals for warranties issued |
383 | 253 | ||||||
| Adjustments related to pre-existing warranties (including changes in estimates) |
134 | 211 | ||||||
| Settlements made (in cash or in kind) |
(320 | ) | (464 | ) | ||||
|
|
|
|||||||
| Product warranty liability at end of year |
$ | 447 | $ | 250 | ||||
|
|
||||||||
Legislation and HIPAA
The healthcare industry is subject to numerous laws and regulations of federal, state and local governments. These laws and regulations include, but are not necessarily limited to, matters such as licensure, accreditation, government healthcare program participation requirements,
F-28
Table of Contents
Inogen, Inc.
Notes to financial statements
(amounts in thousands, except share and per share amounts)
6. Commitments and contingencies (continued)
Legislation and HIPAA (continued)
reimbursement for patient services, and Medicare and Medicaid fraud and abuse. Government activity has continued with respect to investigations and allegations concerning possible violations of fraud and abuse statutes and regulations by healthcare providers. Violations of these laws and regulations could result in expulsion from government healthcare programs together with the imposition of significant fines and penalties, as well as significant repayments for patient services previously billed.
The Company believes that it is in compliance with fraud and abuse regulations as well as other applicable government laws and regulations. Compliance with such laws and regulations can be subject to future government review and interpretation as well as regulatory actions unknown or unasserted at this time.
The Health Insurance Portability and Accountability Act (HIPAA) assures health insurance portability, reduces healthcare fraud and abuse, guarantees security and privacy of health information, and enforces standards for health information. The Health Information Technology for Economic and Clinical Health Act (HITECH Act) imposes notification requirements of certain security breaches relating to protected health information. The Company may be subject to significant fines and penalties if found not to be compliant with the provisions outlined in the regulations.
Employment agreements
On January 2, 2008, the Company entered into an Employment Agreement with the Chief Executive Officer (CEO) including considerations for salary, bonus awards, stock options, and severance. The CEO is also entitled to a Liquidation Fee, as defined in the agreement, upon the occurrence of a deemed liquidation event, also as defined in the agreement.
The Company has entered into employment agreements with certain key employees providing for the payment of cash compensation and/or continuation of salary for a range of three to six months upon termination without cause. There are no guaranteed amounts due under those agreements as of December 31, 2012 and 2011, respectively.
The Company also has a bonus plan for all employees based on the Company’s overall performance, the employees’ performance, and level of responsibility. In addition, the Company has a management carve-out plan for a potential liquidation event based on the sales price per share.
Legal proceedings
On November 4, 2011, we filed a lawsuit in the United States District Court for the Central District of California against Inova Labs Inc., or Defendant, for infringement of two of our patents. The case, Inogen Inc. v. Inova Labs Inc., Case No. 8:11-cv-01692-JST-AN, or the Lawsuit, involves U.S. Patent Nos. 7,841,343, entitled “Systems and Methods For Delivering Therapeutic Gas to Patients”, or the ’343 patent, and 6,605,136 entitled “Pressure Swing Adsorption Process
F-29
Table of Contents
Inogen, Inc.
Notes to financial statements
(amounts in thousands, except share and per share amounts)
6. Commitments and contingencies (continued)
Legal proceedings (continued)
Operation And Optimization”, or the ’136 patent. We alleged in the Lawsuit that certain of Defendant’s oxygen concentrators infringe various claims of the ’343 and ’136 patents. The Lawsuit seeks damages, injunctive relief, costs and attorney fees.
The Defendant has answered the complaint, denying infringement and asserting various sets of defenses including non-infringement, invalidity and unenforceability, patent misuse, unclean hands, laches and estoppel. The Defendant also filed counterclaims against us alleging patent invalidity, non-infringement and inequitable conduct. We denied the allegations in the Defendant’s counterclaims. We have filed a motion to dismiss Defendant’s inequitable conduct counterclaim.
The Defendant filed a request with the U.S. Patent and Trademark Office seeking an inter partes reexamination of the ’343 and ’136 patents. The Defendant also filed a motion to stay the Lawsuit pending outcome of the reexamination. On March 20, 2012, the Court granted the Defendant’s motion to stay the Lawsuit pending outcome of the reexamination and also granted our motion to dismiss the Defendant’s inequitable conduct counterclaim.
The Company is party to various other legal proceedings arising in the normal course of business. The Company carries insurance, subject to deductibles under the specified policies, to protect against losses from certain types of legal claims. The Company does not anticipate that any of these proceedings will have a material impact on the Company.
7. Convertible preferred stock
A summary of the terms of the various types of redeemable convertible preferred stock at December 31, 2012 is as follows:
| Series | B | C | D | E | F | G | Total | |||||||||||||||||||||
|
|
||||||||||||||||||||||||||||
| Shares authorized |
425,527 | 380,142 | 1,619,441 | 1,639,117 | 2,701,959 | 2,840,264 | 9,606,450 | |||||||||||||||||||||
| Shares issued |
425,511 | 365,903 | 1,487,225 | 1,634,874 | 2,701,957 | 2,840,260 | 9,455,730 | |||||||||||||||||||||
| Par value |
$ | 0.001 | $ | 0.001 | $ | 0.001 | $ | 0.001 | $ | 0.001 | $ | 0.001 | ||||||||||||||||
| Conversion rate |
1.45108 | 1.73014 | 1.87951 | 2.69244 | 1.0000 | 1.0000 | ||||||||||||||||||||||
| Liquidation preference per share |
11.880 | 17.580 | 21.900 | 19.224 | 7.140 | 14.083 | ||||||||||||||||||||||
| Dividend rate |
5% | 8% | 8% | 8% | 8% | 8% | ||||||||||||||||||||||
| Issue date |
July 2003 | June 2004 |
|
July 2005 to July 2007 |
|
|
October 2007 to February 2009 |
|
|
February 2010 to June 2010 |
|
|
March 2012 |
|
||||||||||||||
| Redemption date |
|
January 1, 2016 |
|
|
January 1, 2016 |
|
|
January 1, 2016 |
|
|
January 1, 2016 |
|
|
January 1, 2016 |
|
|
January 1, 2016 |
|
||||||||||
|
|
||||||||||||||||||||||||||||
F-30
Table of Contents
Inogen, Inc.
Notes to financial statements
(amounts in thousands, except share and per share amounts)
7. Convertible preferred stock (continued)
A summary of the terms of non-redeemable convertible preferred stock at December 31, 2012 is as follows:
| Series | A | |||
|
|
||||
| Shares authorized |
66,666 | |||
| Shares issued |
66,666 | |||
| Par value |
$ | 0.001 | ||
| Conversion rate |
1.01709 | |||
| Liquidation preference per share |
3.750 | |||
| Dividend rate |
5% | |||
| Issue date |
May 2002 | |||
|
|
||||
Dividends
Series G preferred stockholders are entitled to receive dividends prior and in preference to any declaration or payment of any dividend on all existing series of preferred stock and common stock at the rate of 8% of its original issue price. Subject to the prior rights of the holders of Series G preferred stock, Series F preferred stockholders are entitled to receive dividends prior and in preference to any declaration or payment of any dividend on all existing series of preferred stock and common stock at the rate of 8% of its original issue price.
Subject to the prior rights of the holders of Series G and F preferred stock, the Series E preferred stockholders are entitled to receive dividends prior and in preference to any declaration or payment of any dividend on Series A, B, C, and D preferred stock and common stock at the rate of 8% of its original issue price.
Subject to the prior rights of the holders of Series G, F, and E preferred stock, the Series D preferred stockholders are entitled to receive dividends prior and in preference to any declaration or payment of any dividend on Series A, B and C preferred stock and common stock at the rate of 8% of its original issue price.
Subject to the prior rights of the holders of Series G, F, E and D preferred stocks, the Series C preferred stockholders are entitled to receive dividends prior and in preference to any declaration or payment of any dividend on Series A and B preferred stock and common stock at the rate of 8% of its original issue price. Subject to the prior rights of the holders of Series G, F, E, D and C preferred stocks, the Series A and B preferred stockholders are entitled to receive dividends prior and in preference to any declaration or payment of any dividend on common stock at the rate of 5% of its original issue price. Dividends are only payable when, as and if declared and are not cumulative for all series. There were no dividends declared during the years ended December 31, 2012 and 2011.
F-31
Table of Contents
Inogen, Inc.
Notes to financial statements
(amounts in thousands, except share and per share amounts)
7. Convertible preferred stock (continued)
Liquidation preferences
In the event of any liquidation, including deemed liquidation (as defined in the Company’s Certificate of Incorporation), dissolution or winding up of the Company, the holders of Series G, F and E preferred stock are entitled to be paid out an amount per share of Series G, F and E preferred stock equal to two times the original Series G, F and E issue price, respectively, plus any declared but unpaid dividends before any amounts are paid to both holders of common stock and any other series of preferred stock. All other series of preferred stock are redeemed at their original issue price plus any declared, but unpaid dividends.
After preferential liquidation proceeds are paid or set aside for payment to all Series of preferred stock, the remaining assets and funds of the Company available for distribution to stockholders are distributable ratably among the holders of common and preferred stock on an as-converted to common stock basis.
Conversion
All series of preferred stock may be converted at any time after issuance, at the option of the holder, into shares of common stock as is determined by dividing the applicable issue price by the applicable conversion price of each as defined in the Company’s Certificate of Incorporation. The conversion rate for all series will initially be one for one, subject to anti-dilution and other customary adjustments (see “Anti-dilution” below).
Each share of preferred stock will automatically convert into common stock, at the then applicable conversion rate, upon (i) the election of both the holders of a majority of the then-outstanding Series F preferred stock and Series G preferred stock, voting together as a single class provided, or (ii) the closing of an underwritten initial public offering of the Company’s common stock pursuant to a registration statement under the Securities Act of 1933, as amended with aggregate proceeds of at least $40 million at an offering price of at least $17.85 per share (as adjusted for stock splits, stock dividends, recapitalizations, etc.). If the Series G preferred shares are converted to common stock in connection with an initial public offering in which shares are sold to the public at a price that is less than $14.0832 per share (as adjusted for stock splits, stock dividends, recapitalizations, etc.), then immediately prior to such conversion, the applicable conversion rate of the Series G preferred stock shall be increased to the extent necessary to make the Series G preferred holders whole as if the initial public offering price to the public had been equal to $14.0832 (as adjusted for stock splits, stock dividends, recapitalizations, etc.).
The Company expects that regardless of whether the offering has aggregate proceeds in excess of $40 million and an offering price in excess of $17.85 per share, that the requisite stockholders would voluntarily agree to the conversion of their preferred stock in connection with the offering because it is a condition to closing the offering that all preferred stock convert to common stock.
F-32
Table of Contents
Inogen, Inc.
Notes to financial statements
(amounts in thousands, except share and per share amounts)
7. Convertible preferred stock (continued)
Anti-dilution
Upon each issuance by the Company of any Additional Shares, as defined in the Company’s Certificate of Incorporation, without consideration or for consideration less than the Series A to G conversion price in effect immediately prior to the issuance of such additional stock, then the Series A to G conversion price is reduced based on a defined formula.
The Series A to D and Series E to G preferred stock will be subject to adjustment on a partial ratchet basis and on a full ratchet basis, respectively, if the Company issues additional stock at a price per share less than the then Applicable Conversion Price, except for customary exceptions already set forth in the Company’s Certificate of Incorporation.
On March 12, 2012, the Company issued and sold an aggregate of 2,840,260 shares of Series G Preferred Stock for $20,000, at a price of $7.0416 per share (March Issuance).
Immediately prior to such Issuance, the Series A Conversion Price was $3.687, the Series B Conversion Price was $8.436, the Series C Conversion Price was $10.836, the Series D Conversion Price was $12.651, the Series E Conversion Price was $3.570, and the Series F Conversion Price was $3.570.
According to the formula defined in the Certificate of Incorporation and simultaneous with the March Issuance, the Series A Conversion Price was not adjusted and remained at $3.687 per share, the Series B Conversion Price was adjusted to $8.187 per share, the Series C Conversion Price was adjusted to $10.161 per share, the Series D Conversion Price was adjusted to $11.652 per share, the Series E Conversion Price was not adjusted and remained at $3.570 per share, and the Series F Conversion Price was not adjusted and remained at $3.570 per share.
Voting rights
The holder of any share of preferred stock will have the right to a number of votes equal to the number of shares of common stock issuable upon conversion of each such share of preferred stock and has full voting rights and powers of the holders of common stock. The preferred stockholders will be entitled to vote with the holders of common stock on all matters except as specifically provided in the Certificate of Incorporation or as otherwise prohibited by law.
Protective provisions
The holders of at least 66 2/3% of preferred stock on an as converted to common stock basis are required to approve certain specified actions as outlined in the Company’s Certificate of Incorporation. In addition, the holders of at least 60% of the Series D preferred stock are required to approve certain specified actions as outlined in the Company’s Certificate of Incorporation. In addition, the Company cannot amend its Certificate of Incorporation without the approval of at least 66 2/3% of any series of preferred stock if such amendment would change any of the rights, preferences or privileges of such series.
F-33
Table of Contents
Inogen, Inc.
Notes to financial statements
(amounts in thousands, except share and per share amounts)
7. Convertible preferred stock (continued)
Redemption
From and after January 1, 2016, each holder of the Series B, C, D, E, F, and G preferred stock, upon written approval of the holders of at least a majority of the related series shares then outstanding, may, at its option, at any time (and from time to time), require the Company to redeem all or part of the series held by such holder by delivery of a written notice requesting such redemption and the number of shares to be redeemed. The redemption price is equivalent to the liquidation preference for each series of preferred stock.
The redemption provisions of the Series B, C, D, E, F, and G preferred stock are not solely within the control of the Company. Therefore, the Company has presented these series of preferred stock as a component of redeemable convertible preferred stock and not stockholders’ deficit. The Company initially recorded these series of preferred stock at their fair value. As the Series E and F preferred stock have redemption amounts greater than their initial fair value, the Company accretes the carrying value to the redemption value using the interest method. The accretion is treated in the same manner as dividends on nonredeemable stock and are recorded by charges against additional paid-in capital or accumulated deficit.
8. Stock incentive plan
The Company has a 2012 Stock Incentive Plan (2012 Plan) under which the Company has reserved 1,216,772 shares of common stock, to be issued in connection with stock options and other equity awards issued under the 2012 Plan. The 2012 Plan provides for option grants at exercise prices not less than 100% of the fair value of common stock on the date of grant.
Previously, the Company had a 2002 Stock Incentive Plan (2002 Plan), as amended. As of March 12, 2012, the 2002 Plan was terminated and the 2012 Plan was created in its place. On termination, the 2002 Plan had 1,424,540 shares of common stock outstanding. Any shares returned to the 2002 Plan as a result of expiration or termination of equity awards (up to 1,424,646 shares) are added to the 2012 Plan Share reserve.
Options typically expire ten years from the date of grant and vest over on to four year terms. Options have been granted to employees and consultants of the Company at the deemed fair market value, as determined by the Board of Directors, of the shares underlying the options at the date of grant.
F-34
Table of Contents
Inogen, Inc.
Notes to financial statements
(amounts in thousands, except share and per share amounts)
8. Stock incentive plan (continued)
The activity for stock options under the Plan is as follows:
| Options | Price per share |
Weighted average exercise price |
Weighted years) |
Average intrinsic value |
||||||||||||||||
|
|
||||||||||||||||||||
| Outstanding at December 31, 2010 |
1,304,602 | $ | 0.90 - $8.70 | $ | 1.1715 | |||||||||||||||
| Granted |
158,175 | $ | 0.75 - $0.75 | 0.7500 | ||||||||||||||||
| Exercised |
(1,845 | ) | $ | 0.60 - $2.10 | 0.8709 | |||||||||||||||
| Forfeited |
(7,358 | ) | $ | 0.60 - $0.75 | 0.6138 | |||||||||||||||
| Expired |
(28,045 | ) | $ | 0.60 - $8.70 | 2.4108 | |||||||||||||||
|
|
|
|||||||||||||||||||
| Outstanding at December 31, 2011 |
1,425,529 | $ | 0.60 - $8.70 | $ | 1.1028 | |||||||||||||||
| Granted |
248,596 | $ | 0.81 - $0.81 | 0.8100 | ||||||||||||||||
| Exercised |
(4,270 | ) | $ | 0.75 - $0.75 | 0.7500 | |||||||||||||||
| Forfeited |
(19,779 | ) | $ | 0.60 - $0.75 | 0.7377 | |||||||||||||||
| Expired |
(3,956 | ) | $ | 0.60 - $2.40 | 0.7668 | |||||||||||||||
|
|
|
|||||||||||||||||||
| Outstanding at December 31, 2012 |
1,646,120 | $ | 0.60 - $2.40 | $ | 1.0647 | 21.1848 | $ | 174 | ||||||||||||
|
|
|
|||||||||||||||||||
| Exercisable at December 31, 2012 |
1,318,522 | $ | 0.60 - $8.70 | $ | 1.1358 | 19.7358 | $ | 45 | ||||||||||||
|
|
|
|
||||||||||||||||||
The number of equity awards available for grant under the Plan as of December 31, 2012 and 2011 was 1,216,772 and 354,890, respectively.
The following table summarizes information about stock options outstanding at December 31, 2012:
| Outstanding | Exercisable | |||||||||||||||||||
| Exercise price per share | Weighted Average | Weighted average |
||||||||||||||||||
| Shares | life (years) |
exercise price |
Shares | exercise price |
||||||||||||||||
|
|
||||||||||||||||||||
| $0.60 |
928,032 | 6.9637 | $ | 0.60 | 902,883 | $ | 0.60 | |||||||||||||
| $0.75 |
133,753 | 8.7582 | $ | 0.75 | 46,055 | $ | 0.75 | |||||||||||||
| $0.81 |
248,596 | 9.3212 | $ | 0.81 | 33,845 | $ | 0.81 | |||||||||||||
| $2.10 |
66 | 1.0904 | $ | 2.10 | 66 | $ | 2.10 | |||||||||||||
| $2.40 |
316,089 | 5.1366 | $ | 2.40 | 316,089 | $ | 2.40 | |||||||||||||
| $3.60 |
4,864 | 1.2986 | $ | 3.60 | 4,864 | $ | 3.60 | |||||||||||||
| $4.50 |
965 | 1.7561 | $ | 4.50 | 965 | $ | 4.50 | |||||||||||||
| $6.00 |
2,298 | 2.0797 | $ | 6.00 | 2,298 | $ | 6.00 | |||||||||||||
| $8.70 |
11,457 | 3.1808 | $ | 8.70 | 11,457 | $ | 8.70 | |||||||||||||
|
|
|
|
|
|||||||||||||||||
| 1,646,120 | 1,318,522 | |||||||||||||||||||
|
|
||||||||||||||||||||
F-35
Table of Contents
Inogen, Inc.
Notes to financial statements
(amounts in thousands, except share and per share amounts)
8. Stock incentive plan (continued)
The following table summarizes information about stock options outstanding at December 31, 2011:
| Outstanding | Exercisable | |||||||||||||||||||
| Exercise price per share | Weighted Average | Weighted average |
||||||||||||||||||
| Shares | life (years) |
exercise price |
Shares | exercise price |
||||||||||||||||
|
|
||||||||||||||||||||
| $0.60 |
931,511 | 7.9679 | $ | 0.60 | 802,607 | $ | 0.60 | |||||||||||||
| $0.75 |
158,069 | 9.7586 | $ | 0.75 | 9,365 | $ | 0.75 | |||||||||||||
| $2.10 |
66 | 2.0931 | $ | 2.10 | 66 | $ | 2.10 | |||||||||||||
| $2.40 |
316,299 | 6.1397 | $ | 2.40 | 309662 | $ | 2.40 | |||||||||||||
| $3.60 |
4864 | 2.3013 | $ | 3.60 | 4,864 | $ | 3.60 | |||||||||||||
| $4.50 |
965 | 2.7589 | $ | 4.50 | 965 | $ | 4.50 | |||||||||||||
| $6.00 |
2,298 | 3.0824 | $ | 6.00 | 2,298 | $ | 6.00 | |||||||||||||
| $8.70 |
11,457 | 4.1835 | $ | 8.70 | 11,457 | $ | 8.70 | |||||||||||||
|
|
|
|
|
|||||||||||||||||
| 1,425,529 | 1,141,284 | |||||||||||||||||||
|
|
||||||||||||||||||||
Employee stock-based compensation expense recognized in 2012 and 2011 was calculated based on awards ultimately expected to vest and has been reduced for estimated forfeitures at a rate of 5.7%, based on the Company’s historical option cancellations. ASC 718 requires forfeitures to be estimated at the time of grant and revised, if necessary, in subsequent periods if actual forfeitures differ from those estimates.
For the years ended December 31, 2012 and 2011, stock-based compensation expense recognized under ASC 718, included in cost of sales, sales and marketing expense, general and administrative expense, and research and development expense, totaled $60 and $144, respectively.
Valuation assumptions
The employee stock-based compensation expense recognized under ASC 718 was determined using the Black-Scholes method for the year ended December 31, 2012.
Option valuation models require the input of subjective assumptions and these assumptions can vary over time. The risk-free interest rate is the implied yield currently available on U.S. Treasury zero-coupon issues with a remaining term equal to the expected term. The expected term of the options was based on the simplified method outlined in ASC 718. The volatility factors were based on five peer companies selected from Dow Jones Industry Classification Benchmark (ICB) codes 4535 and 4537. These codes include companies which are the same market categories as the Company, which is the medical equipment and supplies line of business. The peer companies were selected based on similarity of market capitalization, size and certain operating characteristics. The calculated volatility value was established by taking the historical daily closing values prior to grant date, over a period equal to the expected term, for each of the peer companies.
F-36
Table of Contents
Inogen, Inc.
Notes to financial statements
(amounts in thousands, except share and per share amounts)
8. Stock incentive plan (continued)
Valuation assumptions (continued)
When the period of data available was less than the expected term, closing values for the longest period of time available were used. The calculated historical volatility of each of these companies was then averaged to determine the calculated value used by the Company.
The value of employee options was estimated on the date of grant using the Black-Scholes option pricing model with the following assumptions used:
| 2012 | 2011 | |||||||
|
|
|
|
|
|
||||
| Expected term (years) |
5.51 - 6.07 | 5.91 - 6.08 | ||||||
| Risk free interest rate |
0.73 - 1.33% | 1.18 - 2.71% | ||||||
| Expected dividend yield |
None | None | ||||||
| Volatility |
48.95 - 50.52% | 47.76 - 48.55% | ||||||
|
|
||||||||
Under these assumptions, the total fair value of the stock option grants during the years ended December 31, 2012 and 2011 was $85 and $38, respectively.
As of December 31, 2012 and 2011, there was $99 and $64, respectively, of total unrecognized compensation expense related to non-vested share-based compensation granted under the Plan.
Non-employee option grants
In accordance with ASC 505 and ASC 718, compensation expense related to non-employee option grants is recognized over the related vesting period as this method approximates the recognition of compensation expense over the service period. The Company had no compensation expense related to non-employee option grants for the years ended December 31, 2012 and 2011, as no non-employee options were granted and all previous grants were fully vested prior to 2011.
9. Warrants
In connection with certain of its redeemable convertible preferred stock issuances, convertible debt financings, and other financing arrangements the Company has issued warrants for shares of its common stock and various issues of its redeemable convertible preferred stock. Such warrants related to its redeemable convertible preferred stock have been recorded as liabilities as a result of non-standard anti-dilution rights and are carried at their estimated fair value using the Monte Carlo valuation model.
F-37
Table of Contents
Inogen, Inc.
Notes to financial statements
(amounts in thousands, except share and per share amounts)
9. Warrants (continued)
A summary of outstanding warrants at December 31, 2012 is as follows:
| Security | Number of warrants |
Exercise price/share |
Expiration date | |||||||
|
| ||||||||||
| Series C preferred |
14,215 | $ | 17.580 | 2015 | ||||||
| Series D preferred |
132,169 | 21.900 | 2013-2014 | |||||||
| Series E preferred |
3,120 | 9.612 | 2015 | |||||||
| Series E preferred |
1,102 | 9.612 | 2016 | |||||||
| Common stock |
233,611 | 0.300 | 2017-2019 | |||||||
|
|
| |||||||||
| 384,217 | ||||||||||
|
| ||||||||||
A summary of outstanding warrants at December 31, 2011 is as follows:
| Security | Number of warrants |
Exercise price/share |
Expiration date | |||||||
|
| ||||||||||
| Series B preferred |
2,429 | $ | 11.880 | 2012 | ||||||
| Series C preferred |
22,055 | 17.580 | 2012 | |||||||
| Series C preferred |
14,215 | 17.580 | 2015 | |||||||
| Series D preferred |
132,169 | 21.900 | 2013-2014 | |||||||
| Series E preferred |
3,120 | 9.612 | 2015 | |||||||
| Series E preferred |
1,102 | 9.612 | 2016 | |||||||
| Common stock |
211,817 | 0.300 | 2017 | |||||||
| Common stock |
39,180 | 0.300 | 2019 | |||||||
|
|
|
|||||||||
| 426,087 | ||||||||||
|
| ||||||||||
A rollforward of warrant activity from January 1, 2011 to December 31, 2012 is as follows:
| Issued and outstanding warrants as of January 1, 2011 |
Warrants exercised |
Warrants expired |
Issued and outstanding warrants as of December 31, 2011 |
|||||||||||||
|
|
||||||||||||||||
| Series B preferred |
2,429 | — | — | 2,429 | ||||||||||||
| Series C preferred |
42,298 | 2,554 | 3,474 | 36,270 | ||||||||||||
| Series D preferred |
132,169 | — | — | 132,169 | ||||||||||||
| Series E preferred |
4,222 | — | — | 4,222 | ||||||||||||
| Common stock |
250,997 | — | — | 250,997 | ||||||||||||
|
|
|
|
|
|
|
|
|
|||||||||
| 432,115 | 2,554 | 3,474 | 426,087 | |||||||||||||
|
|
||||||||||||||||
F-38
Table of Contents
Inogen, Inc.
Notes to financial statements
(amounts in thousands, except share and per share amounts)
9. Warrants (continued)
| Issued and outstanding warrants as of January 1, 2012 |
Warrants exercised |
Warrants expired |
Issued and outstanding warrants as of December 31, 2012 |
|||||||||||||
|
|
||||||||||||||||
| Series B preferred |
2,429 | 2,429 | — | — | ||||||||||||
| Series C preferred |
36,270 | 22,055 | — | 14,215 | ||||||||||||
| Series D preferred |
132,169 | — | — | 132,169 | ||||||||||||
| Series E preferred |
4,222 | — | — | 4,222 | ||||||||||||
| Common stock |
250,997 | 17,386 | — | 233,611 | ||||||||||||
|
|
|
|||||||||||||||
| 426,087 | 41,870 | 384,217 | ||||||||||||||
|
|
||||||||||||||||
The fair value of the preferred warrant liability was $164 and $337 at December 31, 2012 and 2011, respectively. During the years ended December 31, 2012 and 2011, the Company recorded a gain/(loss) of $148 and $(119), respectively, on the change in fair value of the preferred warrants.
10. Restatement of financial statements
The Company restated certain balances as of January 1, 2011 and for the years ended December 31, 2011 and 2012 to give effect to the following: (1) to record deferred revenue and related expense on a portion of our rental revenue billings that were previously recognized at the beginning of the month of the dates of service, (2) to recognize a portion of our earned but unbilled rental revenue that was previously not fully reported, (3) to record an allowance for various billing errors as a reduction to earned revenue.
The Company also restated the preferred stock warrant liability as of January 1, 2011 and December 31, 2011 and 2012 using the Monte Carlo valuation model whereas previously, the liability was valued using the Black Scholes method.
F-39
Table of Contents
Inogen, Inc.
Notes to financial statements
(amounts in thousands, except share and per share amounts)
10. Restatement of financial statements (continued)
The effect of the adjustments described above is presented in the following table.
| December 31, 2012 | As previously reported |
Adjustments | Restated | |||||||||
|
|
||||||||||||
| Balance sheet data: |
||||||||||||
| Accounts receivable |
$ | 7,103 | $ | (72 | ) | $ | 7,031 | |||||
| Deferred cost of rental revenue |
— | 159 | 159 | |||||||||
| Accumulated depreciation and amortization |
10,851 | (212 | ) | 10,639 | ||||||||
| Deferred revenue |
4 | 1,090 | 1,094 | |||||||||
| Preferred stock warrant liability |
190 | (26 | ) | 164 | ||||||||
| Accumulated deficit |
(80,253 | ) | (765 | ) | (81,018 | ) | ||||||
| Income statement data: |
||||||||||||
| Revenue |
48,968 | (392 | ) | 48,576 | ||||||||
| Cost of rental revenue |
24,798 | (171 | ) | 24,627 | ||||||||
| Change in fair value of warrant liability |
46 | (194 | ) | (148 | ) | |||||||
| Net income |
$ | 591 | $ | (27 | ) | $ | 564 | |||||
|
|
||||||||||||
| December 31, 2011 | As previously reported |
Adjustments | Restated | |||||||||
|
|
||||||||||||
| Balance sheet data: |
||||||||||||
| Accounts receivable |
$ | 4,552 | $ | (183 | ) | $ | 4,369 | |||||
| Deferred cost of rental revenue |
— | 70 | 70 | |||||||||
| Accumulated depreciation and amortization |
6,270 | (130 | ) | 6,140 | ||||||||
| Deferred revenue |
8 | 586 | 594 | |||||||||
| Preferred stock warrant liability |
168 | 169 | 337 | |||||||||
| Accumulated deficit |
(75,076 | ) | (738 | ) | (75,814 | ) | ||||||
| Income statement data: |
||||||||||||
| Revenue |
31,171 | (537 | ) | 30,634 | ||||||||
| Cost of rental revenue |
16,022 | (92 | ) | 15,930 | ||||||||
| Change in fair value of warrant liability |
11 | 108 | 119 | |||||||||
| Net loss |
$ | (1,449 | ) | $ | (553 | ) | $ | (2,002 | ) | |||
|
|
||||||||||||
11. Subsequent events (after December 31, 2012)
In January 2013, the Company received notification from the Center for Medicare & Medicaid Services about pricing for the Competitive Bidding program that was expanded to 100 additional Metropolitan Statistical Areas. Pricing decreased on average approximately 45% from current Medicare allowable rates for oxygen products. The new payment rates went into effect July 1, 2013. The Company received notification that the Centers for Medicare & Medicaid Services was offering Inogen 89 non-exclusive contracts to continue to operate in these markets.
F-40
Table of Contents
Inogen, Inc.
Notes to financial statements
(amounts in thousands, except share and per share amounts)
11. Subsequent events (after December 31, 2012) (continued)
From February 2013 through June 2013, the Company issued 56,161 shares of Series D preferred stock for warrants that were exercised by existing shareholders at a purchase price of $21.90 per share, raising $1,230 in capital.
In February 2013, the Company granted a total of 376,600 common stock options at an exercise price of $1.17 per share, all of which vest over four years.
In May 2013, the Company granted a total of 63,333 common stock options at an exercise price of $1.17 per share, all of which vest over four years.
From July 2013 through September 2013, the Company issued 29,368 shares of Series D preferred stock for warrants that were exercised by existing shareholders at a purchase price of $21.90 per share, raising $644 in capital.
In October 2013, the Company granted a total of 276,333 common stock options at an exercise price of $8.37 per share, of which 3,749 vest over twelve months and the remainder vest over four years.
In October 2013, the Board approved revised employment agreements for the executive team including the CEO, CFO, EVP, Sales & Marketing, VP, Engineering, and the VP, Operations which included revised compensation arrangements including severance.
In October 2013, the Company received notification from the Centers for Medicare and Medicaid Services about pricing for the Competitive Bidding program that was re-bid in 9 Metropolitan Statistical Areas as contracts would expire December 31, 2013. The Centers for Medicare & Medicaid Services announced average savings of approximately 37% off the current payments rates in effect from the product categories included in competitive bidding. Inogen currently has contracts in 6 of these Metropolitan Statistical Areas. The new contracts and payment rates would go into effect January 1, 2014. The Company was offered 3 contracts to provide respiratory equipment in 3 of the 9 competitive bidding areas, and we accepted and signed those contracts. We are required to be able to supply additional respiratory products such as sleep and aerosol therapy, which have lower margins than our existing products.
On November 11, 2013, the Company’s Board of Directors and stockholders approved a 3:1 reverse stock split. This became effective as of November 12, 2013 and the effect of this event has been reflected in all of the share quantities and per share amounts throughout the financials. The shares of common stock retained a par value of $0.001.
F-41
Table of Contents
Contents
Financial statements
As of and for the nine months ended
September 30, 2013 and 2012
(unaudited)
F-42
Table of Contents
Balance sheets
(unaudited)
(amounts in thousands)
| As of September 30, | ||||||||
| 2013 | 2012 | |||||||
|
|
||||||||
| Assets |
||||||||
| Current assets |
||||||||
| Cash and cash equivalents |
$ | 17,059 | $ | 17,098 | ||||
| Accounts receivable, net of allowances of $3,890 and $2,449 at September 30, 2013 and 2012, respectively |
9,707 | 7,242 | ||||||
| Inventories |
4,097 | 3,174 | ||||||
| Deferred costs of rental revenue |
283 | 124 | ||||||
| Prepaid expenses and other current assets |
450 | 468 | ||||||
|
|
|
|||||||
| Total current assets |
31,596 | 28,106 | ||||||
|
|
|
|||||||
| Property and equipment |
||||||||
| Rental equipment |
36,282 | 22,117 | ||||||
| Manufacturing equipment and tooling |
2,568 | 2,550 | ||||||
| Computer equipment and software |
2,638 | 1,629 | ||||||
| Furniture and equipment |
616 | 449 | ||||||
| Leasehold improvements |
878 | 499 | ||||||
| Construction in process |
990 | 401 | ||||||
|
|
|
|||||||
| Total property and equipment |
43,972 | 27,645 | ||||||
|
|
|
|||||||
| Less accumulated depreciation and amortization |
(15,410 | ) | (9,222 | ) | ||||
|
|
|
|||||||
| Property and equipment, net |
28,562 | 18,423 | ||||||
|
|
|
|||||||
| Intangible assets, net |
362 | 638 | ||||||
| Other assets |
342 | 79 | ||||||
|
|
|
|||||||
| Total assets |
$ | 60,862 | $ | 47,246 | ||||
|
|
||||||||
See accompanying notes to financial statements.
F-43
Table of Contents
Inogen, Inc.
Balance sheets (continued)
(unaudited)
(amounts in thousands, except share and per share amounts)
| As of September 30, | ||||||||
| 2013 | 2012 | |||||||
|
|
||||||||
| Liabilities, redeemable convertible preferred stock and stockholders’ deficit |
||||||||
| Current liabilities |
||||||||
| Accounts payable and accrued expenses |
$ | 11,500 | $ | 7,954 | ||||
| Current portion of long-term debt |
5,379 | 3,561 | ||||||
| Warranty reserve |
843 | 395 | ||||||
| Deferred revenue |
1,387 | 851 | ||||||
| Income tax payable |
125 | 41 | ||||||
| Deferred income taxes, net |
10 | 7 | ||||||
|
|
|
|||||||
| Total current liabilities |
19,244 | 12,809 | ||||||
|
|
|
|||||||
| Long-term liabilities |
||||||||
| Preferred stock warrant liability |
201 | 176 | ||||||
| Deferred revenue non-current |
574 | — | ||||||
| Long-term debt, net of current portion |
6,648 | 6,058 | ||||||
|
|
|
|||||||
| Total liabilities |
26,667 | 19,043 | ||||||
|
|
|
|||||||
| Commitments and contingencies (Note 5) |
||||||||
| Redeemable convertible preferred stock |
||||||||
| Preferred stock, $0.001 par value per share; 9,606,450 shares authorized; 9,541,259 and 9,442,083 shares issued and outstanding; liquidation preference of $136,652 and $134,539 at September 30, 2013 and 2012, respectively |
116,744 | 107,431 | ||||||
| Stockholders’ deficit |
||||||||
| Preferred stock, $0.001 par value per share; 66,666 shares authorized; 66,666 issued and outstanding; liquidation preference of $250 at both September 30, 2013 and 2012 |
247 | 247 | ||||||
| Common stock, $0.001 par value per share; 18,333,333 shares authorized; 276,618 and 271,992 shares issued and outstanding at September 30, 2013 and 2012, respectively |
1 | 1 | ||||||
| Accumulated deficit |
(82,797 | ) | (79,476 | ) | ||||
|
|
|
|||||||
| Total stockholders’ deficit |
(82,549 | ) | (79,228 | ) | ||||
|
|
|
|||||||
| Total liabilities, redeemable convertible preferred stock and stockholders’ deficit |
$ | 60,862 | $ | 47,246 | ||||
|
|
||||||||
See accompanying notes to financial statements.
F-44
Table of Contents
Statements of operations
(unaudited)
(amounts in thousands, except share and per share amounts)
| Nine months ended September 30, |
||||||||
| 2013 | 2012 | |||||||
|
|
||||||||
| Revenue |
||||||||
| Sales revenue |
$ | 33,043 | $ | 20,375 | ||||
| Rental revenue |
21,901 | 13,898 | ||||||
| Sales of used rental equipment |
200 | 53 | ||||||
| Other revenue |
537 | 409 | ||||||
|
|
|
|||||||
| Total revenue |
55,681 | 34,735 | ||||||
| Cost of revenue |
||||||||
| Cost of sales revenue |
18,309 | 12,679 | ||||||
| Cost of rental revenue, including depreciation of $4,921 and $2,823, respectively |
8,459 | 5,122 | ||||||
| Cost of used rental equipment sales |
97 | 20 | ||||||
|
|
|
|||||||
| Total cost of revenue |
26,865 | 17,821 | ||||||
|
|
|
|||||||
| Gross profit |
28,816 | 16,914 | ||||||
|
|
|
|||||||
| Operating expenses |
||||||||
| Research and development |
1,817 | 1,731 | ||||||
| Sales and marketing |
13,292 | 8,753 | ||||||
| General and administrative |
9,796 | 5,805 | ||||||
|
|
|
|||||||
| Total operating expenses |
24,905 | 16,289 | ||||||
|
|
|
|||||||
| Income from operations |
3,911 | 625 | ||||||
|
|
|
|||||||
| Other (expense) income |
||||||||
| Interest expense |
(312 | ) | (381 | ) | ||||
| Interest income |
9 | 84 | ||||||
| (Increase) decrease in fair value of preferred stock warrant liability |
(202 | ) | 148 | |||||
| Other income |
209 | — | ||||||
|
|
|
|||||||
| Total other (expense) income |
(296 | ) | (149 | ) | ||||
|
|
|
|||||||
| Income before provision for income taxes |
3,615 | 476 | ||||||
| Provision for income taxes |
151 | 20 | ||||||
|
|
|
|||||||
| Net income |
$ | 3,464 | $ | 456 | ||||
| Less deemed dividend on redeemable convertible preferred stock |
(5,359 | ) | (4,119 | ) | ||||
|
|
|
|||||||
| Net loss attributable to common stockholders |
$ | (1,895 | ) | $ | (3,663 | ) | ||
|
|
|
|||||||
| Basic and diluted net loss per share attributable to common stockholders |
$ | (6.91 | ) | (14.02 | ) | |||
| Weighted average number of shares used in calculating loss per share attributable to common stockholders—basic and diluted |
274,357 | 261,216 | ||||||
| Pro forma net income per share attributable to common stockholders |
||||||||
| Basic |
$ | 0.24 | ||||||
| Diluted |
$ | 0.22 | ||||||
| Shares used in computing pro forma net income per share |
||||||||
| Basic |
14,516,523 | |||||||
| Diluted |
15,733,279 | |||||||
|
|
||||||||
See accompanying notes to financial statements.
F-45
Table of Contents
Statements of redeemable convertible preferred stock
(unaudited)
(amounts in thousands, except share amounts)
| Redeemable series B convertible preferred stock |
Redeemable series C convertible preferred stock |
Redeemable series D convertible preferred stock |
Redeemable series E convertible preferred stock |
Redeemable series F convertible preferred stock |
Redeemable series G convertible preferred stock |
Total redeemable convertible preferred stock |
||||||||||||||||||||||||||||||||||||||||||||||
| Shares | Amount | Shares | Amount | Shares | Amount | Shares | Amount | Shares | Amount | Shares | Amount | |||||||||||||||||||||||||||||||||||||||||
|
|
||||||||||||||||||||||||||||||||||||||||||||||||||||
| Balance, December 31, 2011 |
423,082 | $ | 5,026 | 343,848 | $ | 6,048 | 1,487,225 | $ | 32,571 | 1,634,874 | $ | 26,925 | 2,701,957 | $ | 12,552 | — | $ | — | $ | 83,122 | ||||||||||||||||||||||||||||||||
|
|
|
|||||||||||||||||||||||||||||||||||||||||||||||||||
| Warrants exercised |
2,429 | 30 | 8,408 | 160 | — | — | — | — | — | — | — | — | 190 | |||||||||||||||||||||||||||||||||||||||
| Series G financing, net of issuance costs |
— | — | — | — | — | — | — | — | — | — | 2,840,260 | 19,945 | 19,945 | |||||||||||||||||||||||||||||||||||||||
| Accretion of Series G financing costs |
— | — | — | — | — | — | — | — | — | — | — | 55 | 55 | |||||||||||||||||||||||||||||||||||||||
| Deemed dividend on redeemable convertible preferred stock |
— | — | — | — | — | — | — | 854 | — | 1,137 | — | 2,128 | 4,119 | |||||||||||||||||||||||||||||||||||||||
|
|
|
|||||||||||||||||||||||||||||||||||||||||||||||||||
| Balance, September 30, 2012 |
425,511 | 5,056 | 352,256 | 6,208 | 1,487,225 | 32,571 | 1,634,874 | 27,779 | 2,701,957 | 13,689 | 2,840,260 | 22,128 | 107,431 | |||||||||||||||||||||||||||||||||||||||
|
|
|
|||||||||||||||||||||||||||||||||||||||||||||||||||
| Warrants exercised |
— | — | 13,647 | 252 | — | — | — | — | — | — | — | — | 252 | |||||||||||||||||||||||||||||||||||||||
| Deemed dividend on redeemable convertible preferred stock |
— | — | — | — | — | — | — | 265 | — | 366 | — | 1,031 | 1,662 | |||||||||||||||||||||||||||||||||||||||
|
|
|
|||||||||||||||||||||||||||||||||||||||||||||||||||
| Balance, December 31, 2012 |
425,511 | 5,056 | 365,903 | 6,460 | 1,487,225 | 32,571 | 1,634,874 | 28,044 | 2,701,957 | 14,055 | 2,840,260 | 23,159 | 109,345 | |||||||||||||||||||||||||||||||||||||||
|
|
|
|||||||||||||||||||||||||||||||||||||||||||||||||||
| Warrants exercised |
— | — | — | — | 85,529 | 2,040 | — | — | — | — | — | — | 2,040 | |||||||||||||||||||||||||||||||||||||||
| Deemed dividend on redeemable convertible preferred stock |
— | — | — | — | — | — | — | 810 | — | 1,159 | — | 3,390 | 5,359 | |||||||||||||||||||||||||||||||||||||||
|
|
|
|||||||||||||||||||||||||||||||||||||||||||||||||||
| Balance, September 30, 2013 |
425,511 | $ | 5,056 | 365,903 | $ | 6,460 | 1,572,754 | $ | 34,611 | 1,634,874 | $ | 28,854 | 2,701,957 | $ | 15,214 | 2,840,260 | $ | 26,549 | $ | 116,744 | ||||||||||||||||||||||||||||||||
|
|
||||||||||||||||||||||||||||||||||||||||||||||||||||
See accompanying notes to financial statements
F-46
Table of Contents
Statements of stockholders’ deficit
(unaudited)
(amounts in thousands, except share amounts)
| Series A convertible preferred stock |
Common stock | Additional paid-in capital |
Accumulated deficit |
Total stockholders’ deficit |
||||||||||||||||||||||||
| Shares | Amount | Shares | Amount | |||||||||||||||||||||||||
|
|
||||||||||||||||||||||||||||
| Balance, December 31, 2011 |
66,666 | $ | 247 | 250,440 | $ | 1 | $ | — | $ | (75,814 | ) | $ | (75,566 | ) | ||||||||||||||
| Stock-based compensation |
— | — | — | — | 48 | — | 48 | |||||||||||||||||||||
| Stock options exercised |
— | — | 4,166 | — | 3 | — | 3 | |||||||||||||||||||||
| Warrants exercised—common |
— | — | 17,386 | — | 5 | — | 5 | |||||||||||||||||||||
| Accretion of series G financing costs |
— | — | — | — | — | (55 | ) | (55 | ) | |||||||||||||||||||
| Deemed dividend on redeemable convertible preferred stock |
— | — | — | — | (56 | ) | (4,063 | ) | (4,119 | ) | ||||||||||||||||||
| Net income |
— | — | — | — | — | 456 | 456 | |||||||||||||||||||||
|
|
|
|||||||||||||||||||||||||||
| Balance, September 30, 2012 |
66,666 | 247 | 271,992 | 1 | — | (79,476 | ) | (79,228 | ) | |||||||||||||||||||
| Stock-based compensation |
— | — | — | — | 12 | — | 12 | |||||||||||||||||||||
| Stock options exercised |
— | — | 104 | — | — | — | — | |||||||||||||||||||||
| Deemed dividend on redeemable convertible preferred stock |
— | — | — | — | (12 | ) | (1,650 | ) | (1,662 | ) | ||||||||||||||||||
| Net income |
— | — | — | — | — | 108 | 108 | |||||||||||||||||||||
|
|
|
|||||||||||||||||||||||||||
| Balance, December 31, 2012 |
66,666 | 247 | 272,096 | 1 | — | (81,018 | ) | (80,770 | ) | |||||||||||||||||||
| Stock-based compensation |
— | — | — | — | 116 | — | 116 | |||||||||||||||||||||
| Stock options exercised |
— | — | 4,522 | — | — | — | — | |||||||||||||||||||||
| Deemed dividend on redeemable convertible preferred stock |
— | — | — | — | (116 | ) | (5,243 | ) | (5,359 | ) | ||||||||||||||||||
| Net income |
— | — | — | — | — | 3,464 | 3,464 | |||||||||||||||||||||
|
|
|
|||||||||||||||||||||||||||
| Balance, September 30, 2013 |
66,666 | $ | 247 | 276,618 | $ | 1 | $ | — | $ | (82,797 | ) | $ | (82,549 | ) | ||||||||||||||
|
|
||||||||||||||||||||||||||||
See accompanying notes to financial statements.
F-47
Table of Contents
Statements of cash flows
(unaudited)
(amounts in thousands)
| Nine months ended September 30, |
||||||||
| 2013 | 2012 | |||||||
|
|
||||||||
| Cash flows from operating activities |
||||||||
| Net income |
$ | 3,464 | $ | 456 | ||||
| Adjustments to reconcile net income to net cash provided by operating activities: |
||||||||
| Depreciation and amortization |
5,995 | 3,451 | ||||||
| Loss of rental units |
402 | 199 | ||||||
| Loss on disposal of other fixed assets |
13 | — | ||||||
| Provision for sales returns |
1,090 | 365 | ||||||
| Provision for doubtful accounts and adjustments |
1,353 | 748 | ||||||
| Provision for inventory obsolescence |
63 | 5 | ||||||
| Stock-based compensation expense |
116 | 48 | ||||||
| Increase (decrease) in fair value of preferred stock warrant liability |
202 | (148 | ) | |||||
| Changes in operating assets and liabilities: |
||||||||
| Accounts receivable |
(5,119 | ) | (3,986 | ) | ||||
| Inventories |
(101 | ) | (1,514 | ) | ||||
| Deferred cost of rental revenue expenses |
(124 | ) | (54 | ) | ||||
| Prepaid expenses and other current assets |
(141 | ) | (35 | ) | ||||
| Other assets |
(263 | ) | — | |||||
| Accounts payable and accrued expenses |
3,165 | 2,217 | ||||||
| Warranty reserve |
396 | 145 | ||||||
| Deferred revenue |
867 | 256 | ||||||
| Income tax payable |
100 | 20 | ||||||
|
|
|
|||||||
| Net cash provided by operating activities |
11,478 | 2,173 | ||||||
|
|
|
|||||||
| Cash flows from investing activities |
||||||||
| Investment in intangible assets |
(7 | ) | (63 | ) | ||||
| Production of rental equipment |
(11,918 | ) | (7,401 | ) | ||||
| Purchases of property and equipment |
(2,572 | ) | (1,611 | ) | ||||
| Payment of deposit |
— | (26 | ) | |||||
|
|
|
|||||||
| Net cash used in investing activities |
(14,497 | ) | (9,101 | ) | ||||
|
|
|
|||||||
| Cash flows from financing activities |
||||||||
| Net proceeds from issuance of Series G redeemable convertible preferred stock |
— | 19,945 | ||||||
| Proceeds from redeemable convertible preferred stock warrants exercised |
1,875 | 177 | ||||||
| Proceeds from common stock warrants exercised |
— | 5 | ||||||
| Proceeds from stock options exercised |
— | 3 | ||||||
| Repayment of debt from investment in intangible assets |
(159 | ) | (160 | ) | ||||
| Proceeds from borrowings |
6,000 | 2,000 | ||||||
| Repayment of borrowings |
(2,750 | ) | (1,850 | ) | ||||
|
|
|
|||||||
| Net cash provided by financing activities |
4,966 | 20,120 | ||||||
|
|
|
|||||||
| Net increase in cash and cash equivalents |
1,947 | 13,192 | ||||||
| Cash and cash equivalents, beginning of period |
15,112 | 3,906 | ||||||
|
|
|
|||||||
| Cash and cash equivalents, end of period |
$ | 17,059 | $ | 17,098 | ||||
|
|
|
|||||||
| Supplemental disclosures of cash flow information |
||||||||
| Cash paid during the period for interest |
$ | 307 | $ | 365 | ||||
| Cash paid during the period for income taxes |
124 | 18 | ||||||
| Non-cash transactions: |
||||||||
| Deemed dividend on redeemable convertible preferred stock |
5,359 | 4,119 | ||||||
|
|
||||||||
See accompanying notes to financial statements.
F-48
Table of Contents
Notes to financial statements
(unaudited)
(amounts in thousands, except share and per share amounts)
1. Nature of business
Inogen, Inc. (Company or Inogen) was incorporated in Delaware on November 27, 2001. The Company is a medical technology company that develops, manufactures and markets innovative portable oxygen concentrators used for supplemental long-term oxygen therapy by patients with chronic obstructive pulmonary disease, or COPD, and other chronic respiratory conditions. Our proprietary Inogen One systems are designed to address the quality-of-life and other shortcomings of the traditional oxygen therapy model, which we call the delivery model. Traditionally, oxygen therapy patients have relied upon stationary oxygen concentrator systems in the home in conjunction with regular deliveries of oxygen tanks or cylinders for ambulatory, or mobile, use, limiting their mobility and requiring them to plan activities outside of their homes around delivery schedules and a finite oxygen supply. Our Inogen One systems concentrate the air around them to offer a single source of supplemental oxygen anytime, anywhere in devices weighing approximately five to seven pounds. Our products eliminate the need for oxygen deliveries, as well as regular use of a stationary concentrator, thereby improving patient quality-of-life and fostering patient mobility.
2. Summary of significant accounting policies
Basis of presentation
The financial statements of the Company have been prepared in accordance with accounting principles generally accepted in the United States of America (GAAP). The accompanying balance sheets as of September 30, 2013 and 2012, and the statements of operations and cash flows for the nine months ended September 30, 2013 and 2012 and statements of redeemable preferred stock and stockholders’ deficit are unaudited. The unaudited interim financial statements have been prepared on the same basis as the annual financial statements and, in the opinion of management, reflect all adjustments which include only normal reoccurring adjustments, necessary to present fairly our financial position as of September 30, 2013 and 2012, and the statements of operations and cash flows for the nine months ended September 30, 2012 and 2013 and statements of redeemable preferred stock and stockholders’ deficit. The financial data and other information disclosed in these notes to the financial statements related to the nine-month periods are unaudited. The results for the nine months ended September 30, 2013 are not necessarily indicative of the results to be expected for the year ended December 31, 2013 or for any other interim period or for any other future year. These financial statements should be read in conjunction with our audited financial statements included elsewhere in this registration statement.
Accounting estimates
The preparation of financial statements in conformity with GAAP requires management to make estimates and assumptions that affect the reported amounts of assets and liabilities and disclosure of contingent assets and liabilities at the date of the financial statements and the reported amounts of revenue and expenses during the reporting period. Significant estimates
F-49
Table of Contents
Inogen, Inc.
Notes to financial statements
(unaudited)
(amounts in thousands, except share and per share amounts)
2. Summary of significant accounting policies (continued)
Accounting estimates (continued)
used in preparing these financial statements include accounts receivable reserves, inventory reserves, warranty reserves, warrant liability, stock-based compensation expense and income tax provision. Actual results could differ from those estimates and such differences could be material to the financial position and results of operations.
Revenue recognition
The Company generates revenue primarily from sales and rentals of its products. The Company’s products consist of its proprietary line of oxygen concentrators and related accessories. Other revenue comes from service contracts, extended warranty contracts, and freight revenue for product shipments.
Revenue from product sales is recognized when all of the following criteria are met: (1) persuasive evidence of an arrangement exists; (2) delivery has occurred or services have been rendered; (3) the price to the customer is fixed or determinable; and (4) collectability is reasonably assured.
Revenue from product sales is recognized upon shipment of the product. Provisions for estimated returns and discounts are made at the time of shipment. Provisions for standard warranty obligations, which are included in cost of sales revenue, are also provided for at the time of shipment.
Accruals for estimated standard warranty expenses are made at the time that the associated revenue is recognized. The provisions for estimated returns, discounts and warranty obligations are made based on known claims and discount commitments and estimates of additional returns and warranty obligations based on historical data and future expectations. The Company has accrued $843 and $395 to provide for future warranty costs at September 30, 2013 and 2012, respectively.
The Company recognizes equipment rental revenue over the lease term, which is one month, less estimated adjustments, per ASC 840. The Company has separate contracts with each patient that are not subject to a master lease agreement with any payor. The leases do not contain a bargain renewal option associated with the potential capped free rental period as the Company determined that the lessee cannot renew the lease completely at his or her option, and the exercise of such option is not reasonably assured at lease inception. The lease term begins on the date products are shipped to patients and are recorded at amounts estimated to be received under reimbursement arrangements with third-party payors, including Medicare, private payors, and Medicaid. Due to the nature of the industry and the reimbursement environment in which the Company operates, certain estimates are required to record net revenue and accounts receivable at their net realizable values. Inherent in these estimates is the risk that they will have to be revised or updated as additional information becomes available. Specifically, the
F-50
Table of Contents
Inogen, Inc.
Notes to financial statements
(unaudited)
(amounts in thousands, except share and per share amounts)
2. Summary of significant accounting policies (continued)
Revenue recognition (continued)
complexity of many third-party billing arrangements and the uncertainty of reimbursement amounts for certain services from certain payors may result in adjustments to amounts originally recorded. Such adjustments are typically identified and recorded at the point of cash application, claim denial or account review. Accounts receivable are reduced by an allowance for doubtful accounts which provides for those accounts from which payment is not expected to be received, although product was delivered and revenue was earned. Upon determination that an account is uncollectible, it is written-off and charged to the allowance. Amounts billed but not earned due to the timing of the billing cycle are deferred and recognized in income on a straight-line basis over the monthly billing period. For example, if the first day of the billing period does not fall on the first of the month, then a portion of the monthly billing period will fall in the subsequent month and the related revenue and cost would be deferred based on the service days in the following month.
Rental revenue is recognized as earned, less estimated adjustments. Revenue not billed at the end of the period is reviewed for the likelihood of collections and accrued. The rental revenue stream is not guaranteed and payment will cease if the patient no longer needs oxygen or returns the equipment. Revenue recognized is at full estimated allowable amounts; transfers to secondary insurances / patient responsibility have no net effect on revenue. Rental revenue is earned for that month if the patient is on service on the first day of the 30-day period commencing on the recurring date of service for a particular claim, regardless if there is a change in condition/death after that date.
Included in rental revenue are unbilled amounts for which the revenue recognition criteria had been met as of period-end but were not billed. The estimate of unbilled rental revenue accrual is based on historical trends and estimates of future collectability.
Revenue from the sales of used rental equipment is recognized upon delivery and when collectability is reasonably assured and other revenue recognition criteria are met. When a rental unit is sold, the related cost and accumulated depreciation are removed from their respective accounts, and any gains or losses are included in gross profit.
Revenue from the sales of the Company’s services is recognized when no significant obligations remain undelivered and collection of the receivables is reasonably assured. The Company offers extended service contracts on its Inogen One concentrator line for periods ranging from 12 to 24 months after the end of the standard warranty period. Revenue from these extended service contracts is recognized in income on a straight-line basis over the contract period.
The Company also offers a lifetime warranty for direct-to-consumer sales. For a fixed price, the Company agrees to provide a fully functional oxygen concentrator for the remaining life of the patient. Lifetime warranties are only offered to patients upon the initial sale of oxygen equipment by the Company, and are non-transferable. Product sales with lifetime warranties are considered to be multiple element arrangements within the scope of ASC 605-25.
F-51
Table of Contents
Inogen, Inc.
Notes to financial statements
(unaudited)
(amounts in thousands, except share and per share amounts)
2. Summary of significant accounting policies (continued)
Revenue recognition (continued)
There are two deliverables when product that includes a lifetime warranty is sold. The first deliverable is the oxygen concentrator equipment which comes with a standard warranty of three years. The second deliverable is the life time warranty that provides for a functional oxygen concentrator for the remaining lifetime of the patient. These two deliverables qualify as separate units of accounting.
The revenue is allocated to the two deliverables on a relative selling price method. The Company has vendor-specific objective evidence of selling price for the equipment. To determine the selling price of the lifetime warranty, the company uses its best estimate of the selling price for that deliverable as the lifetime warranty is neither separately priced nor selling price is available through third-party evidence. To calculate the selling price associated with the lifetime warranties, management considered the profit margins of the overall business, the average estimated cost of lifetime warranties and the price of extended warranties. A significant estimate used to calculate the price and expense of lifetime warranties is the life expectancy of patients. Based on clinical studies, the company estimates that 60% of patients will succumb to their disease within three years. Given the approximate mortality rate of 20% per year, the company estimates on average all patients will succumb to their disease within five years. The Company has taken into consideration that when patients decide to buy an Inogen portable oxygen concentrator with a lifetime warranty, they typically have already been on oxygen for a period of time, which can have a large impact on their life expectancy from the time our product is deployed.
After applying the relative selling price method, revenue from equipment sales is recognized when all other revenue recognition criteria for product sales are met. Lifetime warranty revenue is recognized using the straight-line method during the fourth and fifth year after the delivery of the equipment which is the estimated usage period of the contract based on the average patient life expectancy.
Shipping and handling
Shipping and handling costs for sold products and rental assets, shipped to the Company’s customers are included on the statements of operations as part of cost of sales revenue and cost of rental revenue, respectively. The Company’s shipping and handling costs relating to sales revenue and rental revenue were $562 and $2,214, respectively, for the nine months ended September 30, 2013. The Company’s shipping and handling costs relating to sales revenue and rental revenue were $480 and $1,415, respectively, for the nine months ended September 30, 2012. Income from shipping and handling fees charged to its customers is included in other revenue on the statements of operations. The Company earned $299 and $155 from shipping and handling fees for the nine months ended September 30, 2013 and 2012, respectively.
F-52
Table of Contents
Inogen, Inc.
Notes to financial statements
(unaudited)
(amounts in thousands, except share and per share amounts)
2. Summary of significant accounting policies (continued)
Fair value of financial instruments
The Company’s financial instruments consist of cash and cash equivalents, accounts receivable, accounts payable and accrued expenses, debt and warrants. The carrying values of cash and cash equivalents, accounts receivable and accounts payable and accrued expenses approximate fair values based on the short-term nature of these financial instruments.
The fair value of the Company’s debt approximates carrying value based on the Company’s current incremental borrowing rate for similar types of borrowing arrangements.
The fair value of the Company’s preferred stock warrant liability is estimated using a Monte Carlo valuation model, as described below.
Fair value accounting
Accounting Standards Codification (ASC) 820, Fair Value Measurements and Disclosures, creates a single definition of fair value, establishes a framework for measuring fair value in GAAP and expands disclosures about fair value measurements. ASC 820 emphasizes that fair value is a market-based measurement, not an entity-specific measurement, and states that a fair value measurement should be determined based on assumptions that market participants would use in pricing the asset or liability. Assets and liabilities adjusted to fair value in the balance sheet are categorized based upon the level of judgment associated with the inputs used to measure their fair value.
Level inputs, as defined by ASC 820, are as follows:
| Level input | Input definition | |
|
| ||
| Level 1 |
Inputs are unadjusted, quoted prices for identical assets or liabilities in active markets at the measurement date. | |
| Level 2 |
Inputs, other than quoted prices included in Level 1, that are observable for the asset or liability through corroboration with market data at the measurement date. | |
| Level 3 |
Unobservable inputs that reflect management’s best estimate of what market participants would use in pricing the asset or liability at the measurement date. | |
|
| ||
The following table summarizes fair value measurements by level at September 30, 2013 for the liabilities measured at fair value on a recurring basis:
| Level 1 | Level 2 | Level 3 | Total | |||||||||||||
|
|
||||||||||||||||
| Preferred stock warrant liability |
$ | — | $ | — | $ | 201 | $ | 201 | ||||||||
|
|
|
|||||||||||||||
| Total liabilities |
$ | — | $ | — | $ | 201 | $ | 201 | ||||||||
|
|
||||||||||||||||
F-53
Table of Contents
Inogen, Inc.
Notes to financial statements
(unaudited)
(amounts in thousands, except share and per share amounts)
2. Summary of significant accounting policies (continued)
Fair value accounting (continued)
The following table summarizes fair value measurements by level at September 30, 2012 for the liabilities measured at fair value on a recurring basis:
| Level 1 | Level 2 | Level 3 | Total | |||||||||||||
|
|
||||||||||||||||
| Preferred stock warrant liability |
$ | — | $ | — | $ | 176 | $ | 176 | ||||||||
|
|
|
|||||||||||||||
| Total liabilities |
$ | — | $ | — | $ | 176 | $ | 176 | ||||||||
|
|
||||||||||||||||
The following table summarizes the fair value measurements using significant Level 3 inputs, and changes therein, for the nine months ended September 30, 2013 and 2012:
| Warrant liability |
||||
|
|
||||
| Balance as of January 1, 2013 |
$ | 164 | ||
| Fair value of preferred stock warrants exercised |
(165 | ) | ||
| Change in fair value |
202 | |||
|
|
|
|||
| Balance as of September 30, 2013 |
$ | 201 | ||
|
|
|
|||
| Balance as of January 1, 2012 |
$ | 337 | ||
| Fair value of preferred stock warrants exercised |
(13 | ) | ||
| Change in fair value |
(148 | ) | ||
|
|
|
|||
| Balance as of September 30, 2012 |
$ | 176 | ||
|
|
||||
The preferred stock warrant liability is marked to market each reporting date until the warrants are settled. The fair value of the preferred stock warrant liability is estimated using a Monte Carlo option pricing model, which takes into consideration the market values of comparable public companies, considering among other factors, the use of multiples of earnings, and adjusted to reflect the restrictions on the ability of the Company’s shares to trade in an active market.
Cash and cash equivalents
Cash equivalents are recorded at cost, which approximates market value. The Company considers all highly liquid investments with original maturities of 90 days or less at the time of purchase to be cash equivalents.
Accounts receivable and allowance for bad debts, returns, and adjustments
Accounts receivable are customer obligations due under normal sales and rental terms. The Company performs continuing credit evaluations of the customers’ financial condition and generally does not require collateral. The allowance for doubtful accounts is maintained at a level that, in management’s opinion, is adequate to absorb potential losses related to account
F-54
Table of Contents
Inogen, Inc.
Notes to financial statements
(unaudited)
(amounts in thousands, except share and per share amounts)
2. Summary of significant accounting policies (continued)
Accounts receivable and allowance for bad debts, returns, and adjustments (continued)
receivables and is based upon the Company’s continuous evaluation of the collectability of outstanding balances. Management’s evaluation takes into consideration such factors as past bad debt experience, economic conditions and information about specific receivables. The Company’s evaluation also considers the age and composition of the outstanding amounts in determining their net realizable value. The allowance is based on estimates, and ultimate losses may vary from current estimates. As adjustments to these estimates become necessary, they are reported in earnings in the periods that they become known. The allowance is increased by bad debt provisions charged to operating expense and reduced by direct write-offs, net of recoveries.
Provision for sales returns applies to direct to consumer sales only. The Company does not allow returns from providers. This reserve is calculated based on actual historical return rates under our 30-day return program and is applied to the current period’s sales revenue for direct to consumer sales.
The Company also records an allowance for rental revenue adjustments and write-offs, which is recorded as a reduction of rental revenue and rental accounts receivable balances. These adjustments and write offs result from contractual adjustments, audit adjustments, untimely claims filings or billings not paid due to another provider performing same or similar functions for the patient in the same period, all of which prevent billed revenue to become realizable. The reserve is based on historical revenue adjustments as a percentage of rental revenue billed during the related period.
When recording the allowance for doubtful accounts, the bad debt expense account (general & administrative expense account) is charged, when recording allowance for sales returns, the sales returns account (contra sales revenue account) is charged, and when recording the allowance for adjustments, the rental revenue adjustments account (contra rental revenue account) is charged.
At September 30, 2012 and 2013, included in accounts receivable on the balance sheets are earned but unbilled receivables of $0.7 million and $1.2 million, respectively.
Concentration of credit risk
Financial instruments that potentially subject the Company to concentration of credit risk consist principally of cash and cash equivalents and accounts receivable. At times, cash account balances may be in excess of the amounts insured by the Federal Deposit Insurance Corporation (FDIC). However, management believes the risk of loss to be minimal. The Company performs periodic evaluations of the relative credit standing of these institutions and has not experienced any losses on its cash and cash equivalents and short-term investments to date.
Concentration of customers and vendors
The Company sells its products to home medical equipment providers in the United States and in foreign countries on a credit basis, which resulted in a customer concentration of a major
F-55
Table of Contents
Inogen, Inc.
Notes to financial statements
(unaudited)
(amounts in thousands, except share and per share amounts)
2. Summary of significant accounting policies (continued)
Concentration of customers and vendors (continued)
customer that accounted for 8% of net revenue in the nine months ended September 30, 2013. This major customer is an international distributor of the Company’s products. The accounts receivable balance from the major customer was $411 or 3% of total accounts receivable at September 30, 2013.
The same customer accounted for 13% of total revenue for the nine months ended September 30, 2012. The accounts receivable balance from the major customer was $1,026 or 11% of total accounts receivable at September 30, 2012.
The Company also rents products directly to patients, which resulted in a customer concentration relating to Medicare’s service reimbursement programs. Medicare’s service reimbursement programs (net of patient coinsurance obligations) accounted for 73% and 77% of rental revenue in the nine months ended September 30, 2013 and 2012, respectively and based on total revenue were 29% and 31% in the nine months ended September 30, 2013 and 2012, respectively. Account receivable balances relating to Medicare’s service reimbursement programs amounted to $3,441 or 25% of total accounts receivable at September 30, 2013, and $2,865 or 30% of total accounts receivable at September 30, 2012.
The Company currently purchases raw materials from a limited number of vendors, which resulted in a concentration of three major vendors that accounted for 16%, 15%, and 9%, respectively, of total raw material purchases in the nine months ended September 30, 2013. The three major vendors supply the Company with raw materials used to manufacture the Company’s products. Accounts payable balances for the three major vendors were $1,065, $532, and $10, respectively, or 18%, 9%, and 0%, respectively, of total accounts payable at September 30, 2013.
For the nine months ended September 30, 2012, the Company’s three major vendors accounted for 20%, 16%, and 9%, respectively, of total raw material purchases. Accounts payable balances for the three major vendors were $1,047, $516, and $407, respectively, or 24%, 12%, and 9%, respectively, of total accounts payable at September 30, 2012.
F-56
Table of Contents
Inogen, Inc.
Notes to financial statements
(unaudited)
(amounts in thousands, except share and per share amounts)
2. Summary of significant accounting policies (continued)
Inventories
Inventories are stated at the lower of cost or market. Cost is determined using a standard cost method, including material, labor and manufacturing overhead, whereby the standard costs are updated at least quarterly to reflect approximate actual costs using the first-in, first-out (FIFO) method and market represents the lower of replacement cost or estimated net realizable value. The Company records adjustments at least quarterly to inventory for potentially excess, obsolete, slow-moving or impaired items. Inventories consist of the following:
| September 30, | ||||||||
| 2013 | 2012 | |||||||
|
|
||||||||
| Raw materials and work-in-progress |
$ | 3,479 | $ | 2,872 | ||||
| Finished goods |
773 | 415 | ||||||
| Less: reserves |
(155 | ) | (113 | ) | ||||
|
|
|
|||||||
| $ | 4,097 | 3,174 | ||||||
|
|
||||||||
Property and equipment
Property and equipment are stated at cost. Depreciation and amortization are calculated using the straight-line method over the assets estimated useful lives as follows:
|
|
||||
| Rental equipment |
1.5-5 years | |||
| Manufacturing equipment and tooling |
5 years | |||
| Computer equipment and software |
3 years | |||
| Furniture and equipment |
3-5 years | |||
| Leasehold improvements |
|
Shorter of 3-7 years or life of underlying lease |
| |
|
|
||||
Expenditures for repairs and maintenance are charged to operations as incurred. Expenditures for additions, improvements and replacements are capitalized.
Rental equipment is recorded at cost and depreciated over the estimated useful life of the equipment using the straight-line method. The range of estimated useful lives for rental equipment is eighteen months to five years. Rental equipment is depreciated to a salvage value of zero. Repair and maintenance costs are included in cost of revenue in the statements of operations. Repair and maintenance expense, including both labor and parts, for the rental equipment was $707 and $345 for the nine months ended September 30, 2013 and 2012, respectively.
F-57
Table of Contents
Inogen, Inc.
Notes to financial statements
(unaudited)
(amounts in thousands, except share and per share amounts)
2. Summary of significant accounting policies (continued)
Property and equipment (continued)
Depreciation and amortization expense related to property and equipment and rental equipment is summarized below. for the nine months ended September 30, 2013 and 2012, respectively.
| September 30, | ||||||||
| 2013 | 2012 | |||||||
|
|
||||||||
| Rental equipment |
$ | 4,921 | $ | 2,823 | ||||
| Other property and equipment |
871 | 410 | ||||||
|
|
|
|||||||
| $ | 5,792 | $ | 3,233 | |||||
|
|
||||||||
Accumulated depreciation related to property and equipment and rental equipment is summarized below for the nine months ended September 30, 2013 and 2012, respectively (in thousands).
| September 30, | ||||||||
| 2013 | 2012 | |||||||
|
|
||||||||
| Rental equipment |
$ | 12,225 | $ | 6,344 | ||||
| Other property and equipment |
3,185 | 2,878 | ||||||
|
|
|
|||||||
| $ | 15,410 | $ | 9,222 | |||||
|
|
||||||||
Long-lived assets
The Company accounts for the impairment and disposition of long-lived assets in accordance with ASC 360, Property, Plant, and Equipment. In accordance with ASC 360, long-lived assets to be held are reviewed for events or changes in circumstances that indicate that their carrying value may not be recoverable. The Company periodically reviews the carrying value of long-lived assets to determine whether or not impairment to such value has occurred. No impairments were recorded during the nine months ended September 30, 2013 and 2012.
Deferred rent
The Company’s operating leases for its office facilities in California and Texas include a rent abatement period and scheduled rent increases. The Company has accounted for the leases to provide straight-line charges to operations over the life of the leases. In addition, the landlord for the Texas facility has reimbursed the Company for $358 for tenant improvements which were capitalized during the nine months ended September 30, 2013. Deferred rent of $546 was included in accounts payable and accrued expenses on the balance sheets.
Research and development
Research and development costs are expensed as incurred.
F-58
Table of Contents
Inogen, Inc.
Notes to financial statements
(unaudited)
(amounts in thousands, except share and per share amounts)
2. Summary of significant accounting policies (continued)
Advertising costs
Advertising costs, which approximated $1,916 and $1,852 during the nine months ended September 30, 2013 and 2012, respectively, are expensed as incurred, excluding the production costs of direct response commercials. Advertising costs are included in sales and marketing expense in the accompanying statements of operations.
Income taxes
The Company accounts for income taxes in accordance with ASC 740, Income Taxes. Under ASC 740, income taxes are recognized for the amount of taxes payable or refundable for the current year and deferred tax liabilities and assets are recognized for the future tax consequences of transactions that have been recognized in the Company’s financial statements or tax returns. A valuation allowance is provided when it is more likely than not that some portion, or all, of the deferred tax asset will not be realized.
The Company accounts for uncertainties in income tax in accordance with ASC 740-10, Accounting for Uncertainty in Income Taxes. ASC 740-10 prescribes a recognition threshold and measurement attribute for the financial statement recognition and measurement of a tax position taken or expected to be taken in a tax return. This Accounting Standard also provides guidance on derecognition, classification, interest and penalties, accounting in interim periods, disclosure and transition.
The Company recognizes interest and penalties on taxes, if any, within operations as income tax expense. No significant interest or penalties were recognized during the periods presented.
The Company operates in multiple states. The statute of limitations has expired for all tax years prior to 2009 for federal and 2008 to 2009 for various state tax purposes. However, the net operating loss generated on the federal and state tax returns in prior years may be subject to adjustments by the federal and state tax authorities.
Accounting for stock-based compensation
The Company accounts for its stock-based compensation in accordance with ASC 718, Compensation—Stock Compensation, which establishes accounting for share-based awards exchanged for employee services and requires companies to expense the estimated fair value of these awards over the requisite employee service period. Share—based compensation cost is determined at the grant date using the Black-Scholes option pricing model. The value of the award that is ultimately expected to vest is recognized as expense on a straight line basis over the employee’s requisite service period.
As part of the provisions of ASC 718, the Company is required to estimate potential forfeitures of stock grants and adjust compensation cost recorded accordingly. The estimate of forfeitures will be adjusted over the requisite service period to the extent that actual forfeitures differ, or are
F-59
Table of Contents
Inogen, Inc.
Notes to financial statements
(unaudited)
(amounts in thousands, except share and per share amounts)
2. Summary of significant accounting policies (continued)
Accounting for stock-based compensation (continued)
expected to differ, from such estimates. Changes in estimated forfeitures will be recognized through a cumulative catch-up adjustment in the period of change and will also impact the amount of stock compensation expense to be recognized in future periods.
Business segments
The Company operates in only one business segment—manufacturing and marketing of oxygen concentrators.
Earnings per share
Earnings per share, or EPS, is computed in accordance with ASC 260, Earnings per Share, and is calculated using the weighted average number of common shares outstanding during each period. Diluted EPS assumes the conversion, exercise or issuance of all potential common stock equivalents unless the effect is to reduce a loss or increase the income per share. For purposes of this calculation, common stock subject to repurchase by the Company, options and warrants are considered to be common stock equivalents and are only included in the calculation of diluted earnings per share when their effect is dilutive.
The shares used to compute basic and diluted net income per share represent the weighted-average common shares outstanding, reduced by the weighted-average unvested common shares subject to repurchase. Further, as the Company’s preferred stockholders have the right to participate in any dividend declared on the Company’s common stock, basic and diluted EPS are potentially subject to computation using the two-class method, under which the Company’s undistributed earnings are allocated amongst the common and preferred shareholders. However, as the Company recorded a net loss attributable to common stockholders for the periods ended September 30, 2013 and 2012, presentation of EPS using the two class method was not necessary.
F-60
Table of Contents
Inogen, Inc.
Notes to financial statements
(unaudited)
(amounts in thousands, except share and per share amounts)
2. Summary of significant accounting policies (continued)
Earnings per share (continued)
The computation of EPS is as follows (amounts in thousands, except share and per share data):
| Nine months ended September 30, | 2013 | 2012 | ||||||
|
|
||||||||
| Numerator—basic and diluted: |
||||||||
| Net income |
$ | 3,464 | $ | 456 | ||||
| Less deemed dividend on redeemable preferred stock |
(5,359 | ) | (4,119 | ) | ||||
|
|
|
|||||||
| Net loss attributable to common stockholders |
$ | (1,895 | ) | $ | (3,663 | ) | ||
| Denominator: |
||||||||
| Weighted-average common shares—basic and diluted |
274,357 | 261,216 | ||||||
| Net loss per share—basic and diluted |
$ | (6.91 | ) | $ | (14.02 | ) | ||
| Pro forma net income per share |
||||||||
| Basic |
$ | 0.24 | ||||||
| Diluted |
0.22 | |||||||
| Weighted-average common shares-basic |
14,516,523 | |||||||
| Weighted-average common shares-diluted |
15,733,279 | |||||||
|
|
||||||||
The pro forma EPS calculations gives effect to: (1) the automatic conversion of the outstanding convertible preferred stock into an aggregate of 14,218,319 shares of common stock immediately prior to the completion of this offering, (2) the cash exercise of warrants to purchase an aggregate of 24,588 shares of common stock, which we expect will occur prior to closing of this offering as the warrants will otherwise expire at that time and (3) the reclassification of our preferred stock warrant liability to additional paid-in-capital upon the closing of this offering.
The computations of diluted net loss applicable to common stockholders exclude convertible preferred stock, warrants and common stock options which were anti-dilutive. Shares excluded from the computations of diluted net loss applicable to common stockholders amounted to 15,892,508 and 14,573,442 for the nine months ended September 30, 2013 and 2012, respectively.
Recently issued accounting guidance
In May 2011, the FASB issued ASU 2011-04, Amendments to Achieve Common Fair Value Measurement and Disclosure Requirements in U.S. GAAP and IFRS, which generally represents clarifications of Topic 820, Fair Value Measurements, but also includes certain instances where a particular principle or requirement for measuring fair value or disclosing information about fair value measurements has changed. This ASU results in common principles and requirements for measuring fair value and for disclosing information about fair value measurements in accordance with U.S. GAAP and International Financial Reporting Standards (IFRS). The ASU was effective prospectively for interim and annual periods beginning after December 15, 2011 with earlier application not permitted. The adoption of this guidance did not have a material effect on the results of operations, financial position or cash flow of the Company.
F-61
Table of Contents
Inogen, Inc.
Notes to financial statements
(unaudited)
(amounts in thousands, except share and per share amounts)
3. Intangible assets
Amortization expense for intangible assets for the nine months ended September 30, 2013 and 2012 was $203 and $218, respectively.
The Company’s intangible assets are summarized as follows:
| September 30, 2013 | Average estimated useful lives (in years) |
Gross carrying amount |
Accumulated amortization |
Net amount |
||||||||||||
|
|
||||||||||||||||
| Licenses |
10.0 | $ | 158 | $ | 58 | $ | 100 | |||||||||
| Patents |
5.0 | 900 | 676 | 224 | ||||||||||||
| Commercial / website |
2.0 | 70 | 32 | 38 | ||||||||||||
|
|
|
|||||||||||||||
| Total |
$ | 1,128 | $ | 766 | $ | 362 | ||||||||||
|
|
||||||||||||||||
| September 30, 2012 | Average estimated useful lives (in years) |
Gross carrying amount |
Accumulated amortization |
Net amount |
||||||||||||
|
|
||||||||||||||||
| Licenses |
10.0 | $ | 158 | $ | 43 | $ | 115 | |||||||||
| Patents |
5.0 | 900 | 453 | 447 | ||||||||||||
| Commercial |
2.0 | 158 | 82 | 76 | ||||||||||||
|
|
|
|||||||||||||||
| Total |
$ | 1,216 | $ | 578 | $ | 638 | ||||||||||
|
|
||||||||||||||||
Annual estimated amortization expense for each of the succeeding fiscal years is as follows:
| Years ending December 31, | Intangible amortization |
|||
|
|
||||
| Remainder of 2013 |
$ | 69 | ||
| 2014 |
211 | |||
| 2015 |
17 | |||
| 2016 |
16 | |||
| 2017 |
16 | |||
| Thereafter |
33 | |||
|
|
|
|||
| $ | 362 | |||
|
|
||||
4. Long-term debt
Amended and restated credit and term loan agreement
As of September 30, 2012, the Company had a credit and term loan facility that provided borrowings of up to $12,000, secured by substantially all of the Company’s assets. This is comprised of a term loan facility for rental assets amounting up to $3,000 (Term Loan), an additional term loan facility for rental assets amounting up to $8,000 (New Term Loan) and an
F-62
Table of Contents
Inogen, Inc.
Notes to financial statements
(unaudited)
(amounts in thousands, except share and per share amounts)
4. Long-term debt (continued)
Amended and restated credit and term loan agreement (continued)
accounts receivable revolving line of credit amounting up to $1,000 based on 80% of eligible accounts receivable, as defined (AR Revolver).
On October 12, 2012, the Company entered into an amended and restated credit and term loan agreement with its current lenders whereby the existing balances and the payback terms were not changed. This transaction did not result in any debt extinguishment losses or gains. The Company did not incur or defer any financing cost directly related to the credit and term loan agreement. In the event that the Company enters into an acquisition or initial public offering (IPO) during the term of this facility, lenders shall receive a fee equal to 1% of the facility amount, or approximately $120.
The amended and restated credit and term loan agreement with the Company’s current lenders provides for new borrowings of up to $12,000, secured by substantially all of the Company’s assets. The amended and restated credit and term loan agreement provides for the existing term loan facility for rental assets amounting to up to $3,000 (Term Loan A), a term loan facility for rental assets amounting to up to $8,000 (Term Loan B), a new term loan facility for rental assets amounting to up to $12,000 (Term Loan C), and an accounts receivable revolving line of credit amounting to up to $1,000 based on 80% of eligible accounts receivable, as defined (AR Revolver).
Payments of interest for all the Term Loans are generally payable monthly. Payment of principal is payable monthly. Each term loan bears interest at the Base Rate, which is a rate equal to the applicable margin plus the greater of (i) the prime rate, (ii) the federal funds effective rate, as defined in the agreement, plus 1% and (iii) the daily adjusting LIBOR rate, plus 1% . The applicable margins for Term Loans A, B, and C are 1.25%, 2.5% and 2.25%, respectively.
The Term Loan A facility of $3,000 is presented net of principal payments that began in May 2011. The net balances of this term loan facility were $667 and $1,602 as of September 30, 2013 and 2012, respectively. The Term Loan B facility for $8,000 is presented net of principal payments that began in May 2012. The net balances of this term loan facility were $4,444 and $6,889 as of September 30, 2013 and 2012, respectively.
The Term Loan C facility for $12,000 is presented net of principal payments that begin October 2013. The net balance was $6,000 as of September 30, 2013 and $0 as of September 30, 2012. Payment of principal is payable monthly over a period of 36 months starting November 2013 for Term Loan C.
There were no borrowings under the AR Revolver as of and during the nine months ended September 30, 2013. The AR Revolver expired on October 13, 2013, and was not renewed by the Company.
F-63
Table of Contents
Inogen, Inc.
Notes to financial statements
(unaudited)
(amounts in thousands, except share and per share amounts)
4. Long-term debt (continued)
Amended and restated credit and term loan agreement (continued)
The total balances owed were $11,111 and $8,491 as of September 30, 2013 and 2012, respectively. The interest rates were 4.5% for Term Loan A, 5.75% for Term Loan B, and 5.5% for Term Loan C at September 30, 2013 and 2012.
As of September 30, 2013, the Company was in compliance with all covenants of the amended and restated credit and term loan agreement.
Contractual obligation
During 2007, the Company entered into a licensing agreement to acquire a portfolio of patents relating to a continuous flow portable oxygen concentrator by issuing 3.4 million shares of Series D redeemable convertible preferred stock. Also as part of the licensing agreement the Company has accrued a one-time non-exclusive licensing fee of $850, which was originally payable January 1, 2011.
On March 22, 2011, the Company entered into an amendment of the licensing agreement whereby the Company was assigned the entire right, title and interest in the portfolio of patents in exchange for a non-interest bearing note for $650, in addition to the $850 existing obligation, for a total of $1,500, due to the original licensor in installments starting May 22, 2012, and ending October 31, 2016. As of September 30, 2013, the Company included $213 as current portion of long-term debt and $703 in long-term debt in the accompanying balance sheets. As of September 30, 2012, the Company included $212 as current portion of long-term debt and $916 in long-term debt in the accompanying balance sheets.
Long-term debt consists of the following:
| Periods ending September 30, | ||||||||
| 2013 | 2012 | |||||||
|
|
||||||||
| Term loan, bearing interest at Base Rate, monthly payments of $83 beginning May 2011 through April 2014 |
$ | 667 | $ | 1,602 | ||||
| Term loan, bearing interest at Base Rate, monthly payments of $222 beginning May 2012 through April 2015 |
4,444 | 6,889 | ||||||
| Term loan, bearing interest at Base Rate, monthly payments of $167 beginning November 2013 through June 2015 |
6,000 | — | ||||||
| Contractual obligation, non-interest, quarterly payments of $53 beginning May 2011 through October 2014 and quarterly payments of $81 beginning January 2015 through October 2016 |
916 | 1,128 | ||||||
|
|
|
|||||||
| Subtotal |
12,027 | 9,619 | ||||||
| Less: current maturities |
(5,379 | ) | (3,561 | ) | ||||
|
|
|
|||||||
| Long-term debt, net of current portion |
$ | 6,648 | $ | 6,058 | ||||
|
|
||||||||
F-64
Table of Contents
Inogen, Inc.
Notes to financial statements
(unaudited)
(amounts in thousands, except share and per share amounts)
4. Long-term debt (continued)
Contractual obligation (continued)
As of September 30, 2013, the minimum aggregate payments due under non-cancelable debt are summarized as follows:
| Years ending September 30, |
||||
|
|
||||
| 2013 (Remainder) |
$ | 1,303 | ||
| 2014 |
5,296 | |||
| 2015 |
3,436 | |||
| 2016 |
1,992 | |||
|
|
|
|||
| Total |
$ | 12,027 | ||
|
|
||||
5. Commitments and contingencies
Leases
The Company leases its offices and certain equipment under operating leases that expire through December 2019. At September 30, 2013, the minimum aggregate payments due under non-cancelable leases are summarized as follows:
| Years ending December 31, | ||||
|
|
||||
| Remainder of 2013 |
$ | 200 | ||
| 2014 |
816 | |||
| 2015 |
718 | |||
| 2016 |
331 | |||
| 2017 |
329 | |||
| Thereafter |
624 | |||
|
|
|
|||
| Total |
$ | 3,018 | ||
|
|
||||
Rent expense of $690 and $579 was included in the accompanying statements of operations for the nine months ended September 30, 2013 and 2012, respectively.
F-65
Table of Contents
Inogen, Inc.
Notes to financial statements
(unaudited)
(amounts in thousands, except share and per share amounts)
5. Commitments and contingencies (continued)
Warranty obligation
The following table identifies the changes in the Company’s aggregate product warranty liabilities for the nine months ended September 30, 2013 and 2012 (in thousands):
| Nine months
ended September 30 |
||||||||
| 2013 | 2012 | |||||||
|
|
||||||||
| Product warranty liability at beginning of year |
$ | 447 | $ | 250 | ||||
| Accruals for warranties issued |
415 | 283 | ||||||
| Adjustments related to pre-existing warranties (including changes in estimates) |
268 | 96 | ||||||
| Settlements made (in cash or in kind) |
(287 | ) | (234 | ) | ||||
|
|
|
|||||||
| Product warranty liability at end of period |
$ | 843 | $ | 395 | ||||
|
|
||||||||
Legislation and HIPAA
The healthcare industry is subject to numerous laws and regulations of federal, state and local governments. These laws and regulations include, but are not necessarily limited to, matters such as licensure, accreditation, government healthcare program participation requirements, reimbursement for patient services, and Medicare and Medicaid fraud and abuse. Government activity has continued with respect to investigations and allegations concerning possible violations of fraud and abuse statutes and regulations by healthcare providers. Violations of these laws and regulations could result in expulsion from government healthcare programs together with the imposition of significant fines and penalties, as well as significant repayments for patient services previously billed.
The Company believes that it is in compliance with fraud and abuse regulations as well as other applicable government laws and regulations. Compliance with such laws and regulations can be subject to future government review and interpretation as well as regulatory actions unknown or unasserted at this time.
The Health Insurance Portability and Accountability Act (“HIPAA”) assures health insurance portability, reduces healthcare fraud and abuse, guarantees security and privacy of health information, and enforces standards for health information. The Health Information Technology for Economic and Clinical Health Act (“HITECH Act”) imposes notification requirements of certain security breaches relating to protected health information. The Company may be subject to significant fines and penalties if found not to be compliant with the provisions outlined in the regulations.
Employment agreements
On January 2, 2008, the Company entered into an Employment Agreement with the Chief Executive Officer (CEO) including considerations for salary, bonus awards, stock options, and
F-66
Table of Contents
Inogen, Inc.
Notes to financial statements
(unaudited)
(amounts in thousands, except share and per share amounts)
5. Commitments and contingencies (continued)
Employment agreements (continued)
severance. The CEO is also entitled to a Liquidation Fee, as defined in the agreement, upon the occurrence of a deemed liquidation event, also as defined in the agreement.
The Company has entered into employment agreements with certain key employees providing for the payment of cash compensation and/or continuation of salary for a range of three to six months upon termination without cause. There are no guaranteed amounts due under those agreements as of September 30, 2013 and 2012, respectively.
The Company also has a bonus plan for all employees based on the Company’s overall performance, the employees’ performance, and level of responsibility. In addition, the Company has a management carve-out plan for a potential liquidation event based on the sales price per share.
Legal proceedings
On November 4, 2011, we filed a lawsuit in the United States District Court for the Central District of California against Inova Labs Inc., or Defendant, for infringement of two of our patents. The case, Inogen Inc. v. Inova Labs Inc., Case No. 8:11-cv-01692-JST-AN, or the Lawsuit, involves U.S. Patent Nos. 7,841,343, entitled “Systems and Methods For Delivering Therapeutic Gas to Patients”, or the ’343 patent, and 6,605,136 entitled “Pressure Swing Adsorption Process Operation And Optimization”, or the ’136 patent. We alleged in the Lawsuit that certain of Defendant’s oxygen concentrators infringe various claims of the ’343 and ’136 patents. The Lawsuit seeks damages, injunctive relief, costs and attorney fees.
The Defendant has answered the complaint, denying infringement and asserting various sets of defenses including non-infringement, invalidity and unenforceability, patent misuse, unclean hands, laches and estoppel. The Defendant also filed counterclaims against us alleging patent invalidity, non-infringement and inequitable conduct. We denied the allegations in the Defendant’s counterclaims. We have filed a motion to dismiss Defendant’s inequitable conduct counterclaim.
The Defendant filed a request with the U.S. Patent and Trademark Office seeking an inter partes reexamination of the ’343 and ’136 patents. The Defendant also filed a motion to stay the Lawsuit pending outcome of the reexamination. On March 20, 2012, the Court granted the Defendant’s motion to stay the Lawsuit pending outcome of the reexamination and also granted our motion to dismiss the Defendant’s inequitable conduct counterclaim.
The Company is party to various other legal proceedings arising in the normal course of business. The Company carries insurance, subject to deductibles under the specified policies, to protect against losses from certain types of legal claims. The Company does not anticipate that any of these proceedings will have a material impact on the Company.
F-67
Table of Contents
Inogen, Inc.
Notes to financial statements
(unaudited)
(amounts in thousands, except share and per share amounts)
6. Convertible preferred stock
A summary of the terms of the various types of redeemable convertible preferred stock at September 30, 2013 is as follows:
| Series | B | C | D | E | F | G | Total | |||||||||||||||||||||
|
|
||||||||||||||||||||||||||||
| Shares authorized |
425,527 | 380,142 | 1,619,441 | 1,639,117 | 2,701,959 | 2,840,264 | 9,606,450 | |||||||||||||||||||||
| Shares issued |
425,511 | 365,903 | 1,572,754 | 1,634,874 | 2,701,957 | 2,840,260 | 9,541,259 | |||||||||||||||||||||
| Par value |
$0.001 | $0.001 | $0.001 | $0.001 | $0.001 | $0.001 | ||||||||||||||||||||||
| Conversion rate |
1.45108 | 1.73014 | 1.87951 | 2.69244 | 1.0000 | 1.0000 | ||||||||||||||||||||||
| Liquidation preference per share |
11.880 | 17.580 | 21.900 | 19.224 | 7.140 | 14.083 | ||||||||||||||||||||||
| Dividend rate |
5% | 8% | 8% | 8% | 8% | 8% | ||||||||||||||||||||||
| Redemption date |
|
January 1, 2016 |
|
|
January 1, 2016 |
|
|
January 1, 2016 |
|
|
January 1, 2016 |
|
|
January 1, 2016 |
|
|
January 1, 2016 |
|
||||||||||
| Issue date |
July 2003 | June 2004 |
|
July 2005 to July 2007 |
|
|
October 2007 to February 2009 |
|
|
February 2010 to June 2010 |
|
March 2012 | ||||||||||||||||
|
|
||||||||||||||||||||||||||||
A summary of the terms of the non-redeemable convertible preferred stock at September 30, 2013 is as follows:
| Series | A | |||
|
|
||||
| Shares authorized |
66,666 | |||
| Shares issued |
66,666 | |||
| Par value |
$0.001 | |||
| Conversion rate |
1.01709 | |||
| Liquidation preference per share |
3.750 | |||
| Dividend rate |
5% | |||
| Issue date |
May 2002 | |||
|
|
||||
7. Stock incentive plan
The Company has a 2012 Stock Incentive Plan (the 2012 Plan) under which the Company has reserved 1,219,027 shares of common stock, as amended, to be issued in connection with stock options and other equity awards issued under the 2012 Plan. The 2012 Plan provides for option grants at exercise prices not less than 100% of the fair value of common stock on the date of grant.
Previously, the Company had a 2002 Stock Incentive Plan (the 2002 Plan), as amended. As of March 12, 2012, the 2002 Plan was terminated and a new 2012 Plan was created in its place. On termination, the 2002 Plan had 1,424,540 shares of common stock outstanding. Any shares returned to the 2002 Plan as a result of expiration or termination of equity awards (up to 1,424,646 shares) are added to the 2012 Plan share reserve.
F-68
Table of Contents
Inogen, Inc.
Notes to financial statements
(unaudited)
(amounts in thousands, except share and per share amounts)
7. Stock incentive plan (continued)
Options typically expire ten years from the date of grant and vest over one to four year terms. Options have been granted to employees and consultants of the Company at the deemed fair market value, as determined by the Board of Directors, of the shares underlying the options at the date of grant.
The activity for stock options under the Plan is as follows:
| Options | Weighted average exercise price |
Weighted average remaining contractual term (in years) |
||||||||||
|
|
||||||||||||
| Outstanding at December 31, 2012 |
1,646,120 | $ | 1.0647 | |||||||||
| Granted |
439,993 | $ | 1.1700 | |||||||||
| Exercised |
(4,522 | ) | $ | 0.5705 | ||||||||
| Forfeited |
(786 | ) | $ | 0.6595 | ||||||||
| Expired |
(1,467 | ) | $ | 1.7867 | ||||||||
|
|
|
|||||||||||
| Outstanding at September 30, 2013 |
2,079,338 | $ | 1.0876 | 6.968 | ||||||||
|
|
|
|||||||||||
| Exercisable at September 30, 2013 |
1,466,789 | $ | 1.1140 | 6.113 | ||||||||
|
|
||||||||||||
The number of equity awards available for grant under the Plan as of September 30, 2013 and 2012 was 530,427 and 981,411, respectively. As of March 12, 2012, the 2002 Stock Plan was terminated and the 2012 Stock Plan was created reserving 1,194,078 shares for issuance.
Employee stock-based compensation expense recognized in 2013 and 2012 was calculated based on awards ultimately expected to vest and has been reduced for estimated forfeitures at a rate of 5.7%, based on the Company’s historical option cancellations. ASC 718 requires forfeitures to be estimated at the time of grant and revised, if necessary, in subsequent periods if actual forfeitures differ from those estimates.
For the nine months ended September 30, 2013 and 2012, stock-based compensation expense recognized under ASC 718, included in cost of sales, sales and marketing expense, general and administrative expense, and research and development expense, totaled $116 and $48, respectively.
Valuation assumptions
The employee stock-based compensation expense recognized under ASC 718 was determined using the Black-Scholes method for the year ended September 30, 2013.
Option valuation models require the input of subjective assumptions and these assumptions can vary over time. The risk-free interest rate is the implied yield currently available on U.S. Treasury zero-coupon issues with a remaining term equal to the expected term. The expected term of the
F-69
Table of Contents
Inogen, Inc.
Notes to financial statements
(unaudited)
(amounts in thousands, except share and per share amounts)
7. Stock incentive plan (continued)
Valuation assumptions (continued)
options was based on the simplified method outlined in ASC 718. The volatility factors were based on five peer companies selected from Dow Jones Industry Classification Benchmark (ICB) codes 4535 and 4537. These codes include companies which are the same market categories as the Company, which is the Medical Equipment and Supplies line of business. The peer companies were selected based on similarity of market capitalization, size and certain operating characteristics. The calculated volatility value was established by taking the historical daily closing values prior to grant date, over a period equal to the expected term, for each of the peer companies.
When the period of data available was less than the expected term, closing values for the longest period of time available were used. The calculated historical volatility of each of these companies was then averaged to determine the calculated value used by the Company.
The value of employee options was estimated on the date of grant using the Black-Scholes option pricing model with the following assumptions used:
|
|
||||
| Expected term (years) |
5.5071 - 6.0823 | |||
| Risk free interest rate |
0.7325 - 2.8876% | |||
| Expected dividend yield |
None | |||
| Volatility |
46.5786 - 50.5238% | |||
|
|
||||
Under these assumptions, the total fair value of the stock option grants during the nine months ended September 30, 2013 and 2012 was $481 and $78, respectively.
As of September 30, 2013 and 2012, there was $468 and $105, respectively, of total unrecognized compensation expense related to non-vested share-based compensation granted under the Plan.
Non-employee option grants
In accordance with ASC 505 and ASC 718, compensation expense related to non-employee option grants is recognized over the related vesting period as this method approximates the recognition of compensation expense over the service period. The Company had no compensation expense related to non-employee option grants for the nine months ended September 30, 2013 and 2012, as no non-employee options were granted and all previous grants were fully vested prior to 2012.
8. Warrants
From time to time, the Company issues warrants to purchase its common and preferred stock. These warrants have been issued in connection with the issuance of the Company’s convertible debt financing as well as the expansion of its credit agreement.
The warrants issued by the Company are subject to the same anti-dilution rights as the underlying preferred stock.
F-70
Table of Contents
Inogen, Inc.
Notes to financial statements
(unaudited)
(amounts in thousands, except share and per share amounts)
8. Warrants (continued)
Warrant activity is summarized as follows:
A summary of outstanding warrants at September 30, 2013 is as follows:
| Security | Number of warrants |
Exercise price/share |
Expiration date |
|||||||||
|
|
||||||||||||
| Series C preferred |
14,215 | $ | 17.580 | 2015 | ||||||||
| Series D preferred |
942 | 21.900 | 2013 | |||||||||
| Series D preferred |
11,415 | 21.900 | 2014 | |||||||||
| Series E preferred |
3,120 | 9.612 | 2015 | |||||||||
| Series E preferred |
1,102 | 9.612 | 2016 | |||||||||
| Common stock |
233,611 | 0.300 | 2017 - 2019 | |||||||||
|
|
|
|||||||||||
| 264,405 | ||||||||||||
|
|
||||||||||||
| Shares | Weighted average exercise price |
Range of prices |
||||||||||
|
|
||||||||||||
| Outstanding at December 31, 2012 |
384,217 | $ | 8.46 | $0.30 - $21.90 | ||||||||
| Warrants issued |
— | — | — | |||||||||
| Warrants exercised |
(85,529 | ) | $ | 21.90 | $21.90 | |||||||
| Warrants expired/forfeited |
(34,283 | ) | $ | 21.90 | $21.90 | |||||||
|
|
|
|||||||||||
| Outstanding at September 30, 2013 |
264,405 | $ | 7.17 | $ | 0.30 - $21.90 | |||||||
|
|
|
|||||||||||
| Exercisable at September 30, 2013 |
264,405 | $ | 7.17 | $ | 0.30 - $21.90 | |||||||
|
|
||||||||||||
A rollforward of warrant activity from January 1, 2013 to September 30, 2013 is as follows:
| Issued and outstanding warrants as of January 1, 2013 |
Warrants exercised |
Warrants expired |
Issued and outstanding warrants as of September 30, 2013 |
|||||||||||||
|
|
||||||||||||||||
| Series C preferred |
14,215 | — | — | 14,215 | ||||||||||||
| Series D preferred |
132,169 | 85,529 | 34,283 | 12,357 | ||||||||||||
| Series E preferred |
4,222 | — | — | 4,222 | ||||||||||||
| Common stock |
233,611 | — | — | 233,611 | ||||||||||||
|
|
|
|||||||||||||||
| 384,217 | 85,529 | 34,283 | 264,405 | |||||||||||||
|
|
||||||||||||||||
As of September 30, 2013, we had the following warrants outstanding:
| • | warrants exercisable for an aggregate of 233,611 shares of our common stock at an exercise price of $0.30 per share issued in connection with our 2007 convertible note financing and 2009 series E convertible preferred stock financing. These warrants have various expiration dates through February 26, 2019, but expire earlier upon a change in control of our company; |
F-71
Table of Contents
Inogen, Inc.
Notes to financial statements
(unaudited)
(amounts in thousands, except share and per share amounts)
8. Warrants (continued)
| • | warrants exercisable for an aggregate of 14,215 shares of our series C convertible preferred stock at an exercise price of $17.58 per share issued in connection with a 2005 financing. These warrants will expire upon the earliest of (1) May 31, 2015, (2) a change in control of our company, and (3) the offering contemplated by this prospectus. Upon completion of the offering contemplated by this prospectus, and assuming the exercise of these warrants, these warrants will convert into an aggregate of 24,588 shares of common stock; |
| • | warrants exercisable for an aggregate of 942 shares of our series D convertible preferred stock at an exercise price of $21.90 per share issued to various purchasers in connection with our 2006 note and warrant financings. These warrants expire on various dates through November 8, 2013 unless a change in control of our company occurs prior to such expiration dates. To the extent that these warrants are not exercised prior to the offering contemplated by this prospectus, they will be exercisable for a maximum of 1,770 shares of common stock at the series D conversion rate of 1.8795056643:1; |
| • | a warrant exercisable for 11,415 shares of our series D convertible preferred stock at an exercise price of $21.90 per share issued to Venture Lending and Leasing IV, LLC in 2006. This warrant will expire in February, 2014. To the extent that these warrants are not exercised prior to the offering contemplated by this prospectus, they will be exercisable for a maximum of 21,454 shares of common stock at the series D conversion rate of 1.8795056643:1; |
| • | warrants exercisable for an aggregate of 4,222 shares of our series E convertible preferred stock at an exercise price of $9.6120 per share issued to Square One Bank. These warrants will expire on various dates between July 10, 2015 and July 23, 2016; provided, however, that if the offering contemplated by this prospectus occurs within the three-year period immediately prior to the expiration date of any one of these warrants, the expiration date shall automatically be extended to third anniversary of our initial public offering. To the extent that these warrants are not exercised prior to the offering contemplated by this prospectus, they will be exercisable for a maximum of 11,365 shares of common stock at the series E conversion rate of 2.6924369748:1. |
These warrants have a net exercise provision under which their holders may, in lieu of payment of the exercise price in cash, surrender the warrant and receive a net amount of shares based on the fair market value of our stock at the time of exercise of the warrants after deduction of the aggregate exercise price. These warrants contain provisions for adjustment of the exercise price and number of shares issuable upon the exercise of warrants in the event of certain stock dividends, stock splits, reorganizations, reclassifications and consolidations.
F-72
Table of Contents
Inogen, Inc.
Notes to financial statements
(unaudited)
(amounts in thousands, except share and per share amounts)
8. Warrants (continued)
A rollforward of warrant activity from January 1, 2012 to September 30, 2012 is as follows:
| Issued and outstanding warrants as of January 1, 2012 |
Warrants exercised |
Warrants expired |
Issued and outstanding warrants as of September 30, 2012 |
|||||||||||||
|
|
||||||||||||||||
| Series B preferred |
2,429 | 2,429 | — | — | ||||||||||||
| Series C preferred |
36,270 | 8,408 | — | 27,862 | ||||||||||||
| Series D preferred |
132,169 | — | — | 132,169 | ||||||||||||
| Series E preferred |
4,222 | — | — | 4,222 | ||||||||||||
| Common stock |
250,997 | 17,386 | — | 233,611 | ||||||||||||
|
|
|
|||||||||||||||
| 426,087 | 28,223 | — | 397,864 | |||||||||||||
|
|
||||||||||||||||
9. Subsequent events (after September 30, 2013)
In January 2013, the Company received notification from the Center for Medicare & Medicaid Services about pricing for the Competitive Bidding program that was expanded to 100 additional Metropolitan Statistical Areas. Pricing decreased on average approximately 45% from current Medicare allowable rates for oxygen products. The new payment rates went into effect July 1, 2013. The Company received notification that the Centers for Medicare & Medicaid Services was offering Inogen 89 non-exclusive contracts to continue to operate in these markets.
In October 2013, the Company granted a total of 276,333 common stock options at an exercise price of $8.37 per share, of which 3,749 vest over twelve months and the remainder vest over four years.
In October 2013, the Board approved revised employment agreements for the executive team including the CEO, CFO, EVP, Sales & Marketing, VP, Engineering, and the VP, Operations which included revised compensation arrangements including severance.
In October 2013, the Company received notification from the Centers for Medicare and Medicaid Services about pricing for the Competitive Bidding program that was re-bid in 9 Metropolitan Statistical Areas as contracts would expire December 31, 2013. The Centers for Medicare & Medicaid Services announced average savings of approximately 37% off the current payments rates in effect from the product categories included in competitive bidding. Inogen currently has contracts in 6 of these Metropolitan Statistical Areas. The new contracts and payment rates would go into effect January 1, 2014. The Company was offered 3 contracts to provide respiratory equipment in 3 of the 9 competitive bidding areas, and we accepted and signed those contracts. We are required to be able to supply additional respiratory products such as sleep and aerosol therapy, which have lower margins than our existing products.
On November 11, 2013, the Company’s Board of Directors and stockholder approved a 3:1 reverse stock split. This became effective as of November 12, 2013 and, the effect of this event has been
F-73
Table of Contents
Inogen, Inc.
Notes to financial statements
(unaudited)
(amounts in thousands, except share and per share amounts)
9. Subsequent events (after September 30, 2013) (continued)
reflected in all of the share quantities and per share amounts throughout the financials. The shares of Common Stock retained a par value of $0.001.
On November 25, 2013, the Company entered into an amendment to its Amended and Restated Revolving Credit and Term Loan Agreement dated as of October 12, 2012 which will now permit the Company to engage in an Initial Public Offering without triggering an event of default.
F-74
Table of Contents
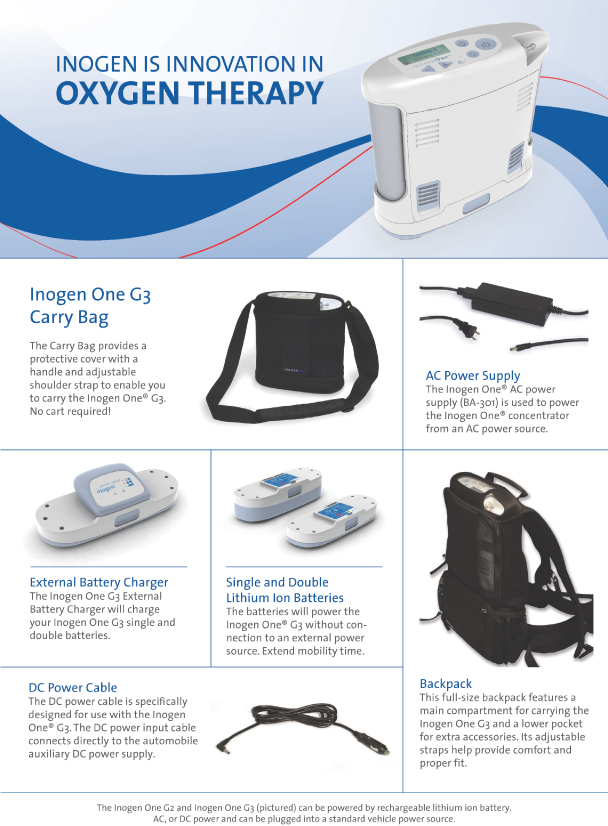
Table of Contents

Table of Contents
Part II
Information not required in the prospectus
Item 13. Other expenses of issuance and distribution.
Estimated expenses, other than underwriting discounts and commissions, payable by the registrant in connection with the sale of the common stock being registered under this registration statement are as follows:
| Amount to be paid | ||||
|
|
||||
| SEC registration fee |
$ | * | ||
| FINRA filing fee |
* | |||
| Exchange listing fee |
* | |||
| Printing and engraving expenses |
* | |||
| Legal fees and expenses |
* | |||
| Accounting fees and expenses |
* | |||
| Transfer agent and registrar fees and expenses |
* | |||
| Miscellaneous |
* | |||
|
|
|
|||
| Total |
$ | * | ||
|
|
||||
* To be filed by amendment.
Item 14. Indemnification of directors and officers.
Section 145 of the Delaware General Corporation Law, or DGCL, empowers a corporation to indemnify its directors and officers and to purchase insurance with respect to liability arising out of their capacity or status as directors and officers, provided that the person acted in good faith and in a manner the person reasonably believed to be in its best interests, and, with respect to any criminal action, had no reasonable cause to believe the person’s actions were unlawful. The DGCL further provides that the indemnification permitted thereunder shall not be deemed exclusive of any other rights to which the directors and officers may be entitled under the corporation’s bylaws, any agreement, a vote of stockholders or otherwise. The certificate of incorporation of the registrant to be in effect upon the completion of this offering provides for the indemnification of the registrant’s directors and officers to the fullest extent permitted under the DGCL. In addition, the bylaws of the registrant to be in effect upon the completion of this offering require the registrant to fully indemnify any person who was or is a party or is threatened to be made a party to any threatened, pending or completed action, suit or proceeding (whether civil, criminal, administrative or investigative) by reason of the fact that such person is or was a director, or officer of the registrant, or is or was a director or officer of the registrant serving at the registrant’s request as a director, officer, employee or agent of another corporation, partnership, joint venture, trust or other enterprise, against expenses (including attorney’s fees), judgments, fines and amounts paid in settlement actually and reasonably incurred by such person in connection with such action, suit or proceeding, to the fullest extent permitted by applicable law.
Section 102(b)(7) of the DGCL permits a corporation to provide in its certificate of incorporation that a director of the corporation shall not be personally liable to the corporation or its stockholders for monetary damages for breach of fiduciary duty as a director, except (1) for any breach of the director’s duty of loyalty to the corporation or its stockholders, (2) for acts or
II-1
Table of Contents
omissions not in good faith or which involve intentional misconduct or a knowing violation of law, (3) for payments of unlawful dividends or unlawful stock repurchases or redemptions or (4) for any transaction from which the director derived an improper personal benefit. The registrant’s certificate of incorporation to be in effect upon the completion of this offering provides that the registrant’s directors shall not be personally liable to it or its stockholders for monetary damages for breach of fiduciary duty as a director and that if the DGCL is amended to authorize corporate action further eliminating or limiting the personal liability of directors, then the liability of the registrant’s directors shall be eliminated or limited to the fullest extent permitted by the Delaware General Corporation Law, as so amended.
Section 174 of the DGCL provides, among other things, that a director who willfully or negligently approves of an unlawful payment of dividends or an unlawful stock purchase or redemption may be held liable for such actions. A director who was either absent when the unlawful actions were approved, or dissented at the time, may avoid liability by causing his or her dissent to such actions to be entered in the books containing minutes of the meetings of our board of directors at the time such action occurred or immediately after such absent director receives notice of the unlawful acts
As permitted by the DGCL, the registrant has entered into separate indemnification agreements with each of the registrant’s directors and certain of the registrant’s officers which require the registrant, among other things, to indemnify them against certain liabilities which may arise by reason of their status as directors, officers or certain other employees.
The registrant expects to obtain and maintain insurance policies under which its directors and officers are insured, within the limits and subject to the limitations of those policies, against certain expenses in connection with the defense of, and certain liabilities which might be imposed as a result of, actions, suits or proceedings to which they are parties by reason of being or having been directors or officers. The coverage provided by these policies may apply whether or not the registrant would have the power to indemnify such person against such liability under the provisions of the DGCL.
These indemnification provisions and the indemnification agreements entered into between the registrant and the registrant’s officers and directors may be sufficiently broad to permit indemnification of the registrant’s officers and directors for liabilities (including reimbursement of expenses incurred) arising under the Securities Act of 1933, as amended, or Securities Act.
The underwriting agreement between the registrant and the underwriters filed as Exhibit 1.1 to this registration statement provides for the indemnification by the underwriters of the registrant’s directors and officers and certain controlling persons against specified liabilities, including liabilities under the Securities Act with respect to information provided by the underwriters specifically for inclusion in the registration statement.
Item 15. Recent sales of unregistered securities.
The following list sets forth information regarding all unregistered securities sold by us since January 1, 2010. No underwriters were involved in the sales and the certificates representing the securities sold and issued contain legends restricting transfer of the securities without registration under the Securities Act or an applicable exemption from registration.
(a) In February and June of 2010, the registrant issued and sold an aggregate of 2,701,957 shares of its series F convertible preferred stock at $3.57 per share, for aggregate proceeds of approximately $9,646,000, to a total of eight accredited investors. With respect to the February
II-2
Table of Contents
2010 sale of series F convertible preferred stock, the registrant filed a Form D on March 2, 2010. With respect to the June 2010 sale of series F convertible preferred stock, the registrant filed a Form D/A on July 13, 2010.
(b) In March 2012, the registrant sold an aggregate of 2,840,260 shares of its series G convertible preferred stock at $7.0416 per share for aggregate proceeds of approximately $20,000,000 to a total of eight accredited investors.
(c) From February 24, 2010 through December 7, 2011, the registrant granted to certain of its employees, consultants, directors and other service providers under the registrant’s 2002 Stock Incentive Plan options to purchase an aggregate of 923,609 shares of its common stock at exercise prices ranging from $0.60 to $0.75 per share.
(d) From March 28, 2012 through October 10, 2013, the registrant granted to certain of its employees, consultants, directors and other service providers under the registrant’s 2012 Equity Incentive Plan options to purchase an aggregate of 964,922 shares of its common stock at exercise prices ranging from $0.81 to $8.37 per share.
(e) From May 10, 2010 through January 8, 2014, the registrant issued and sold an aggregate of 15,502 shares of its common stock upon the exercise of options issued to certain employees, directors and consultants under the registrant’s 2002 Stock Incentive Plan at exercise prices ranging from $0.60 to $8.70, for aggregate consideration of approximately $18,000.
(f) On March 4, 2011, the registrant issued 2,554 shares of its series C convertible preferred stock upon exercise of warrants at an exercise price of $17.58 per share for aggregate proceeds of approximately $45,000.
(g) On February 28, 2012, the registrant issued 17,386 shares of its common stock upon exercise of warrants at an exercise price of $0.30 per share for aggregate proceeds of approximately $5,000.
(h) On April 18, 2012, the registrant issued 8,408 shares of its series C convertible preferred stock upon exercise of warrants at an exercise price of $17.58 per share for aggregate proceeds of approximately $148,000.
(i) On April 18, 2012, the registrant issued 2,429 shares of its series B convertible preferred stock upon exercise of a warrant at an exercise price of $11.88 per share for aggregate proceeds of approximately $29,000.
(j) On December 27, 2012, the registrant issued 13,647 shares of its series C convertible preferred stock upon exercise of warrants at an exercise price of $17.58 per share for aggregate proceeds of approximately $240,000.
(k) On February 14, 2013, the registrant issued 19,976 shares of its series D convertible preferred stock upon exercise of warrants at an exercise price of $21.90 per share for aggregate proceeds of approximately $437,000.
(l) On February 28, 2013, the registrant issued 19,539 shares of its series D convertible preferred upon exercise of warrants at an exercise price of $21.90 per share for aggregate proceeds of approximately $428,000.
(m) On May 20, 2013, the registrant issued 7,989 shares of its series D convertible preferred stock upon exercise of warrants at an exercise price of $21.90 per share for aggregate proceeds of approximately $175,000.
II-3
Table of Contents
(n) On May 23, 2013, the registrant issued 2,951 shares of its series D convertible preferred stock upon exercise of a warrant at an exercise price of $21.90 per share for aggregate proceeds of approximately $65,000.
(o) On June 21, 2013, the registrant issued 5,706 shares of its series D convertible preferred stock upon exercise of warrants at an exercise price of $21.90 per share for aggregate proceeds of approximately $125,000.
(p) On July 3, 2013, the registrant issued 3,685 shares of its series D convertible preferred stock upon exercise of a warrant at an exercise price of $21.90 per share for aggregate proceeds of approximately $81,000.
(q) On August 28, 2013, the registrant issued 22,830 shares of its series D convertible preferred stock upon exercise of warrants at an exercise price of $21.90 per share for aggregate proceeds of approximately $500,000.
(r) On September 5, 2013, the registrant issued 2,853 shares of its series D convertible preferred stock upon exercise of a warrant at an exercise price of $21.90 per share for aggregate proceeds of approximately $62,000.
(s) On October 28, 2013, the registrant issued 372 shares of its series D convertible preferred stock upon exercise of a warrant at an exercise price of $21.90 per share for aggregate proceeds of approximately $8,000.
(t) On January 6, 2014, the registrant issued 2,045 shares of its series C convertible preferred stock upon exercise of warrants at an exercise price of $17.58 per share for aggregate proceeds of approximately $36,000.
(u) On January 6, 2014, the registrant issued 7,649 shares of its common stock upon exercise of warrants at an exercise price of $0.30 per share for aggregate proceeds of approximately $2,000.
(v) On January 15, 2014, the registrant issued 8,951 shares of its series C convertible preferred stock upon exercise of warrants at an exercise price of $17.58 per share for aggregate proceeds of approximately $157,000.
(w) On January 15, 2014, the registrant issued 49,436 shares of its common stock upon exercise of warrants at an exercise price of $0.30 per share for aggregate proceeds of approximately $15,000.
(x) On January 17, 2014, the registrant issued 11,415 shares of its series D convertible preferred stock upon exercise of warrants at an exercise price of $21.90 per share for aggregate proceeds of approximately $250,000.
(y) On January 21, 2014, the registrant issued 98 shares of its series C convertible preferred stock upon exercise of warrants at an exercise price of $17.58 per share for aggregate proceeds of approximately $2,000.
Unless otherwise indicated, the offers, sales and issuances of the securities described in Items 15(a) and (b) and 15(f) through (y) were exempt from registration under the Securities Act under Section 4(2) of the Securities Act as transactions by an issuer not involving a public offering. The recipients of securities in each of these transactions acquired the securities for investment only and not with a view to or for sale in connection with any distribution thereof and appropriate legends were affixed to the securities issued in these transactions. Each of the recipients of
II-4
Table of Contents
securities in these transactions was an accredited person and had adequate access, through employment, business or other relationships, to information about the registrant. No underwriters were involved in the offers, sales and issuances of the securities described in items 15(a) and (b) and 15(f) through (y).
The offers, sales and issuances of the securities described in Items 15(c), 15(d) and 15(e) were exempt from registration under the Section 4(2) of the Securities Act and/or Rule 701 of the Securities Act.
II-5
Table of Contents
Item 16. Exhibits and financial statement schedules.
(a) Exhibits.
| Exhibit number |
Description | |
| 1.1* | Form of Underwriting Agreement. | |
| 3.1^ | Twelfth Amended and Restated Certificate of Incorporation of the Registrant, as amended. | |
| 3.2^ | Form of Thirteenth Amended and Restated Certificate of Incorporation, to be effective upon completion of the offering. | |
| 3.3^ | Form of Amended and Restated Bylaws, to be effective immediately prior to the completion of the offering. | |
| 4.1^ | Specimen Common Stock Certificate of the Registrant. | |
| 4.2^ | Ninth Amended and Restated Investors’ Rights Agreement, dated March 12, 2012, by and among the Registrant and the investors named therein, as amended. | |
| 4.3^ | Form of Warrant to Purchase Common Stock issued in connection with the Registrant’s 2007 convertible note financing. | |
| 4.4^ | Form of Warrant to Purchase Common Stock issued in connection with the Registrant’s Series E Preferred Stock Financing. | |
| 4.5^ | Form of Warrant to Purchase Series C Convertible Preferred Stock. | |
| 4.6^ | Form of Warrant to Purchase Series D Convertible Preferred Stock issued pursuant to the Registrant’s Note and Warrant Purchase Agreement dated July 7, 2006. | |
| 4.7^ | Form of Warrant to Purchase Series D Convertible Preferred Stock issued in connection with the Registrant’s Note and Warrant Purchase Agreement dated September 1, 2006. | |
| 4.8^ | Warrant to purchase Series D Convertible Preferred Stock, dated September 18, 2006, issued to Venture Lending and Leasing IV, LLC. | |
| 4.9^ | Form of Warrant to Purchase Series E Convertible Preferred Stock. | |
| 4.10^ | Form of Second Warrant to Purchase Series E Convertible Preferred Stock. | |
| 5.1* | Opinion of Wilson Sonsini Goodrich & Rosati, Professional Corporation. | |
| 10.1+^ | Form of Director and Executive Officer Indemnification Agreement. | |
| 10.2+^ | 2002 Stock Plan, as amended. | |
| 10.3+^ | Form of Notice of Stock Option Grant and Stock Option Agreement under the 2002 Stock Plan, as amended. | |
| 10.4+^ | 2012 Equity Incentive Plan, as amended. | |
| 10.5+^ | Form of Stock Option Agreement under the 2012 Equity Incentive Plan. | |
| 10.6+ | 2014 Equity Incentive Plan, to be in effect upon completion of this offering. | |
| 10.7+ | Form Agreements under the 2014 Equity Incentive Plan. | |
| 10.8+ | 2014 Employee Stock Purchase Plan. | |
| 10.9+^ | Executive Incentive Compensation Plan. | |
|
| ||
II-6
Table of Contents
| Exhibit number |
Description | |
| 10.10+^ | Employment Agreement, dated October 1, 2013, between the Registrant and Raymond Huggenberger. | |
| 10.11+^ | Employment Agreement, dated October 1, 2013, between the Registrant and Scott Wilkinson. | |
| 10.12+^ | Employment Agreement, dated October 1, 2013, between the Registrant and Alison Bauerlein. | |
| 10.13+^ | Employment Agreement, dated October 1, 2013, between the Registrant and Matt Scribner. | |
| 10.14+^ | Employment Agreement, dated October 1, 2013, between the Registrant and Brenton Taylor. | |
| 10.15^ | Amended and Restated Revolving Credit and Term Loan Agreement, dated October 12, 2012, between the Registrant and Comerica Bank, as amended. | |
| 10.16^ | Security Agreement, dated October 12, 2012, between the Registrant and Comerica Bank. | |
| 10.17^ | Multi-Purpose Commercial Building Lease, dated February 1, 2010, between the Registrant and Rockbridge Investments, L.P., as amended. | |
| 10.18^ | Lease Agreement, dated May 3, 2012, between the Registrant and Bayview (TX) Holding LLC. | |
| 10.19^ | License Agreement, dated July 23, 2007, between the Registrant and Air Products and Chemicals, Inc. | |
| 10.20^ | Amendment to License Agreement, dated October 23, 2009, between the Registrant and Air Products and Chemicals, Inc. | |
| 10.21^ | Amendment No. 2 to License Agreement, dated October 4, 2010, between the Registrant and Air Products and Chemicals, Inc. | |
| 10.22^ | Amendment No. 3 to License Agreement, dated March 22, 2011, between the Registrant and Air Products and Chemicals, Inc. | |
| 10.23+ | Management Carve-Out Bonus Award, dated July 1, 2012, between the Registrant and Alison Bauerlein. | |
| 10.24+ | Management Carve-Out Bonus Award, dated July 1, 2012, between the Registrant and Brenton Taylor. | |
| 10.25+ | Management Carve-Out Bonus Award, dated July 1, 2012, between the Registrant and Scott Wilkinson. | |
| 10.26+ | Management Carve-Out Bonus Award, dated July 1, 2012, between the Registrant and Byron Myers. | |
| 10.27+ | Management Carve-Out Bonus Award, dated July 1, 2012, between the Registrant and Matthew Scribner. | |
| 16.1^ | Letter from Macias Gini & O’Connell LLP addressed to the Securities and Exchange Commission. | |
| 23.1 | Consent of BDO USA, LLP, Independent Registered Public Accounting Firm. | |
| 23.2 | Consent of Macias Gini & O’Connell LLP, Independent Registered Public Accounting Firm. | |
|
| ||
II-7
Table of Contents
| Exhibit number |
Description | |
| 23.3* | Consent of Wilson Sonsini Goodrich & Rosati, Professional Corporation (included in Exhibit 5.1). | |
| 23.4^ | Consent of Timan, LLC. | |
| 23.5^ | Consent of American Association of Respiratory Care. | |
| 24.1^ | Powers of Attorney (included in page II-7-8 to the original filing of this registration statement). | |
|
| ||
| ^ | Previously filed. |
| * | To be filed by amendment. |
| + | Indicates a management contract or compensatory plan. |
(b) Financial statement schedules.
Schedules have been omitted because the information required to be set forth therein is not applicable or is shown in the financial statements or notes thereto.
Item 17. Undertakings.
The undersigned registrant hereby undertakes to provide to the underwriters at the closing specified in the underwriting agreement, certificates in such denominations and registered in such names as required by the underwriters to permit prompt delivery to each purchaser.
Insofar as indemnification for liabilities arising under the Securities Act may be permitted to directors, officers and controlling persons of the registrant pursuant to the foregoing provisions, or otherwise, the registrant has been advised that in the opinion of the Securities and Exchange Commission such indemnification is against public policy as expressed in the Securities Act and is, therefore, unenforceable. In the event that a claim for indemnification against such liabilities (other than the payment by the registrant of expenses incurred or paid by a director, officer or controlling person of the registrant in the successful defense of any action, suit or proceeding) is asserted by such director, officer or controlling person in connection with the securities being registered, the registrant will, unless in the opinion of its counsel the matter has been settled by controlling precedent, submit to a court of appropriate jurisdiction the question whether such indemnification by it is against public policy as expressed in the Securities Act and will be governed by the final adjudication of such issue.
The undersigned hereby undertakes that:
| (1) | For purposes of determining any liability under the Securities Act, the information omitted from the form of prospectus filed as part of this registration statement in reliance upon Rule 430A and contained in a form of prospectus filed by the registrant pursuant to Rule 424(b)(1) or (4) or 497(h) under the Securities Act shall be deemed to be part of this registration statement as of the time it was declared effective. |
| (2) | For the purpose of determining any liability under the Securities Act, each post-effective amendment that contains a form of prospectus shall be deemed to be a new registration statement relating to the securities offered therein, and the offering of such securities at that time shall be deemed to be the initial bona fide offering thereof. |
II-8
Table of Contents
Signatures
Pursuant to the requirements of the Securities Act of 1933, the registrant has duly caused this registration statement to be signed on its behalf by the undersigned, thereunto duly authorized, in the City of Goleta, State of California, on January 28, 2014.
| INOGEN, INC. | ||
| By: |
/s/ Raymond Huggenberger | |
| Raymond Huggenberger | ||
| President and Chief Executive Officer | ||
Pursuant to the requirements of the Securities Act of 1933, this registration statement has been signed by the following persons in the capacities and on the dates indicated:
| Signature | Title | Date | ||
|
| ||||
| /s/ Raymond Huggenberger Raymond Huggenberger |
President, Chief Executive Officer and Director (Principal Executive Officer) |
January 28, 2014 | ||
| /s/ Alison Bauerlein Alison Bauerlein |
Chief Financial Officer (Principal Accounting and Financial Officer) |
January 28, 2014 | ||
| * Heath Lukatch, Ph.D |
Chairman of the Board |
January 28, 2014 | ||
| * Benjamin Anderson-Ray |
Director |
January 28, 2014 | ||
| * Stephen E. Cooper |
Director |
January 28, 2014 | ||
| * William J. Link, Ph.D. |
Director |
January 28, 2014 | ||
| * Charles E. Larsen |
Director |
January 28, 2014 | ||
| * Loren McFarland |
Director |
January 28, 2014 | ||
| * Timothy Petersen |
Director |
January 28, 2014 | ||
| * By: |
/s/ Raymond Huggenberger | |
| Raymond Huggenberger | ||
| Attorney-in-fact | ||
|
| ||||||
II-9
Table of Contents
Exhibit index
| Exhibit number |
Description | |
| 1.1* | Form of Underwriting Agreement. | |
| 3.1^ | Twelfth Amended and Restated Certificate of Incorporation of the Registrant, as amended. | |
| 3.2^ | Form of Thirteenth Amended and Restated Certificate of Incorporation, to be effective upon completion of the offering. | |
| 3.3^ | Form of Amended and Restated Bylaws, to be effective immediately prior to the completion of the offering. | |
| 4.1^ | Specimen Common Stock Certificate of the Registrant. | |
| 4.2^ | Ninth Amended and Restated Investors’ Rights Agreement, dated March 12, 2012, by and among the Registrant and the investors named therein, as amended. | |
| 4.3^ | Form of Warrant to Purchase Common Stock issued in connection with the Registrant’s 2007 convertible note financing. | |
| 4.4^ | Form of Warrant to Purchase Common Stock issued in connection with the Registrant’s Series E Preferred Stock Financing. | |
| 4.5^ | Form of Warrant to Purchase Series C Convertible Preferred Stock. | |
| 4.6^ | Form of Warrant to Purchase Series D Convertible Preferred Stock issued pursuant to the Registrant’s Note and Warrant Purchase Agreement dated July 7, 2006. | |
| 4.7^ | Form of Warrant to Purchase Series D Convertible Preferred Stock issued in connection with the Registrant’s Note and Warrant Purchase Agreement dated September 1, 2006. | |
| 4.8^ | Warrant to purchase Series D Convertible Preferred Stock, dated September 18, 2006, issued to Venture Lending and Leasing IV, LLC. | |
| 4.9^ | Form of Warrant to Purchase Series E Convertible Preferred Stock. | |
| 4.10^ | Form of Second Warrant to Purchase Series E Convertible Preferred Stock. | |
| 5.1* | Opinion of Wilson Sonsini Goodrich & Rosati, Professional Corporation. | |
| 10.1+^ | Form of Director and Executive Officer Indemnification Agreement. | |
| 10.2+^ | 2002 Stock Plan, as amended. | |
| 10.3+^ | Form of Notice of Stock Option Grant and Stock Option Agreement under the 2002 Stock Plan, as amended. | |
| 10.4+^ | 2012 Equity Incentive Plan, as amended. | |
| 10.5+^ | Form of Stock Option Agreement under the 2012 Equity Incentive Plan. | |
| 10.6+ | 2014 Equity Incentive Plan, to be in effect upon completion of this offering. | |
| 10.7+ | Form Agreements under the 2014 Equity Incentive Plan. | |
| 10.8+ | 2014 Employee Stock Purchase Plan. | |
| 10.9+^ | Executive Incentive Compensation Plan. | |
| 10.10+^ | Employment Agreement, dated October 1, 2013, between the Registrant and Raymond Huggenberger. | |
| 10.11+^ | Employment Agreement, dated October 1, 2013, between the Registrant and Scott Wilkinson. | |
| 10.12+^ | Employment Agreement, dated October 1, 2013, between the Registrant and Alison Bauerlein. | |
|
| ||
Table of Contents
| Exhibit number |
Description | |
| 10.13+^ | Employment Agreement, dated October 1, 2013, between the Registrant and Matt Scribner. | |
| 10.14+^ | Employment Agreement, dated October 1, 2013, between the Registrant and Brenton Taylor. | |
| 10.15^ | Amended and Restated Revolving Credit and Term Loan Agreement, dated October 12, 2012, between the Registrant and Comerica Bank, as amended. | |
| 10.16^ | Security Agreement, dated October 12, 2012, between the Registrant and Comerica Bank. | |
| 10.17^ | Multi-Purpose Commercial Building Lease, dated February 1, 2010, between the Registrant and Rockbridge Investments, L.P., as amended. | |
| 10.18^ | Lease Agreement, dated May 3, 2012, between the Registrant and Bayview (TX) Holding LLC. | |
| 10.19^ | License Agreement, dated July 23, 2007, between the Registrant and Air Products and Chemicals, Inc. | |
| 10.20^ | Amendment to License Agreement, dated October 23, 2009, between the Registrant and Air Products and Chemicals, Inc. | |
| 10.21^ | Amendment No. 2 to License Agreement, dated October 4, 2010, between the Registrant and Air Products and Chemicals, Inc. | |
| 10.22^ | Amendment No. 3 to License Agreement, dated March 22, 2011, between the Registrant and Air Products and Chemicals, Inc. | |
| 10.23+ | Management Carve-Out Bonus Award, dated July 1, 2012, between the Registrant and Alison Bauerlein. | |
| 10.24+ | Management Carve-Out Bonus Award, dated July 1, 2012, between the Registrant and Brenton Taylor. | |
| 10.25+ | Management Carve-Out Bonus Award, dated July 1, 2012, between the Registrant and Scott Wilkinson. | |
| 10.26+ | Management Carve-Out Bonus Award, dated July 1, 2012, between the Registrant and Byron Myers. | |
| 10.27+ | Management Carve-Out Bonus Award, dated July 1, 2012, between the Registrant and Matthew Scribner. | |
| 16.1^ | Letter from Macias Gini & O’Connell LLP addressed to the Securities and Exchange Commission. | |
| 23.1 | Consent of BDO USA, LLP, Independent Registered Public Accounting Firm. | |
| 23.2 | Consent of Macias Gini & O’Connell LLP, Independent Registered Public Accounting Firm. | |
| 23.3* | Consent of Wilson Sonsini Goodrich & Rosati, Professional Corporation (included in Exhibit 5.1). | |
| 23.4^ | Consent of Timan, LLC. | |
| 23.5^ | Consent of American Association of Respiratory Care. | |
| 24.1^ | Powers of Attorney (included in page II-7-8 to the original filing of this registration statement). | |
|
| ||
| ^ | Previously filed. |
| * | To be filed by amendment. |
| + | Indicates a management contract or compensatory plan. |