Attached files
| file | filename |
|---|---|
| 8-K - 8-K - BLACKSTONE MORTGAGE TRUST, INC. | d663243d8k.htm |
 January 2014
Exhibit 99.1 |
 This
presentation contains forward-looking statements within the meaning of Section 27A of the Securities Act of 1933, as amended, and Section
21E of the Securities Exchange Act of 1934, as amended, which reflect the current views of
Blackstone Mortgage Trust, Inc. (“BXMT”) with respect to, among other things,
its operations and financial performance. You can identify these forward-looking statements by the use of words such as
“outlook,”
“believes,”
“expects,”
“potential,”
“continues,”
“may,”
“will,”
“should,”
“seeks,”
“approximately,”
“predicts,”
“intends,”
“plans,”
“estimates,”
“anticipates”
or the negative version of these words or other comparable words. Such forward-looking
statements are subject to various risks and uncertainties. Accordingly, there are or
will be important factors that could cause actual outcomes or results to differ
materially from those indicated in these statements. BXMT believes these factors
include, but are not limited, to those described under the section entitled
“Risk Factors”
in its Annual Report on Form 10-K for the fiscal year ended December 31, 2012 and
subsequent quarterly reports on Form 10- Q as
such factors may be updated from time to time in its periodic filings with the Securities and
Exchange Commission, which are accessible on the SEC’s website at www.sec.gov.
These factors should not be construed as exhaustive and should be read in conjunction with the other cautionary
statements that are included in this presentation and in the filings. BXMT undertakes no
obligation to publicly update or review any forward- looking statement or other
information in this presentation, whether as a result of new information, future developments or otherwise.
We refer to “core earnings”, which is a non-GAAP financial measure, in this
presentation. A reconciliation of core earnings to net income, the most directly
comparable GAAP measure, is included in this presentation and our most recent Quarterly Report on Form 10-Q, and is available on our
website
at
www.bxmt.com.
Slide 11 of this presentation includes a reference to imputed core return on
equity (“Imputed Core ROE”) and other economic terms relating to a sample
BXMT loan transaction that are presented solely for purposes of illustrating the impact of using floating-rate financing to finance the
origination of a floating-rate loan and should not be viewed as indicative of the results
that will be achieved for any particular loan in BXMT’s portfolio or of
BXMT’s results as a whole. The loan economics presented are hypothetical and based upon a number of assumptions, including no
defaults on the loan, and are subject to various risks and uncertainties. Accordingly,
there are or will be important factors, including those referred to above that could
cause the actual economics that are achieved on this or any other loan in BXMT’s
loan portfolio to differ materially from those indicated in this illustration.
In particular, it should be noted that as a result of such factors the net spread between
whole loan yields and the cost of related leverage, the leverage multiple applicable to
any particular loan and allocable overhead may vary materially from period to period and
across BXMT’s loan portfolio. Imputed Core ROE also excludes potential incentive
management fees and is presented before any tax effects. Forward-Looking Statements
and Other Matters 1 |
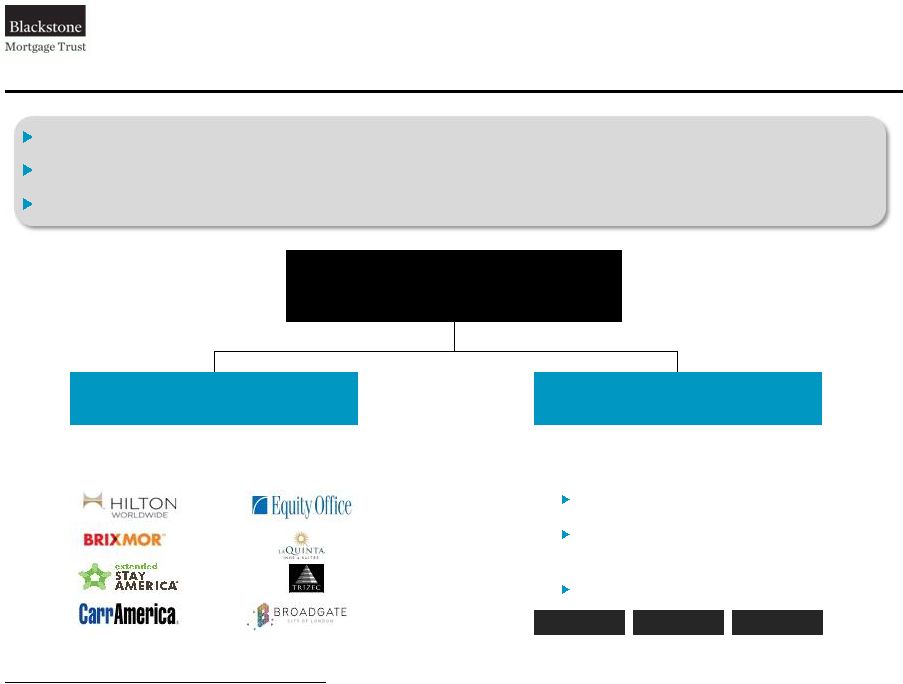
 Blackstone
Mortgage Trust, Inc. (NYSE: BXMT) is a real estate investment trust that primarily
originates
and
purchases
senior
mortgage
loans
collateralized
by
properties
in
the
U.S.
and
Europe
We are managed by Blackstone (“BX”), a world leader in real estate investing with
nearly $70 billion AUM and over $120 billion of owned real estate
•
BX’s equity investment platform, Blackstone Real Estate Partners, has nearly $60 billion
AUM •
BX’s CRE lending platform, Blackstone Real Estate Debt Strategies, has over $10 billion
AUM •
Significant
alignment
of
interest:
$96
million
BX
investment
(1)
Reluctance among traditional CRE lenders coupled with increased transaction volume creates a
compelling lending environment in the U.S. and Europe
BXMT
has
a
demonstrated
ability
to
originate
target
assets,
with
over
$2.2
billion
of
gross
originations
since
May
2013
equity
recapitalization
(2)
•
Our
diversified
portfolio
of
loans
has
a
weighted
average
loan
to
value
of
65%
(2)
Our focused senior lending strategy is designed both to provide attractive current income and
protect investors’
capital
•
Commercial mortgages, prudently levered, offer excellent risk adjusted returns
•
Simple business model translates net interest margin to bottom line
•
With a LIBOR-based lending and funding model, our returns increase with rising
short-term interest rates Blackstone Mortgage Trust Overview
2
(1)
Based upon closing price on the NYSE on January 23, 2014. Includes BX employees
and associates. (2)
As of October 30, 2013, includes loans closed and loans in closing; excludes CT Legacy
portfolio. |
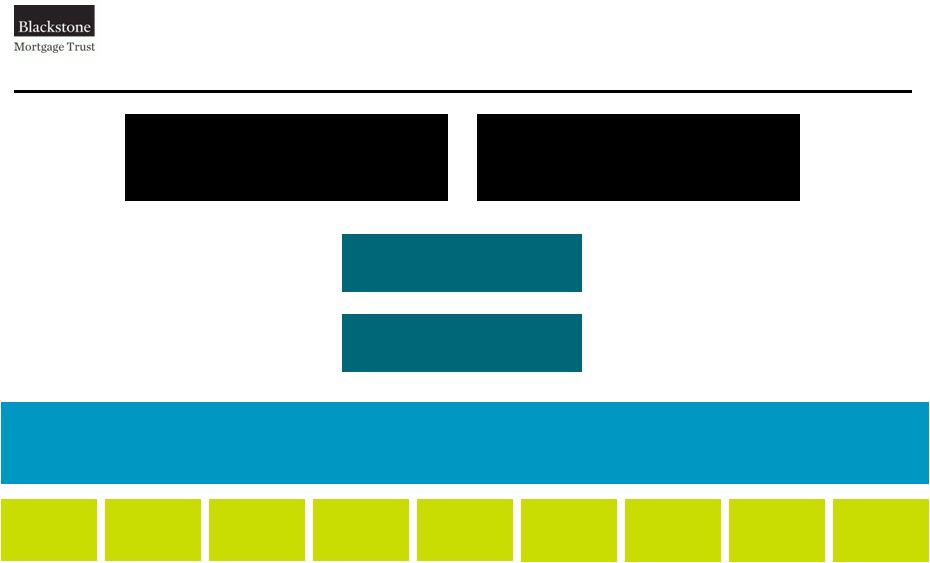
 Superior Real Estate Platform
3
(1)
As of September 30, 2013.
Blackstone Real Estate
Blackstone Real Estate
Debt Strategies (“BREDS”)
Blackstone Real Estate
Partners (“BREP”)
Nearly $60 billion AUM
210 professionals
(1)
Over $10 billion AUM
59 professionals
(1)
200 separate loans
(1)
Actively managed CMBS hedge
funds ($891 million
(1)
)
Rated/Approved Special Servicer
BX investment committee process and investment philosophy
Superior sourcing capabilities through long-standing industry relationships
Underwriting process includes proprietary data from extensive investment holdings
BREDS
BREDS
Blackstone
Drawdown Funds
Hedge Funds
Mortgage Trust |
 Seasoned and Fully Integrated Platform
4
Origination
Europe –
United States
23 Professionals
Asset
Management
6 Professionals
Legal /
Compliance
3 Professionals
Michael Nash
Executive Chairman
CIO of BREDS
Jonathan Gray
Global Head of Real Estate
Member of Blackstone Board of Directors
Member of BXMT Investment Committee
John Schreiber
Co-Founder of Blackstone Real Estate Advisors
Member of BXMT Board of Directors
Chair of BXMT Investment Committee
Stephen Plavin
CEO & President
SMD of BREDS
Douglas
Armer
Anthony
Marone
Weston
Tucker
Robert
Harper
Thomas
Ruffing
Randall
Rothschild
Peter
Sotoloff
Capital Markets / Investor Relations /Finance
11 Professionals
Paul
Quinlan
Tim
Johnson |
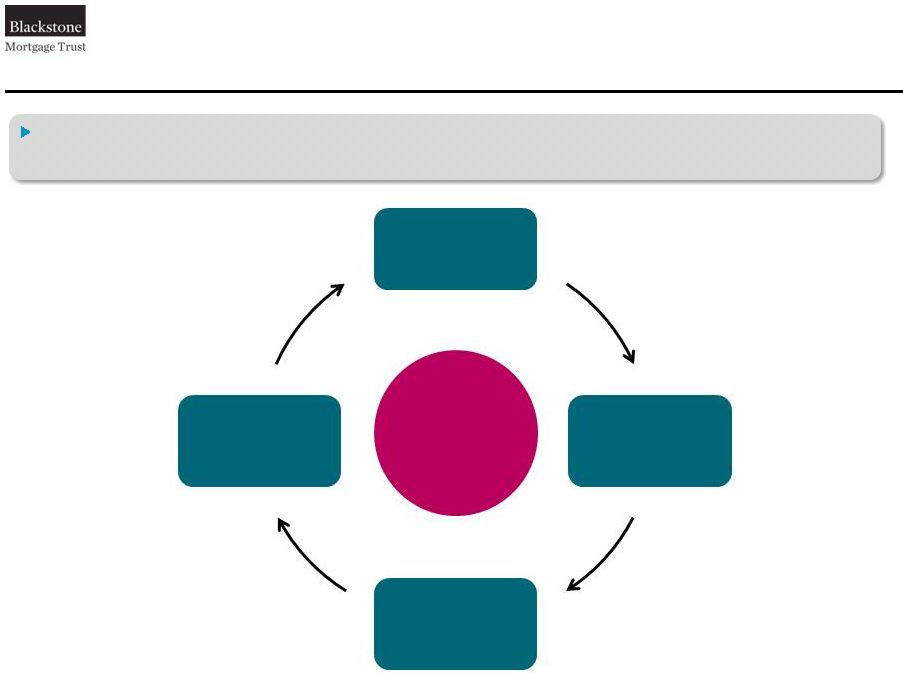 Real
Estate Market Overview 5
Positive
Feedback
Loop
Market conditions are sustaining a favorable commercial real estate environment
•
Liquidity and fundamentals in the commercial real estate market are generally in balance
Economy
Recovering
Technicals
Improving
Confidence
Growing
Capital
Returning |
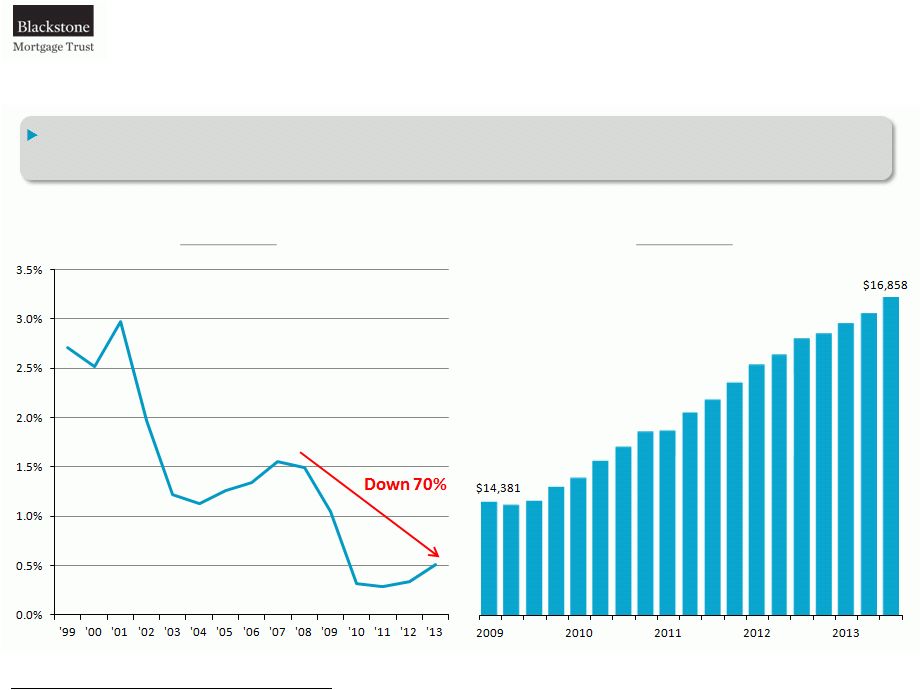 Real
Estate Market Overview 6
Limited new supply coupled with modest growth is a favorable investment environment for
senior commercial real estate debt
U.S. Aggregate Construction Completions
U.S. GDP ($ in billions)
Sources: REIS & Federal Reserve Economic Data as of Q3 2013.
|
 Real
Estate Market Overview 7
Source: Real Capital Analytics as of Q3 2013.
U.S. Aggregate Property Sale Volume
($ in billions)
Improving fundamentals and increased demand are driving volume |
 Real
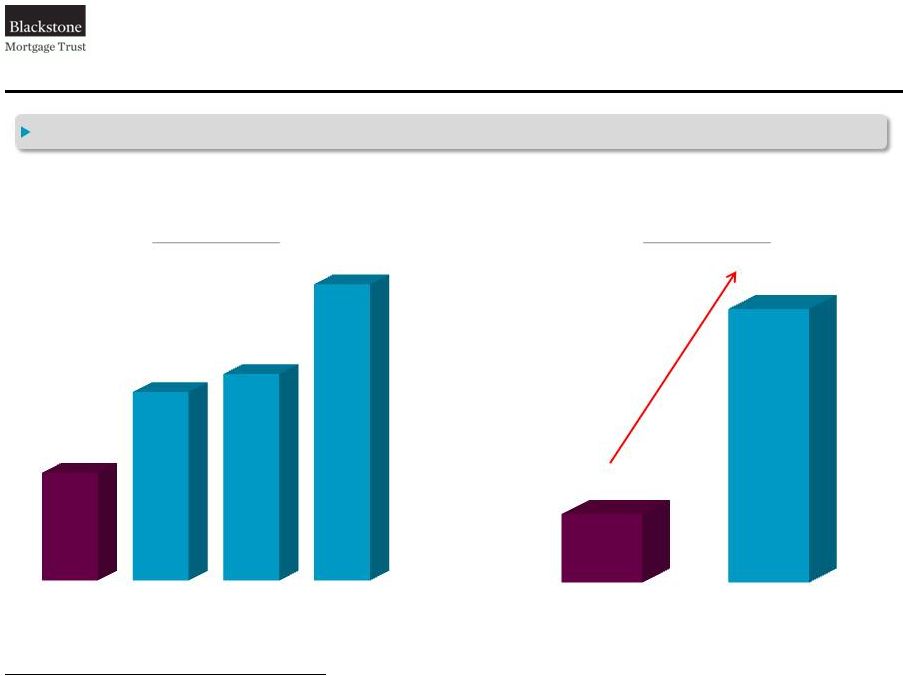
Estate Market Overview 8
Positive
Feedback
Loop
Real
Estate
Deleveraging
(2)
Overleveraged
Banks
(1)
European banks have over 2x the leverage of U.S. banks…
…
and have only shed 25% of expected RE dispositions
€450B to come
European banks remain overleveraged with enormous real estate exposure
U.S.
U.K.
France
Germany
12x
21x
23x
33x
Deleveraged to Date
Total Amount
Announced
€150B
€600B
(1)
SNL, ECB, April 2013; The ratio of tangible assets to tangible common equity for all
banks. (2) Morgan Stanley “Banks Deleveraging and Real Estate”
August 2013. |
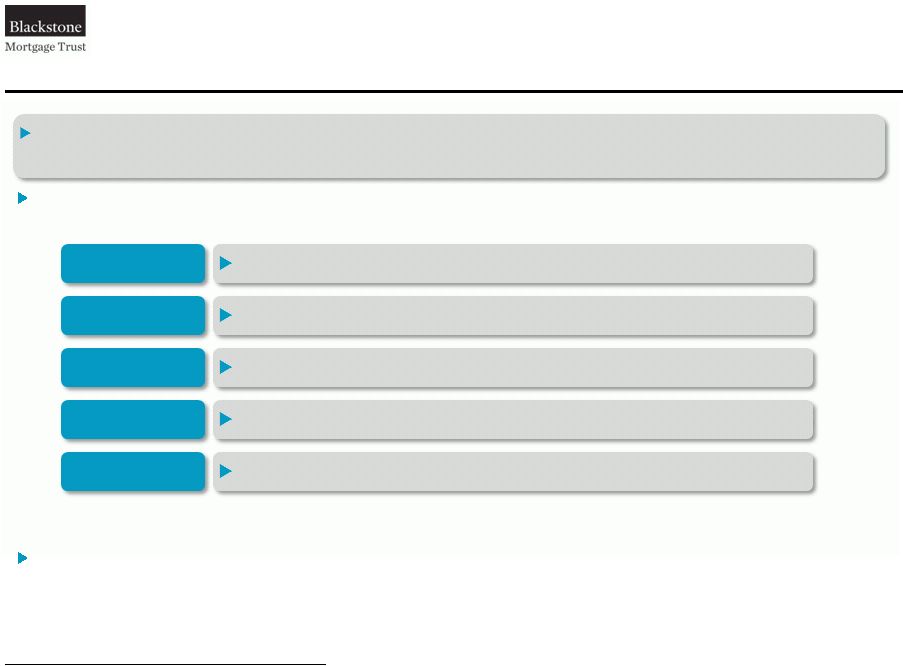
 Target Investments
$50 million to $500 million
Loan Size
First mortgages on stabilized or transitional assets
Collateral
All commercial property types
Property Type
North America and Europe
Geographies
Last dollar 60-80%
Loan to Value
LIBOR + 3.75% and higher, scaled to risk
Rate
3 to 5 years
Term
Typically interest only
Amortization
Typically 1.0% origination fee and 0.25% to 0.50% extension fees
Fees
12 to 24 months of spread maintenance
Prepayment
9 |
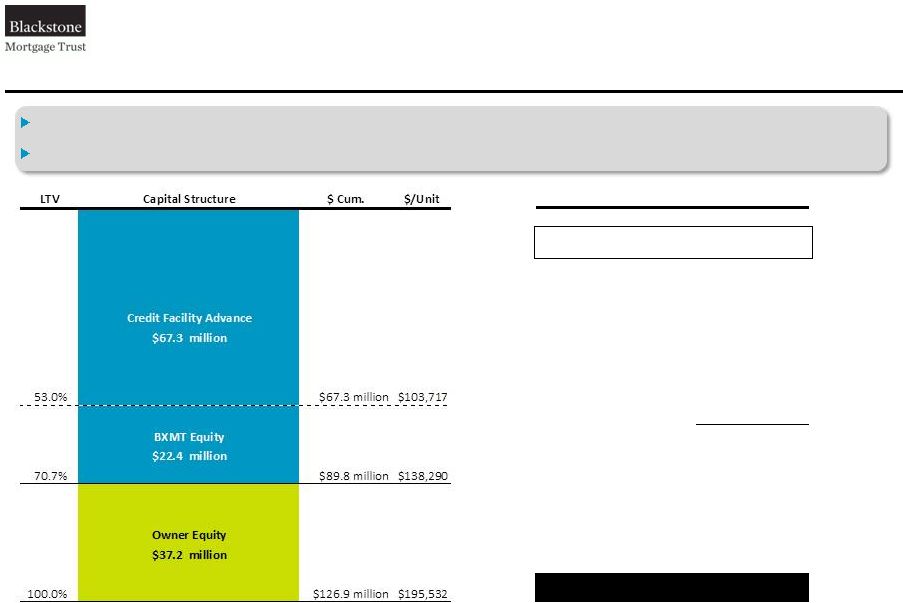
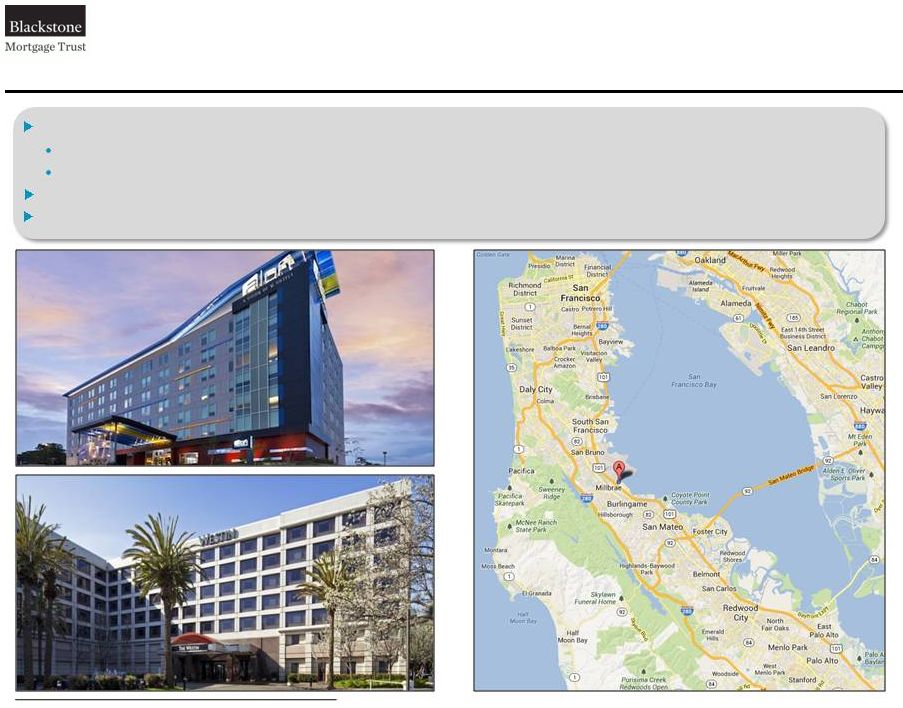 BXMT Sample Transaction: SFO Airport Hotels
$89.8
million
floating
rate,
first
mortgage
loan
secured
by
the
Westin
and
aLoft
San
Francisco
Airport
hotels
(1)
70.7% LTV; $138,290 per key
Diverse demand drivers including airport traffic and SF/Silicon Valley business overflow
Transaction sourced through existing Blackstone relationship with high quality sponsor
BX office holdings in northern CA and hospitality investments globally enabled definitive,
efficient execution 10
(1)
Loan closed during 4Q 2013. |
 BXMT Sample Transaction: SFO Airport Hotels
BXMT’s floating rate senior mortgage loans are supported by significant owner’s
equity Prudent use of balance sheet leverage drives strong risk adjusted returns for
BXMT shareholders 11
Illustrative Loan Economics
(1)
Whole Loan Yield
(2)
L + 4.50%
Leverage:
Advance Rate
75.0%
All-in Cost
(2)
L + 2.25%
Net Spread
2.55%
Leverage Multiple
3.0 X
Levered Spread
6.75%
Base Return
L + 4.50%
Gross ROI
L + 11.25%
Less Overhead Allocations
(3)
:
Management Fee
1.50%
General & Administrative
0.50%
Working Capital/
Equity Deployment
1.50% -
0.75%
Imputed Core ROE
(4)
L
+ 7.75% -
8.50%
(2) Whole loan yield and all-in cost of leverage include amortization of fees and expenses
pursuant to GAAP in addition to current pay rates assuming no defaults. (3) Overhead
allocations are illustrative, actual allocations vary materially and depend on expenses incurred, working capital needs and defensive liquidity needs, overall capital deployment and performance among other factors.
(4)
Imputed
Core
ROE
for
this
illustrative
loan
excludes
potential
incentive
fees
and
is
a
hypothetical
illustrative
measure
and
does
not
represent
BXMT
Core
Earnings.
(1)
This illustration is presented solely for purposes our floating-rate business model and
should not be viewed as indicative of the results that will be achieved for any particular loan in BXMT’s portfolio or of BXMT’s results as a
whole. The loan economics presented are hypothetical and are subject to various risks and
uncertainties. See “Forward-Looking Statements and Other Matters” for further discussion of such risks and uncertainties.
|
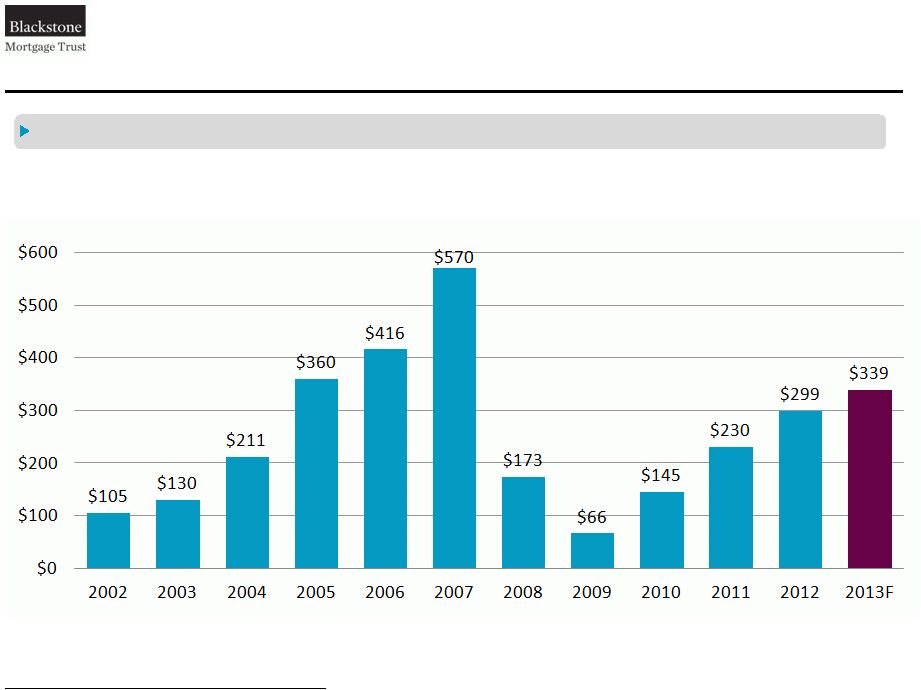
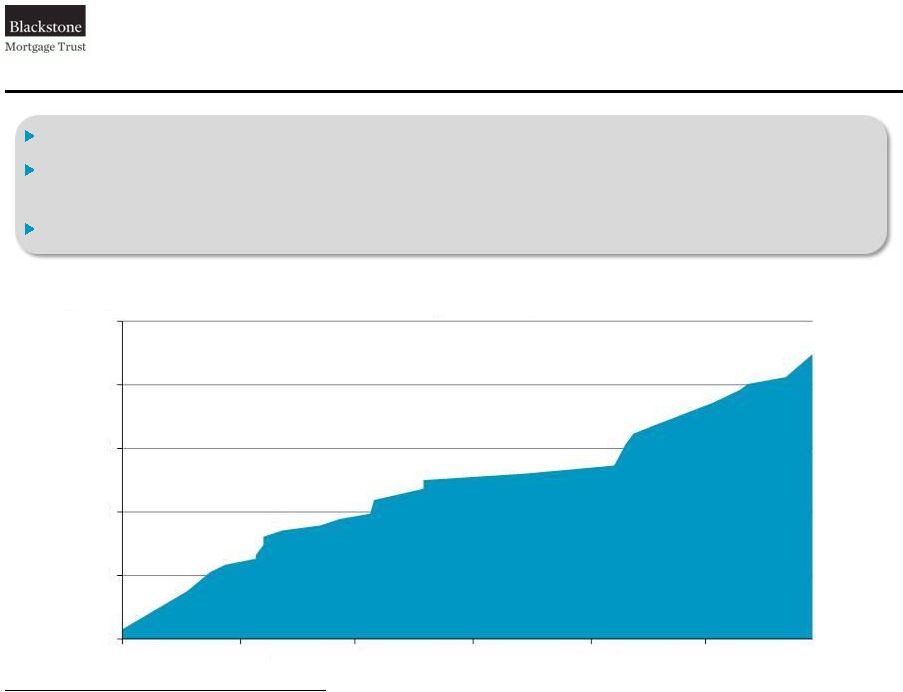 Capital Deployment
(1)
12
(1)
As of October 30, 2013.
BXMT has executed on its first mortgage direct origination strategy with rapid success
Since May, BXMT has closed $2.0 billion of loans; and another $282 million of loans are
currently in closing
22 loans closed; 3 in closing; median loan size is $68 million
$
$500
$1,000
$1,500
$2,000
$2,500
21-May-13
21-Jun-13
21-Jul-13
21-Aug-13
21-Sep-13
21-Oct-13
Cumulative BXMT Loan Originations
($ in millions) |
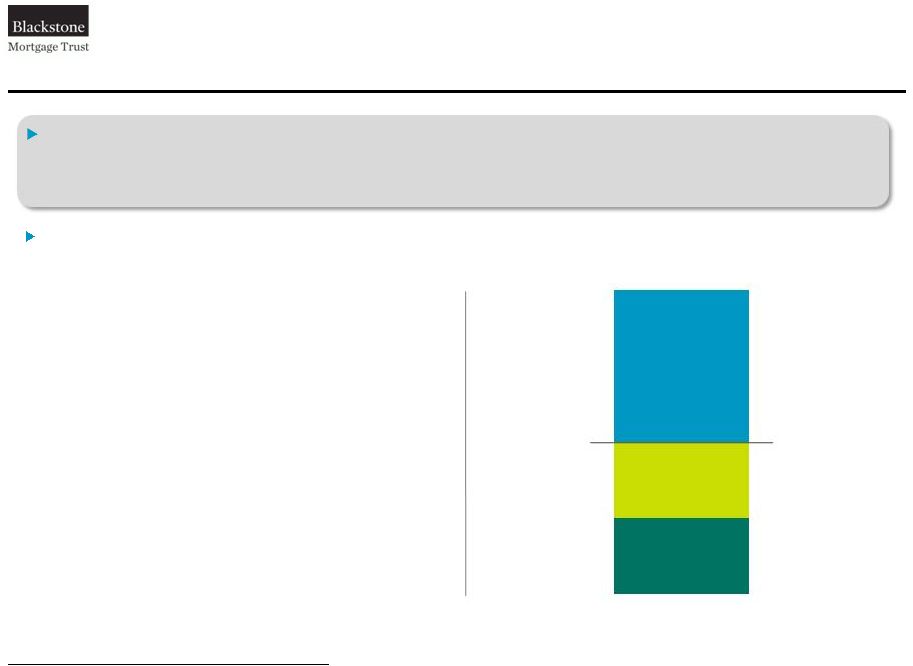
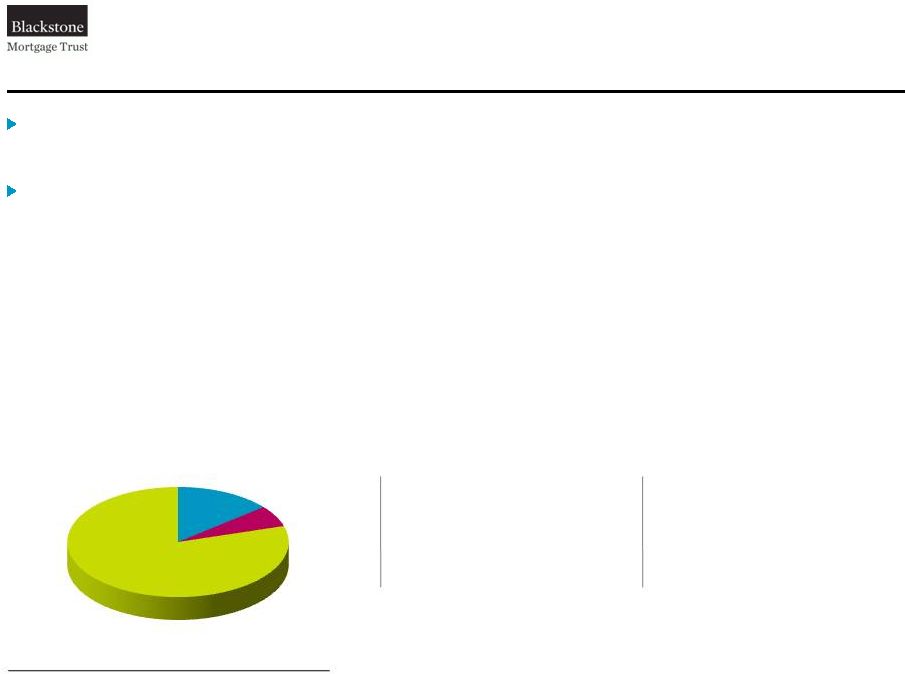
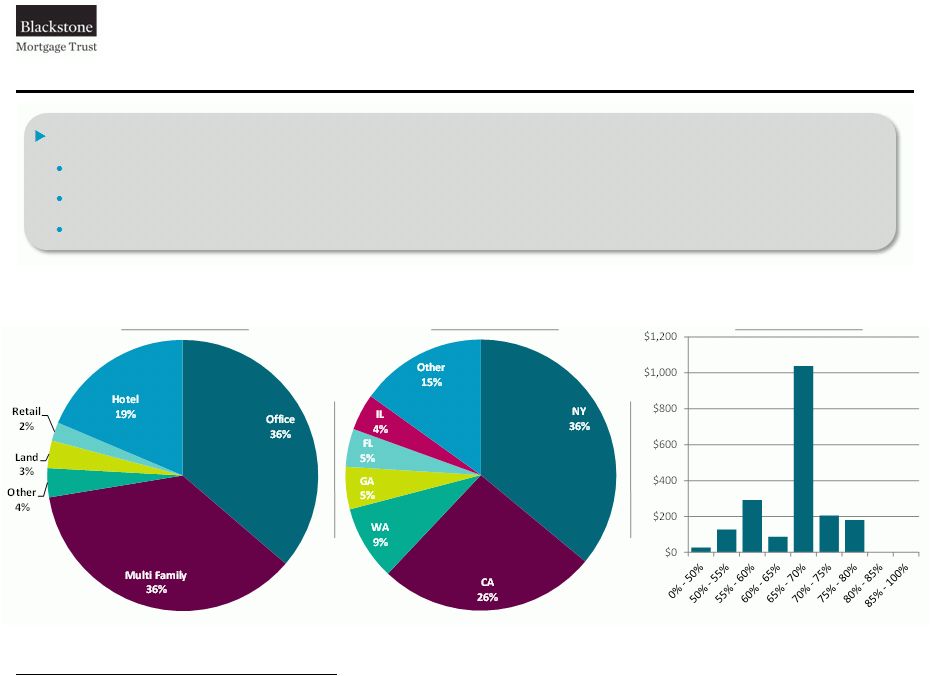 Portfolio Snapshot
13
The BXMT loan portfolio is comprised of a diversified portfolio of senior loans
100% of BXMT’s new loans are floating rate
High quality owners and sponsors
The
$2.2
billion
portfolio
has
a
weighted
average
LTV
of
65%
and
all-in
yield
of
L
+
4.88%
Property Type
Geography
Loan to Value
($ in millions)
Note: Portfolio data as of October 30, 2013; includes loans closed and in closing, except for
the all in yield, which includes only loans closed as of September 30, 2013; excludes
CT Legacy portfolio. |
 Debt
Facilities ($1.8 billion in total) •
Revolving
debt
facilities
totaling
$1.5
billion
(1)
from
three
lenders
•
Non-Recourse Asset Specific Financings totaling $335 million
Other Potential Funding Sources
•
A-Note sale
•
CLO issuance
•
Corporate finance options
Financing
14
(1)
Availability of borrowings of up to $1.5 billion depending on amount of collateral pledged,
includes £153 million GBP denominated facility in USD terms. (2)
Assuming
five year senior mortgage transactions; includes applicable origination and extension
fees. Prudent use of leverage to enhance returns and diversification with an emphasis on
stability of the right hand side of the balance sheet
L + 2.00% -
L + 2.50%
All-in Pricing
(2)
75% -
80%
Advance Rate
Term matched to expected life of collateral loans
Term
No
capital
market
marks;
Underlying
RE
performance
mark-to-market
only
Mark-to-Market
Index matched
Index |
 Superior
Sponsorship •
Affiliation
with
BX
Real
Estate,
the
largest
private
equity
real
estate
business
in
the
world
•
Significant
alignment
of
interest:
$96
million
BX
investment
(1)
•
BREDS has approximately $10 billion AUM
Strong Origination Platform
•
$2.2
billion
of
loans
have
closed
or
are
in-closing
(2)
•
Robust pipeline generated from BX network
Attractive Market Opportunity
•
Dislocation amongst CRE lenders coupled with increased transaction volume
Focused Strategy
•
Senior lending strategy provides attractive current income and protects capital
Floating-Rate Business Model
•
Returns increase with rising short-term interest rates, and therefore our asset and equity
values are insulated from such increases
BXMT Investment Highlights
15
(1)
Based upon closing price on the NYSE on January 23, 2014. Includes BX employees and
associates. (2)
As of October 30, 2013. |
 Appendix |
 Third Quarter 2013 Balance Sheet, Results and Core Earnings
17
Core Earnings
($ in thousands)
$0.28
Core Earnings per Share
Balance Sheet and 3Q Results
($ in millions)
$0.27
Dividends per Share
Net income
$8,320
-
CT Legacy net income
(437)
+ Non-cash compensation
94
Core earnings
$7,977
Loan portfolio
Repurchase
facilities
CT Legacy
portfolio, net
Equity and
other
(1)
Other expenses
($3.4)
Net
income
$8.3
Interest income
$15.1
Interest expense
($3.8)
CT Legacy, net
$0.4
$64
$1,286
$643
$707
(1)
Includes stockholders’ equity of $713.3 million, and the net of (i) cash and cash
equivalents of $10.3 million, (ii) accrued interest receivable, prepaid expenses, and other assets
of $8.7 million, and (iii) accounts payable, accrued expenses, and other liabilities of $12.8
million. |
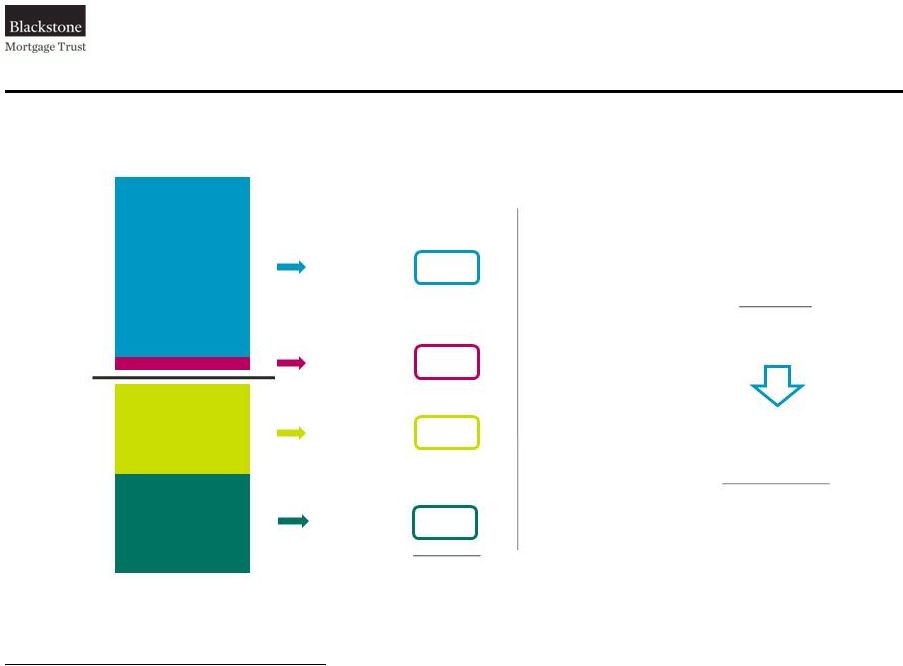
 Floating-Rate Business Model
18
As of September 30, 2013:
•
$1.3 billion of floating-rate loans, indexed to
one-month LIBOR
•
$643 million of floating-rate liabilities, also
indexed to one-month LIBOR
•
Return on $649 million of equity capital is
highly correlated to LIBOR
–
All else equal, as of September 30, 2013, a
100bp increase in LIBOR would have
increased
our
net
income
by
$6.5
million
(2)
per annum
Equity Capital
Due to our LIBOR-based lending and funding business model, our returns increase with
rising short-term interest rates and therefore our asset and equity values are
insulated from such increases
Loan Capitalization
(1)
($ in millions)
Floating-rate
loans
Floating-rate
borrowings
$1,292
$643
$649
(1)
Includes only our Loan Origination portfolio with an aggregate principal balance of $1.3
billion, capitalized with $643.0 million of debt and $649.0 million of equity as of
September 30, 2013. Excludes the assets, liabilities, and equity of the CT Legacy Portfolio.
(2)
Excludes the impact of LIBOR floors on certain of our loans receivable investments. |
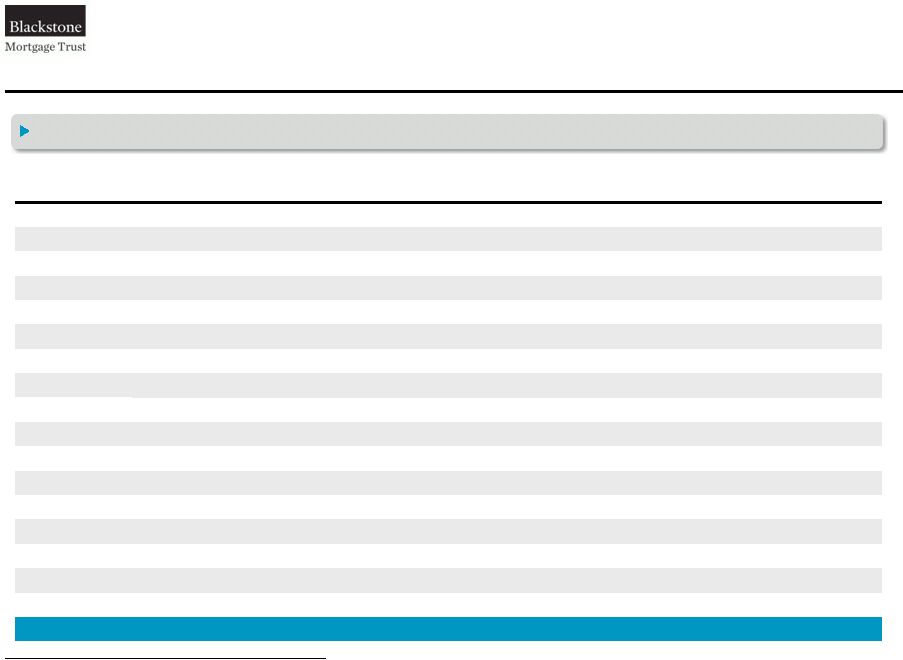 Loan Origination Portfolio Details
19
(1)
Includes only loans in our Loan Origination portfolio. For information on loans in the CT
Legacy Portfolio, refer to our Form 10-Q, filed on October 29, 2013. (2)
All loans are floating-rate loans indexed to LIBOR as of September 30, 2013. LIBOR was
0.18% as of September 30, 2013. (3)
Maximum maturity date assumes all extension options are exercised.
The
following
table
provides
details
of
our
loan
portfolio
(1)
as
of
September
30,
2013:
($ in millions)
Loan Type
Principal
Balance
Book
Value
Cash
Coupon
(2)
All-In
Yield
(2)
Maximum
Maturity
(3)
Geographic
Location
Property
Type
Origination
LTV
Loan 1
Sr. mortgage
291.5
$
290.1
$
L + 3.80%
L + 3.98%
6/15/18
West
Office
53%
Loan 2
Sr. mortgage
140.0
139.7
L + 3.70%
L + 3.83%
9/30/20
Northeast
Multifamily
67%
Loan 3
Sr. mortgage
109.8
109.7
L + 5.25%
L + 8.20%
7/9/14
Northeast
Multifamily
65%
Loan 4
Sr. mortgage
87.2
86.6
L + 4.25%
L + 4.52%
8/10/18
Diversified
Hotel/Office
61%
Loan 5
Sr. mortgage
81.0
80.6
L + 3.85%
L + 4.03%
7/9/18
Southeast
Multifamily
75%
Loan 6
Sr. mortgage
69.2
69.0
L + 3.95%
L + 4.05%
6/9/18
West
Office
72%
Loan 7
Sr. mortgage
68.0
67.7
L + 4.00%
L + 4.23%
6/10/16
Northeast
Office
68%
Loan 8
Sr. mortgage
64.0
64.3
L + 8.00%
L + 9.46%
2/9/15
Northeast
Land
69%
Loan 9
Sr. mortgage
57.1
56.5
L + 3.85%
L + 4.24%
10/10/18
Diversified
Multifamily
76%
Loan 10
Sr. mortgage
48.4
48.5
L + 5.00%
L + 5.68%
12/9/16
Midwest
Hotel
53%
Loan 11
Sr. mortgage
46.3
45.8
L + 4.25%
L + 4.64%
7/10/18
Southwest
Hotel
69%
Loan 12
Sr. mortgage
45.9
45.0
L + 5.00%
L + 6.07%
8/9/18
Southeast
Office
73%
Loan 13
Sr. mortgage
43.5
43.1
L + 4.50%
L + 5.11%
7/16/17
Northeast
Retail
69%
Loan 14
Sr. mortgage
42.6
42.1
L + 3.85%
L + 4.29%
9/10/18
Diversified
Multifamily
77%
Loan 15
Sr. mortgage
37.5
37.1
L + 3.85%
L + 4.04%
8/9/18
Midwest
Office
68%
Loan 16
Sr. mortgage
32.9
32.9
L + 3.95%
L + 4.20%
8/9/17
Southwest
Hotel
51%
Loan 17
Sr. mortgage
27.1
27.1
L + 3.87%
L + 3.87%
7/7/17
Northeast
Hotel
32%
Total/Wtd. Avg.
1,292.0
$
1,285.8
$
L + 4.31%
L + 4.88%
4.3 years
64% |
 CT
Legacy
Portfolio
–
September
30,
2013
20
(1)
For calculation of segment Book Value and Equity per Share, refer to our Form 10-Q, filed
on October 29, 2013. The CT Legacy Portfolio consists of our investment in CT Legacy
Partners, our residual interests in CT
CDO
I,
and
our
carried
interest
in
CT
Opportunity
Partners
I,
LP
(“CTOPI”).
CT Legacy Portfolio book value was $64.3 million as of quarter-end, which represents
additional capital that, upon collection, will be available for investment in our Loan
Origination business. •
In
October,
we
received
a
net
$20.3
million
distribution
from
CT
Legacy
Partners,
representing
our
net
share
of
its first common equity distribution.
•
During
the
third
quarter,
CT
CDO
I
sold
its
one
loan
classified
as
held-for-sale
for
net
proceeds
of
$3.2
million.
•
Our share of the carried interest allocation from CTOPI, which is not reflected in our book
value, increased $1.4
million during the quarter to a net $13.5 million.
$2.22
CT Legacy Portfolio
Book Value per Share
(1)
$0.02
CT Legacy Portfolio
Earnings
per
Share
(2)
CT Legacy
Partners
CT CDO I
Other
Net Book Value
($ in millions)
$9
$4
$51 |
 |