Attached files
| file | filename |
|---|---|
| 8-K - 8-K - TEXAS CAPITAL BANCSHARES INC/TX | d659976d8k.htm |
| EX-99.1 - EX-99.1 - TEXAS CAPITAL BANCSHARES INC/TX | d659976dex991.htm |
| EX-99.3 - EX-99.3 - TEXAS CAPITAL BANCSHARES INC/TX | d659976dex993.htm |
| EX-99.4 - EX-99.4 - TEXAS CAPITAL BANCSHARES INC/TX | d659976dex994.htm |
 January 22, 2014
TCBI Q4 2013
Earnings
Exhibit 99.2 |
 Certain
matters
discussed
on
this
call
may
contain
forward-looking
statements,
which
are
subject
to
risks
and
uncertainties
and
are
based
on
Texas
Capital’s
current
estimates
or
expectations
of
future
events
or
future
results.
Texas
Capital
is
under
no
obligation,
and
expressly
disclaims
such
obligation,
to
update,
alter
or
revise
its
forward-looking
statements,
whether
as
a
result
of
new
information,
future
events
or
otherwise.
A
number
of
factors,
many
of
which
are
beyond
Texas
Capital’s
control,
could
cause
actual
results
to
differ
materially
from
future
results
expressed
or
implied
by
such
forward-looking
statements.
These
risks
and
uncertainties
include
the
risk
of
adverse
impacts
from
general
economic
conditions,
competition,
interest
rate
sensitivity
and
exposure
to
regulatory
and
legislative
changes.
These
and
other
factors
that
could
cause
results
to
differ
materially
from
those
described
in
the
forward-looking
statements
can
be
found
in
the
prospectus
supplements,
the
Annual
Report
on
Form
10-K
and
other
filings
made
by
Texas
Capital
with
the
Securities
and
Exchange
Commission
(SEC).
2 |
 Opening Remarks
•
Exceptional growth in loans and deposits for 2013
•
Capital raising consistent with market opportunity for growth
•
Continued improvement in NPAs with low level of charge-offs for the
year •
2013 non-interest expense includes hiring foundation of market
leading talent supporting 2014 growth and beyond
•
Mortgage Finance levels up, with 2013 average slightly up as compared
to 2012 average, and continued to outperform the industry
3 |
 Financial Review
Net Income
–
Decrease in net income of 9% compared to Q3-2013; full year net
income consistent with 2012 –
Profitability –
ROA and ROE remained strong, despite decrease in net income
–
Net Revenue
•
3% increase from Q3-2013
•
8% growth from Q4-2012
–
Exceptional growth in LHI average balances (excluding mortgage
finance) and Total Loans •
Growth of 5% from Q3-2013 and 22% from Q4-2012
•
Clear increase in market share for Mortgage Finance with growth of 2%
from 2012 and modest decrease from Q3-2013
–
Margin remained consistent with Q3-2013 at 4.21%
•
Strong LHI levels, improved composition with reduced proportion of MF
Loan balances and yields •
Improved funding profile from continued growth in DDA and total
deposits –
Correction of error
for
accounting
of
Mortgage
Finance
–
formerly
LHS
•
Previously classified as Held for Sale; will now be consistent with
regulatory accounting and treated as Held for Investment
•
No
change
in
business
direction
–
anticipate
continued
improvement
in
market
position
•
No
change
in
character
of
the
assets
–
quality,
liquidity
and
duration
unaffected
•
No
change
in
any
aspect
of
the
business
–
still
producing
excellent
returns
with
highly
liquid ownership
interests in individual mortgage loans of superior quality
4
Operating Leverage, Core Earnings Power & NIM
LHI/LHS Accounting |
 Financial Review
Loan Growth
–
Broad-based growth in traditional LHI (excluding Mortgage
Finance) •
Growth of $435.1 million from Q3-2013 and $1.7 billion from
Q4-2012 •
Period end balance $343.7 million over average balance for the
quarter •
Averages increased 5% from Q3-2013 and 22% from Q4-2012
–
Average MF balances consistent with objectives
•
Results well above industry trends demonstrate increase in market
position and management’s focus on providing ongoing
income •
Growth of 2% from 2012 and only modest decrease from Q3-2013
–
Q4-2013 expenses were largest factor in linked quarter earnings
change, including those associated with exceptional performance
and growth •
Cost of long-term incentives increased $3.6 million ($0.06 per
share) resulting from unprecedented increase in stock price
from Q3-2013 •
Incentive true-up of $1.6 million (almost $0.03 per share) for
lines of business producing average of 20% increase in earnings
contribution from 2012 •
Build-out
expense
of
$0.02
per
share
related
to
exceptional
recruiting
in
Q3,
expansion
of
business
lines
and impact of lag in growth of support and infrastructure costs
associated with growth •
For all of 2013, the “unusual”
items represented almost $20 million
5
Expense Management |
 Financial Review
Funding
–
Funding profile optimal with exceptional DDA and total deposit
growth •
Average DDA increased 5% from Q3-2013 and 40% from
Q4-2012 •
Total average deposits increased 5% from Q3-2013 and 31% from
Q4-2012 –
Total deposit cost stable at 17 bps
Credit Costs
–
Total credit costs of $5.4 million for Q4-2013
•
Provision of $5.0 million consistent with Q3-2013
•
OREO valuation cost of $466,000 in Q4-2013 associated with 60%
reduction in total ORE balances •
NCOs of 6 bps in Q4-2013 and 7 bps for all of 2013
•
Favorable trend in NPA ratio with $11.1 million (23%) decrease from
Q3-2013 6 |
 Income Statement -
Quarterly
7
Q4-13
Q3-13
Q2-13
Q1-13
Q4-12
Net interest income
$ 111,475
$ 108,776
$ 101,220
$ 98,042
$ 101,155
Non-interest income
11,184
10,431
11,128
11,281
12,836
Net revenue
122,659
119,207
112,348
109,323
113,991
Provision for credit losses
5,000
5,000
7,000
2,000
4,500
OREO valuation and write-down expense
466
-
382
71
955
Total provision and OREO valuation
5,466
5,000
7,382
2,071
5,455
Non-interest expense
69,825
62,009
68,352
55,629
59,119
Income before income taxes
47,368
52,198
36,614
51,623
49,417
Income tax expense
17,012
18,724
12,542
18,479
17,982
Net income
30,356
33,474
24,072
33,144
31,435
Preferred stock dividends
2,438
2,437
2,438
81
–
Net income available to common shareholders
$ 27,918
$ 31,037
$ 21,634
$ 33,063
$ 31,435
Diluted EPS
$ .67
$ .74
$ .52
$ .80
$ .76
Net interest margin
4.21%
4.21%
4.19%
4.27%
4.27%
ROA
1.10%
1.25%
0.95%
1.38%
1.27%
ROE
11.94%
13.74%
9.94%
15.82%
15.35%
Efficiency
(1)
56.9%
52.0%
60.8%
50.9%
51.9%
(1) Excludes OREO valuation charge
|
 Income Statement -
Annual
8
2013
2012
2011
2010
2009
Net interest income
$ 419,513
$ 376,879
$ 302,937
$ 241,674
$ 196,691
Non-interest income
44,024
43,040
32,232
32,263
29,260
Net revenue
463,537
419,919
335,169
273,937
225,951
Provision for credit losses
19,000
11,500
28,500
53,500
43,500
OREO valuation and write-down expense
920
6,883
6,798
8,504
7,809
Total provision and OREO valuation
19,920
18,383
35,298
62,004
51,309
Non-interest expense
255,814
212,961
181,403
154,984
137,733
Income before income taxes
187,803
188,575
118,468
56,949
36,909
Income tax expense
66,757
67,866
42,366
19,626
12,522
Net income
121,046
120,709
76,102
37,323
24,387
Preferred stock dividends
7,394
–
–
–
–
Net income available to common shareholders
$ 113,652
$ 120,709
$ 76,102
$ 37,323
$ 24,387
Diluted EPS
$ 2.72
$ 3.01
$ 1.99
$ 1.00
$ .56
Net interest margin
4.22%
4.41%
4.68%
4.28%
3.89%
ROA
1.17%
1.35%
1.12%
.63%
.46%
ROE
12.82%
16.93%
13.39%
7.23%
5.15%
Efficiency
(1)
55.2%
49.8%
54.1%
56.6%
61.0%
(1) Excludes OREO valuation charge
|
 QTD Average Balances, Yields and Rates
9
(in thousands)
Q4 2013
Q3 2013
Q4 2012
Avg. Bal.
Yield Rate
Avg. Bal.
Yield Rate
Avg. Bal.
Yield Rate
Assets
Securities
$ 65,067
4.25%
$ 71,717
4.25%
$103,483
4.55%
Fed funds sold & liquidity investments
158,594
.21%
167,613
.19%
91,503
.27%
Loans held for investment, mortgage finance
2,238,730
3.59%
2,362,118
3.79%
2,658,092
3.96%
Loans held for investment
8,142,569
4.73%
7,731,901
4.72%
6,662,817
4.79%
Total loans, net of reserve
10,297,290
4.52%
10,014,468
4.53%
9,246,997
4.59%
Total earning assets
10,520,951
4.45%
10,253,798
4.46%
9,441,983
4.55%
Total assets
$10,899,266
$10,637,766
$9,869,282
Liabilities and Stockholders’
Equity
Total interest bearing deposits
$ 5,887,252
.26%
$ 5,612,874
.26%
$4,662,116
.28%
Other borrowings
314,018
.20%
539,767
.20%
1,725,129
.19%
Subordinated notes
111,000
6.58%
111,000
6.54%
12,065
6.56%
Long-term debt
113,406
2.21%
113,406
2.23%
113,406
2.33%
Total interest bearing liabilities
6,425,676
.40%
6,377,047
.40%
6,611,651
.40%
Demand deposits
3,289,307
3,124,602
2,356,758
Stockholders’
equity
1,077,822
1,046,477
814,565
Total liabilities and stockholders’
equity
$10,899,266
.24%
$10,637,766
.24%
$9,869,282
.27%
Net interest margin
4.21%
4.21%
4.27% |
 10
YTD Average Balances, Yields and Rates
10
(in thousands)
2013
2012
Avg. Bal.
Yield Rate
Avg. Bal.
Yield Rate
Assets
Securities
$ 77,178
4.39%
$117,375
4.46%
Fed funds sold & liquidity investments
144,050
.21%
72,689
.30%
Loans held for investment, mortgage finance
2,342,149
3.75%
2,298,651
4.06%
Loans held for investment
7,471,676
4.73%
6,148,860
4.88%
Total loans, net of reserve
9,735,543
4.53%
8,375,424
4.70%
Total earning assets
9,956,771
4.47%
8,565,488
4.66%
Total assets
$10,348,404
$8,965,960
Liabilities and Stockholders’
Equity
Total interest bearing deposits
$ 5,407,810
.26%
$4,459,836
.31%
Other borrowings
653,318
.19%
1,585,723
.20%
Subordinated notes
111,000
6.60%
30,934
6.58%
Long-term debt
113,406
2.24%
113,406
2.43%
Total interest bearing liabilities
6,285,534
.40%
6,189,899
.35%
Demand deposits
2,967,063
1,984,171
Stockholders’
equity
1,001,215
713,190
Total liabilities and stockholders’
equity
$10,348,404
.24%
$8,965,960
.24%
Net interest margin
4.22%
4.41% |
 Financial Summary
11
(in thousands)
QTD Averages
Q4 2013
Q3 2013
Q4 2012
Q4/Q3 %
Change
YOY %
Change
Total assets
$10,899,266
$10,637,766
$9,869,282
2%
10%
Loans held for investment
8,142,569
7,731,901
6,662,817
5%
22%
Loans held for investment, mortgage finance
2,238,730
2,362,118
2,658,092
(5)%
(16)%
Total loans
10,381,299
10,094,019
9,320,909
3%
11%
Securities
65,067
71,717
103,483
(9)%
(37)%
Demand deposits
3,289,307
3,124,602
2,356,758
5%
40%
Total deposits
9,176,559
8,737,476
7,018,874
5%
31%
Stockholders’
equity
1,077,822
1,046,477
814,565
3%
32% |
 12
Financial Summary
12
(in thousands)
YTD Averages
2013
2012
YOY % Change
Total assets
$10,348,404
$8,965,961
15%
Loans held for investment
7,471,676
6,148,860
22%
Loans held for investment, mortgage finance
2,342,149
2,298,651
2%
Total loans
9,813,825
8,447,511
16%
Securities
77,178
117,375
(34)%
Demand deposits
2,967,063
1,984,171
50%
Total deposits
8,374,873
6,444,007
30%
Stockholders’
equity
1,001,215
713,190
40% |
 Financial Summary
13
(in thousands)
Period End
Q4 2013
Q3 2013
Q4 2012
Q4/Q3 %
Change
YOY %
Change
Total assets
$11,714,397
$10,797,448
$10,540,542
8%
11%
Loans held for investment
8,486,309
8,051,328
6,785,535
5%
25%
Loans held for investment, mortgage finance
2,784,265
2,262,085
3,175,272
23%
(12)%
Total loans
11,270,574
10,313,413
9,960,807
9%
13%
Securities
63,214
67,815
100,195
(7)%
(37)%
Demand deposits
3,347,567
3,242,060
2,535,375
3%
32%
Total deposits
9,257,379
8,957,081
7,440,804
3%
24%
Stockholders’
equity
1,096,350
1,066,629
836,242
3%
31% |
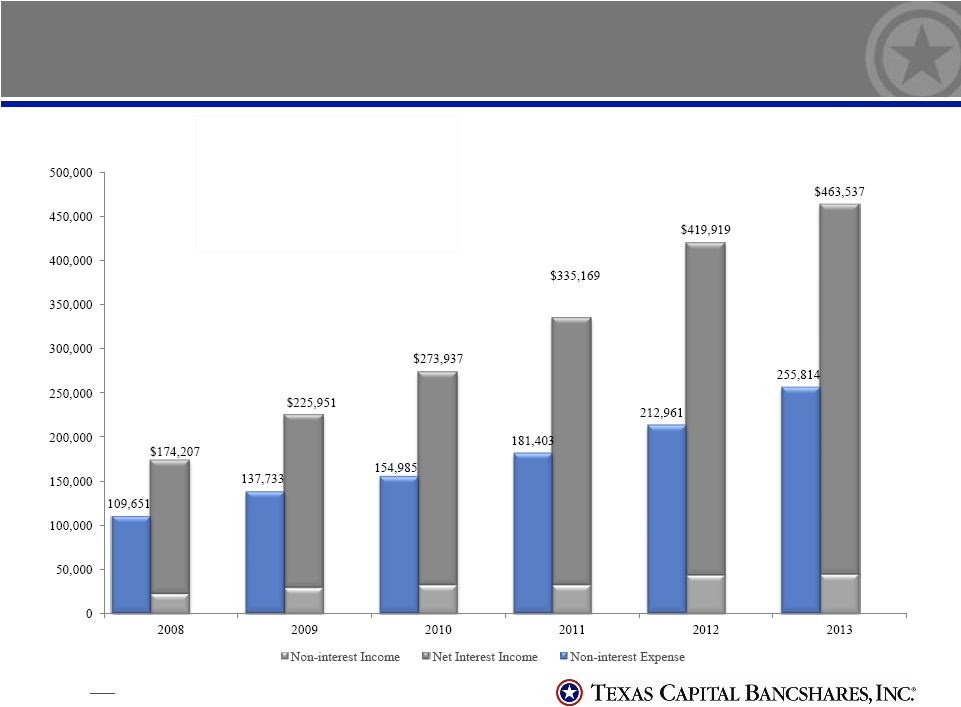 14
Revenue and Income Growth
Operating Revenue CAGR: 22%
Net Interest
Income CAGR:
23%
Non-interest Income CAGR: 14%
Non-interest Expense CAGR: 18%
Net Income CAGR: 37%
($ in thousands)
Note:
Excludes OREO valuation charge for YTD 2013, 2012, 2011 and
2010. |
 15
EPS Growth
5 Year EPS CAGR: 27%
^Excludes $.15 effect of preferred TARP dividend during 2009. Reported
EPS was $0.56. |
 16
Demand Deposit CAGR: 42%
Total Deposit CAGR: 23%
Loans Held for Investment* CAGR: 16%
Deposit and Loan Growth
($ in millions)
* Excludes MF loans. |
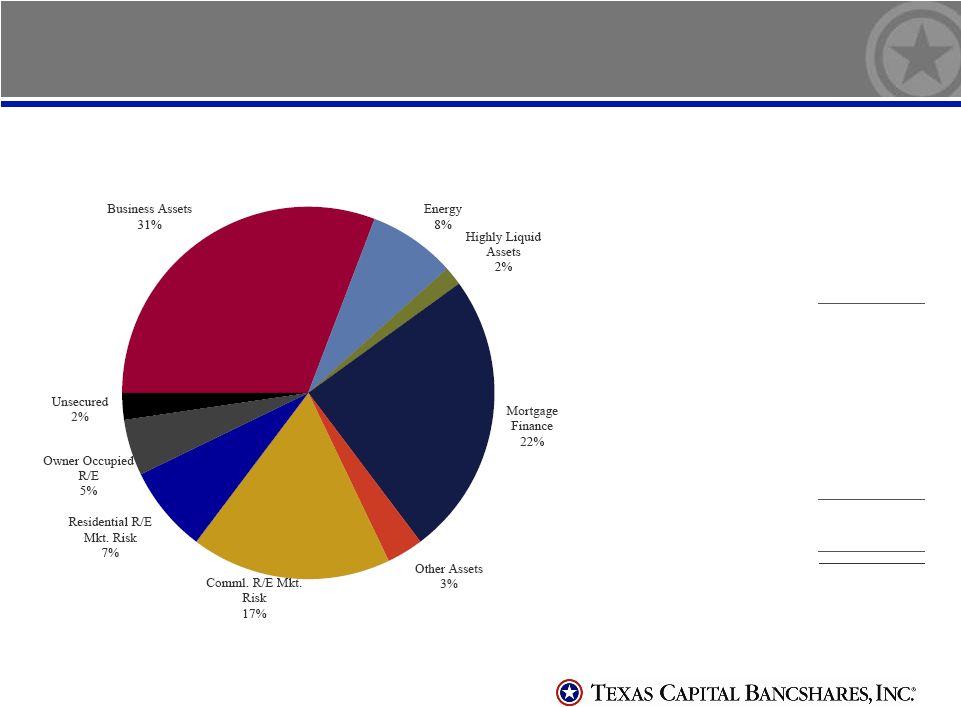 Loan Portfolio Statistics
17
Non-accrual loans
Commercial
$ 12,896
Construction
705
Real estate
18,670
Consumer
54
Equipment leases
50
Total non-accrual loans
32,375
Non-accrual loans as % of
loans excluding MF
.38%
Non-accrual loans as % of
total loans
.29%
OREO
5,110
Total Non-accruals +
OREO
37,485
Non-accrual loans + OREO
as % of loans excluding MF
+ OREO
.44%
Total Loans $11,270,574
All numbers in thousands.
Loan Collateral by Type 12/31/13 |
 Credit Quality
Improved Credit Trends
–
Total credit cost of $5.4 million for Q4-2013, compared to $ 5.0
million in Q3-2013 and $5.5 million in Q4-2012
•
Provision of $5.0 million for Q4-2013 compared to $5.0 million for
Q3-2013 and $4.5 million in Q4-2012
•
NCOs $1.3 million (6 bps) in Q4-2013 compared to 0 bps in
Q3-2013 and 21 bps in Q4- 2012; NCO ratio of 7 bps for
YTD •
OREO valuation charge of $466,000 in Q4-2013 compared to none in
Q3-2013 and $955,000 in Q4-2012
–
NPA ratio continues to decline
•
Reduction of $11.1 million (23%) from Q3-2013 and $34.4 million
(48%) from Q4-2012 •
NPA ratio of .44% compared to .60% in Q3-2013 and 1.06% in
Q4-2012 •
NPLs at $32.4 million, down $3.4 million from Q3-2013 and down
$23.5 million from Q4-2012
•
NPL ratio at .29% of total loans and .38% of LHI excluding MF
loans •
OREO reduction of $7.7 (60%) from Q3-2013 and $10.9 million (68%)
from Q4-2012 18 |
 19
Credit Quality
Net Charge-offs / Average Loans*
* Excludes MF loans.
Combined reserve /
Loans
*
1.09%
1.15%
1.31%
1.56%
1.59%
Non-accrual loans +
OREO to loans
*
+
OREO
.44%
1.06%
1.58%
3.25%
2.74%
Combined reserve to
non-accruals
2.7x
1.3x
1.3x
.6x
.7x |
 Closing Comments
•
Strong core
earnings
power,
profitability
and
growth
to
continue
in
2014
•
Credit continues positive trend
•
Strong LHI pipeline and new commitments present opportunity for growth
potential
•
Producers in place for 2014 growth
•
Building more liquidity in 2014 which will impact NIM
•
Mortgage finance average balances to be down in 2014 but outperform
the industry
•
Improving capital position with capital raise to support growth
20 |
 Q&A
21 |