Attached files
| file | filename |
|---|---|
| 8-K - 8-K - Celanese Corp | q420138-kdoc.htm |
| EX-99.1 - EX 99.1 - EARNINGS RELEASE - Celanese Corp | q420138-kex991.htm |
| EX-99.3 - EX 99.3 - PREPARED REMARKS - Celanese Corp | q420138-kex993.htm |

Celanese Q4 2013 Earnings Thursday, January 23, 2014 Conference Call / Webcast Friday, January 24, 2014 10:00 a.m. ET © Celanese Mark Rohr, Chairman and Chief Executive Officer Steven Sterin, Senior Vice President and Chief Financial Officer Exhibit 99.2 © Celanese Celanese Corporation 1

This presentation, and public statements made in connection with this presentation, may contain “forward-looking statements,” which include information concerning the company's plans, objectives, goals, strategies, future net sales or performance, capital expenditures, financing needs and other information that are not historical facts. All forward-looking statements are based upon current expectations and beliefs and various assumptions. There can be no assurance that the company will realize these expectations or that these beliefs will prove correct. There are a number of risks and uncertainties that could cause actual results to differ materially from the results expressed or implied in such forward- looking statements. These risks and uncertainties include, among other things: changes in general economic, business, political and regulatory conditions in the countries or regions in which we operate; the length and depth of product and industry business cycles, particularly in the automotive, electrical, textiles, electronics and construction industries; changes in the price and availability of raw materials, particularly changes in the demand for, supply of, and market prices of ethylene, methanol, natural gas, wood pulp and fuel oil and the prices for electricity and other energy sources; the ability to pass increases in raw material prices on to customers or otherwise improve margins through price increases; the ability to maintain plant utilization rates and to implement planned capacity additions and expansions; the ability to reduce or maintain their current levels of production costs and to improve productivity by implementing technological improvements to existing plants; increased price competition and the introduction of competing products by other companies; market acceptance of our technology; the ability to obtain governmental approvals and to construct facilities on terms and schedules acceptable to the company; changes in the degree of intellectual property and other legal protection afforded to our products or technologies, or the theft of such intellectual property; compliance and other costs and potential disruption or interruption of production or operations due to accidents, interruptions in sources of raw materials, cyber security incidents, terrorism or political unrest or other unforeseen events or delays in construction or operation of facilities, including as a result of geopolitical conditions, the occurrence of acts of war or terrorist incidents or as a result of weather or natural disasters; potential liability for remedial actions and increased costs under existing or future environmental regulations, including those relating to climate change; potential liability resulting from pending or future litigation, or from changes in the laws, regulations or policies of governments or other governmental activities in the countries in which we operate; changes in currency exchange rates and interest rates; our level of indebtedness, which could diminish our ability to raise additional capital to fund operations or limit our ability to react to changes in the economy or the chemicals industry; and various other factors discussed from time to time in the company's periodic reports with the Securities and Exchange Commission. Any forward-looking statement speaks only as of the date on which it is made, and the company undertakes no obligation to update any forward-looking statements to reflect events or circumstances after the date on which it is made or to reflect the occurrence of anticipated or unanticipated events or circumstances. Results Unaudited The results in this presentation, together with the adjustments made to present the results on a comparable basis, have not been audited and are based on internal financial data furnished to management. Quarterly results should not be taken as an indication of the results of operations to be reported for any subsequent period or for the full fiscal year. Non-GAAP Financial Measures This presentation, and statements made in connection with this presentation, contain references to non-GAAP financial measures. For more information on the non-GAAP financial measures used by the company and referenced in this presentation, including definitions and reconciliations with comparable GAAP financial measures, as well as prior period information, please refer to Investor Relations/Financial Information/Non-GAAP Financial Measures on our website, www.celanese.com. © Celanese Celanese Corporation 2 Forward-Looking Statements

Mark Rohr Chairman and Chief Executive Officer © Celanese Celanese Corporation 3

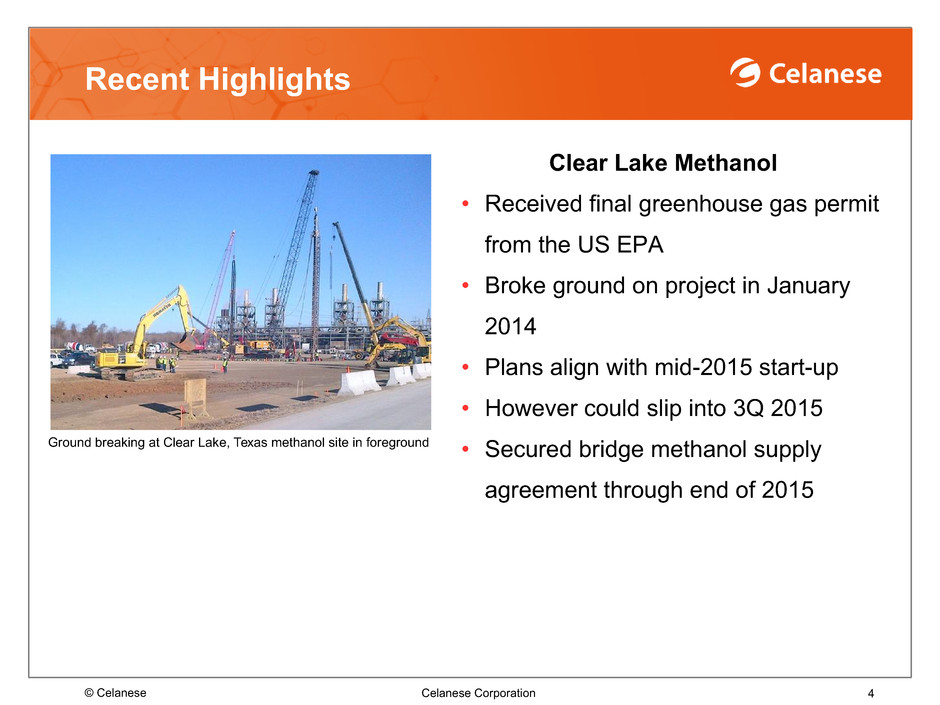
Recent Highlights © Celanese Celanese Corporation 4 Clear Lake Methanol • Received final greenhouse gas permit from the US EPA • Broke ground on project in January 2014 • Plans align with mid-2015 start-up • However could slip into 3Q 2015 • Secured bridge methanol supply agreement through end of 2015 Ground breaking at Clear Lake, Texas methanol site in foreground

YoY* QoQ* 10% 8% 6% 4% 2% 0% -2% -4% -6% Volume Price Currency Other Total Net sales (in millions) Q4 Performance $1,800 $1,200 $600 $0 30% 20% 10% 0% Q4 2012 Q3 2013 Q4 2013 12.5% 17.1% 15.1% $1,501 $1,636 $1,616 Celanese Corporation Q4 2013 Highlights Factors Affecting Net Sales Changes © Celanese Celanese Corporation • Record fourth quarter adjusted EPS • Deployed $62 million to repurchase ~1.1 million shares • Operating cash flow of $154 million and adjusted free cash flow of $37 million *QoQ represents Q4 2013 as compared to Q3 2013; YoY represents Q4 2013 compared to Q4 2012. **Adjusted for mark-to-market accounting change. For additional details and adjusted historical data, please refer to the company’s current report on Form 8-K furnished to the SEC on April 2, 2013 available at www.celanese.com under the Investor Relations section. Adjusted EPS Q4 2013 $1.04 Q3 2013 $1.20 Q4 2012** $0.74 Total segment income margin 5

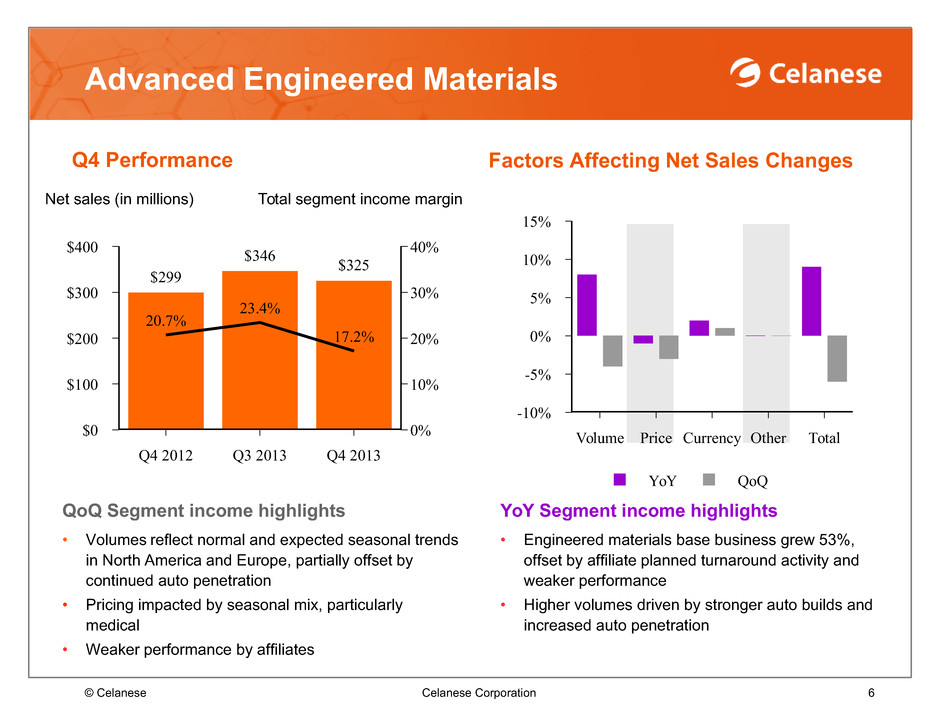
YoY Segment income highlights • Engineered materials base business grew 53%, offset by affiliate planned turnaround activity and weaker performance • Higher volumes driven by stronger auto builds and increased auto penetration QoQ Segment income highlights • Volumes reflect normal and expected seasonal trends in North America and Europe, partially offset by continued auto penetration • Pricing impacted by seasonal mix, particularly medical • Weaker performance by affiliates Net sales (in millions) Advanced Engineered Materials Q4 Performance Factors Affecting Net Sales Changes © Celanese Celanese Corporation 6 $400 $300 $200 $100 $0 40% 30% 20% 10% 0% Q4 2012 Q3 2013 Q4 2013 20.7% 23.4% 17.2% $299 $346 $325 Total segment income margin YoY QoQ 15% 10% 5% 0% -5% -10% Volume Price Currency Other Total

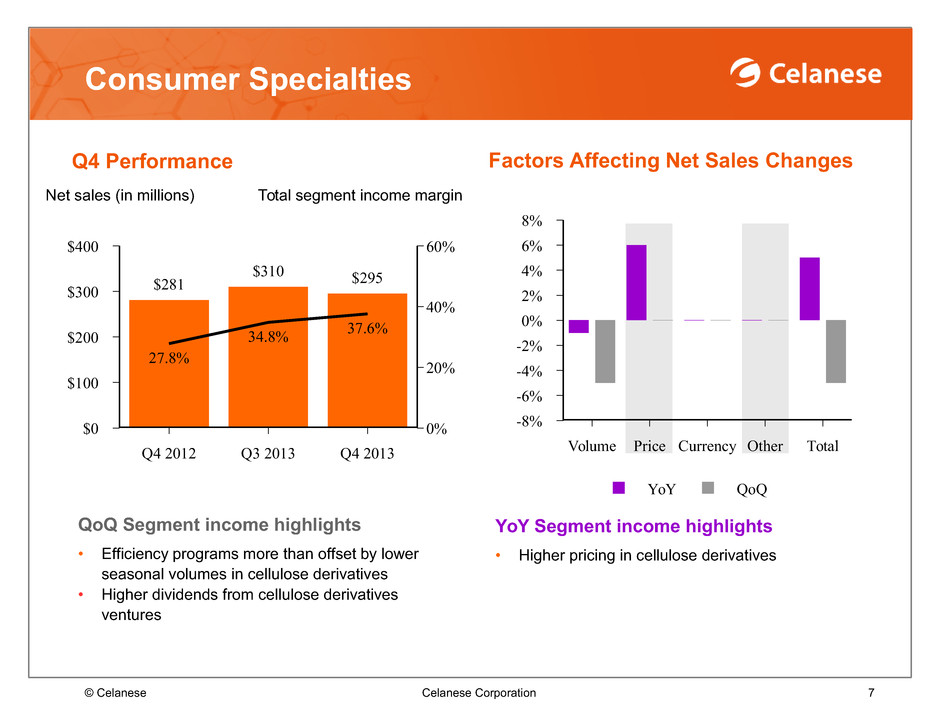
Consumer Specialties Q4 Performance Factors Affecting Net Sales Changes © Celanese Celanese Corporation YoY Segment income highlights • Higher pricing in cellulose derivatives QoQ Segment income highlights • Efficiency programs more than offset by lower seasonal volumes in cellulose derivatives • Higher dividends from cellulose derivatives ventures Net sales (in millions) Total segment income margin $400 $300 $200 $100 $0 60% 40% 20% 0% Q4 2012 Q3 2013 Q4 2013 27.8% 34.8% 37.6% $281 $310 $295 YoY QoQ 8% 6% 4% 2% 0% -2% -4% -6% -8% Volume Price Currency Other Total 7

Industrial Specialties Q4 Performance Factors Affecting Net Sales Changes © Celanese Celanese Corporation 8 QoQ Segment income highlights • Volumes reflect normal seasonality in emulsion polymers in Europe and Asia, partially offset by higher EVA polymers volumes in North America Net sales (in millions) Total segment income margin $400 $300 $200 $100 $0 16% 12% 8% 4% 0% Q4 2012 Q3 2013 Q4 2013 2.4% 8.4% 4.8% $251 $299 $273 YoY QoQ 15% 10% 5% 0% -5% -10% -15% Volume Price Currency Other Total YoY Segment income highlights • Higher emulsion volumes on broad adoption of innovative VAE applications as well as EVA expansion in auto application • Pricing driven by lower raw material costs in emulsion polymers and EVA polymers

Acetyl Intermediates Q4 Performance Factors Affecting Net Sales Changes © Celanese Celanese Corporation 9 YoY Segment income highlights • Higher volumes from initial industrial ethanol sales • Lower pricing in VAM, partially offset by higher acid pricing QoQ Segment income highlights • Higher VAM volumes due to timing • Higher pricing mainly in acetic acid primarily due to higher methanol costs Net sales (in millions) Total segment income margin $900 $600 $300 $0 12% 8% 4% 0% Q4 2012 Q3 2013 Q4 2013 8.9% 9.1% 10.1% $773 $795 $829 YoY QoQ 10% 8% 6% 4% 2% 0% -2% -4% Volume Price Currency Other Total

Outlook* for 2014 © Celanese Celanese Corporation 10 Potential contribution (in millions) Celanese-specific initiatives Improving plant operations ~$45 Creating Upstream & downstream efficiencies ~$25 Translating innovation ~$30 • $20-30 million savings from closure of two units in Europe • Target $15-20 million from unit operations • Celanese-specific opportunities implemented • Converted to natural gas boilers at Ocotlan • Pursue N+1 opportunities ◦ New Hostaform® product lines allow for designing unique structural applications particularly in autos ◦ S-grade POM series provides design freedom in applications like power tools, safety systems etc. *As of January 2014 Celanese-specific initiatives along with some improvement in base business should result in earnings growth consistent with 2013

Steven Sterin Senior Vice President and Chief Financial Officer © Celanese Celanese Corporation 11

Fourth quarter accounting items, excluded from adjusted EPS Pension • $106 million net gain related to mark-to-market • $71 million net gain associated with settlements and curtailments of certain defined pension plans and other postretirement benefit plan obligations Sale of Kelsterbach site • $742 million gain on final disposition of site Asset impairment • $81 million primarily related to the Singapore acetic acid unit and closure of two sites in Europe © Celanese Celanese Corporation 12

Adjusted Free Cash Flow Strong Cash Flow Generation © Celanese Celanese Corporation 13 Continue to focus on a balanced capital deployment strategy (in millions) Q4 2013 FY 2013 Cash flow from operations $154 $762 Adjusted free cash flow $37 $372 Adjusted FCF as % net sales 2.3% 5.7% • 2013 record operating cash flow • Q4 2013 operating cash flow primarily driven by strong earnings performance, partially offset by cash taxes and pension obligation settlement actions • Continue to expect capex of $450-500 million for 2014 primarily driven by Clear Lake methanol construction and conversion to natural gas boilers at Narrows

~2 X increas e Dividend* Payout and Share Repurchases Dividend Share Repurchases $300 $250 $200 $150 $100 $50 $0 2009 2010 2011 2012 2013 Return of Cash to Shareholders Dividend • 93% increase in cash dividends paid in 2013 compared to 2012 • Dividend yield in-line with peers Share Repurchases • Deployed $164 million to repurchase ~3.2 million shares in 2013 at an average price of $51.38 • Remaining share repurchase authorization of $228 million • Will continue to repurchase opportunistically Over $1 billion returned to shareholders since 2007 © Celanese Celanese Corporation 14 *Based on dividends paid on common stock (in millions)
